Sincere Navigation Corporation · TWSE:2605
Sincere Navigation — 1Q 2017 Investor Summit by Cathay Securities
16 slides from Sincere Navigation's conference presentation, Mar 16, 2017
Slide 1: 2017 Bulk Shipping Market
2017 Bulk Shipping Market Sincere Navigation Corp. (2605) Speaker:Lee Yih-Ren 1
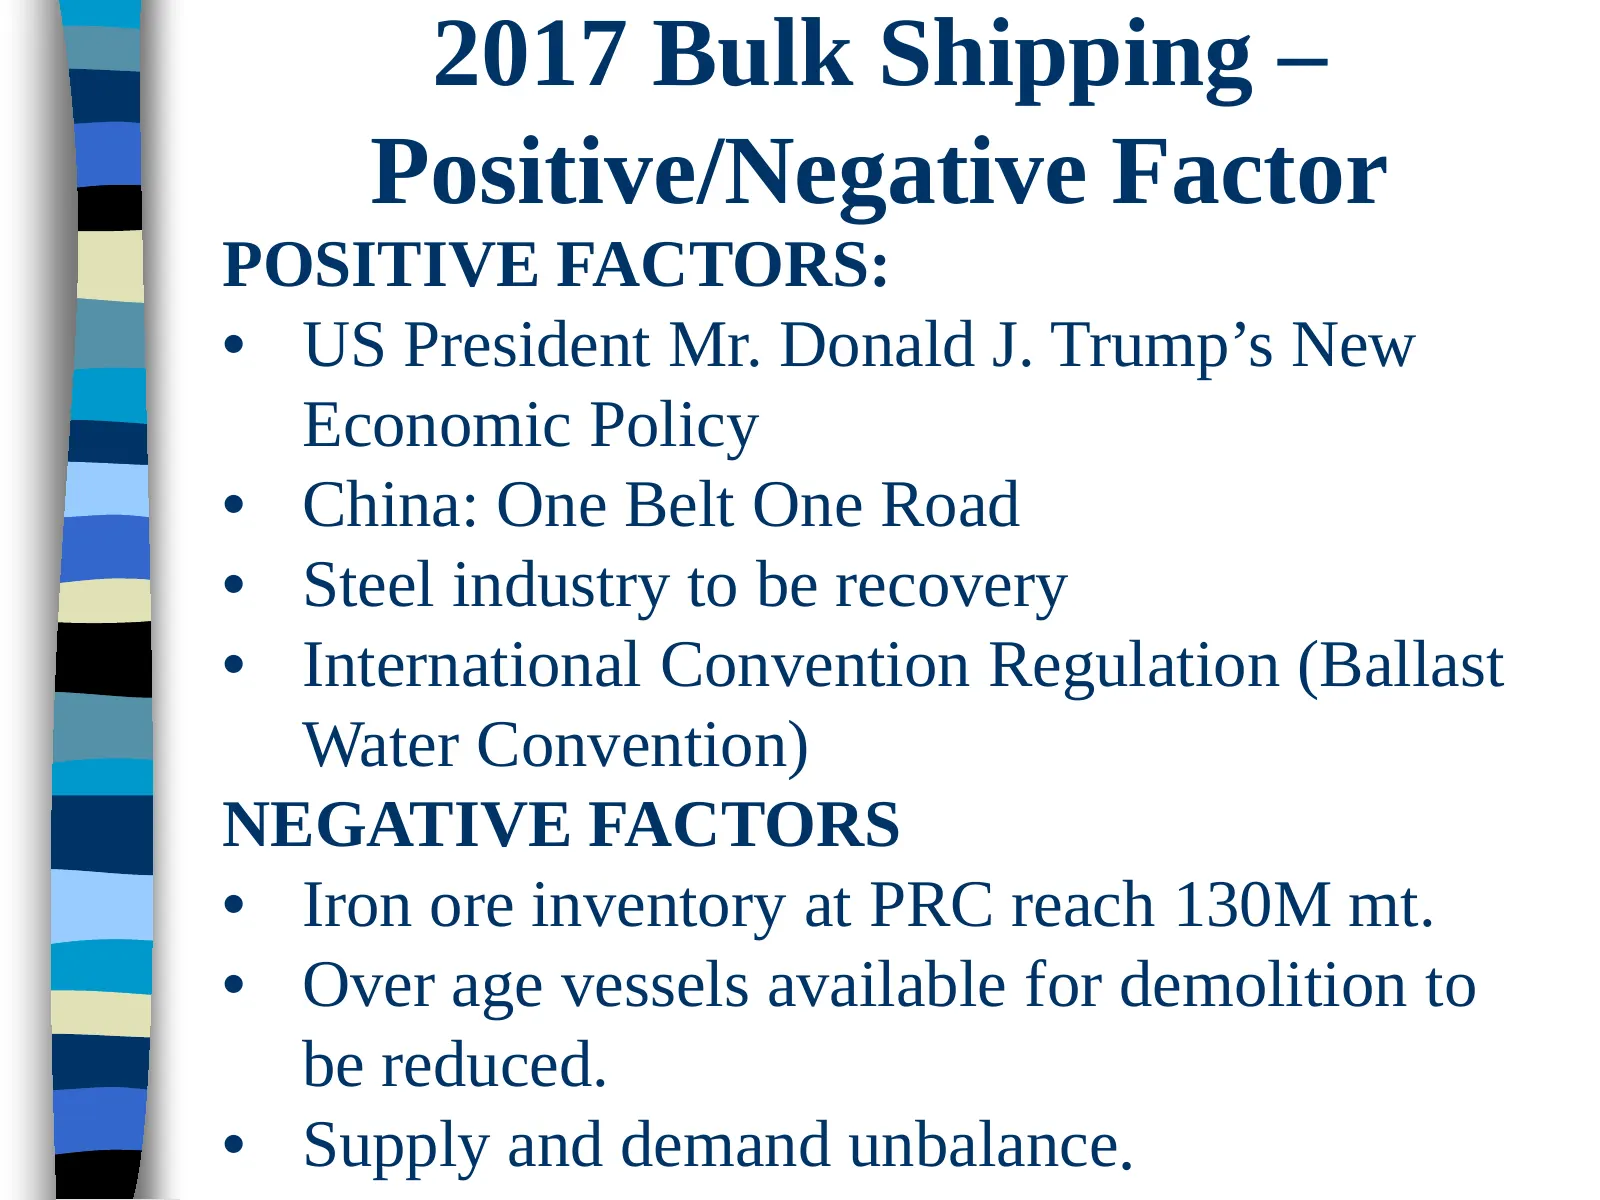
Slide 2: 2017 Bulk Shipping – Positive/Negative Factor
2017 Bulk Shipping – Positive/Negative Factor POSITIVE FACTORS: • US President Mr. Donald J. Trump’s New Economic Policy • China: One Belt One Road • Steel industry to be recovery • International Convention Regulation (Ballast Water Convention) NEGATIVE FACTORS • Iron ore inventory at PRC reach 130M
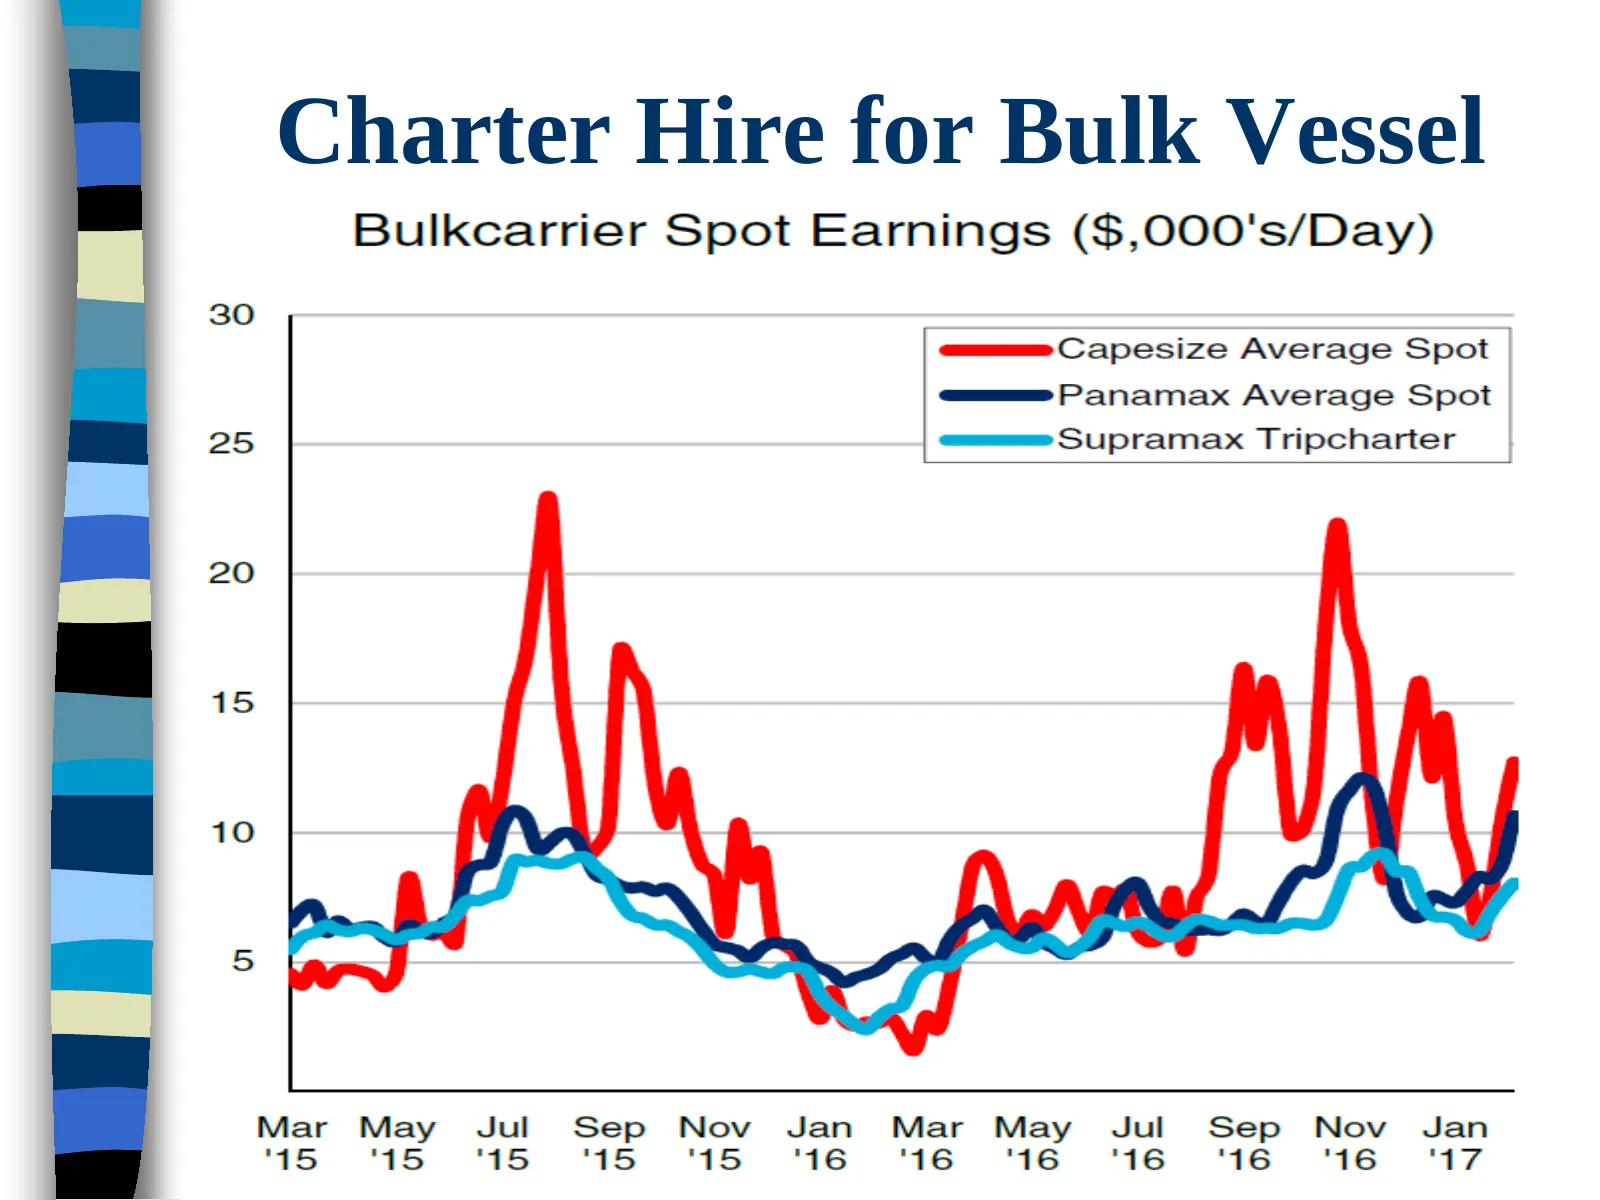
Slide 3: Charter Hire for Bulk Vessel
Charter Hire for Bulk Vessel Bulkcarrier Spot Earnings ($,000's/Day) Mar May Jul Sep Nov Jan Mar May Jul Sep Nov Jan 45 ‘15 ‘15 ‘15 ‘15 ‘16 ‘16 ‘16 ‘16 ‘16 ‘16 ‘17 30 ; eum Capesize Average Spot eee Panamax Average Spot 25 ewwwee Supramax Tripcharter 20 15 10 a
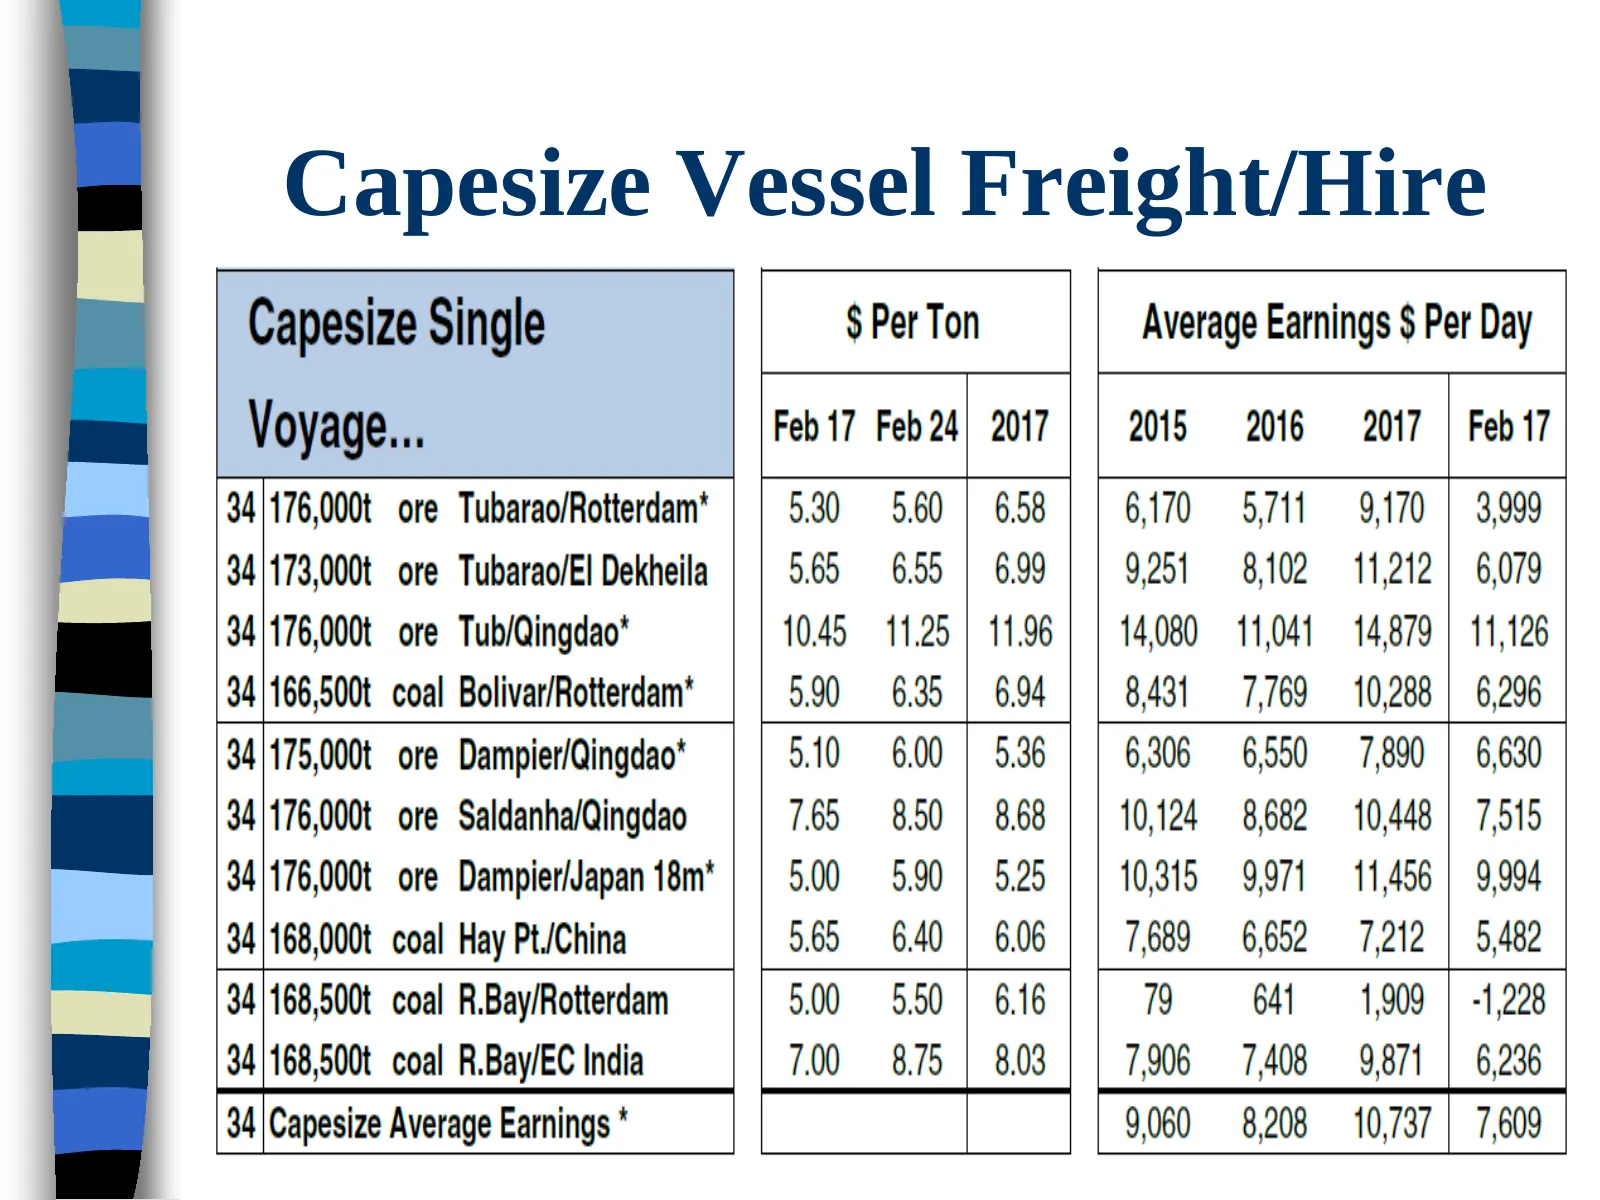
Slide 4: Capesize Vessel Freight/Hire
Capesize Vessel Freight/Hire
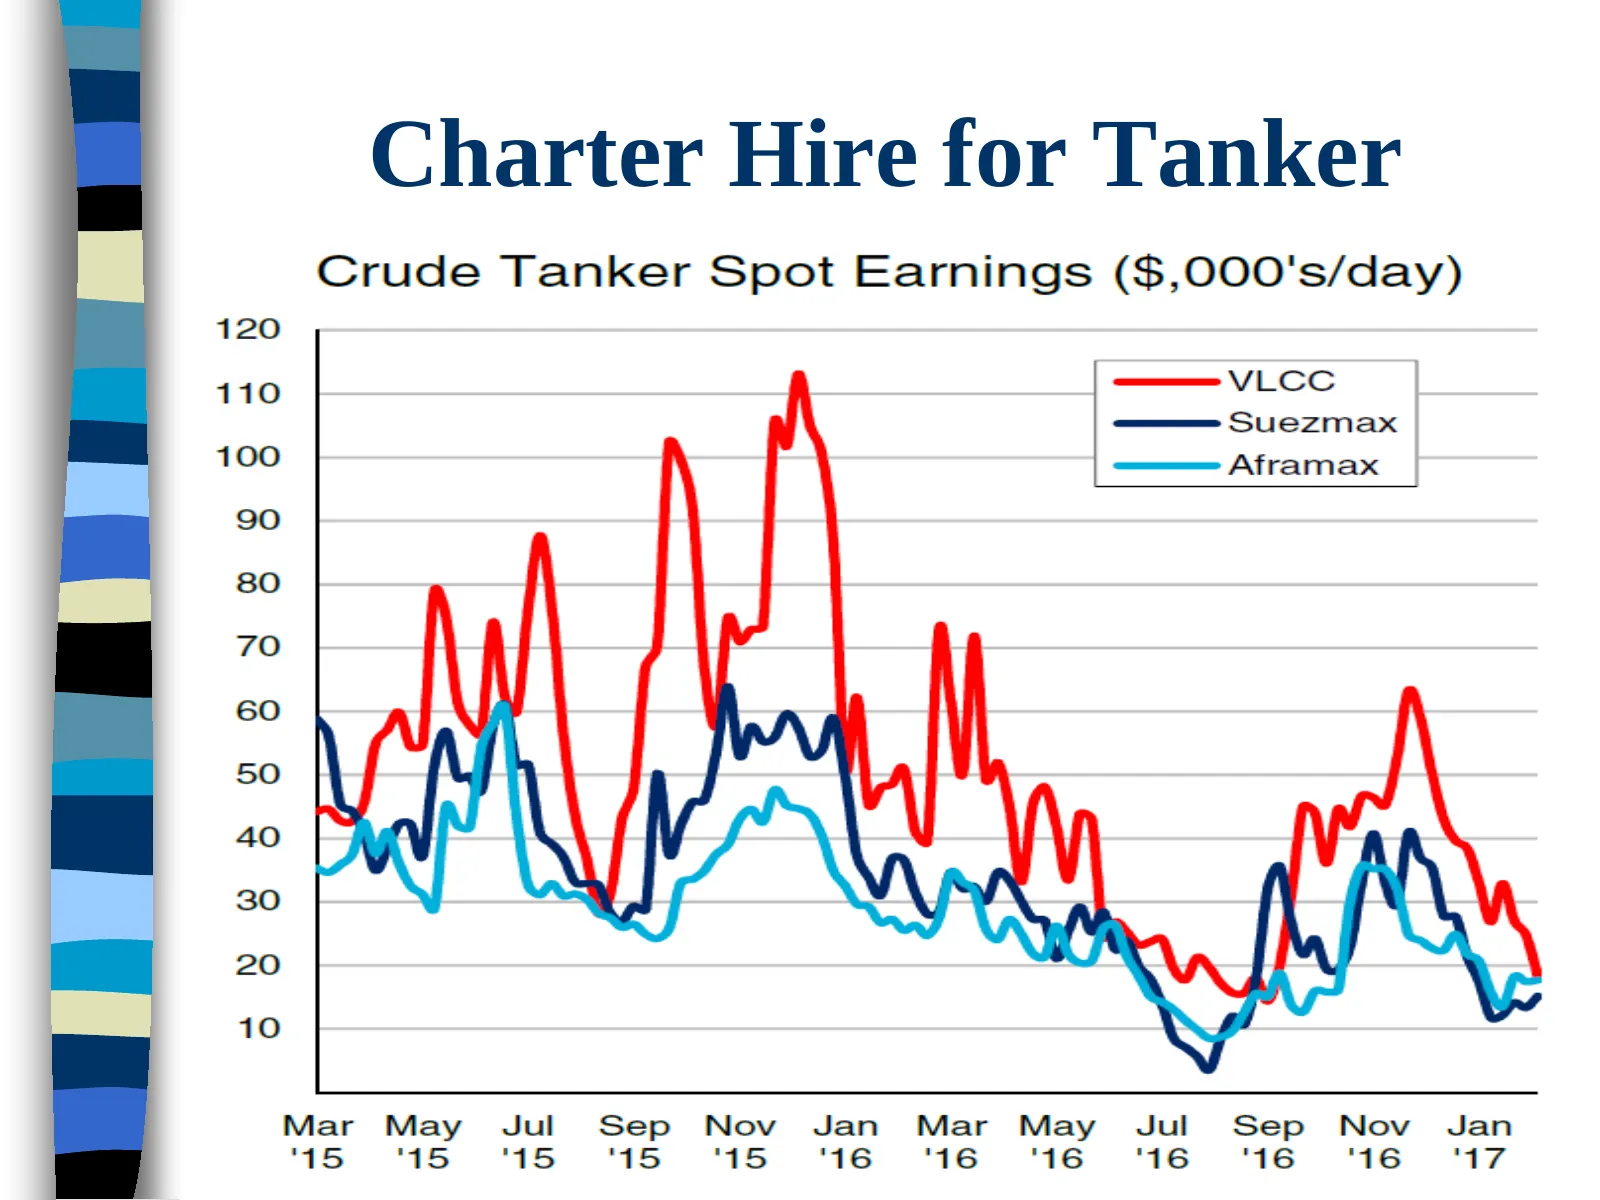
Slide 5: Charter Hire for Tanker
Charter Hire for Tanker Crude Tanker Spot Earnings ($,000's/day) VLCC Suezmax Aframax Mar May Jul Sep Nov Jan Mar May Jul Sep Nov Jan 56 ‘15 ‘15 ‘15 ‘15 ‘16 ‘16 ‘16 ‘16 ‘16 ‘16 ‘17
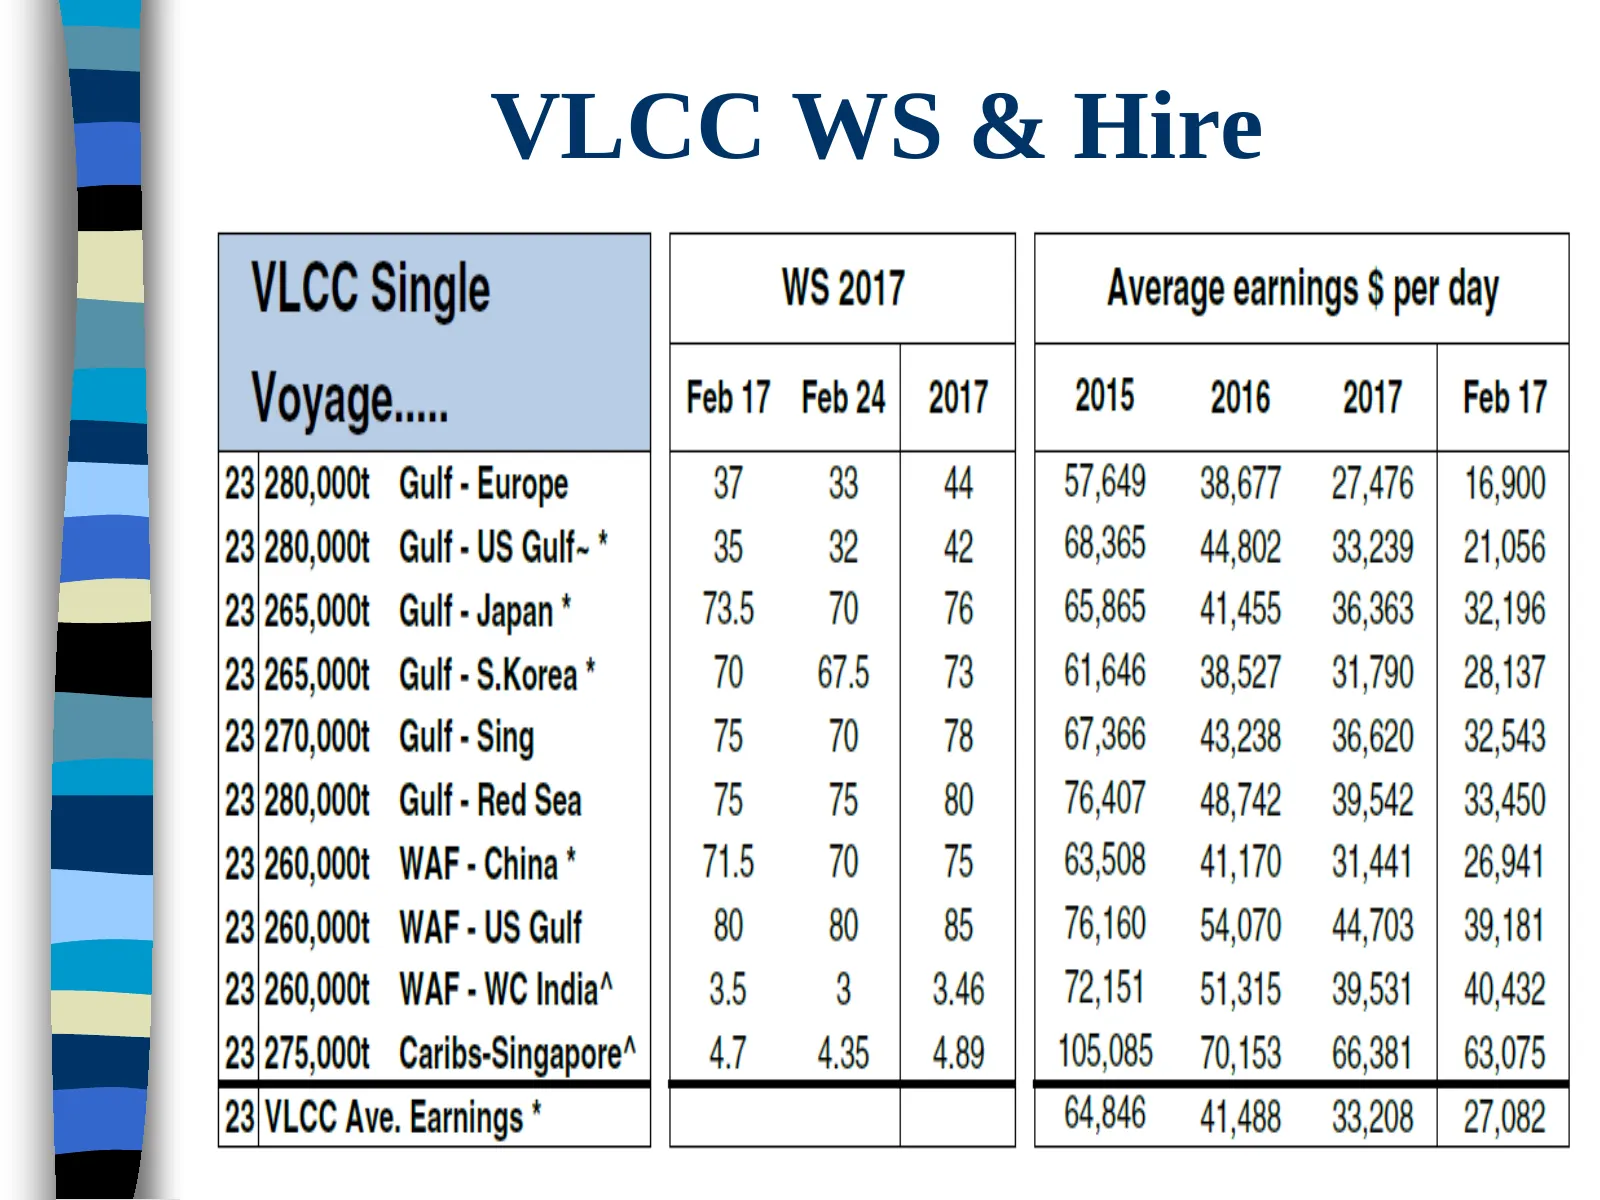
Slide 6: VLCC WS & Hire
VLCC WS & Hire VLCC Single WS 2017 Average earnings $ per day Voyage... Feb17 Feb 24) 2017 2015 = 2016 »=— 2017 _| Feb 17 23)280,000t Gulf - Europe 37 33 44 57,649 38,677 27,476 | 16,900 23/280,000t Gulf- US Gulf~ * % 8682 | 42 68,365 44,802 33,239 | 21,056 23/265,000t Gulf - Japan * B35 710 | 76 65
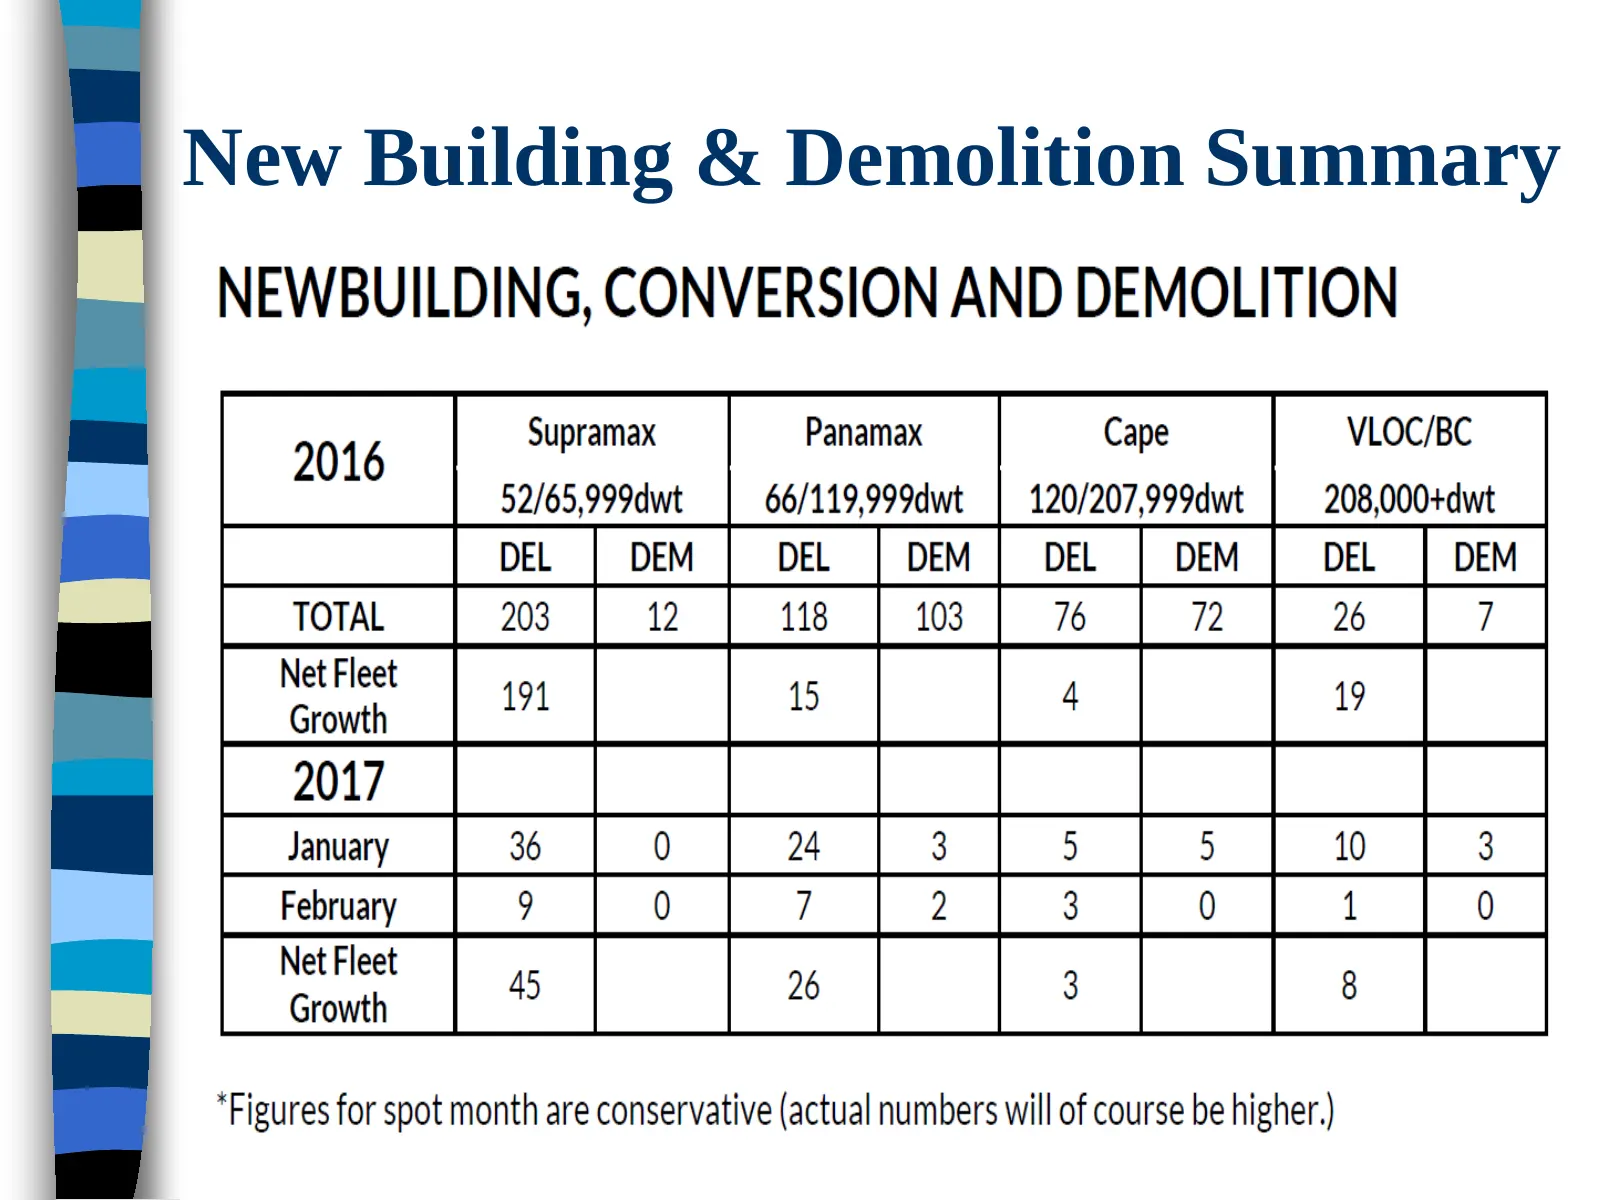
Slide 7: New Building & Demolition Summary
New Building & Demolition Summary 2017/3/15 Arthur Hsieh 7
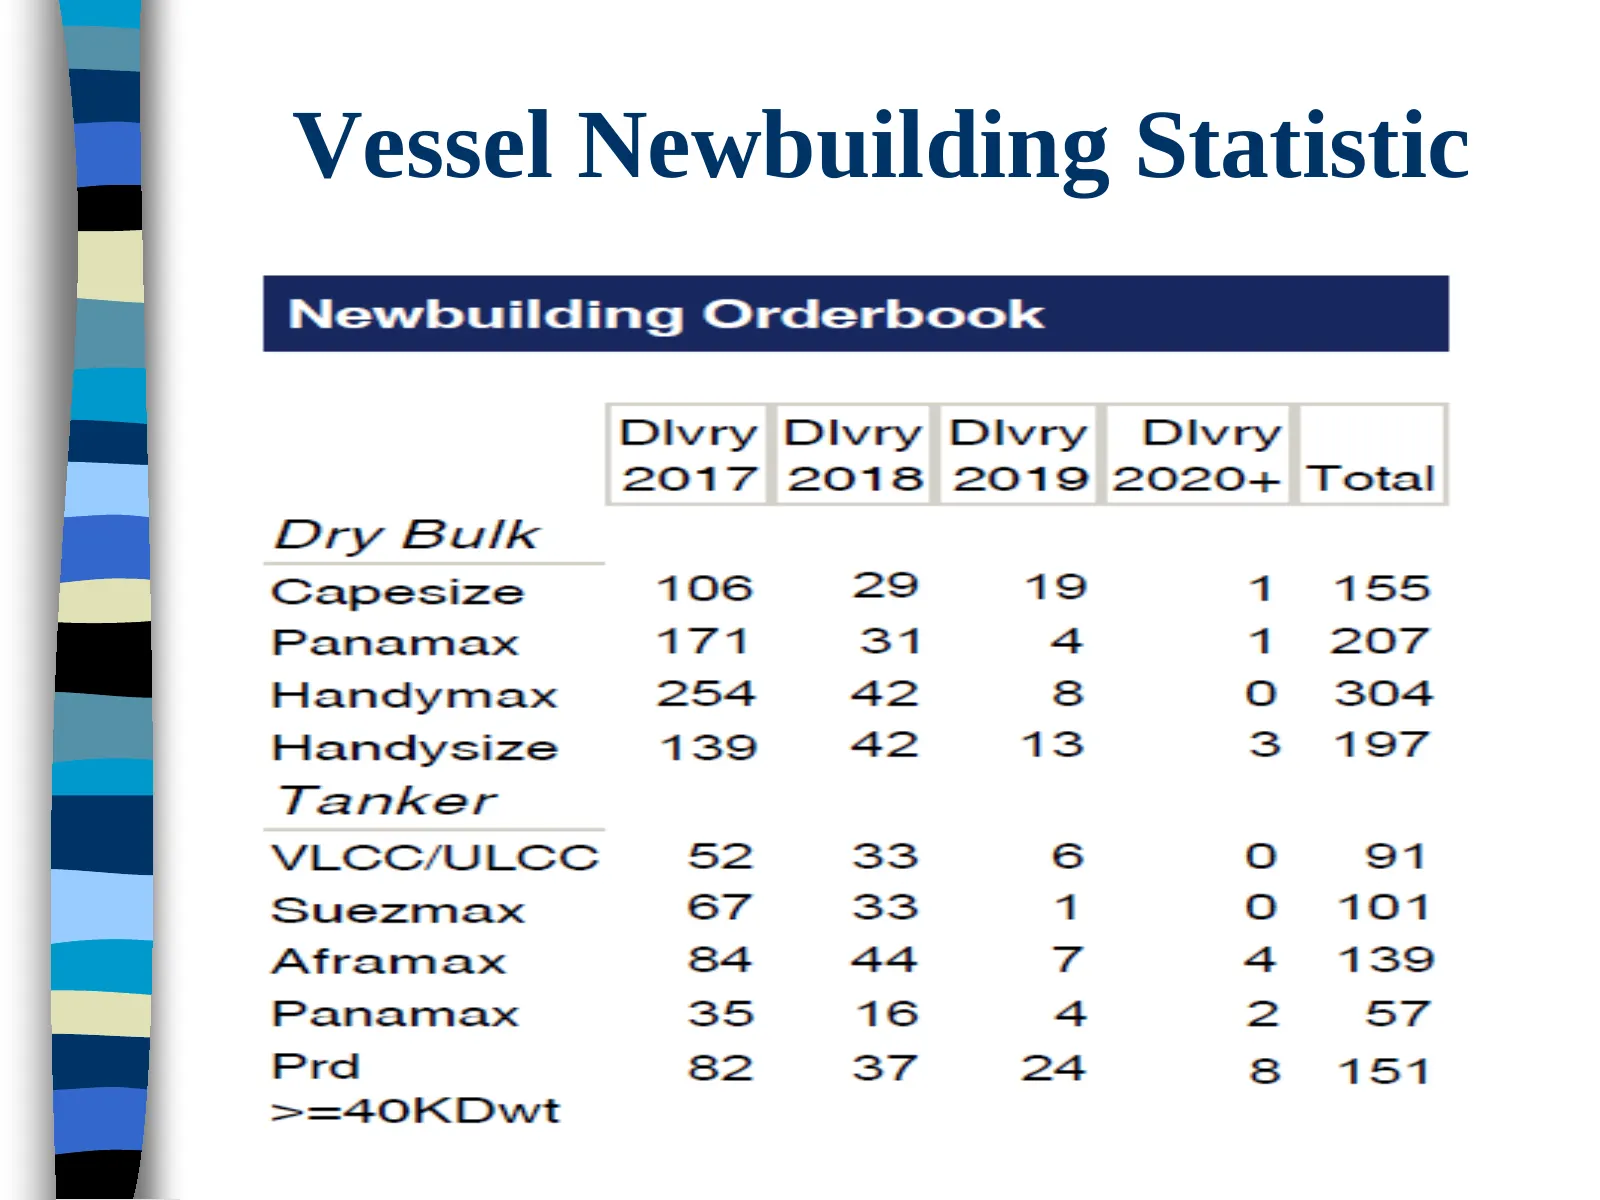
Slide 8: Vessel Newbuilding Statistic
Vessel Newbuilding Statistic
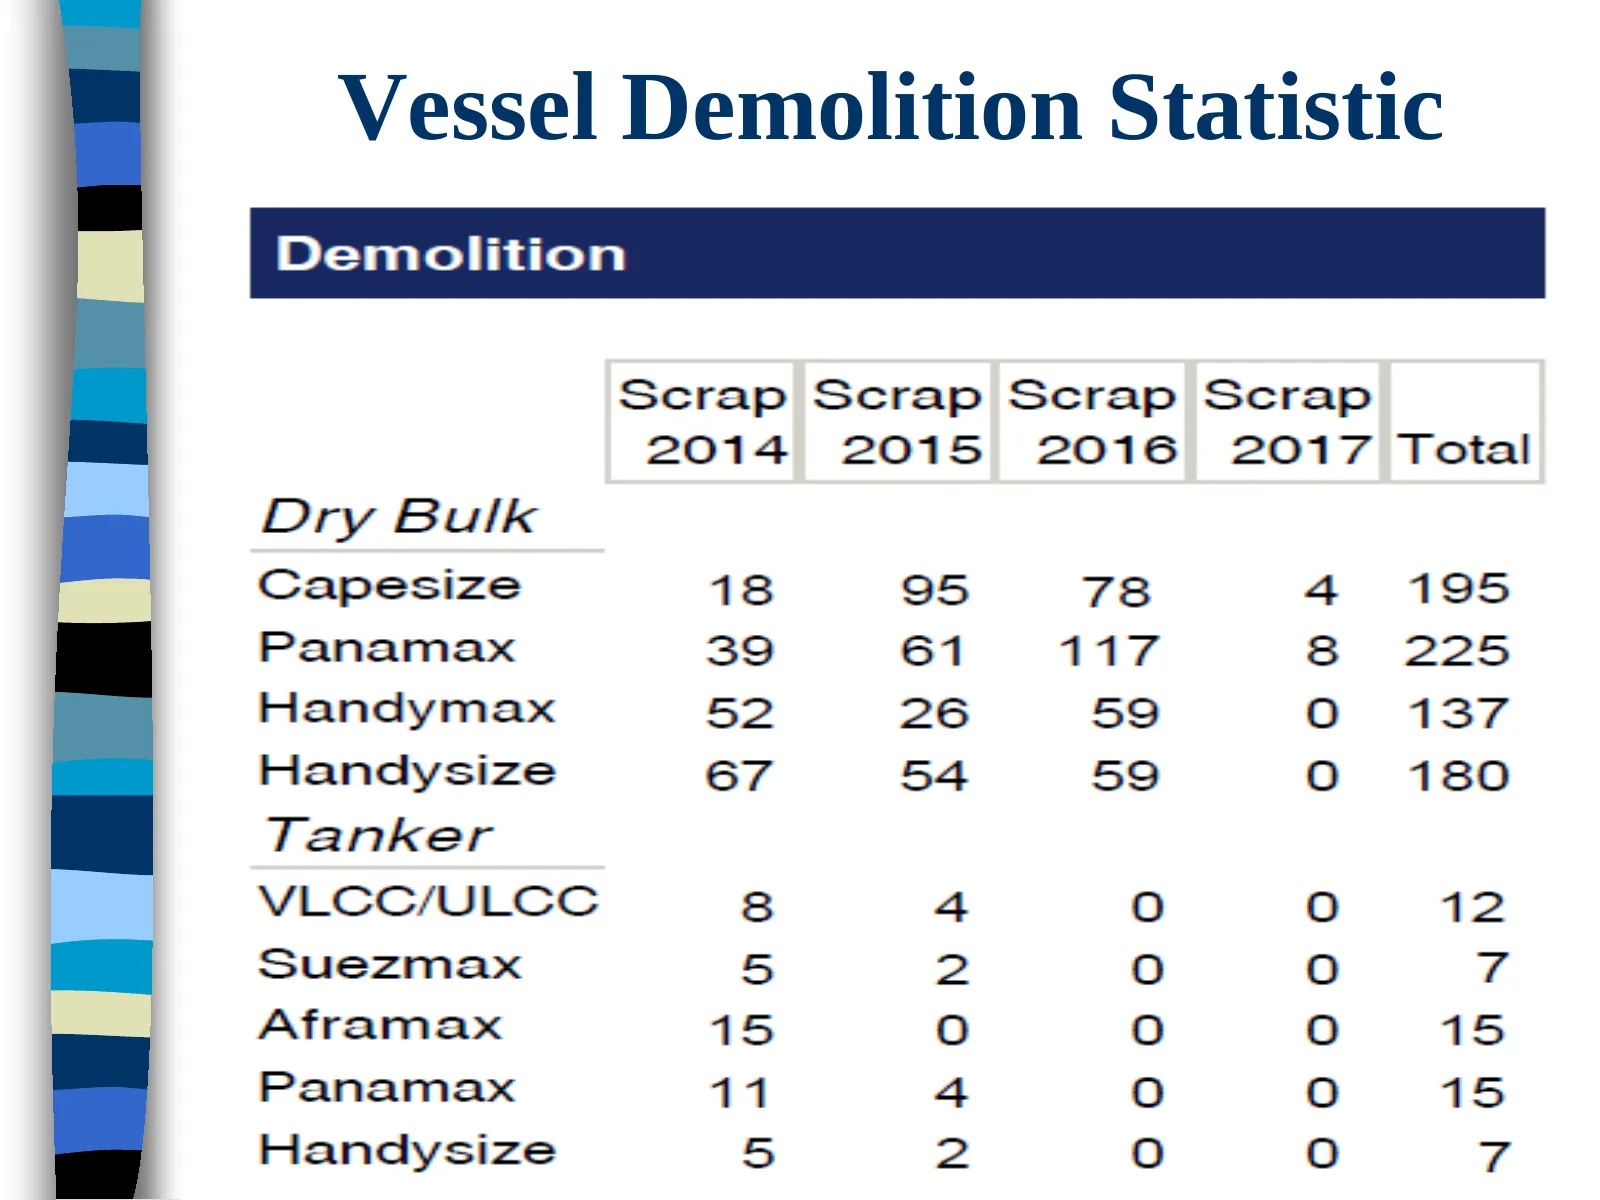
Slide 9: Vessel Demolition Statistic
Vessel Demolition Statistic
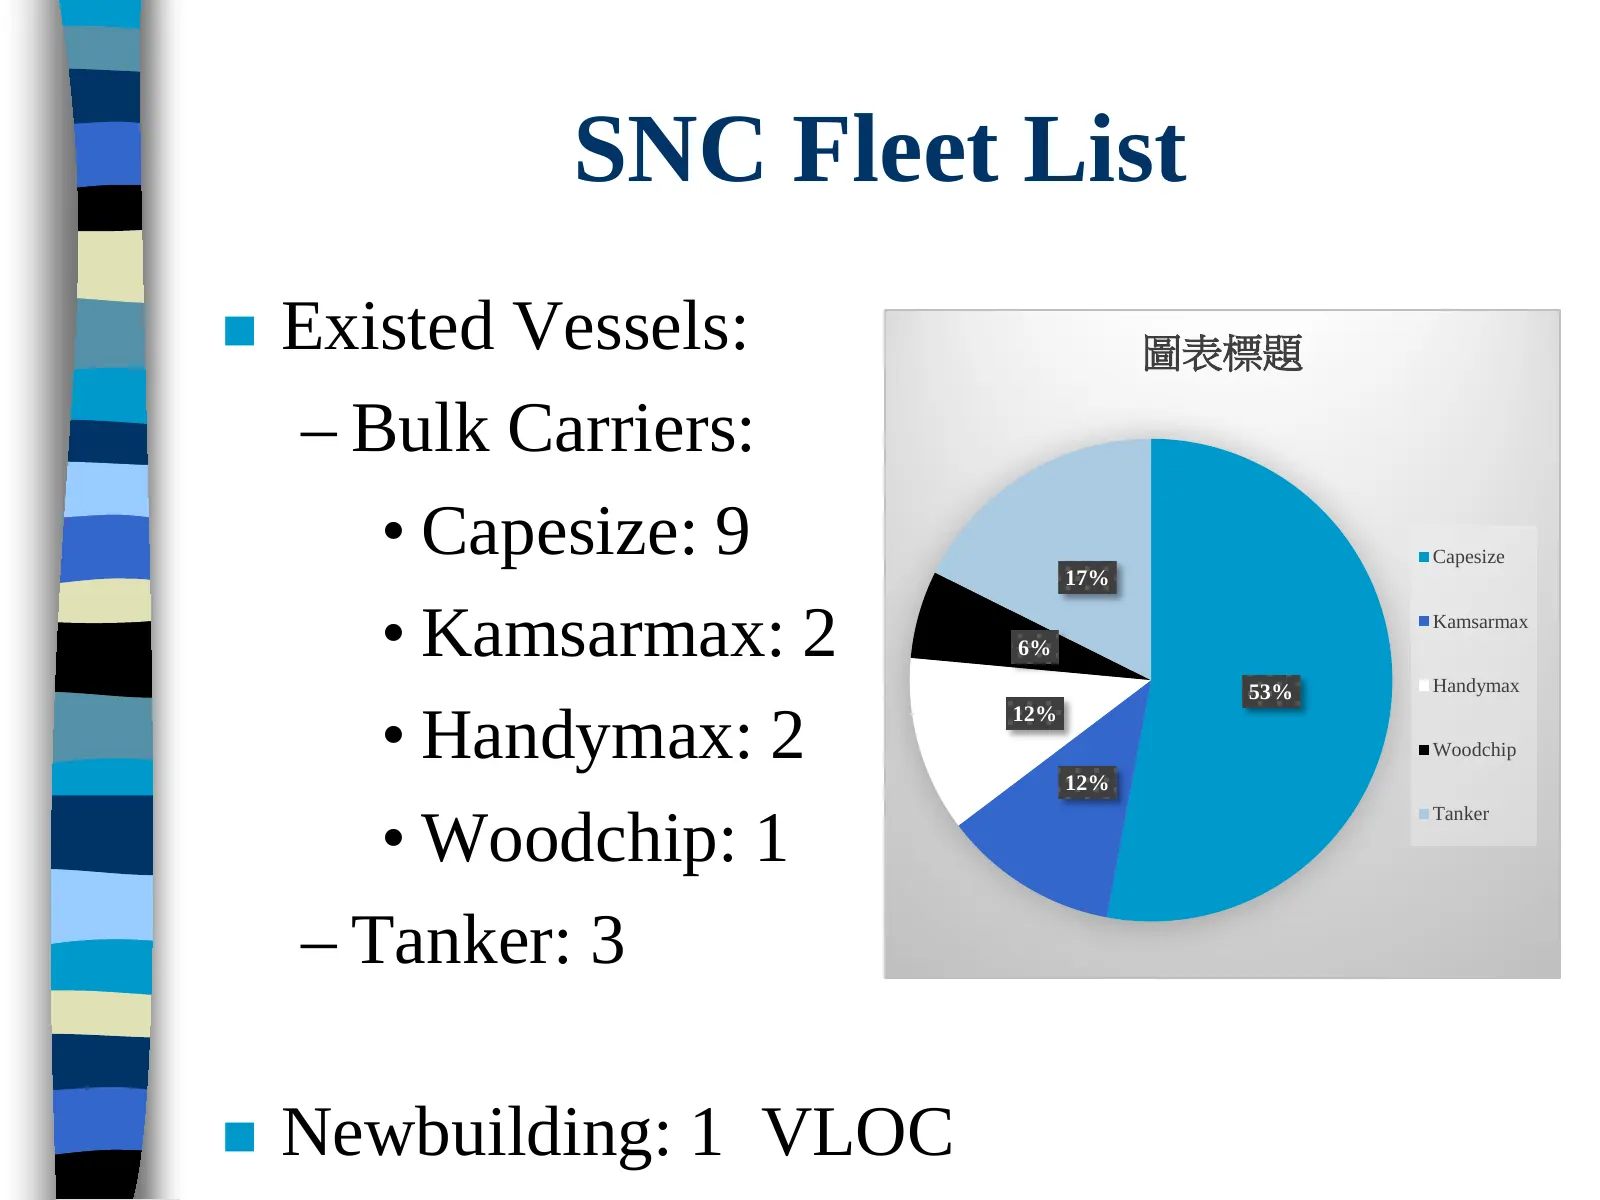
Slide 10: SNC Fleet List
SNC Fleet List Existed Vessels: 圖表標題 – Bulk Carriers: • Capesize: 9 17% Capesize • Kamsarmax: 2 6% Kamsarmax 53% Handymax 12% • Handymax: 2 12% Woodchip Tanker • Woodchip: 1 – Tanker: 3 Newbuilding: 1 VLOC
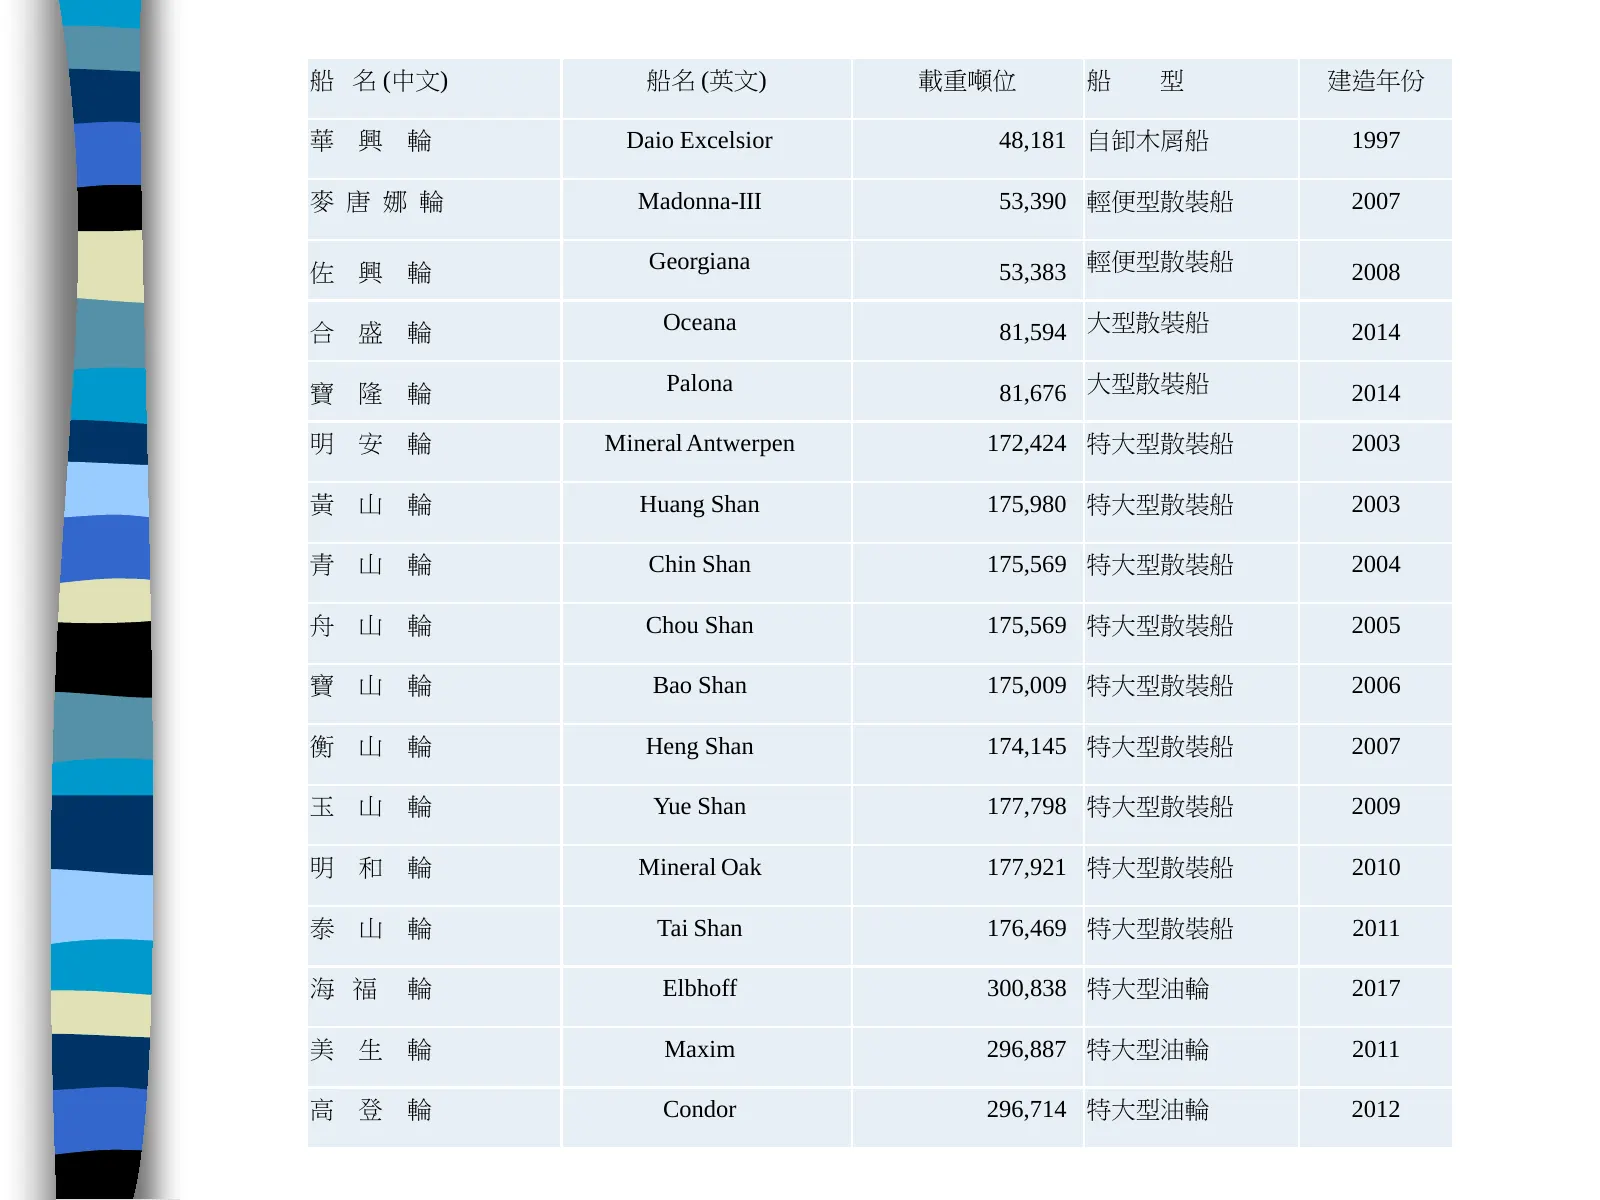
Slide 11: Daio Excelsior Madonna-III Georgiana
船 名 (中文) 船名 (英文) 載重噸位 船 型 建造年份 華 興 輪 Daio Excelsior 48,181 自卸木屑船 1997 麥 唐 娜 輪 Madonna-III 53,390 輕便型散裝船 2007 佐 興 輪 Georgiana 53,383 輕便型散裝船 2008 合 盛 輪 Oceana 81,594 大型散裝船 2014 寶 隆 輪 Palona 81,676 大型散裝船 2014 明 安 輪 Mineral Antwerpen 172,424 特大型散裝船 2003 黃 山 輪 Huang Shan 175,980 特大型散裝船 2003 青 山 輪 Chin Sh
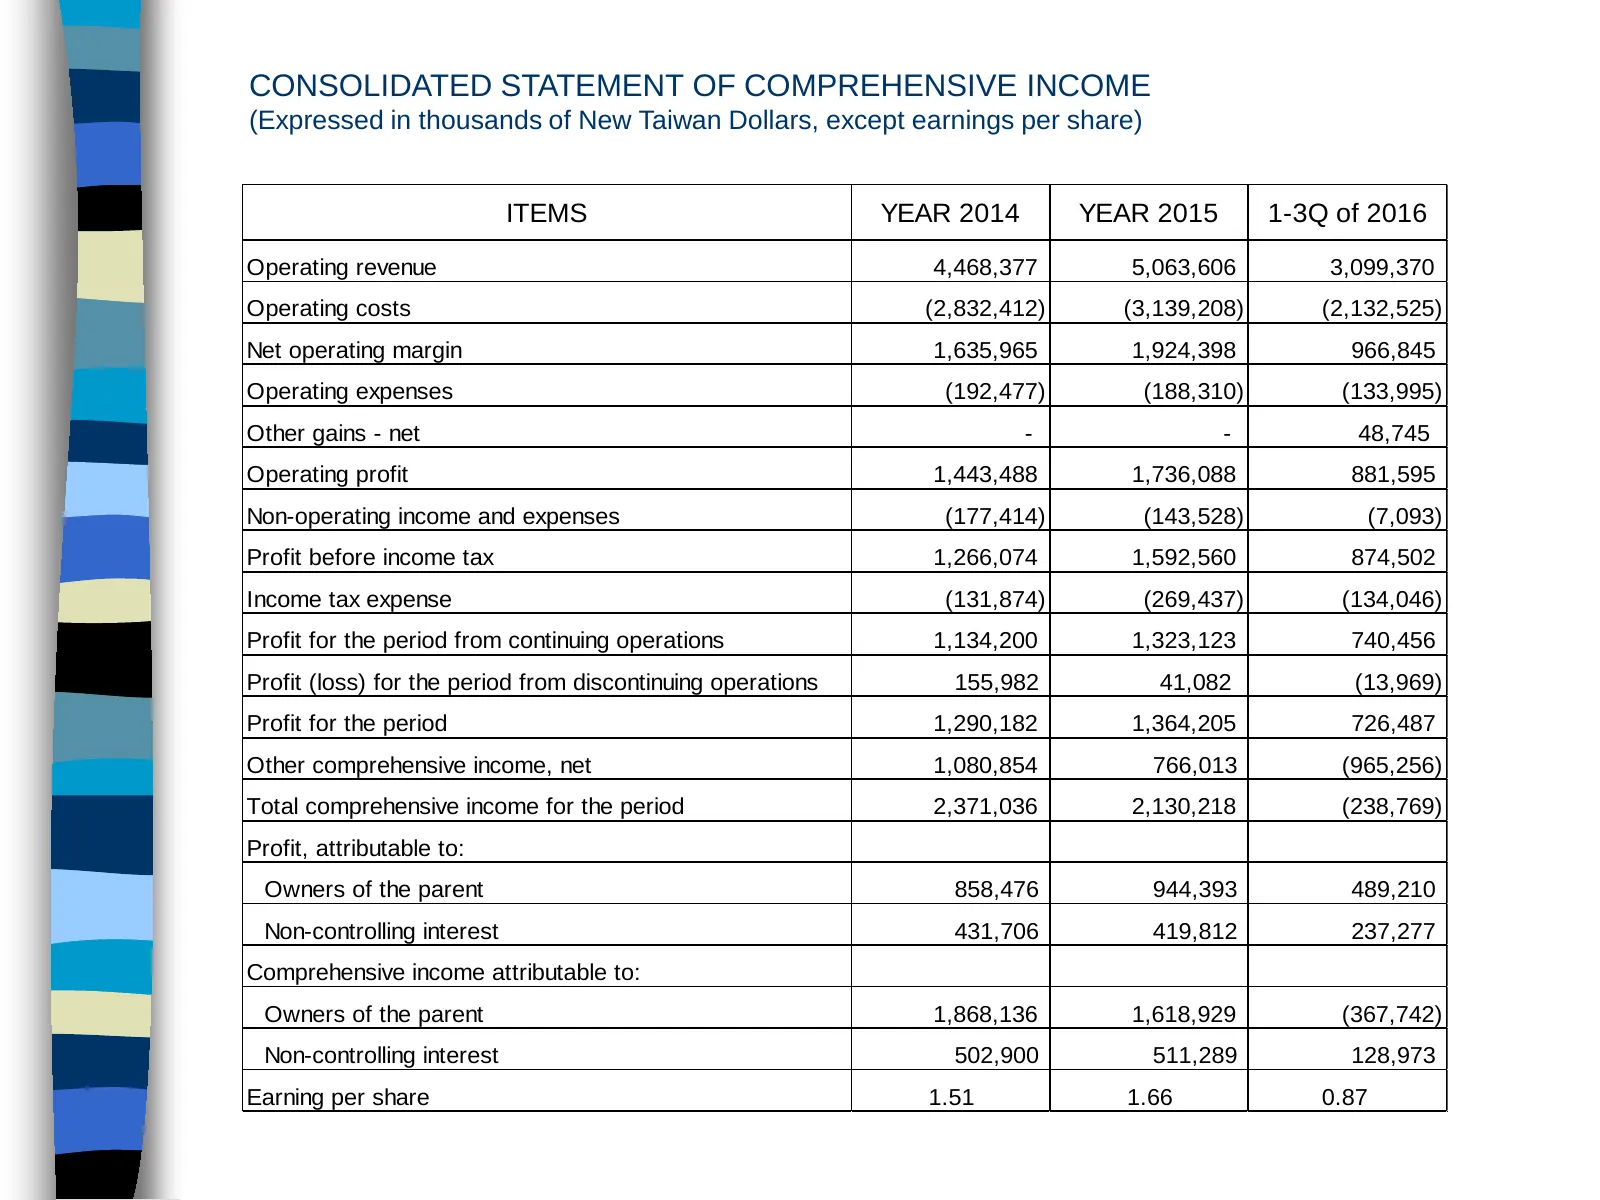
Slide 12: Consolidated Statement of Comprehensive Income
CONSOLIDATED STATEMENT OF COMPREHENSIVE INCOME (Expressed in thousands of New Taiwan Dollars, except earnings per share) ITEMS YEAR 2014 YEAR 2015 1-3Q of 2016 Operating revenue 4,468,377 5,063,606 3,099,370 Operating costs (2,832,412) (3,139,208) (2,132,525) Net operating margin 1,635,965 1,924,398
Slide 13: Consolidated Balance Sheets
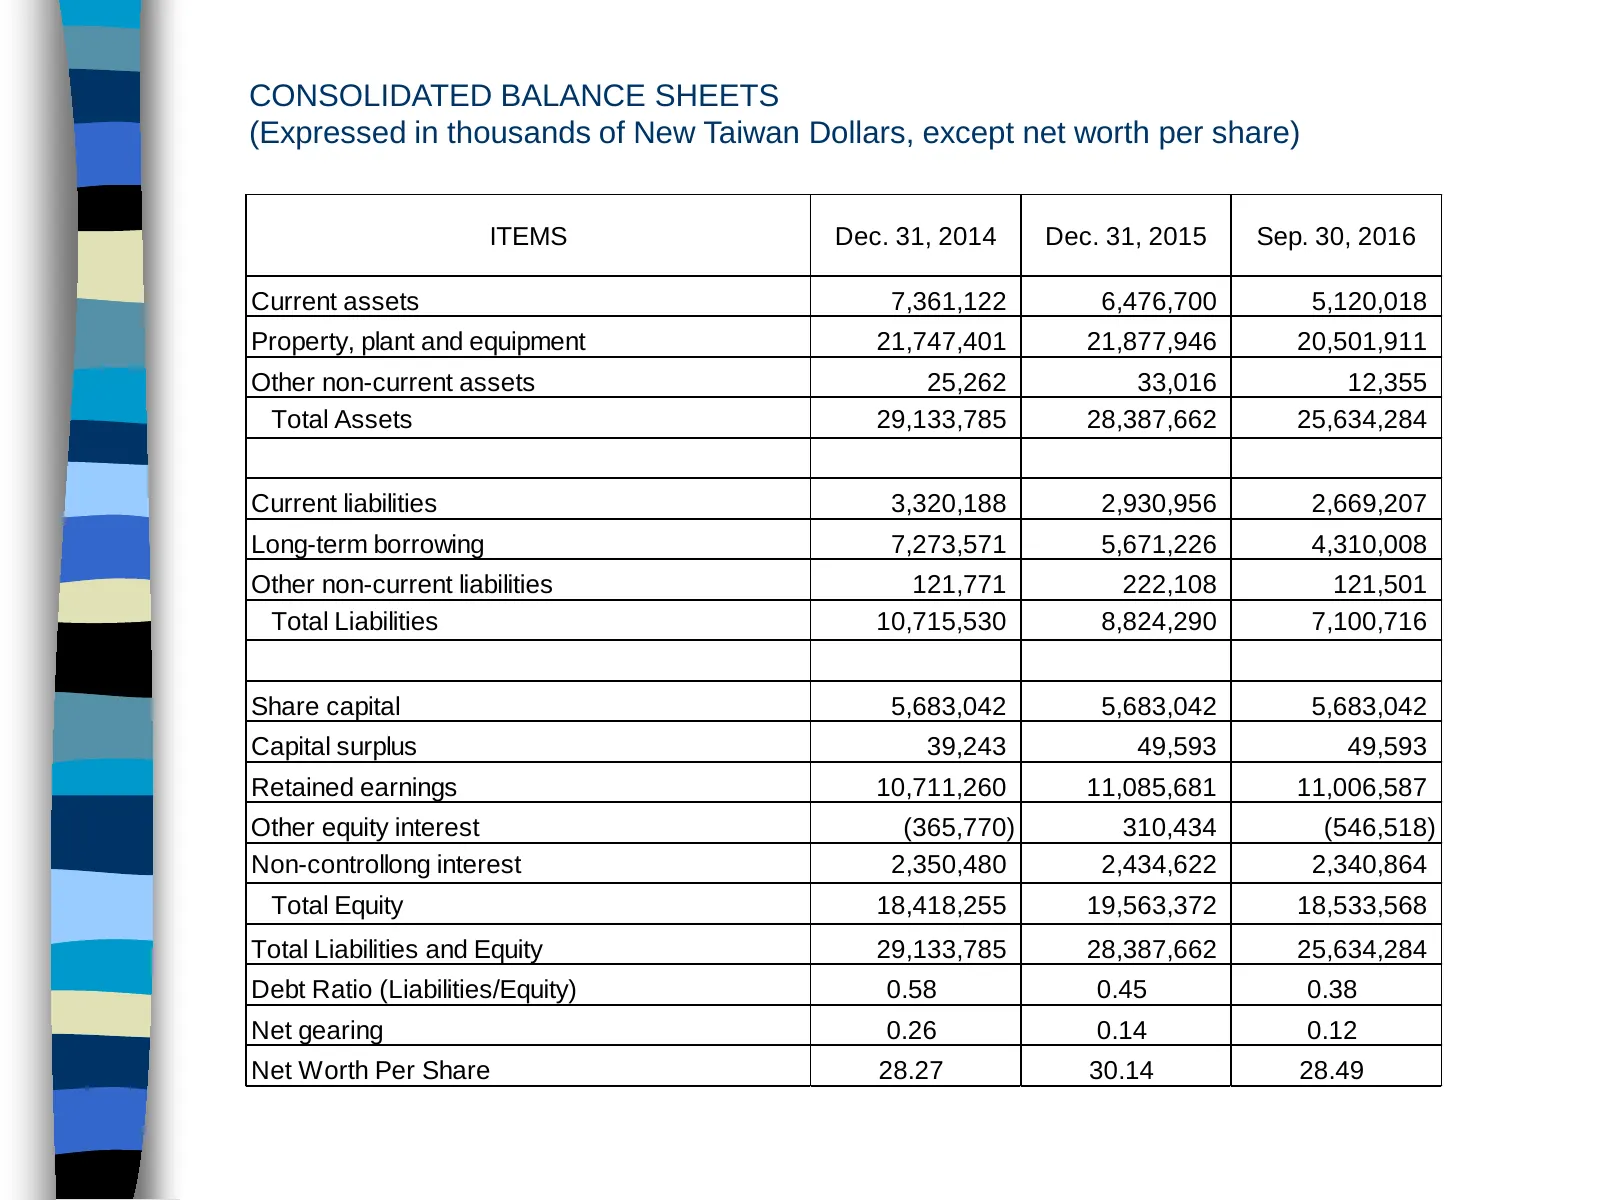
CONSOLIDATED BALANCE SHEETS (Expressed in thousands of New Taiwan Dollars, except net worth per share) ITEMS Dec. 31, 2014 Dec. 31, 2015 Sep. 30, 2016 Current assets 7,361,122 6,476,700 5,120,018 Property, plant and equipment 21,747,401 21,877,946 20,501,911 Other non-current assets 25,262 33,016 12
Slide 14: Earnings and Dividends in Past Ten Years
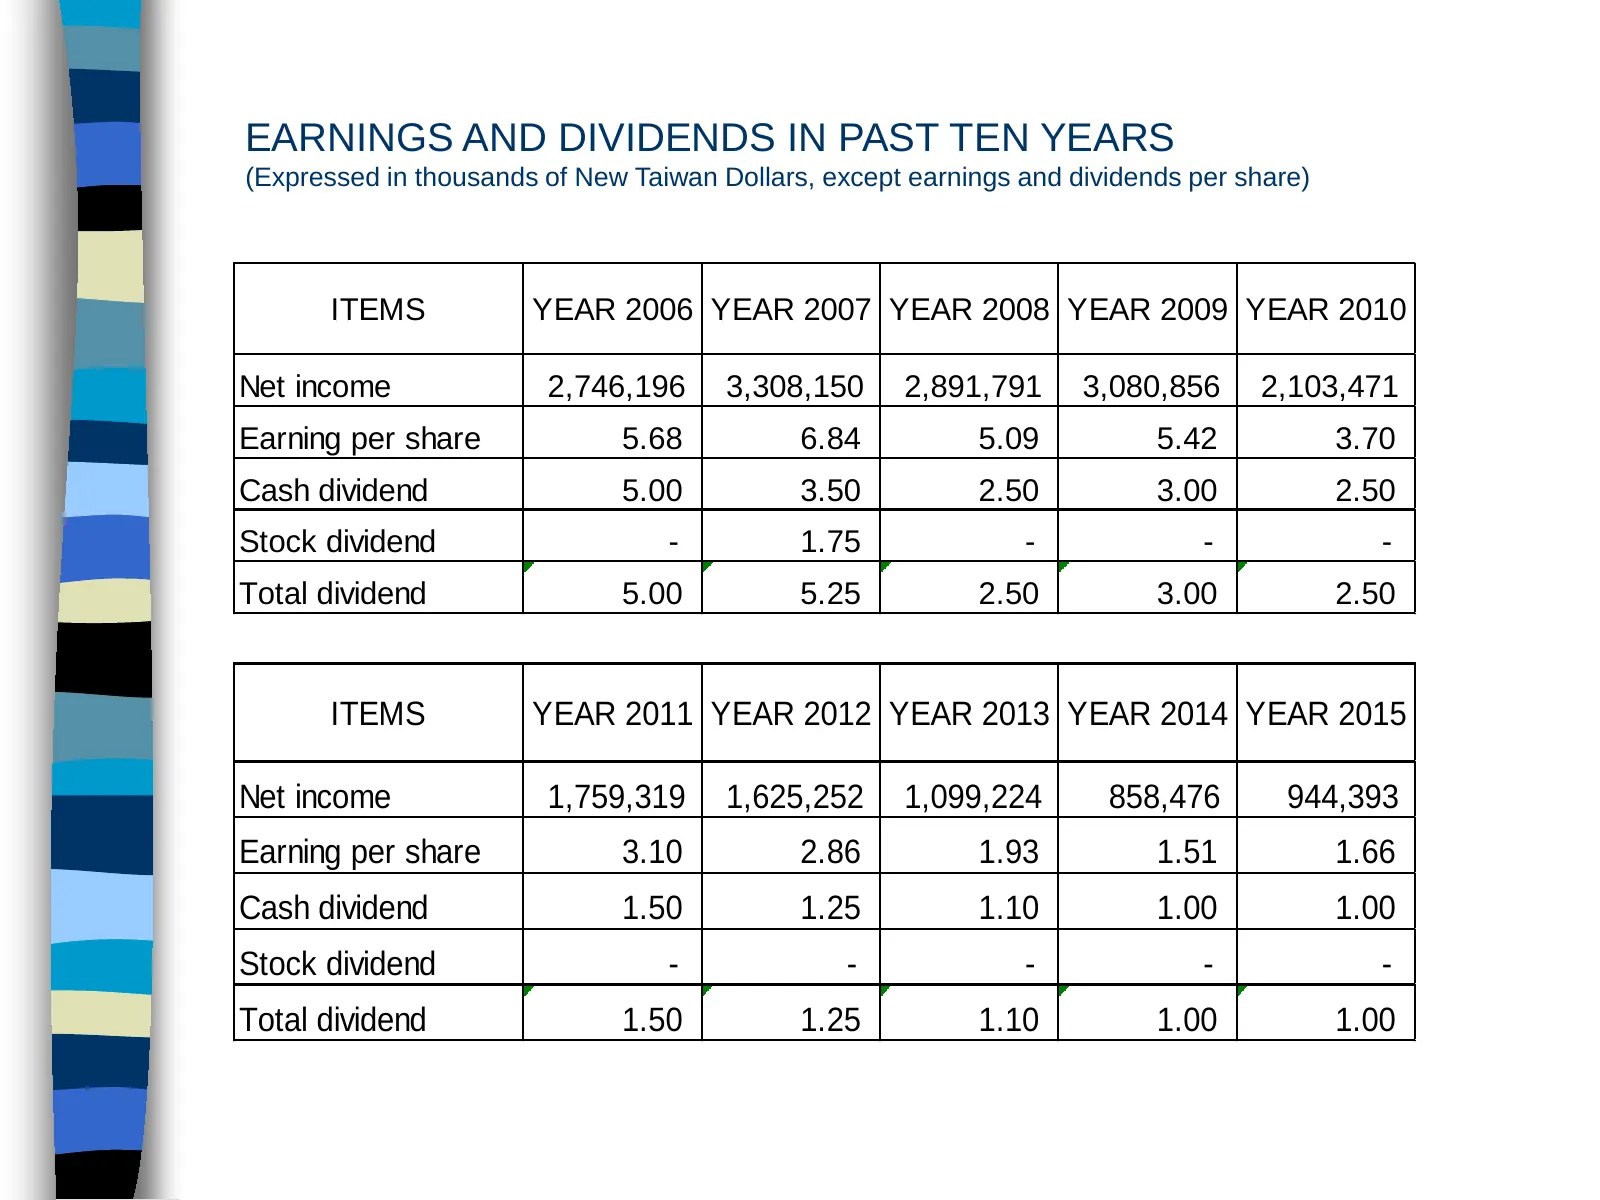
EARNINGS AND DIVIDENDS IN PAST TEN YEARS (Expressed in thousands of New Taiwan Dollars, except earnings and dividends per share) ITEMS YEAR 2006 YEAR 2007 YEAR 2008 YEAR 2009 YEAR 2010 Net income 2,746,196 3,308,150 2,891,791 3,080,856 2,103,471 Earning per share 5.68 6.84 5.09 5.42 3.70 Cash divide

Slide 15: Questions & Answers
Questions & Answers
Slide 16: The End – Thanks for Listening!
~ The End ~ Thanks for Listening!
Source: company website
More decks from Sincere Navigation Corporation
 Q3 2026 Earnings Presentation34 slides · Aug 21, 2026
 Q1 2026 Earnings Presentation31 slides · May 22, 2026
 FY2025 Earnings Presentation35 slides · Mar 27, 2026
 Q3 2025 Earnings Presentation43 slides · Nov 28, 2025
 Q2 2025 Earnings Presentation36 slides · Aug 22, 2025
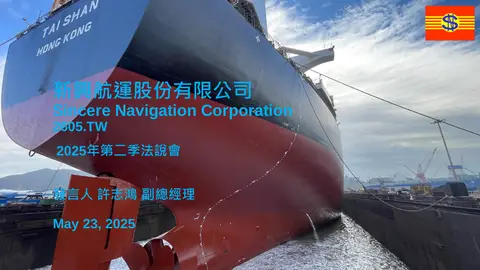 Q1 2025 Earnings Presentation34 slides · May 23, 2025