PremierWest Bancorp — Sandler O'Neill 2008 West Coast Financial Services Conference
19 slides from PremierWest Bancorp's conference presentation, Mar 6, 2008
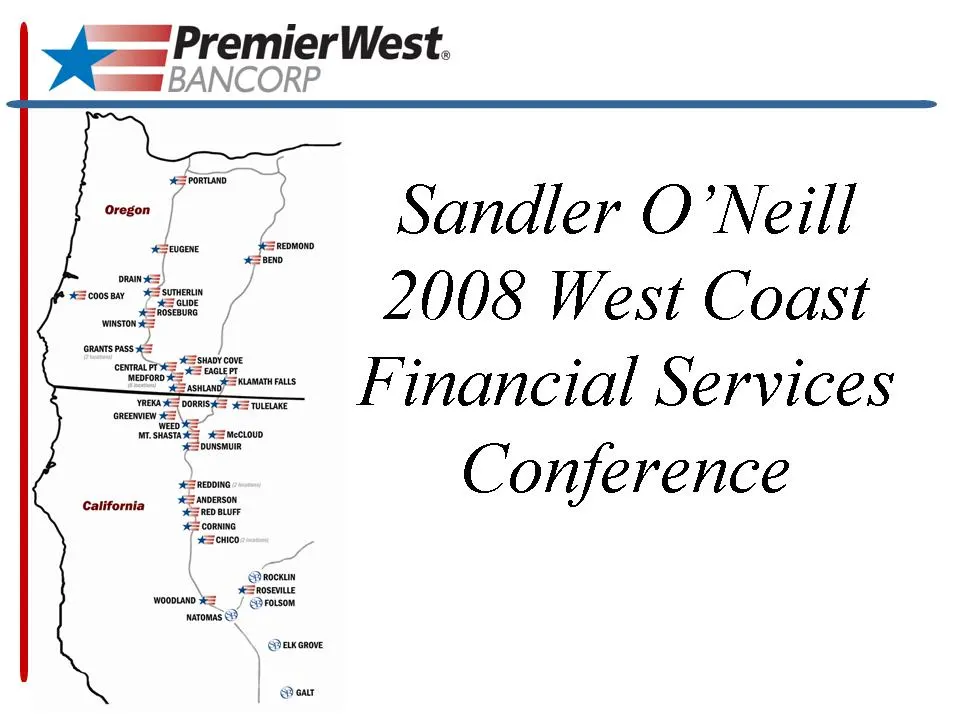
Slide 1: Sandler O'Neill 2008 West Coast Financial Services Conference
yeas PremierWest. emus BANNCORP Sandler O'Neill 2008 West Coast Financial Services Conference
Slide 2: Forward Looking Statement Disclosure
Forward Looking Statement Disclosure This presentation contains forward-looking statements. Actual results may differ materially from those currently expected. Additional information concerning factors that could cause such a difference is contained in the Company’s most recent filings with the Secu
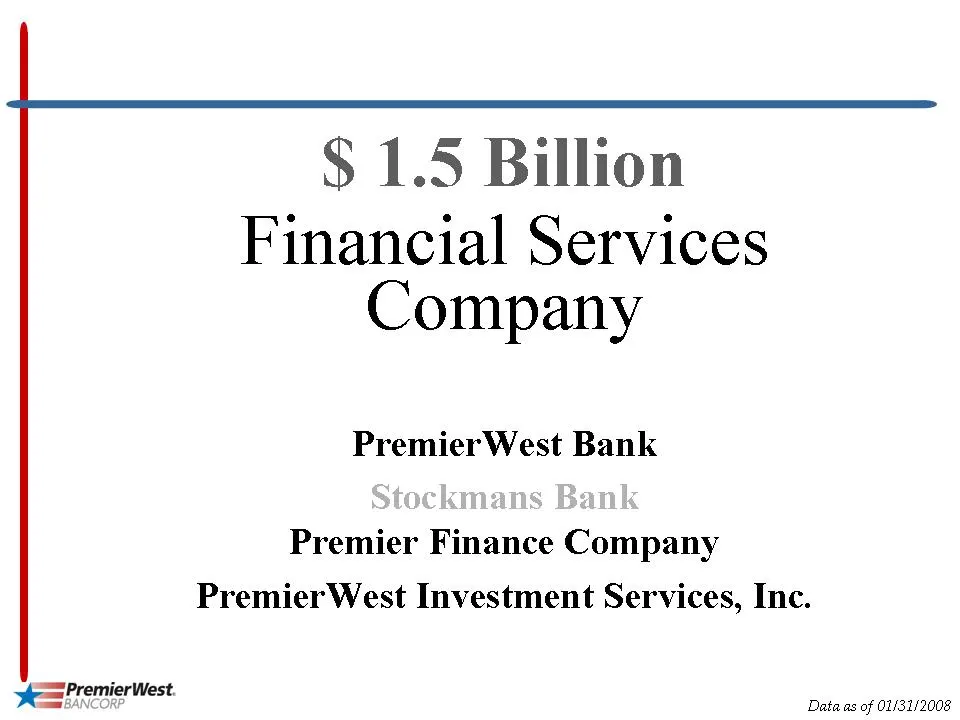
Slide 3: $1.5 Billion Financial Services Company
$ 1.5 Billion Financial Services Company PremierWest Bank Premier Finance Company PremierWest Investment Services, Inc. ee PremierWest. = Data as of 01/31/2008
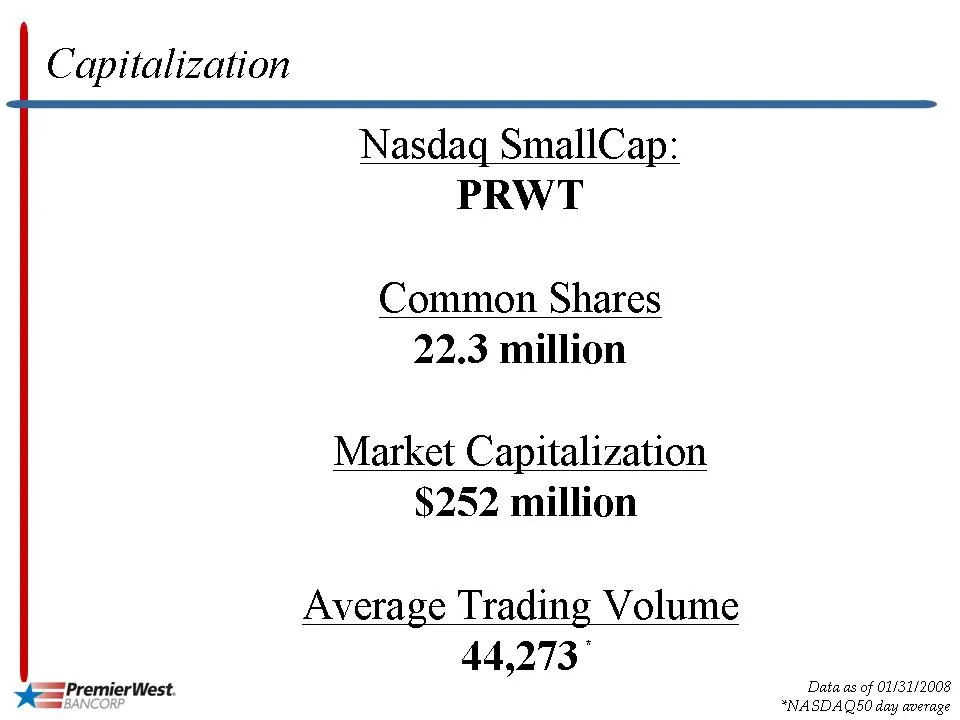
Slide 4: Capitalization
Capitalization Nasdaq SmallCap: PRWT Common Shares 22.3 million Market Capitalization $252 million Average Trading Volume 44,273" = PremierWest. Data as of 01/31/2008 = *NASDAQSO day average
Slide 5: PremierWest History - 1998 to 2008
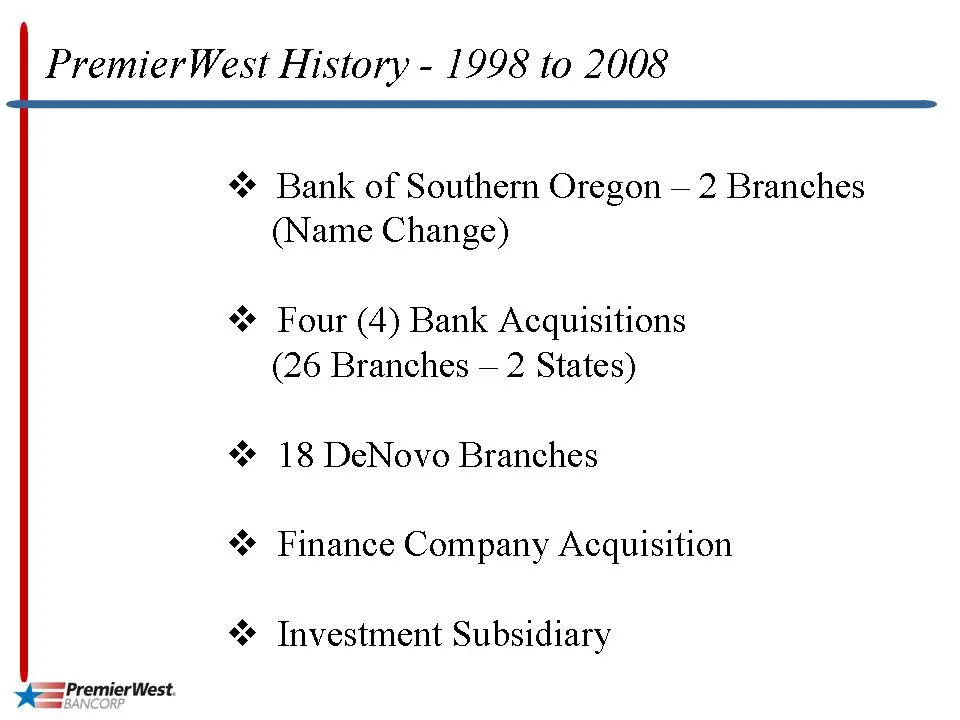
PremierWest History - 1998 to 2008 «+ Bank of Southern Oregon — 2 Branches (Name Change) ~* Four (4) Bank Acquisitions (26 Branches — 2 States) “* 18 DeNovo Branches “+ Finance Company Acquisition «+ Investment Subsidiary = PremierWest.
Slide 6: Strategy
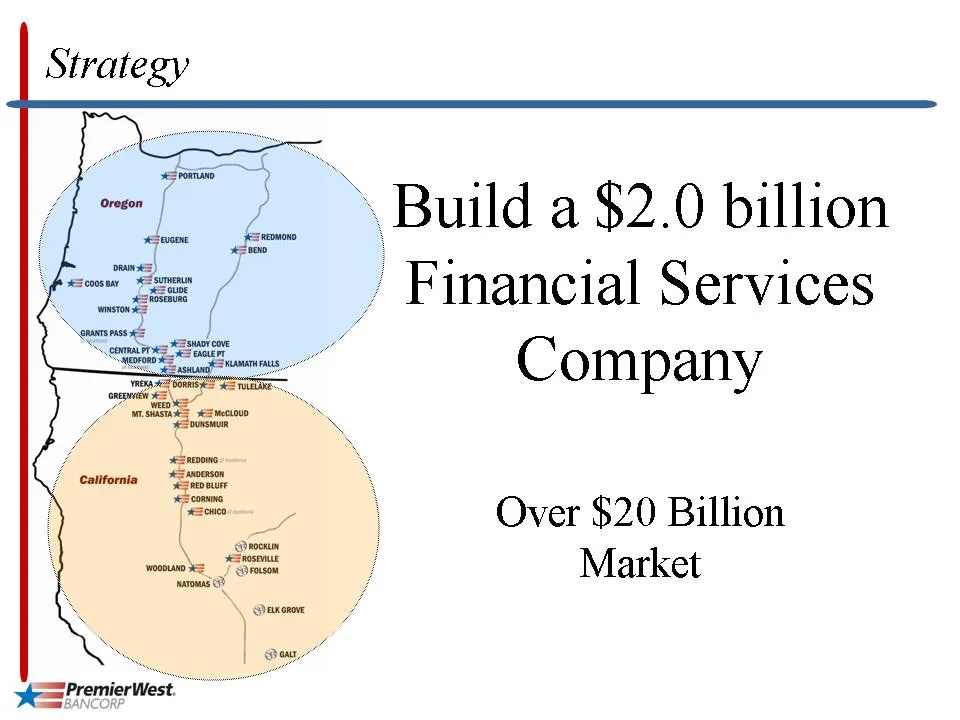
Strategy > Build a $2.0 billion _ Financial Services Company \ Over $20 Billion / Market
Slide 7: Growing Markets — Great Opportunities
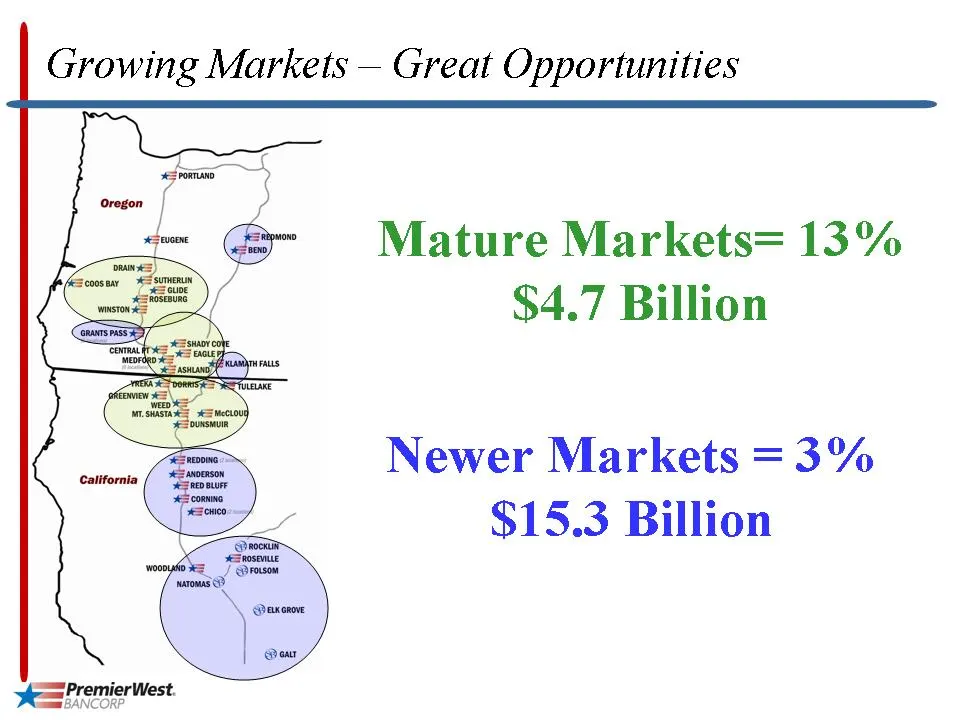
Growing Markets — Great Opportunities jas, remiane = 4 Se Mature Markets= 13% ( $4.7 Billion Newer Markets =3% $15.3 Billion yee PremierWest.
Slide 8: Loan Growth
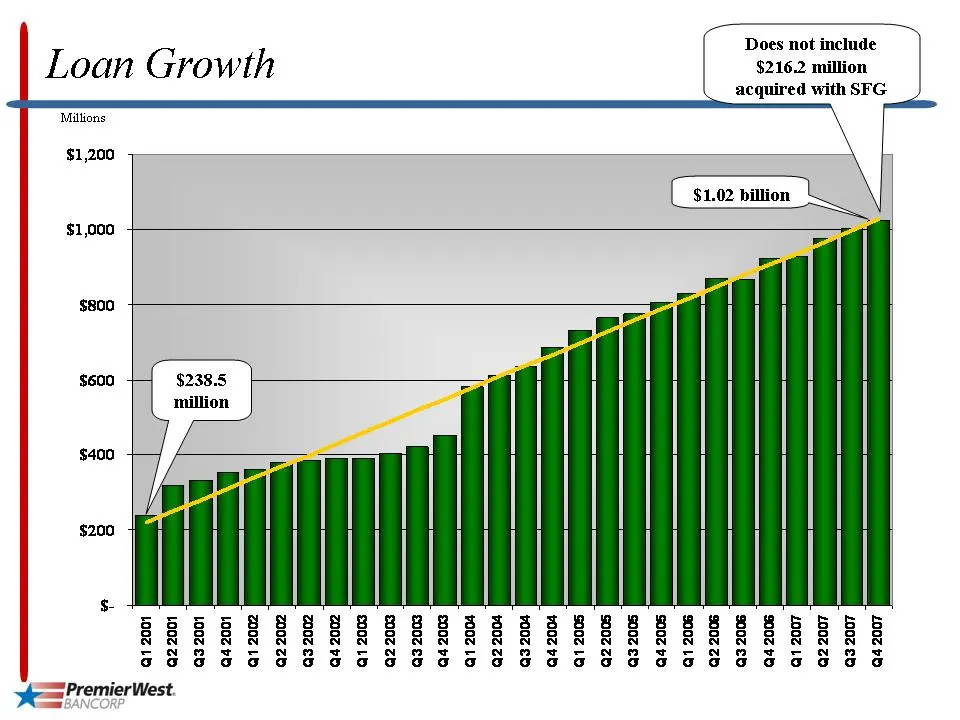
acquired with SFG Does not include $216.2 million $1.02 billion Millions Loan Growth $1,200 100% PD 200% £0 10022 £002 Lb 9002 FD go0z 2 9002 Z 9002 LD so0z p> so0z 2 s00zzb s00z LD yong PD vooz 2b vo0zZ> yong Lb s00z PD s00z £ s00zZ zo0z LD tooz r> booze toozzb tooz Lo * PremierWest.
Slide 9: Total Deposits
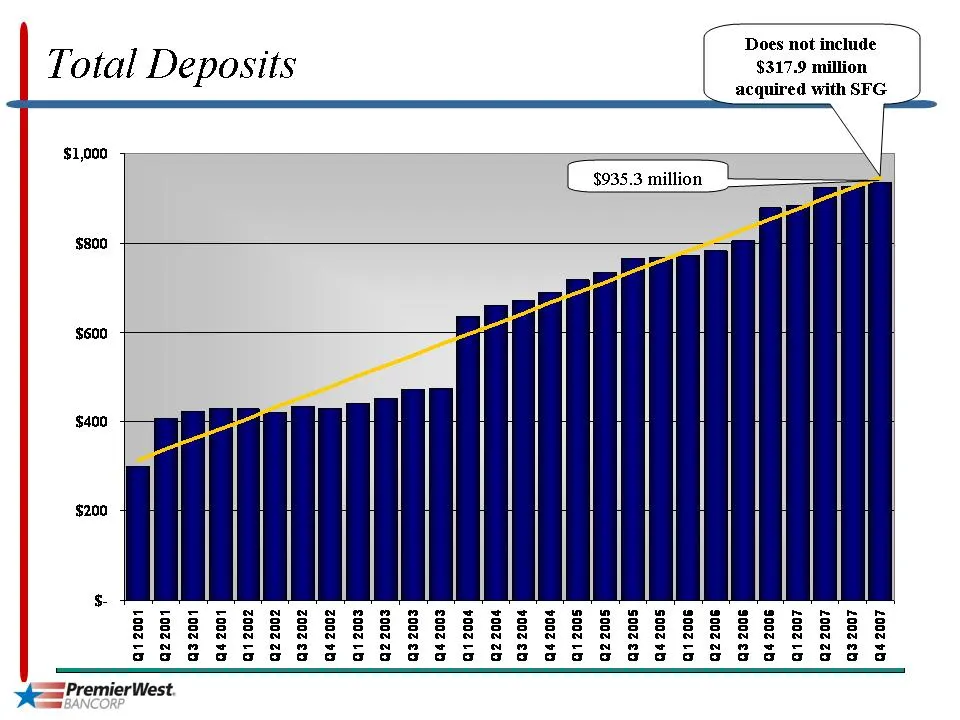
— Does not include $317.9 million acquired with SF‘ Total Deposits $935.3 million $1,000 $800 $600 $400 + $200 2002 6 2002 £0 £002 2 2002 Lb s00z 9b so0z eb 900220 9002 Lb s00z 9D sooz eb s00z 2b s00z Lb yooz 6D yooz £0 yoo zb yooz LO 2002 6 e00z £0 200220 2002 LD z00z 6 zo0z £0 z00z 25 z00z Lb Looz
Slide 10: Geographic Footprint
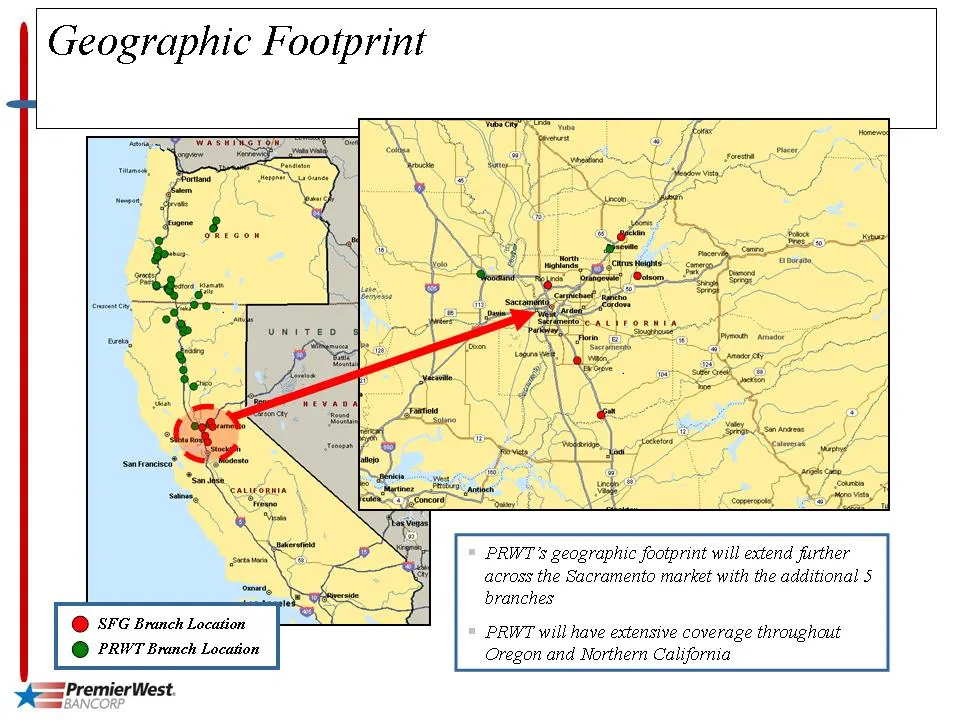
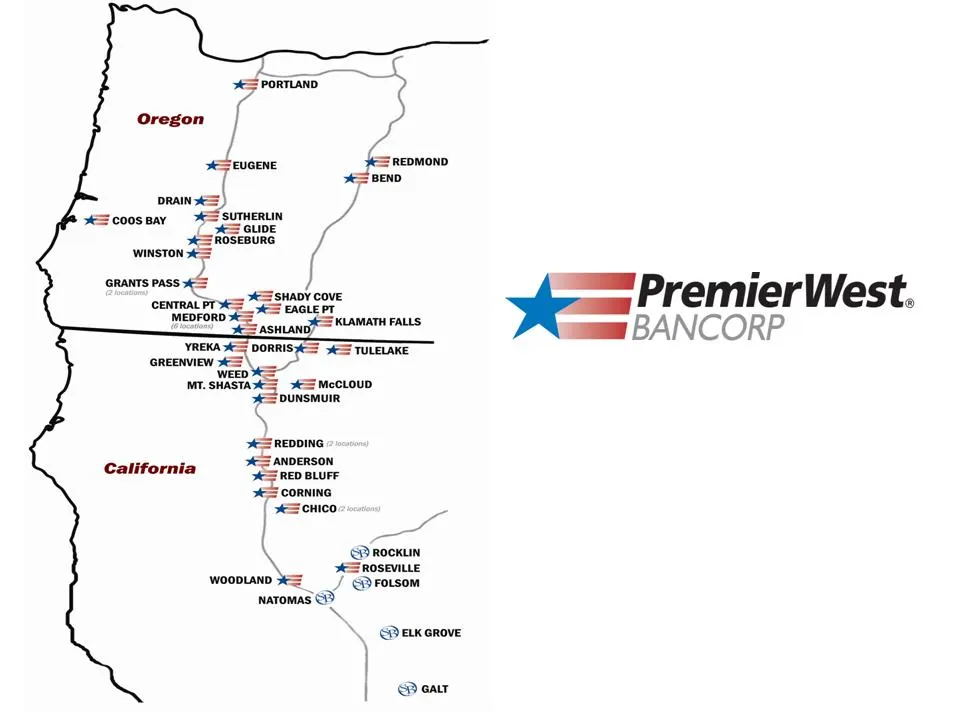
Geographic Footprint PRWT's geographic footprint will extend further across the Sacramento market with the additional 5 branches PRWT will have extensive coverage throughout Oregon and Northern California yee PremierWest.
Slide 11: Deposit Market Share Analysis
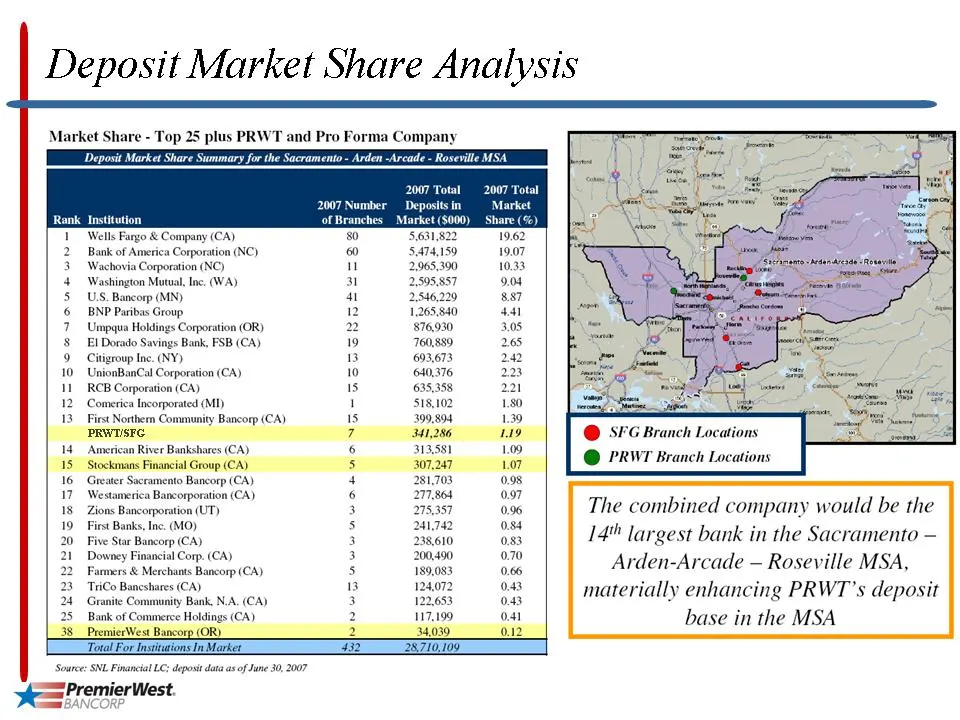
Deposit Market Share Analysis Market Share - Top 25 plus PRWT and Pro Forma Compas 2007 Total 2007 Total 2007 Number Deposits in Market Rank Institution ‘of Branches Market ($000) Share (‘) Wells Fargo & Company (CA) 5.6, Bank of America Corporation (NC) 5.474.159 Wachovia Corporation (NC) 2,965,390
Slide 12: Net Income (in Thousands)
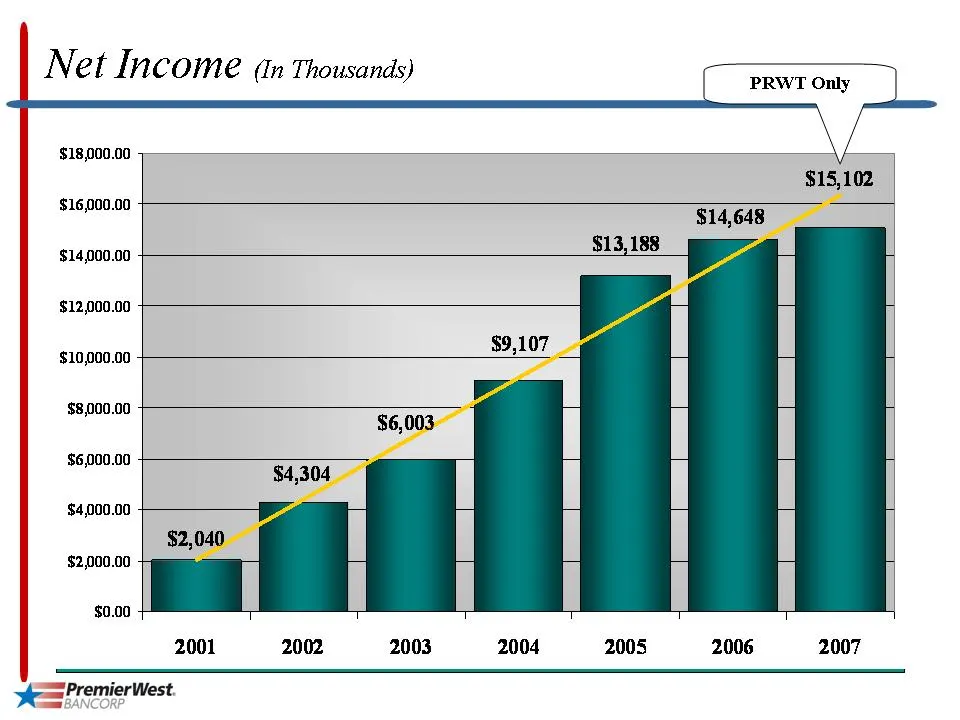
Net Income (in Thousands) $18,000.00 $16,000.00 $14,000.00 $12,000.00 $14,648 $13,188 Fa $10,000.00 $8,000.00 $6,000.00 4 $4,000.00 4 $2,000.00 $0.00 2001 2002 2003 2004 * PremierWest. Bi 2005 2006 2007
Slide 13: Reasons to Invest
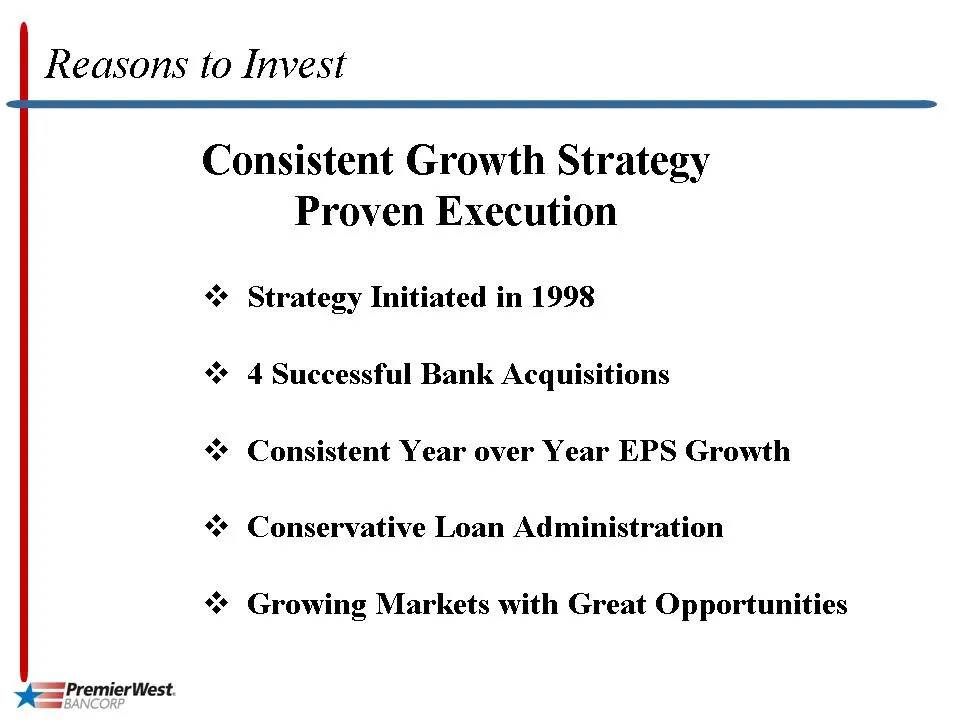
Reasons to Invest Consistent Growth Strategy Proven Execution ** Strategy Initiated in 1998 ** 4 Successful Bank Acquisitions ** Consistent Year over Year EPS Growth ** Conservative Loan Administration ** Growing Markets with Great Opportunities es PremierWest
Slide 14: Branch Locations Map
4S PORTLAND Oregon [ SESEUGENE == REDMOND eS BEND DRAIN =f eS SUTHERLIN Ascoosear See AS hoseBuRG WINSTON = Wi . = === PremierWest. mmm BANCORP WEED MT. SHASTAAS ASS MeCLOUD c DUNSMUIR <= REDDING 2-5 ANDERSON California Senco sune YES conNING {Senco @Prockun ES ROSEVILLE WoooLanD X= 7) FOLSOM Natoma

Slide 15: Additional Information
Additional Information es PremierWest
Slide 16: Deposit Mix
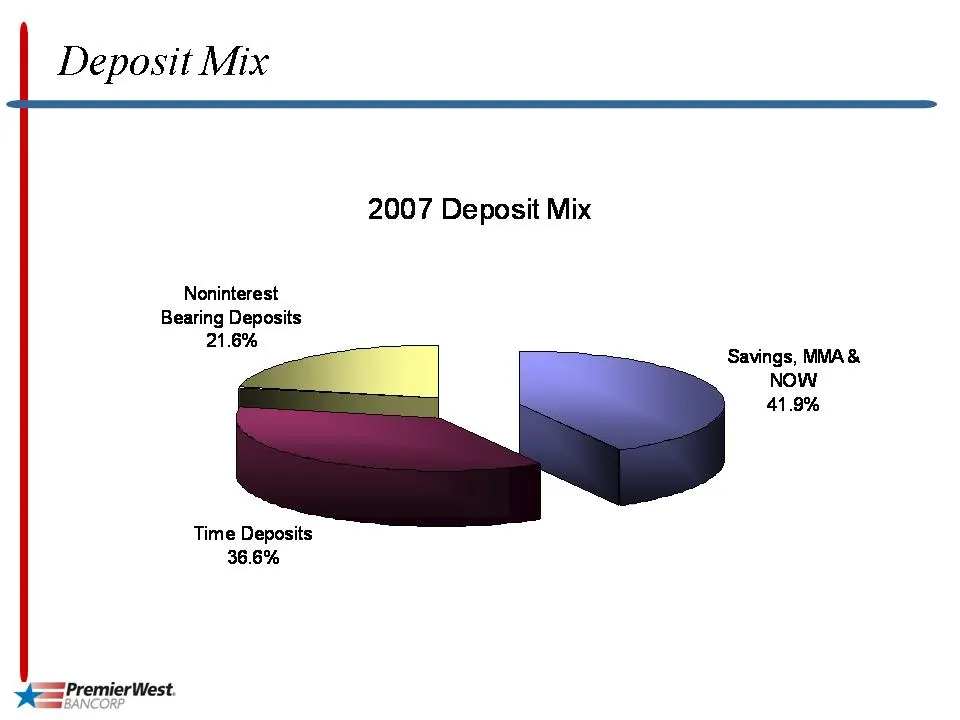
Deposit Mix 2007 Deposit Mix Noninterest Bearing Deposits 21.6% Savings, MMA & Now 41.9% Time Deposits 36.6% yee PremierWest.
Slide 17: Ratio of Net Loans Charged Off to Total Loans
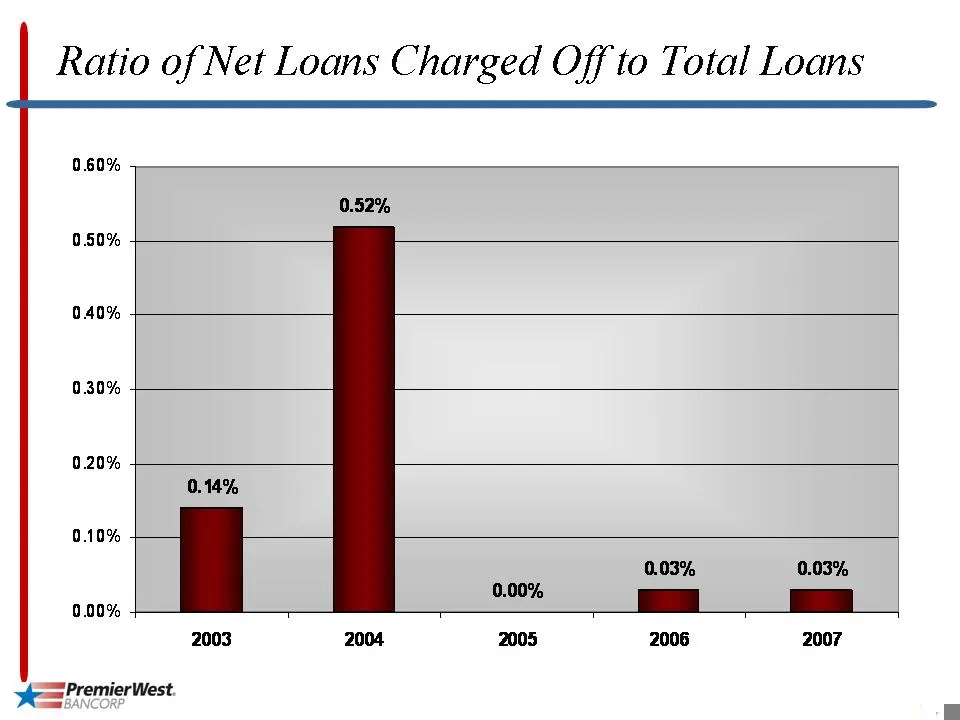
Ratio of Net Loans Charged Off to Total Loans Ie == PremierWest.
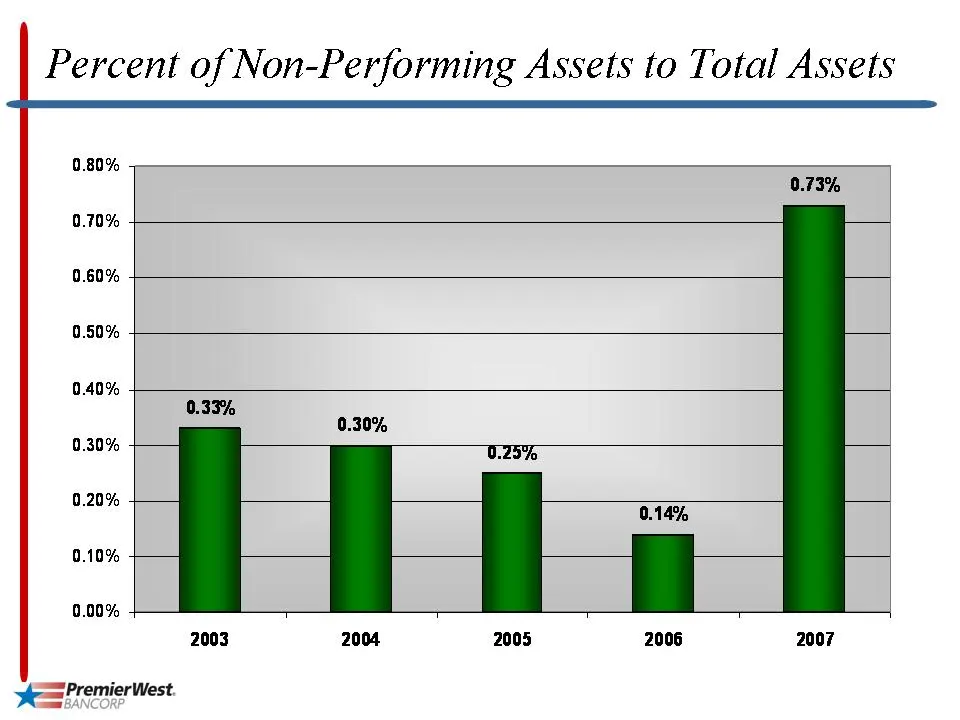
Slide 18: Percent of Non-Performing Assets to Total Assets
Percent of Non-Performing Assets to Total Assets 0.40% 0.33% 0.30% 0.30% T25% 0.20% pee 0.10% Z 0.00% 2003 2005 2006 2007 ye PremierWest.
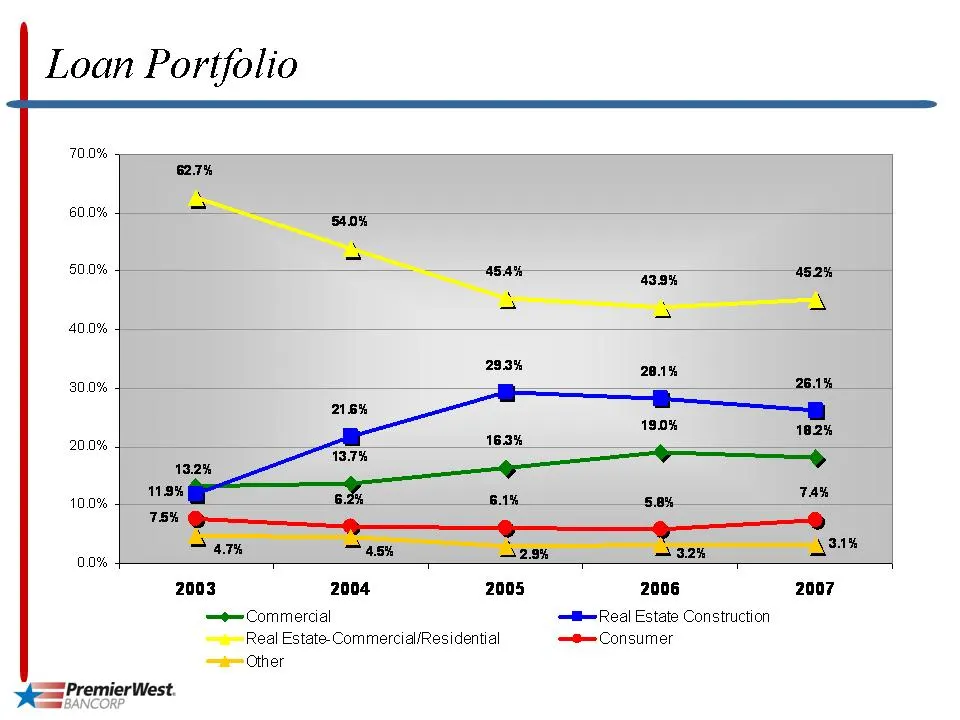
Slide 19: Loan Portfolio
Loan Portfolio a 47h 45% % ehh 2003 2004 2005 2006 2007 —e— Commercial —@ Real Estate Construction ~~» Real Estate-Commercial/Residential —®— Consumer tem Other es PremierWest.
Source: SEC EDGAR · 8-K filed Mar 6, 2008
More decks from PremierWest Bancorp
 Shareholder Meeting (May 2011)27 slides · May 26, 2011
 Shareholder Meeting (May 2010)29 slides · May 28, 2010
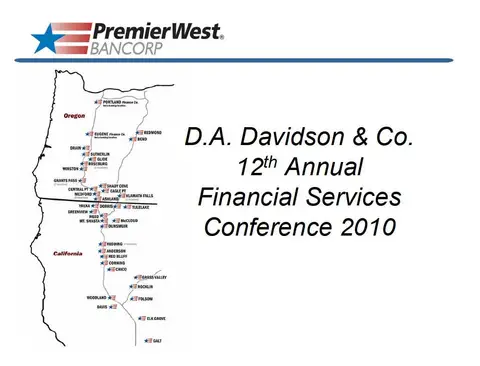 D.A. Davidson & Co. Annual Financial Services Conference 201027 slides · May 12, 2010
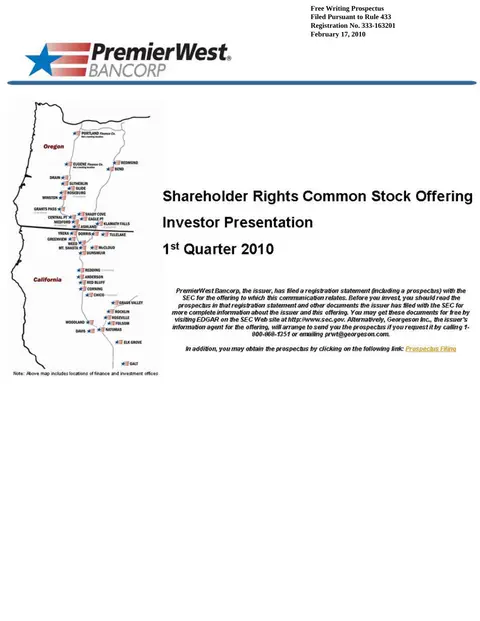 IPO Roadshow (February 2010)28 slides · Feb 18, 2010
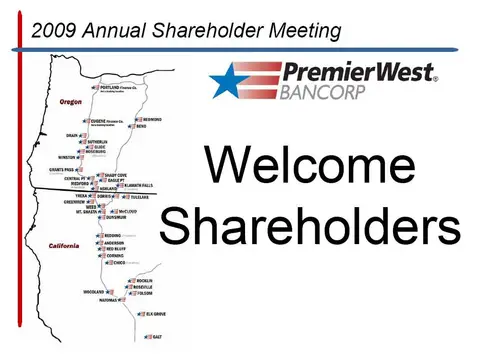 Shareholder Meeting (June 2009)27 slides · Jun 24, 2009
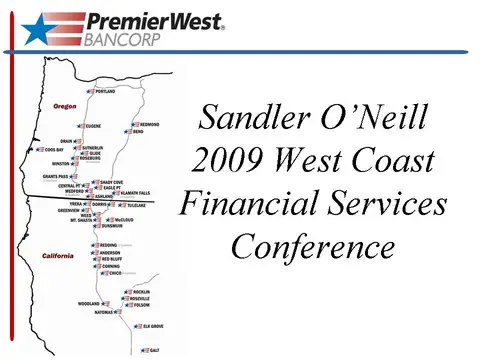 Sandler O'Neill 2009 West Coast Financial Services Conference16 slides · Feb 26, 2009