PremierWest Bancorp — Shareholder Meeting (May 2011)
27 slides from PremierWest Bancorp's shareholder meeting presentation, May 26, 2011
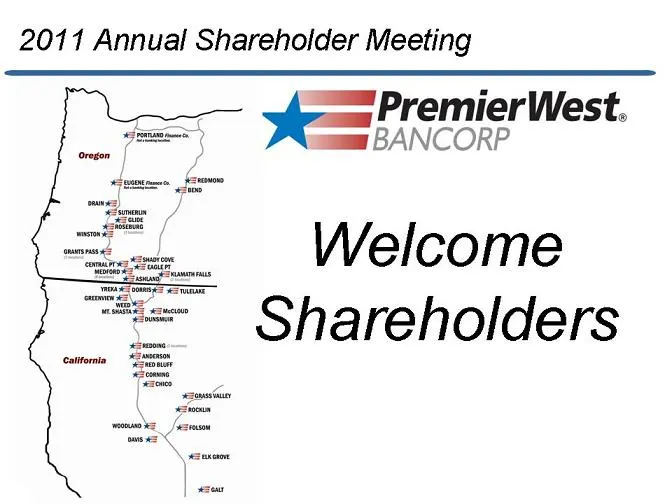
Slide 1: 2011 Annual Shareholder Meeting
2011 Annual Shareholder Meeting == PremierWest. sams BANCORP Welcome Shareholders
Slide 2: Introductions
Introductions
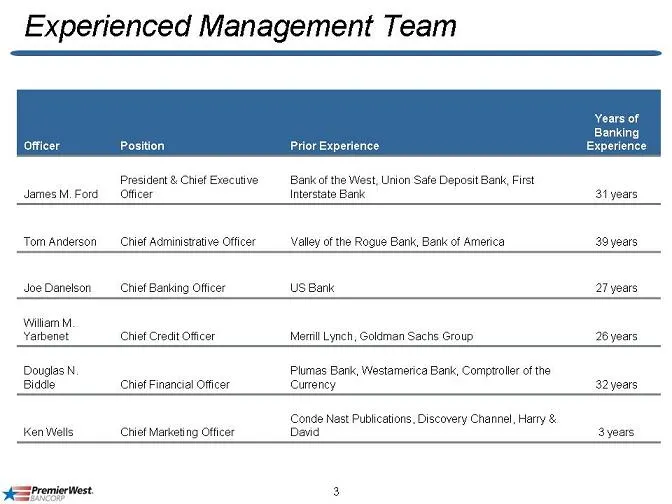
Slide 3: Experienced Management Team
Experienced Management Team Years of Banking Position’ Prior Experience Experience President & Chief Executive Bank of the West, Lnion Safe Deposit Bank, First JamesM.Ford _ Officer Interstate Bank 31 years Tom Anderson Chief Administrative Officer __Valley ofthe Rogue Bank, Bank of America 20yeers
Slide 4: Management's Report
Management's Report
Slide 5: Forward Looking Statement Disclosure
Forward Looking Statement Disclosure This presentation may include ‘forward-looking statements” about PremierWest. Forward-looking statements generally include financial projections; descriptions of plans or objectives of management for future operations, products or services; forecasts of future ec
Slide 6: Net Income (Loss) Available to Common Shareholders / Loan Loss Provision
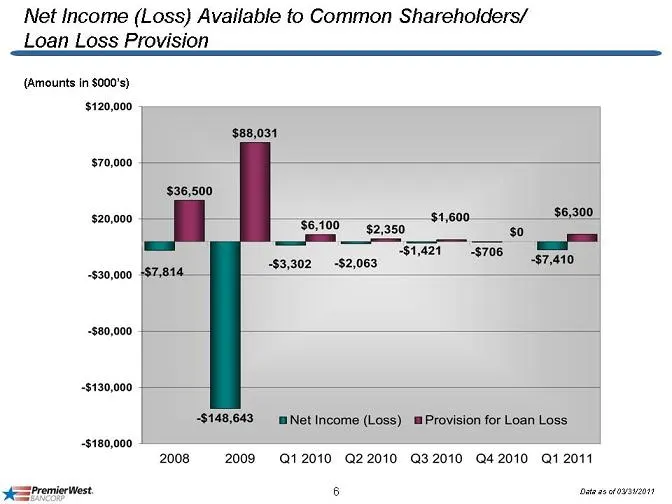
Net Income (Loss) Available to Common Shareholders/ Loan Loss Provision (Amounts in $000's) sine $88,031 $36,500 $20,000 7 $1,600. $8,300 | a $5309 gaan 3 $1,421 $706 —_— $3,302 -$2,063 $7,410 -$30,000 +$7,814 gi ssi $148,643 mNet Income (Loss) Provision for Loan Loss 2008 2009 §=Q12010 Q22010 Q3201
Slide 7: Core Deposit Franchise
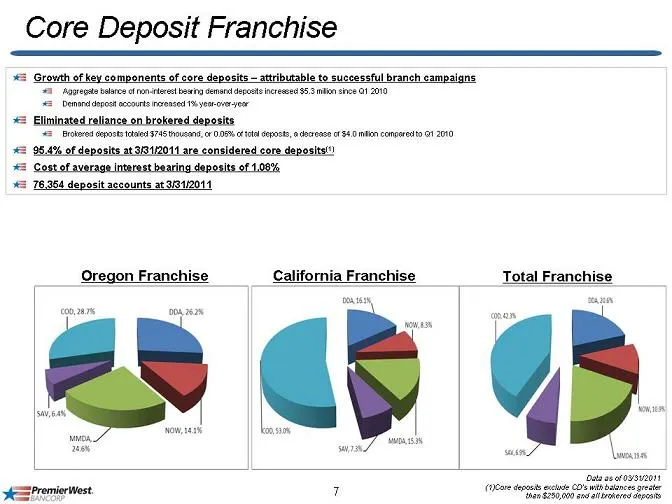
Core Deposit Franchise 42 Growth of key components of core deposits — attributable to successful branch campaigns “1 Rarepts bos lon tel bang de Gepost htesee 53min shee GI 200 « “Sols ecposts tte 746 ovens 005% tel epost, adoaeas ef $4 cemged 2010 e jeposi sidered c 0 ‘+S Gost of average interest b
Slide 8: Banking Footprint with Strong Market Share
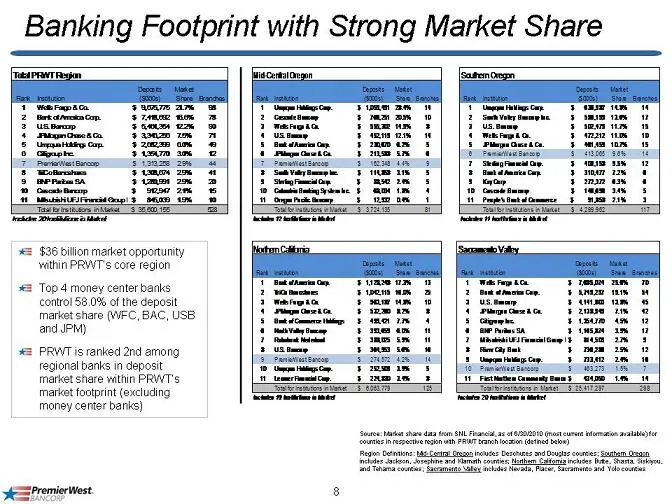
Banking Footprint with Strong Market Share i a i ' UE FERED ET i i | t 2 $26 billion market opportunity vathin PRWT's core region 42 Top 4 money center banks contro! 58.0% of the deposit market share (WEC, BAC, USB. ‘and JPM) 4 PRWTis ranked 2nd among regional banks in deposit market share within PR
Slide 9: Liquidity Profile
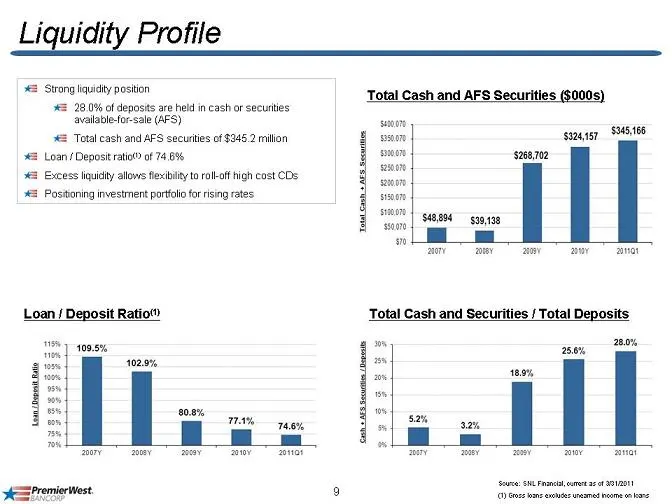
Liquidity Profile 4 Strong liquidity position 2 28.0% of deposits are held in cash or secures avallable-or-sale (APS) 4 Total cash and AFS secures of $346 2 milion % Loan (Deposit ratio of 74.6% 42 Excess liquidity allows fexiity to rolLaft high cost CDs 2 Positoning investment porto for rising rate
Slide 10: Loan Portfolio by Region (funded and unfunded)
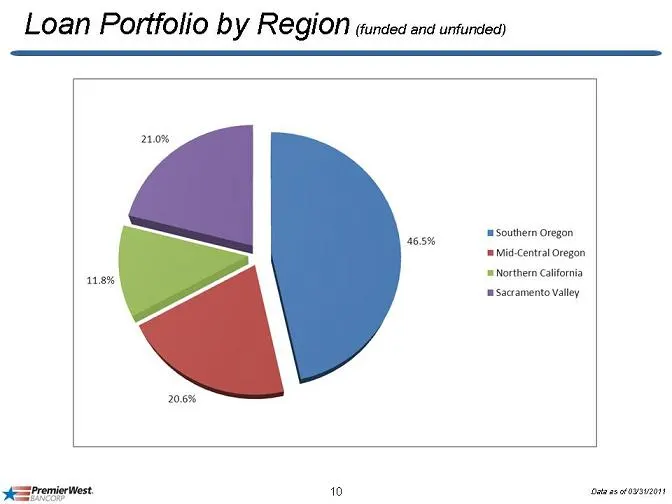
Loan Portfolio by REgiION (unded and untundea) ‘= Southern Oregon ‘= Mid-Central Oregon ‘= Northern California. sacramento Valley 10 ots oetayv2004
Slide 11: Diversification Continues in the Loan Portfolio
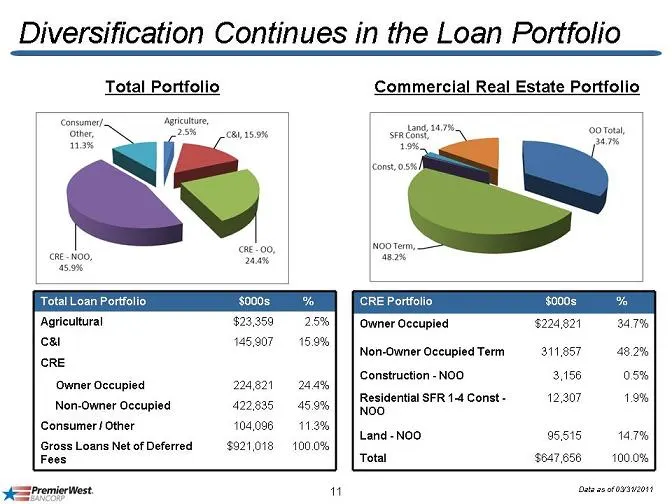
Diversification Continues in the Loan Portfolio Total Portfolio Commercial Real Estate Portfolio Consumer Tate, other, 23% | cm.150% / 13% sa 207%, 19%, (cons, 05% ni 0 Tot are Total Loan Portfolio Agricultural $23,358 cal 445.907 CRE Owner Occupied 224821 Non-Owner Occupied 422,836 Consumer! Other
Slide 12: Reduction in CRE Concentration
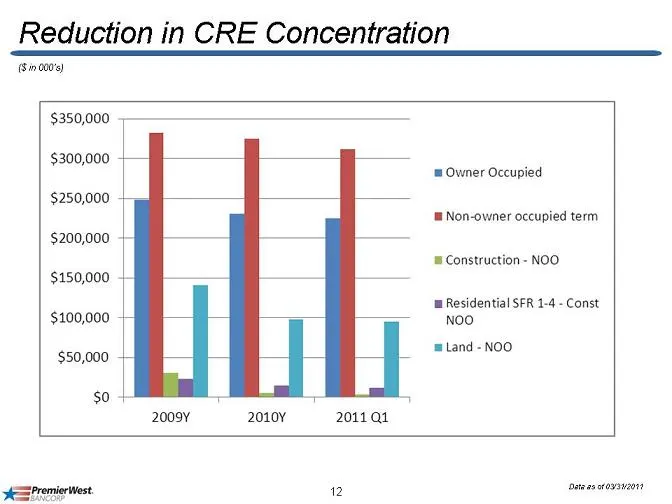
Reduction in CRE Concentration (Sina) $350,000 $300,000 + Owner Occupied $250,000 -—pl Non-ovwner occupied term $200,000 = Construction - NOO $150,000 Residential SFR 1-4 - Const $100,000 - Noo $50,000 +4 = Land - NOO $0 2009¥ 2010¥ 2011 Q1 isan eovavzor
Slide 13: Credit Quality
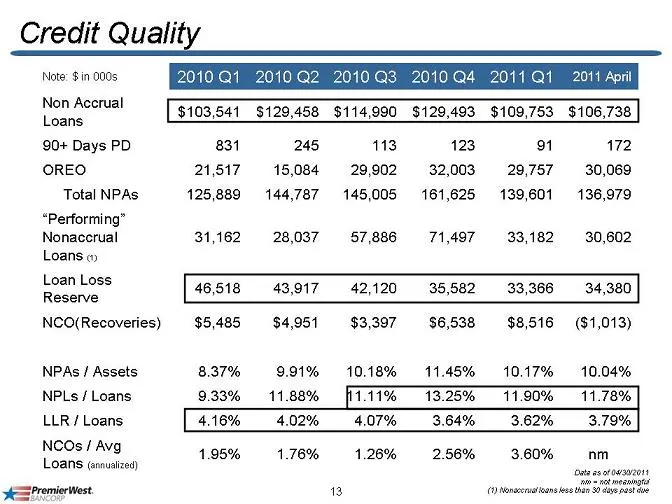
Credit Quality Noe: $ in 000s 2010.Q1 2010 Q2 20103 2010Q4 2011Q1 2011 Apri pees $103,541 $129,458 $114,990 $129,493 $109,753 $106,738 90+ Days PD 831 245 113 123 1 172 OREO 21517 16,084 29,902 32,003 29,787 30,069 Total NPAs 128,889 144,787 145,005 161,625 139,601 136,979 “Performing” Nonaccrual 31
Slide 14: Geography of Credit Issues
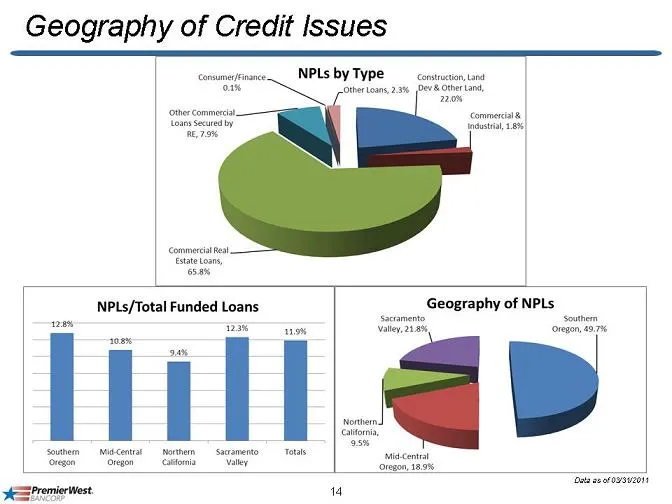
Geography of Credit Issues NPLs by Type NPLs/Total Funded Loans Geography of NPLs ne a aye vate ‘een Mc tr sant PremierWest 14
Slide 15: Update on PremierWest
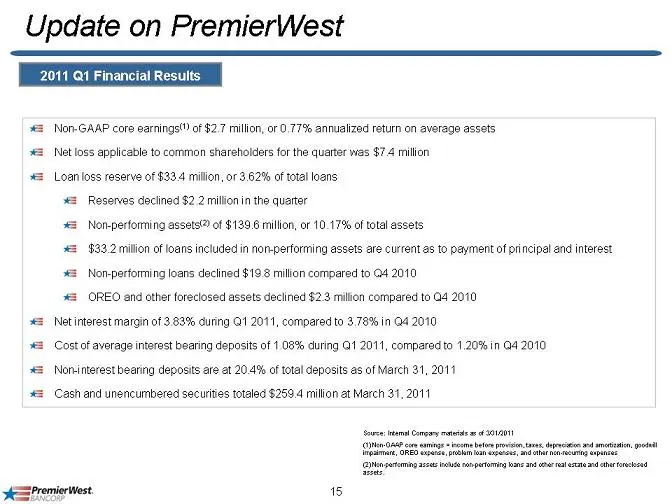
Update on PremierWest 4 Non-GAAP core earnings¢” of $2 7 millon, or 0.77% annualized return on average assets i) Net loss applicable to common shareholders for the quarter was $7.4 milion h Loan oss reserve of $38.4 milion, or 3.62% of tot loans 4 Reserves declined $2 2 milion in the quarter 42 Non-
Slide 16: Long-Term Strategic Initiatives
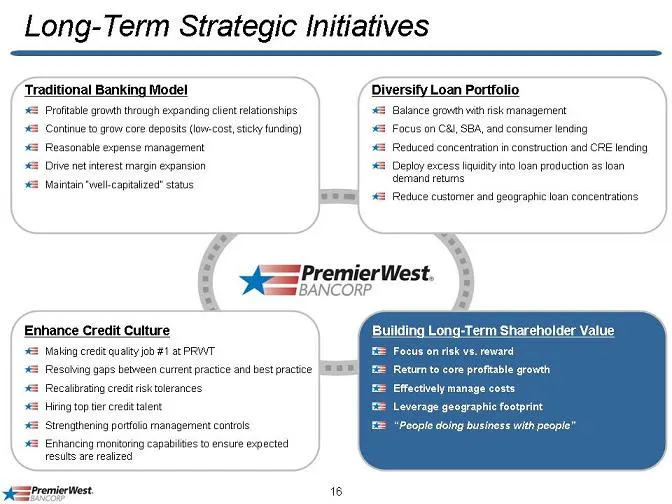
Long-Term Strategic Initiatives / Traditional Banking Model Diversify Loan Portfolio + Proftable growth through exsanding client relationships 42 Balance growth with risk management = Continue to grow core deposits (low-cost, sticky funding) 4 Focus on C8, SBA, and consumer lending 4 Reasonable expe
Slide 17: Capital Snapshot — PremierWest Bank
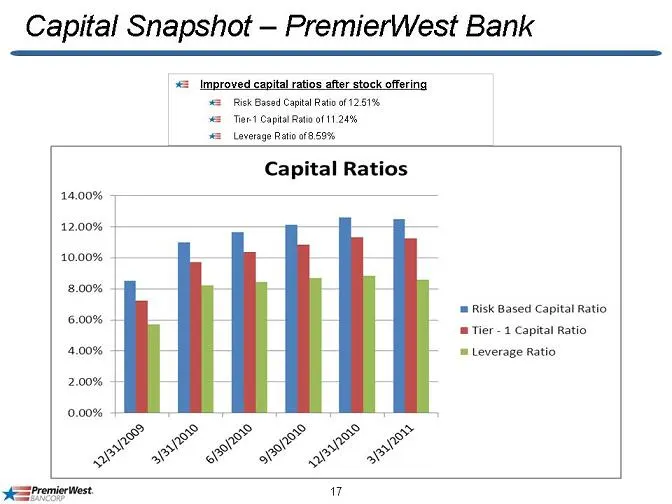
Capital Snapshot — PremierWest Bank P= Improved capital ratios after stock offeri 6S Risk Based Capital Rati of 251% 42 Tort Capita Ratio of 11.24% #2 _Lovorage Ratio of 59% Capital Ratios 1 Risk Based Capital Ratio Tier - 1 Capital Ratio Leverage Ratio
Slide 18: Ownership
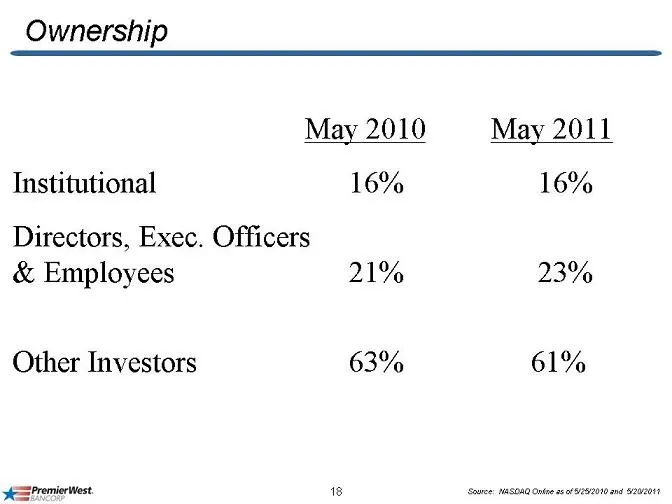
Ownership May 2010 May 2011 Institutional 16% 16% Directors, Exec. Officers & Employees 21% 23% Other Investors 63% 61%
Slide 19: 2011 - 2012 Plans
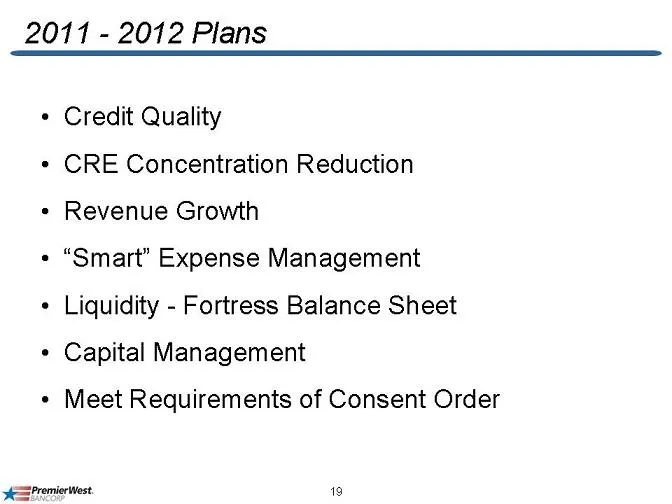
2011 - 2012 Plans * Credit Quality + CRE Concentration Reduction + Revenue Growth + “Smart” Expense Management ¢ Liquidity - Fortress Balance Sheet * Capital Management + Meet Requirements of Consent Order
Slide 20: Key Consent Order Requirements
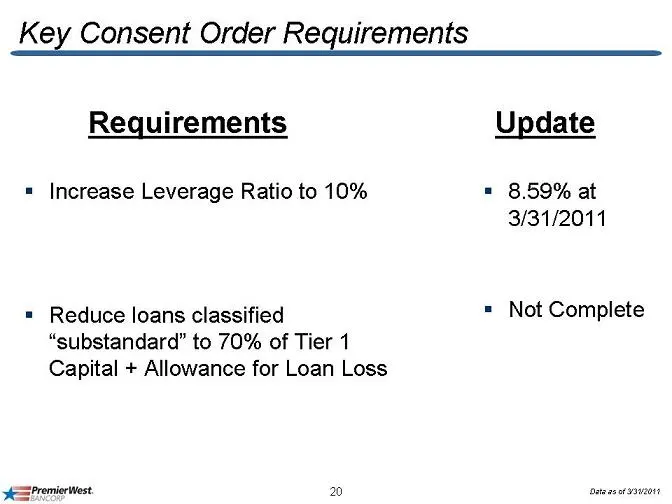
Key Consent Order Requirements Requirements Update = Increase Leverage Ratio to 10% = 8.59% at 3/31/2011 = Reduce loans classified = Not Complete “substandard” to 70% of Tier 1 Capital + Allowance for Loan Loss
Slide 21: Proposals for Action by Shareholders
Proposals for Action by Shareholders
Slide 22: Proposal: Election of Board Members
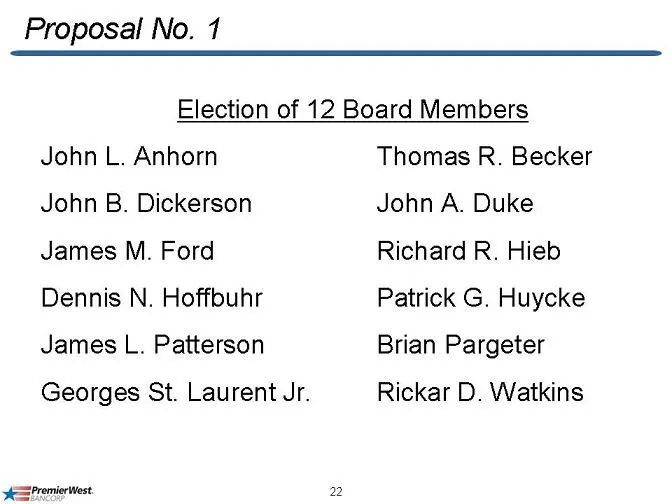
Proposal No. 1 Election of 12 Board Members John L. Anhorn John B. Dickerson James M. Ford Dennis N. Hoffouhr James L. Patterson Georges St. Laurent Jr. Thomas R. Becker John A. Duke Richard R. Hieb Patrick G. Huycke Brian Pargeter Rickar D. Watkins
Slide 23: Proposal: Advisory Vote on Executive Compensation
Proposal No. 2 Non-binding, Advisory Vote On Executive Compensation
Slide 24: Proposal: Approval of the 2011 Stock Incentive Plan
Proposal No. 3 Approval of the 2011 Stock Incentive Plan
Slide 25: Proposal: Ratify Appointment of Moss Adams LLP
Proposal No. 4 Ratify Appointment of Moss Adams LLP as Independent Public Accountants

Slide 26: VOTE
VOTE
Slide 27: PremierWest Bancorp
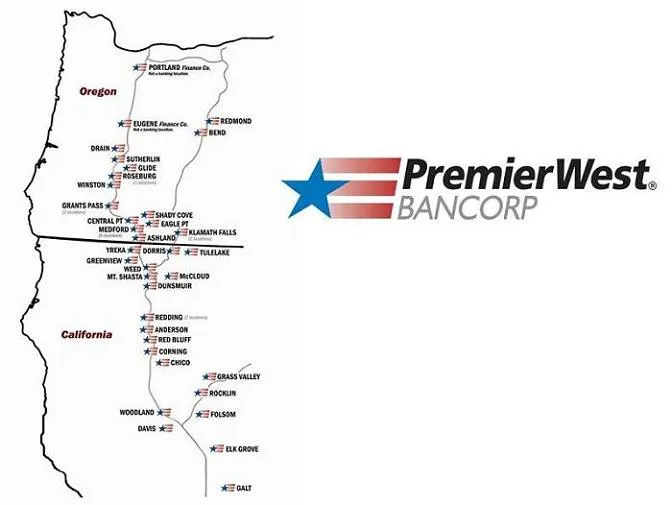
yie= PremierWest. sams BANCORP
Source: SEC EDGAR · 8-K filed May 26, 2011
More decks from PremierWest Bancorp
 Shareholder Meeting (May 2010)29 slides · May 28, 2010
 D.A. Davidson & Co. Annual Financial Services Conference 201027 slides · May 12, 2010
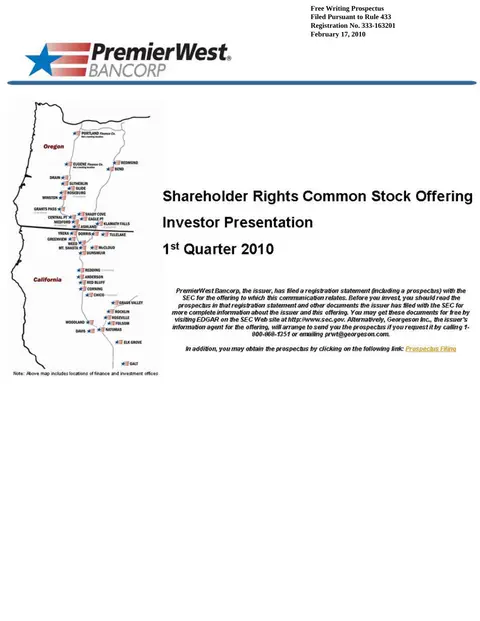 IPO Roadshow (February 2010)28 slides · Feb 18, 2010
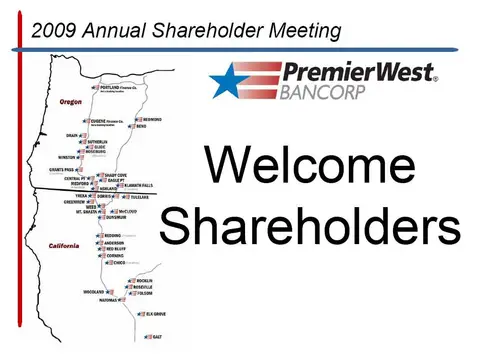 Shareholder Meeting (June 2009)27 slides · Jun 24, 2009
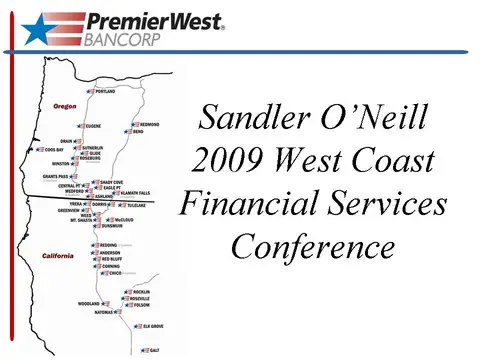 Sandler O'Neill 2009 West Coast Financial Services Conference16 slides · Feb 26, 2009
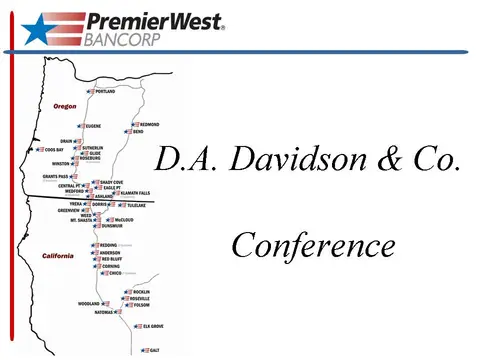 D.A. Davidson & Co. Conference (February 2009)13 slides · Feb 19, 2009