PremierWest Bancorp — IPO Roadshow (February 2010)
28 slides from PremierWest Bancorp's IPO roadshow presentation, Feb 18, 2010
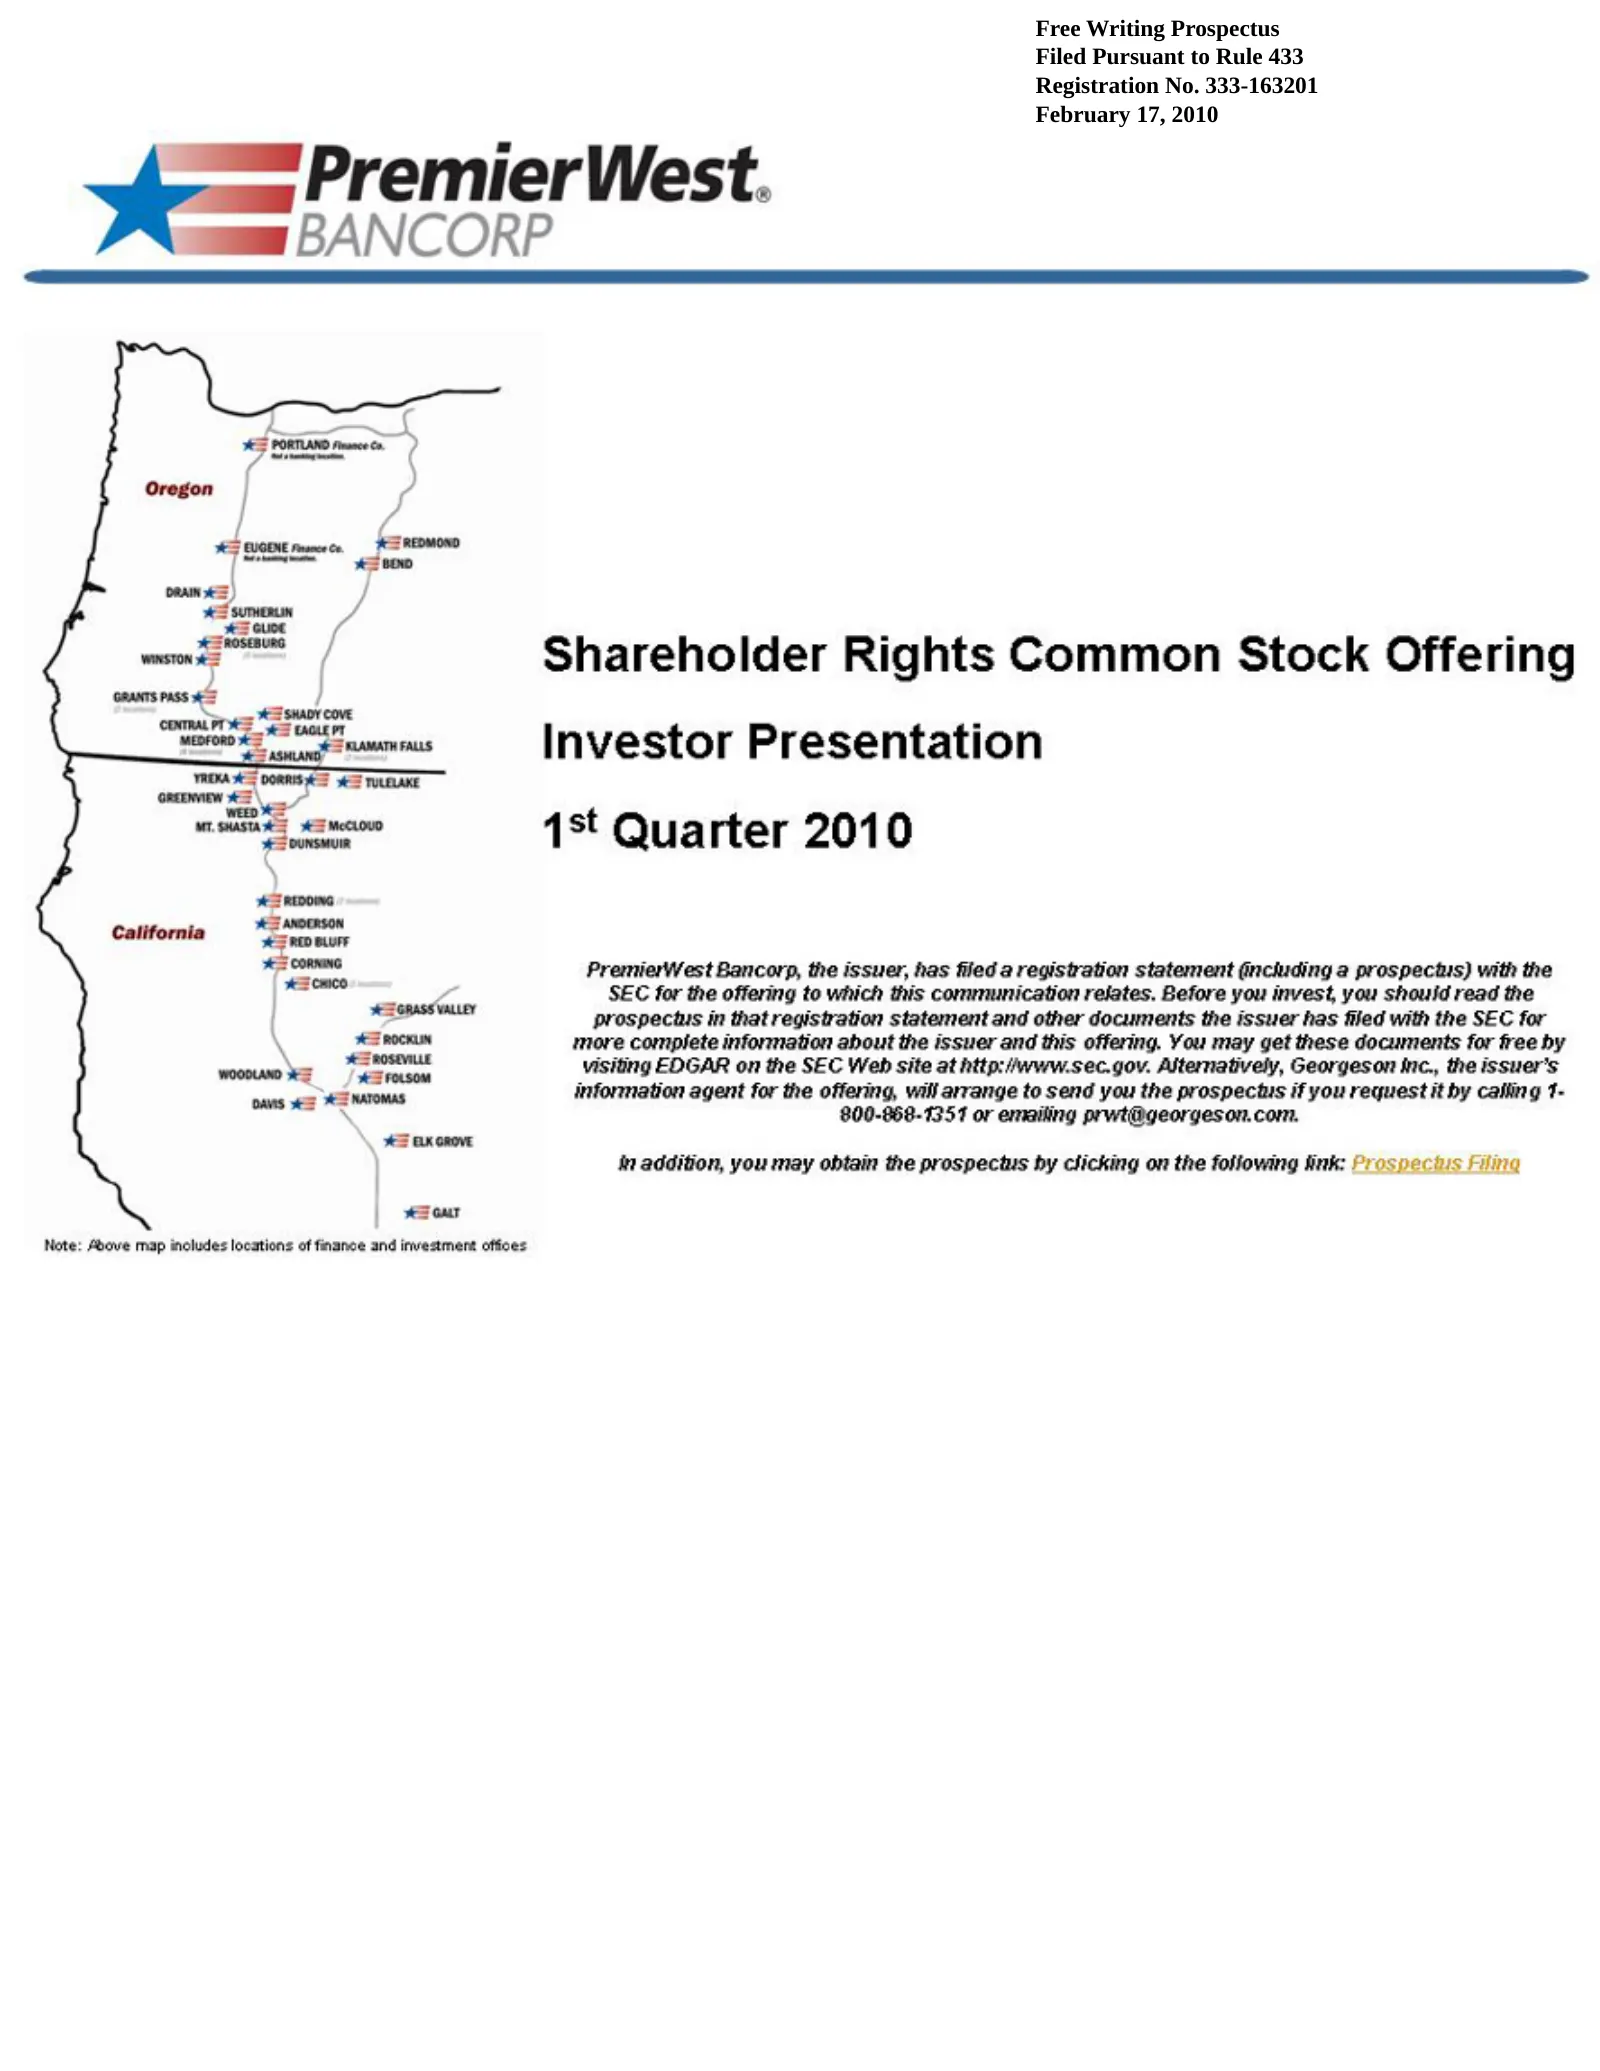
Slide 1: Free Writing Prospectus Filed Pursuant to Rule 433
Free Writing Prospectus Filed Pursuant to Rule 433 Registration No. 333-163201 February 17, 2010 Filed Registration February FREE (To Shareholder BANCORP PremierWest® Investor 1st PremierWest registration site In prwt@georgeson.com. Note: addition, Quarter Prospectus atPursuant Above http://www.sec.
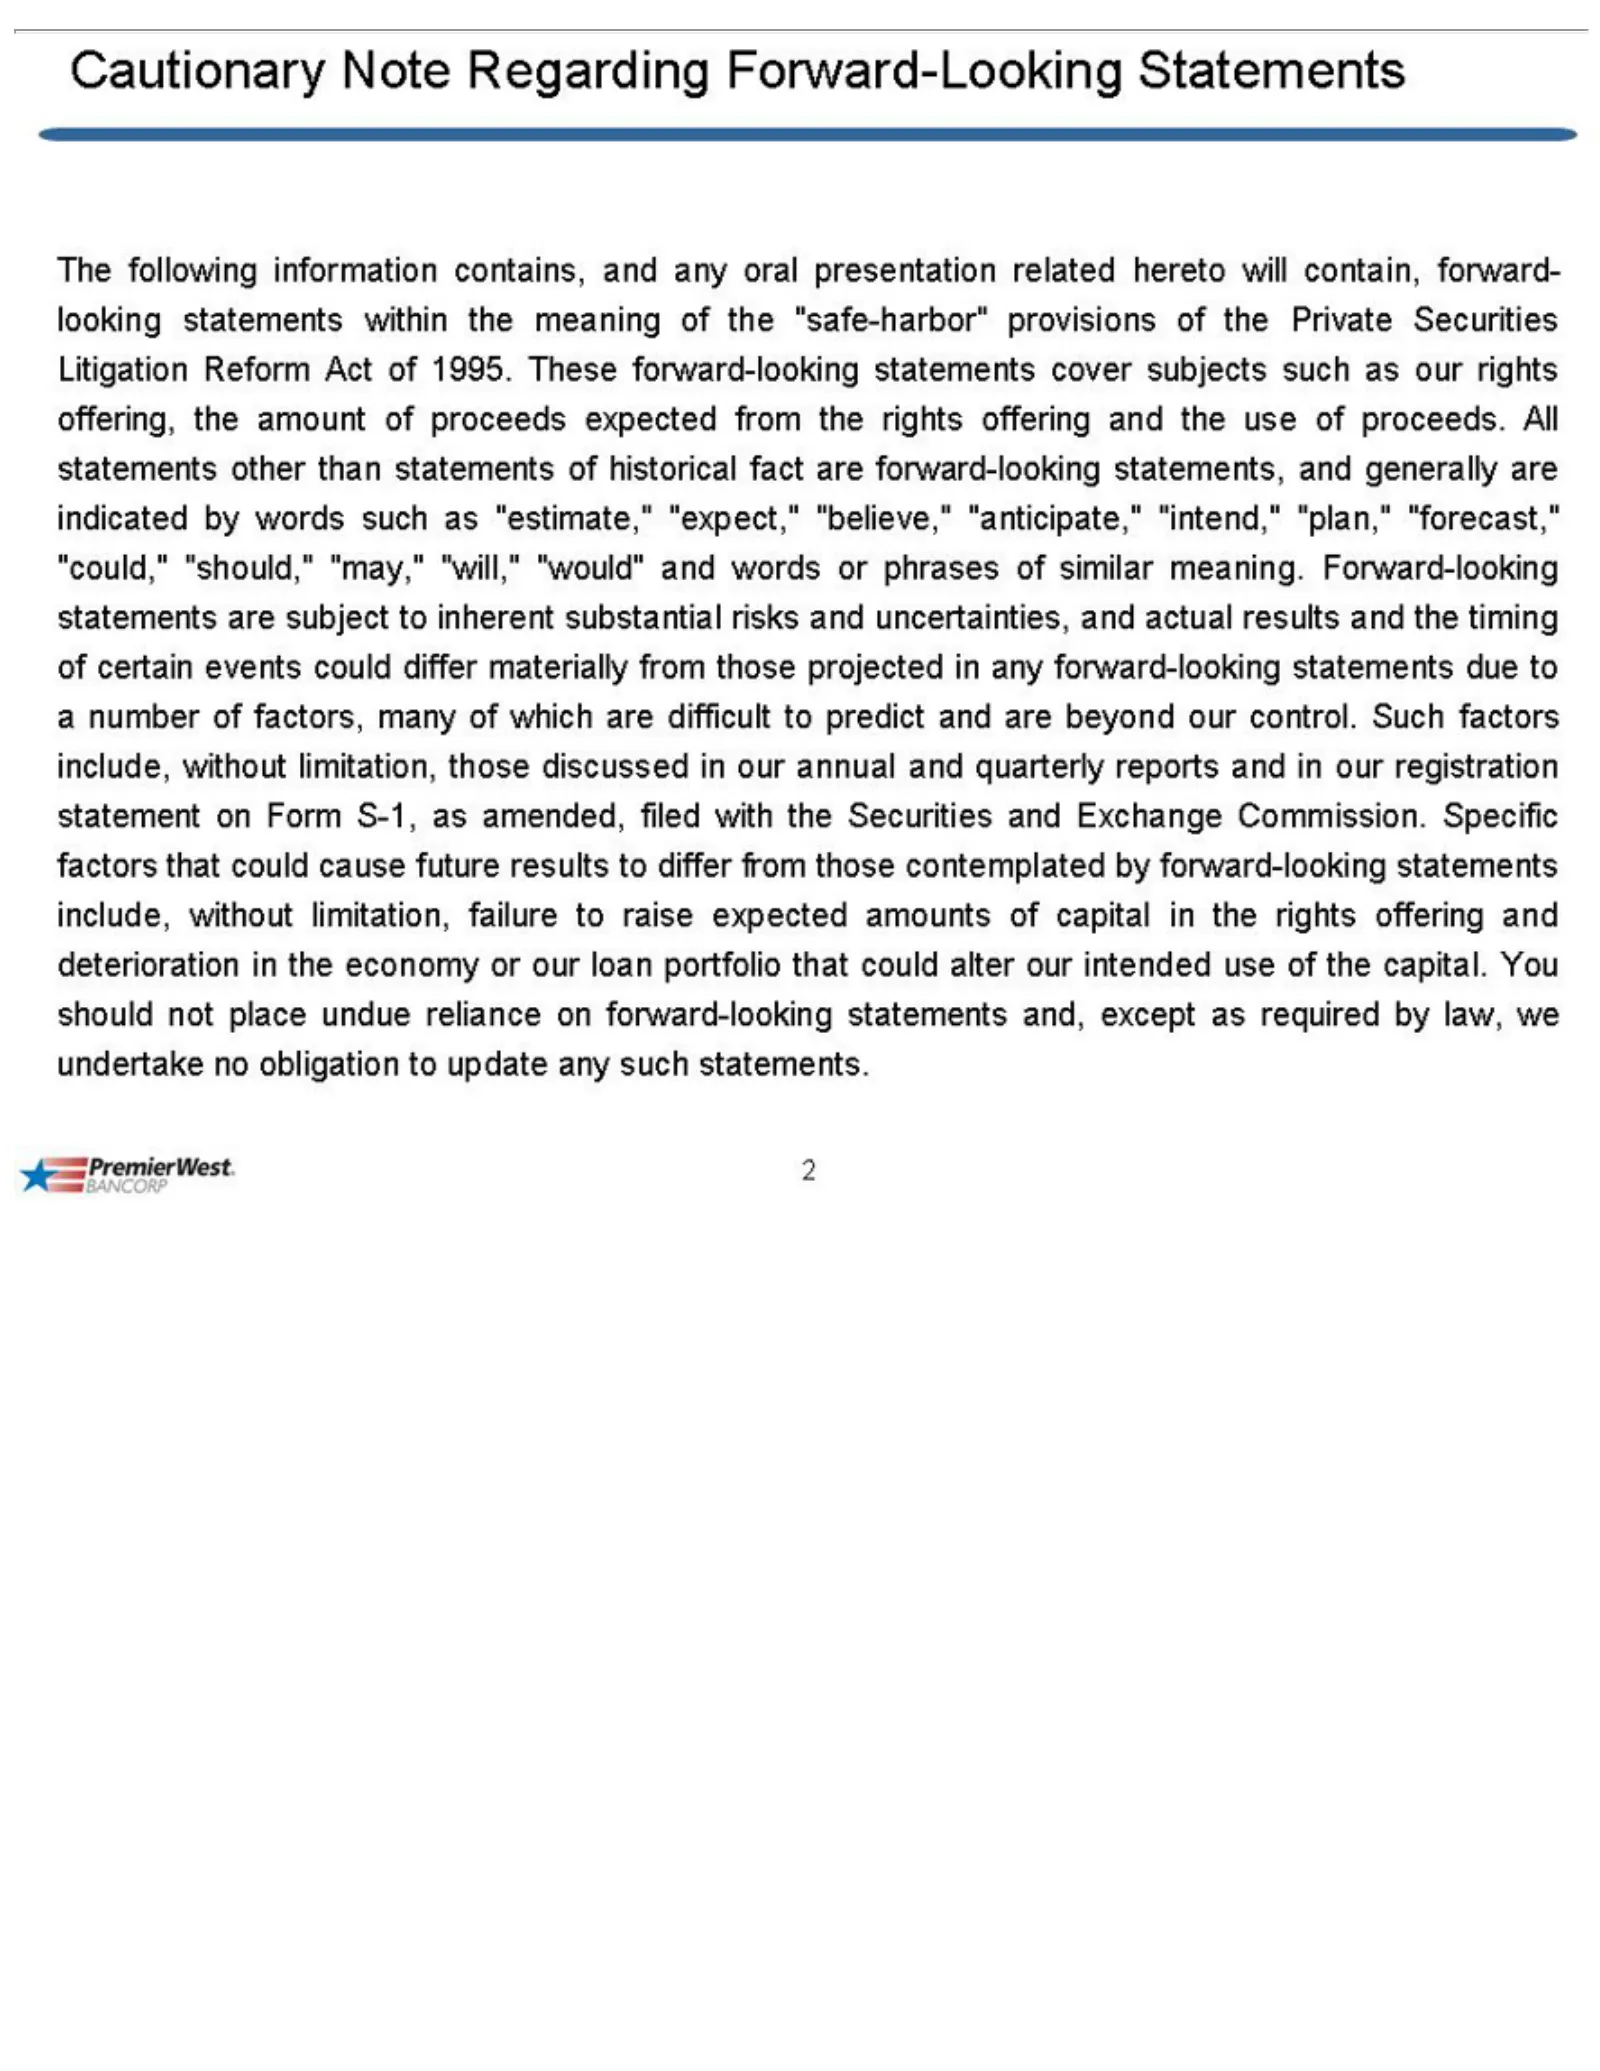
Slide 2: Cautionary Note Regarding Forward-Looking Statements
Cautionary The of fact phrases forward-looking in statements 2not our 1995. place are following registration forward-looking of These undue similar include, Note information forward-looking reliance statements Regarding meaning. statement without on statements, contains, limitation, forward-looking
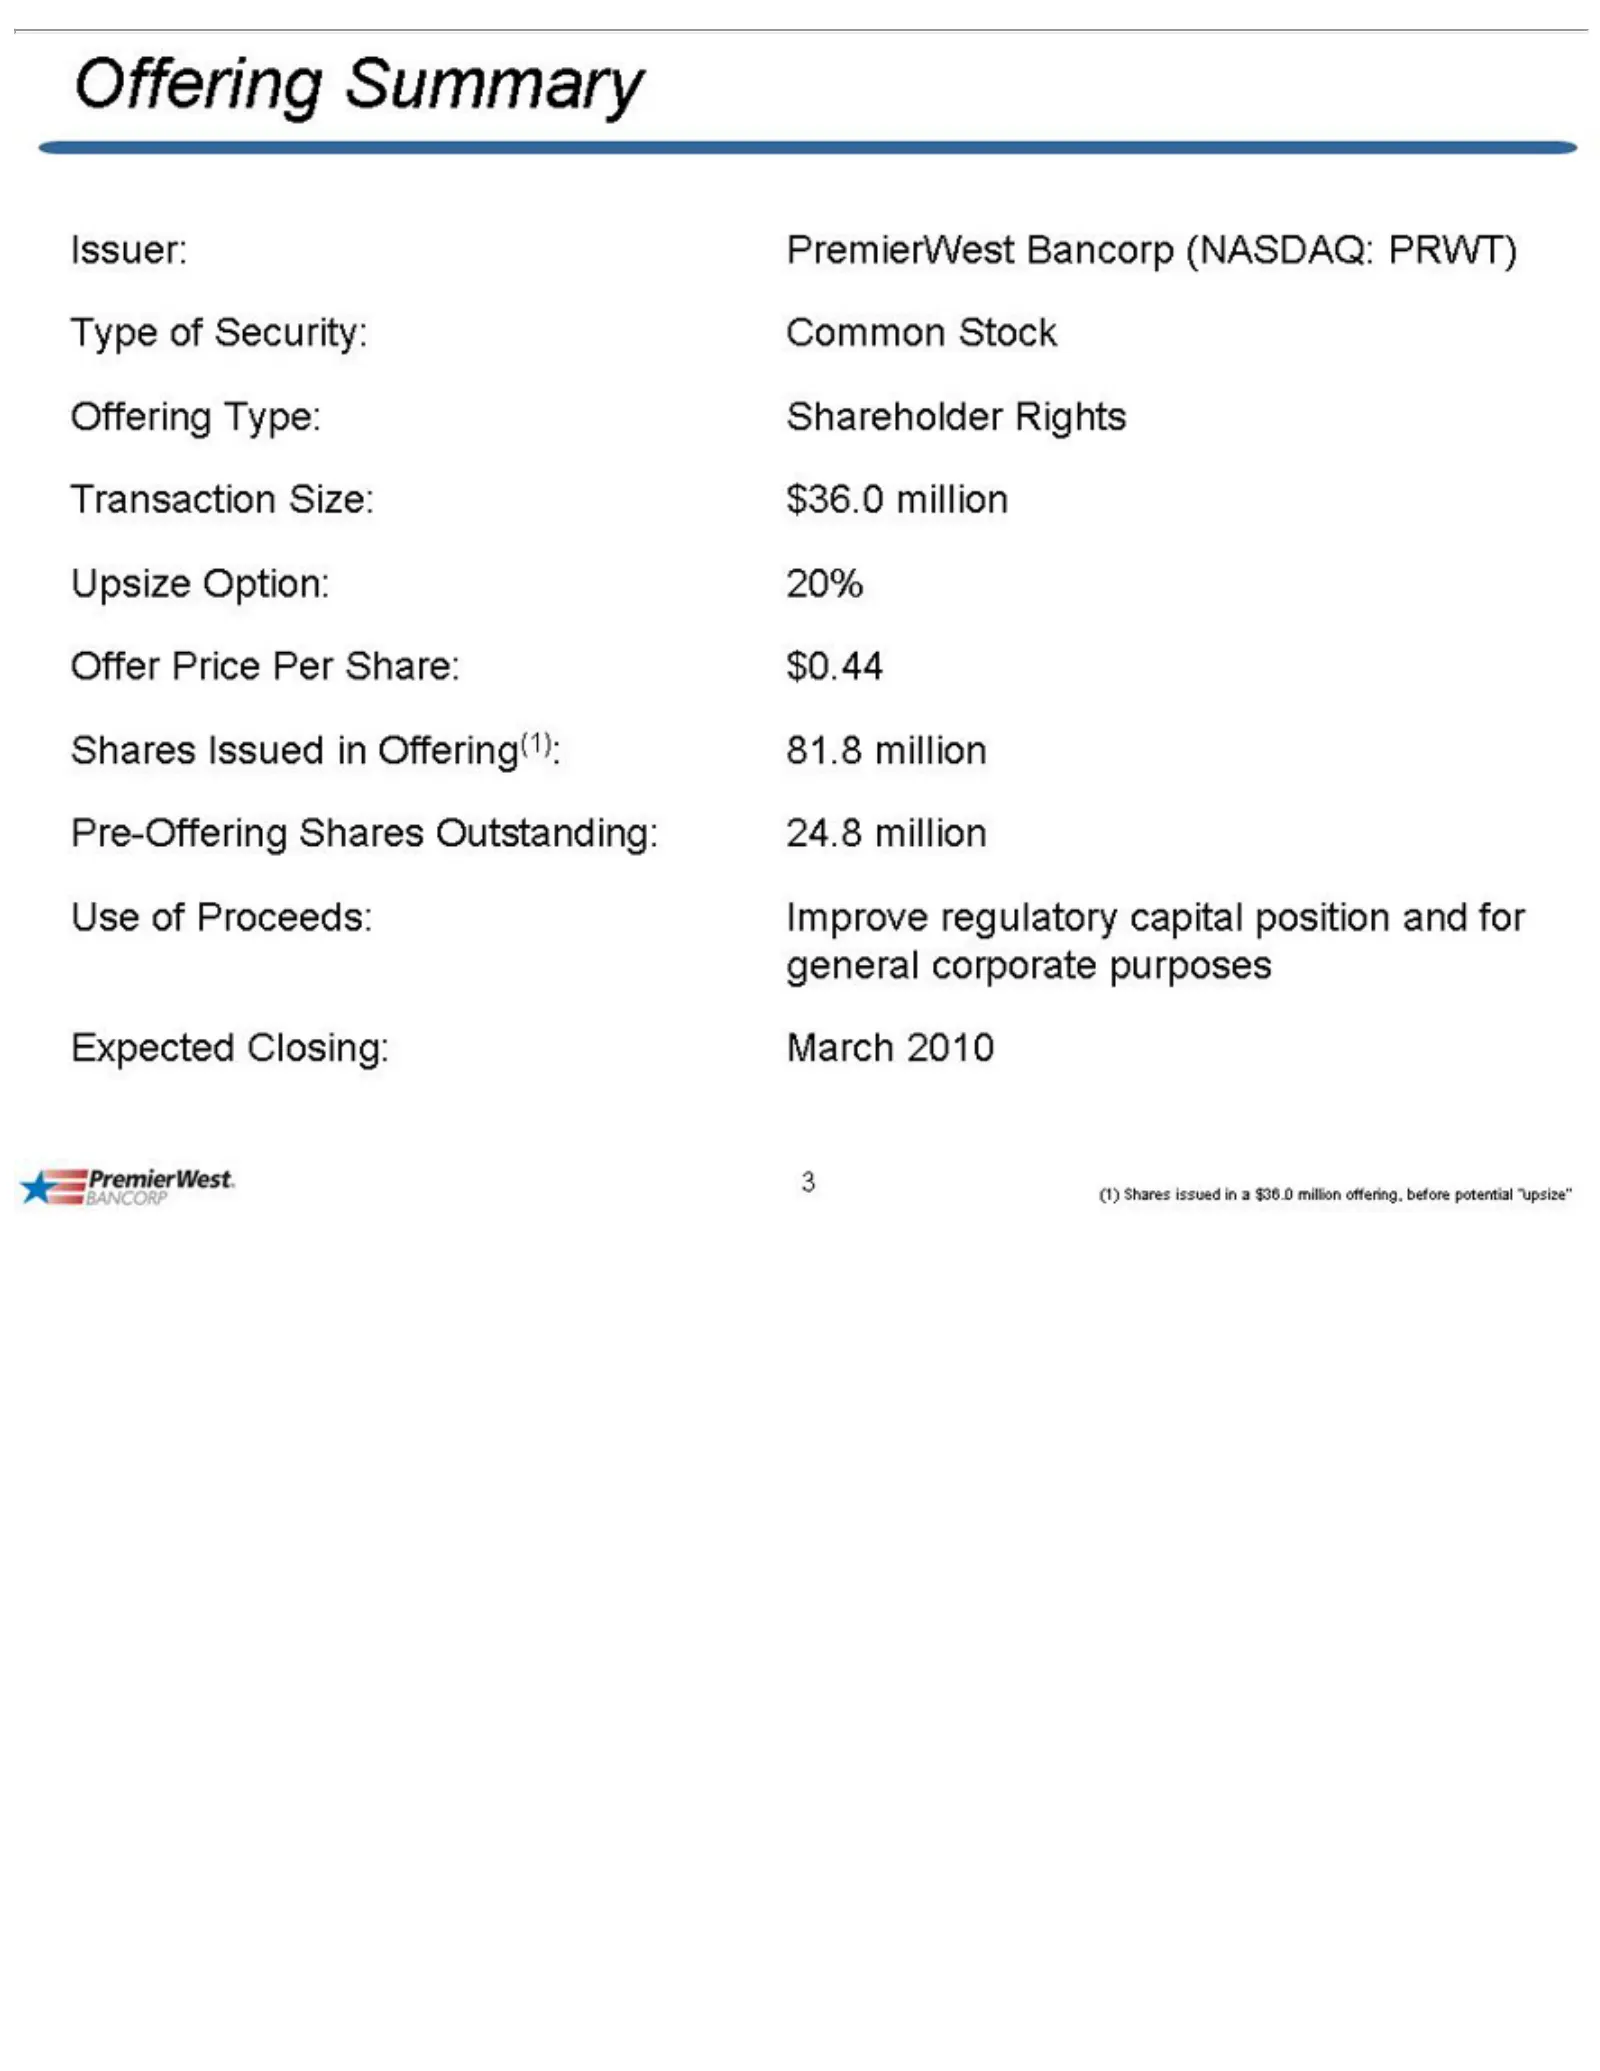
Slide 3: PremierWest Bancorp Shareholder Rights Offering Transaction Summary
PremierWest Issuer: Type Common Offering Shareholder Transaction $36.0 Upsize Offer 20% Shares $0.44 81.8 Pre-Offering 24.8 Use Improve Expected March 3(1) Shares of million of Price million 2010 Proceeds: Issued Option: Security: regulatory Type: Summary Closing: Stock issued Per Size: Rights Share
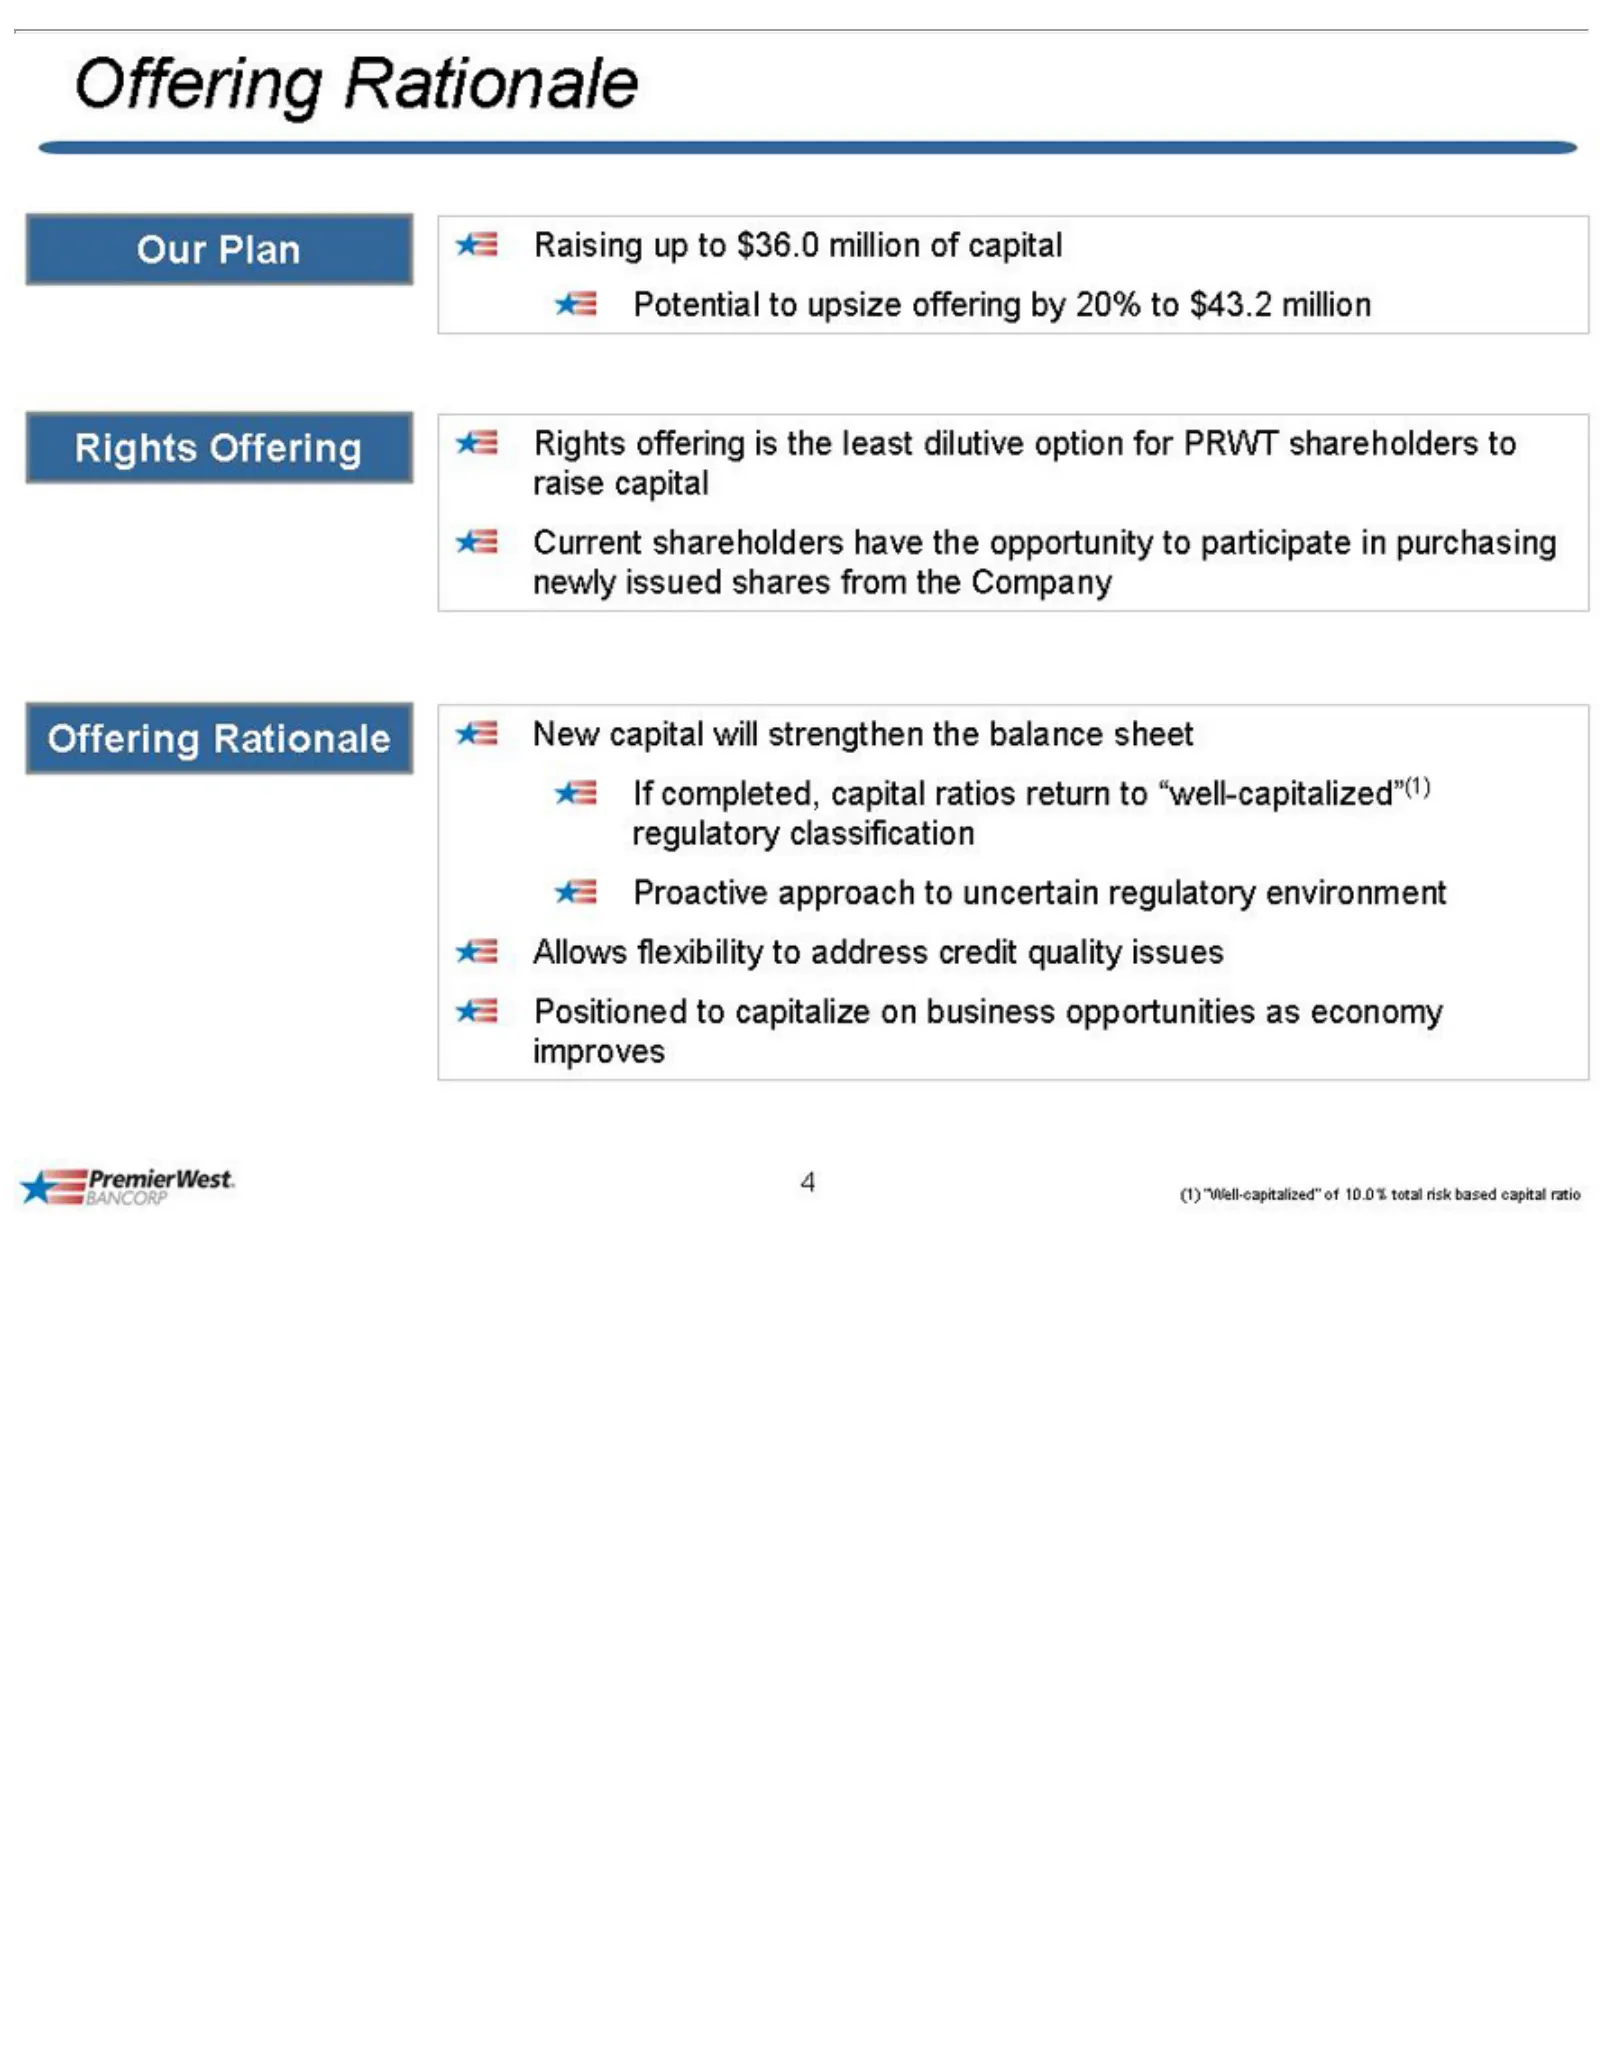
Slide 4: Our Rationale for Raising Capital
Our Raising Potential Rights Current Offering New If Proactive Allows Positioned 4(1) completed, “Well-capitalized” Plan capital Offering offering flexibility shareholders up Rationale to approach toupsize will capitalize capital $36.0 isstrengthen the tooffering to million address ratios have least
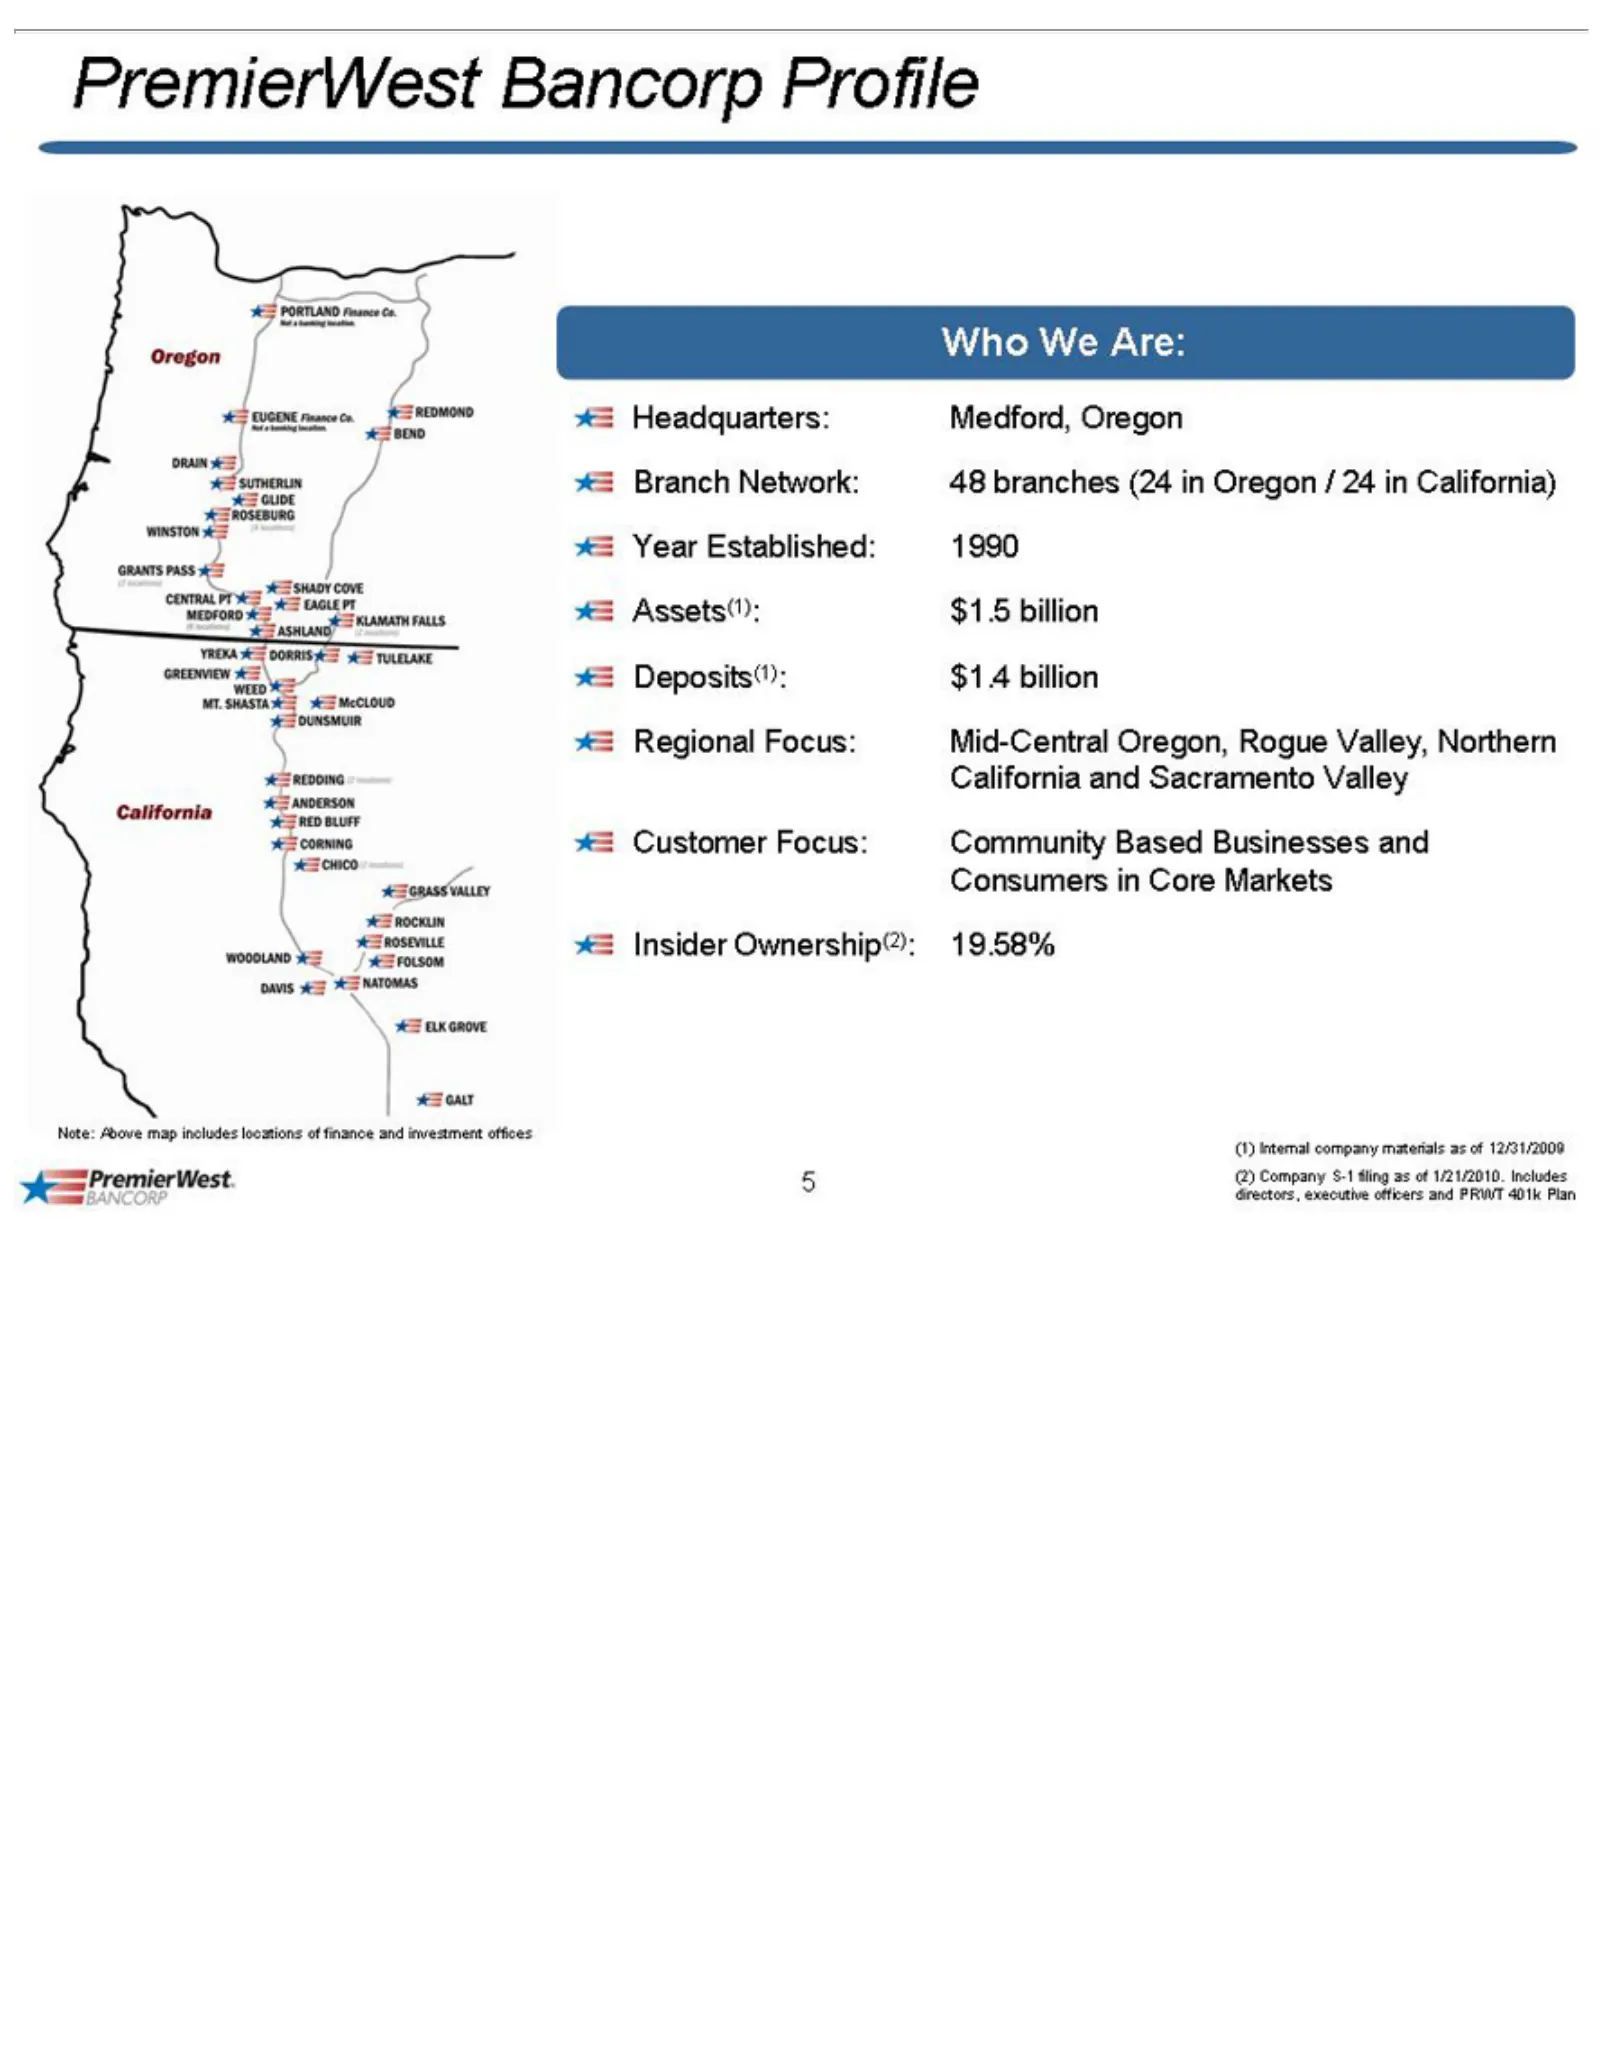
Slide 5: PremierWest Bancorp Who We Are
PremierWest Who Medford, Headquarters: Branch 48 Year $1.5 Assets(1): 1990 $1.4 Deposits(1): Regional Mid-Central California Customer Community Consumers Insider Note: 19.58% 5(1) branches Internal billion Established: We Above Ownership(2): Network: Are: Focus: Oregon Focus: and in company Based (2
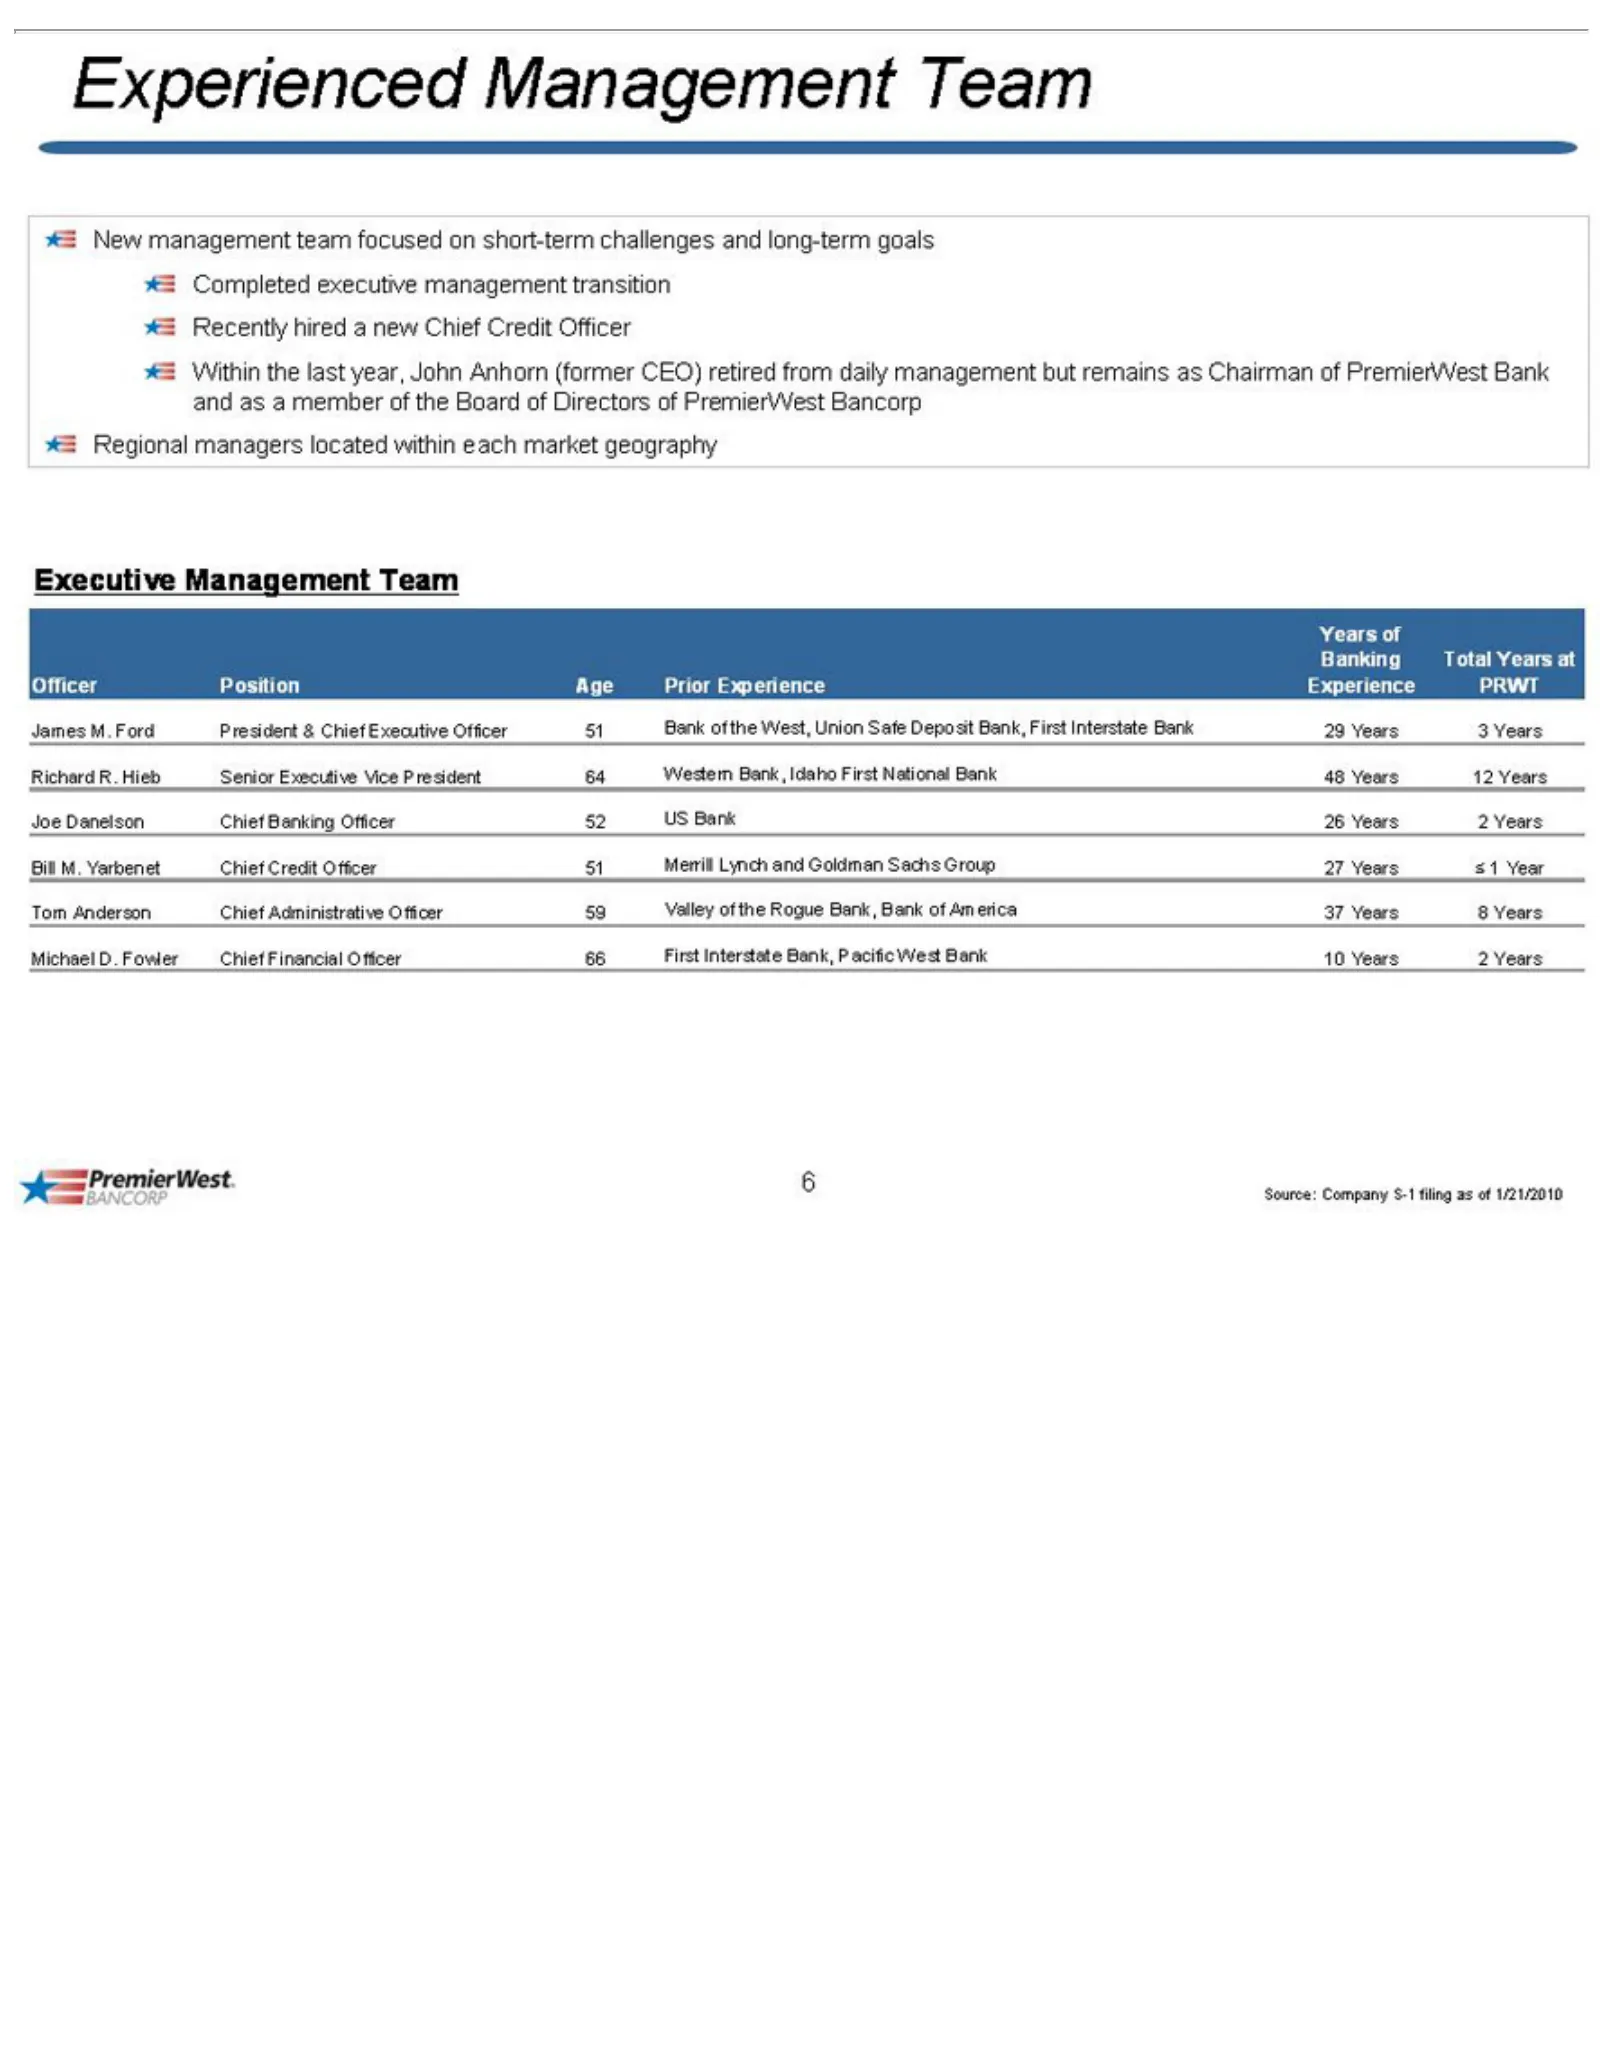
Slide 6: Experienced New Management Team Completed Transition
Experienced New Completed Recently Within Regional Executive Prior Age Position Officer Years Total James President Bank 329 Richard Senior Western 64 48 12 Joe US 52 26 Bill Merrill 51 27 £1 Tom Valley 59 837 Michael Chief First 66 210 6Source: Years Year Years Bank Danelson M. Anderson Interstate
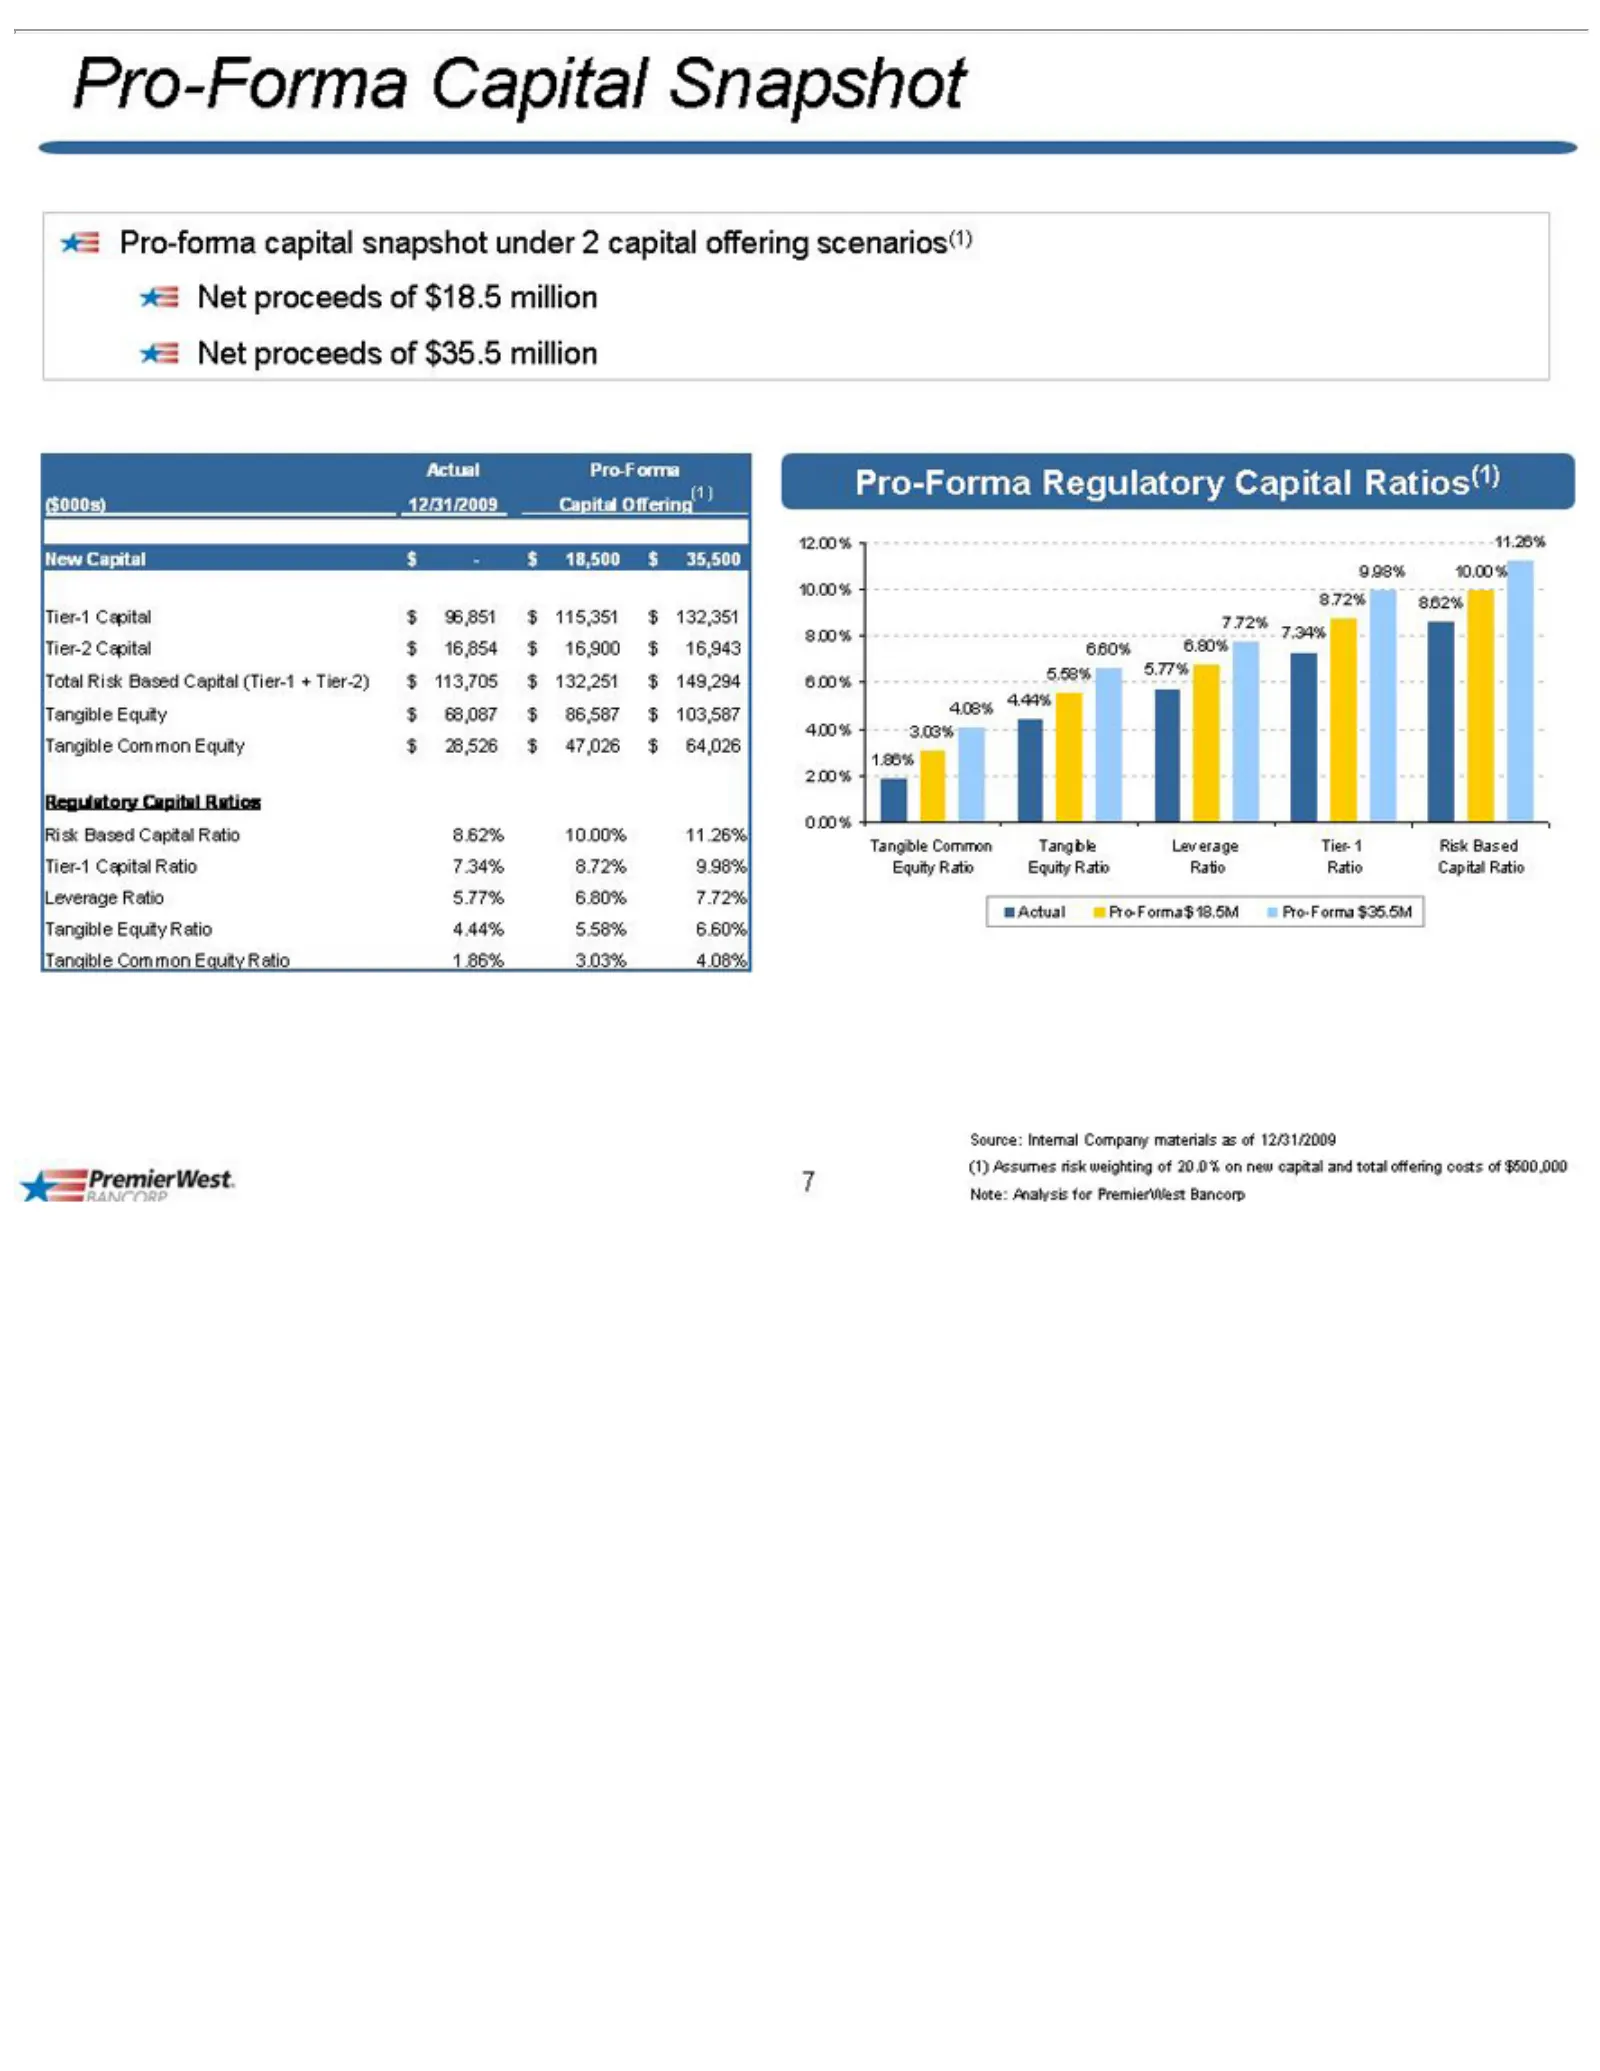
Slide 7: Pro-forma Net Capital Ratios
Pro-forma Net ($000s) New $35,500 $18,500 $— Tier-2 $132,351 $115,351 $96,851 Total $16,943 $16,900 $16,854 $149,294 $132,251 $113,705 $103,587 $86,587 $68,087 Regulatory $64,026 $47,026 $28,526 8.62% 6.80% 5.77% Pro-Forma 12.00% 8.72% 10.00% 9.98% 11.26% 6.60% 7.34% 7.72% 5.58% 1.86% 3.03% 4.08% 4.
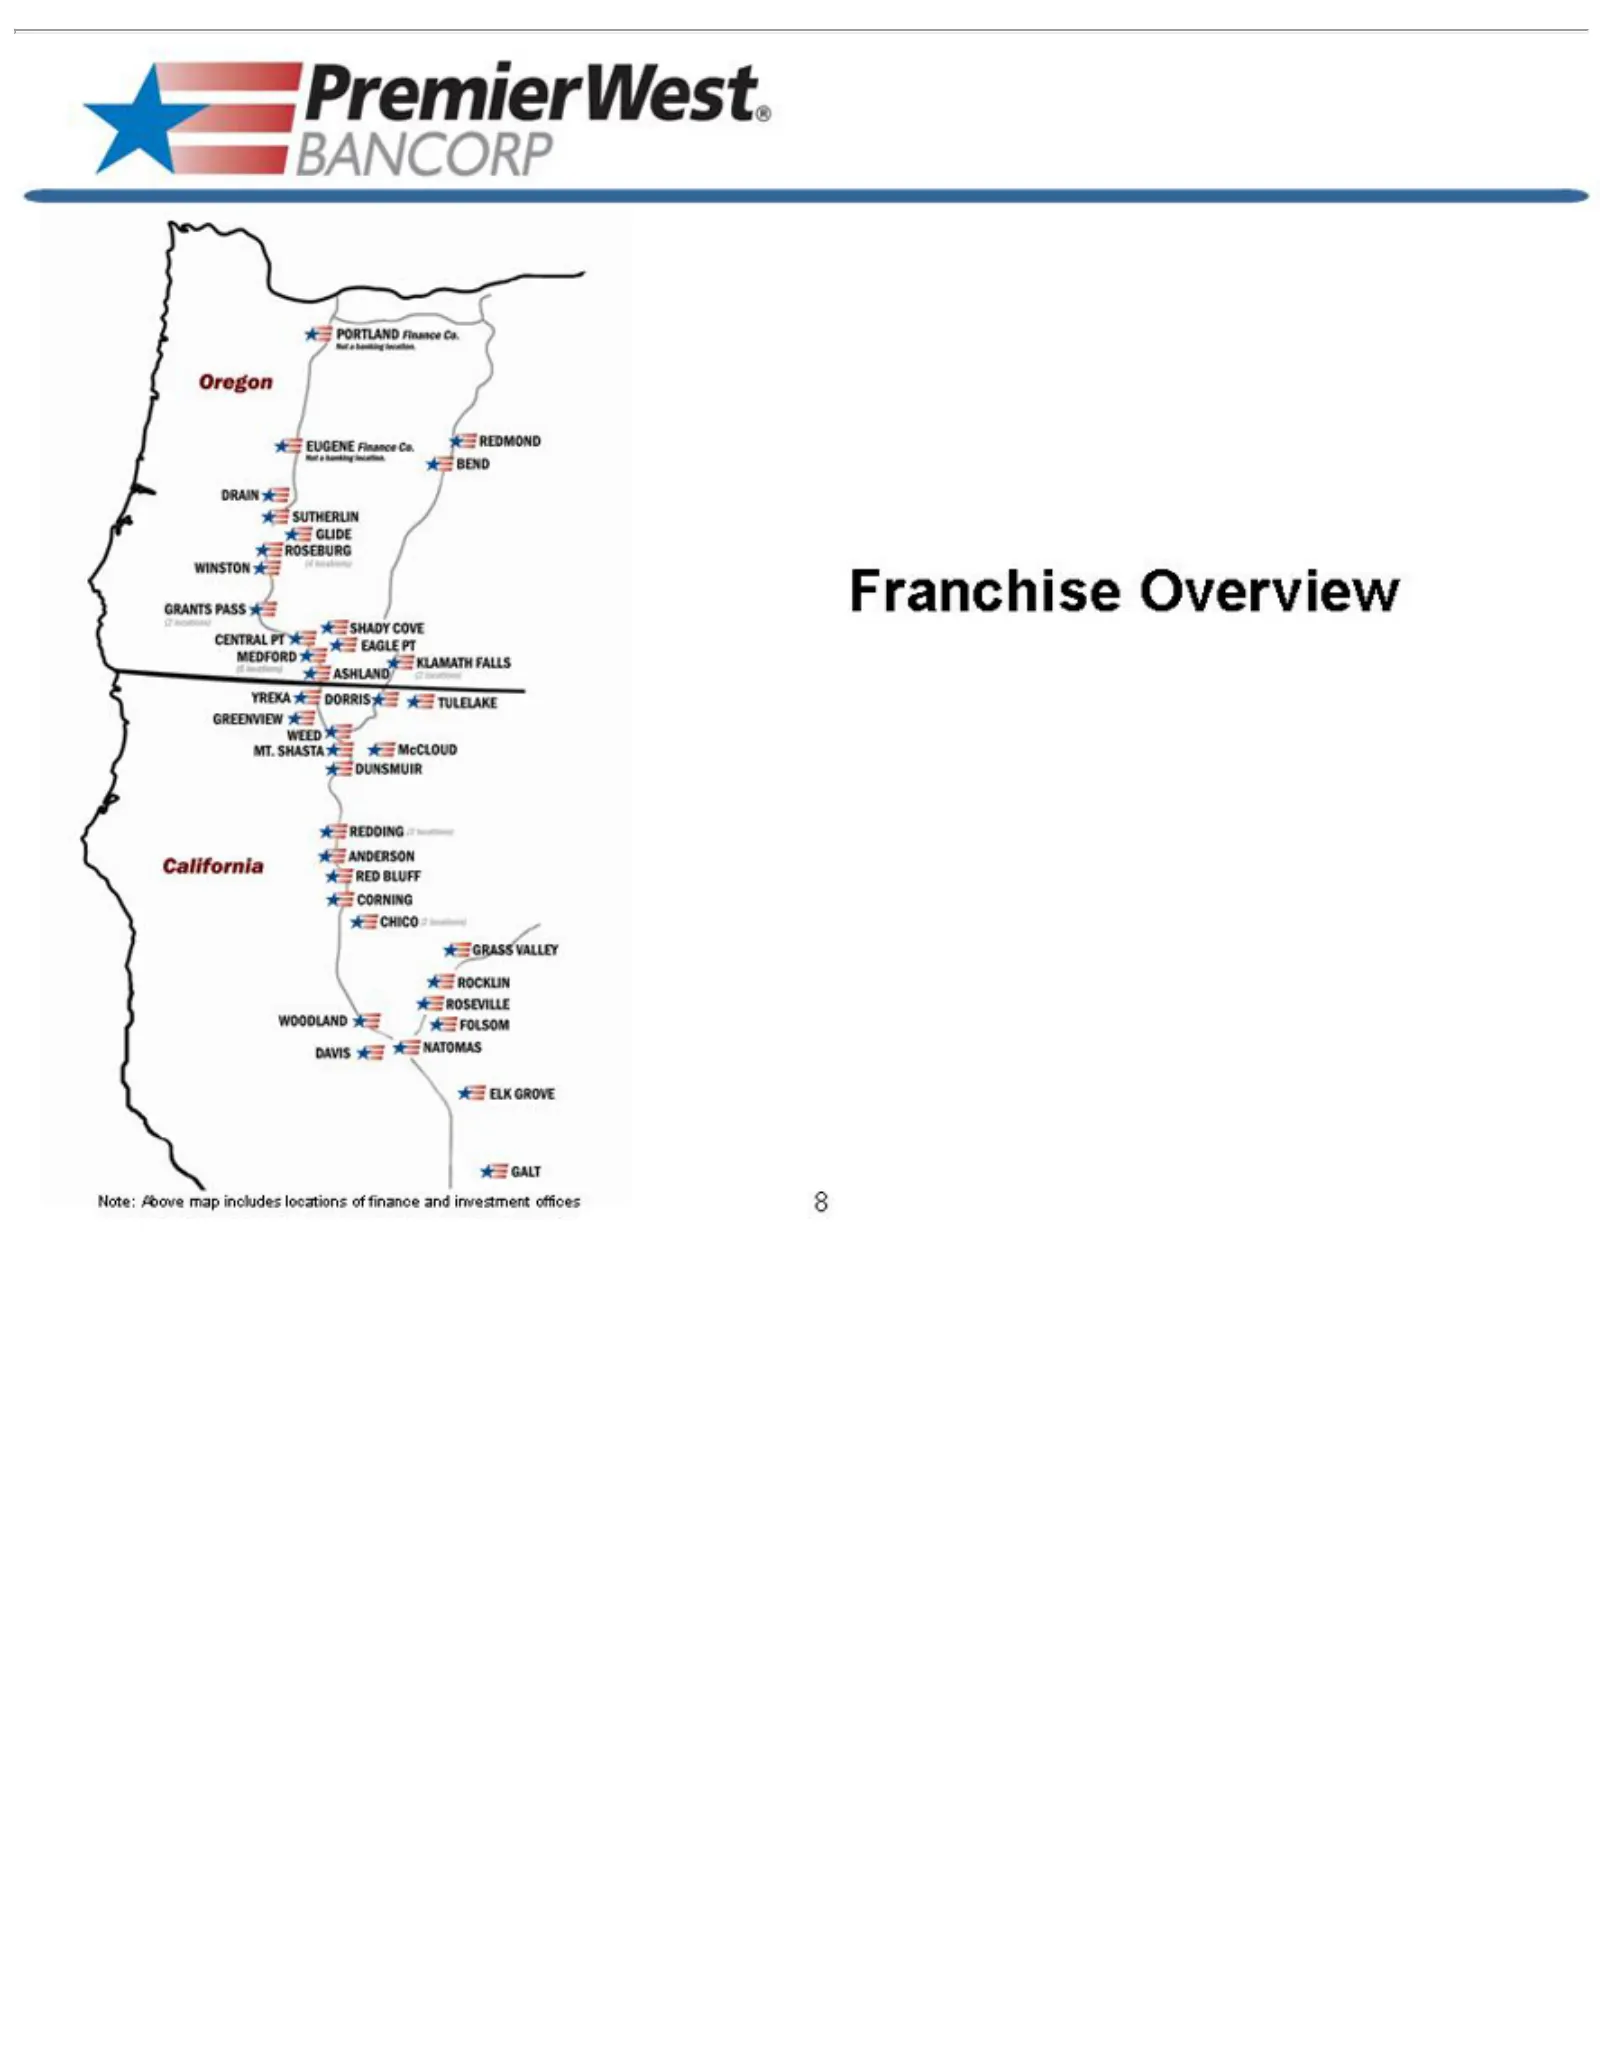
Slide 8: Franchise Overview
Franchise BANCORP PremierWest 8Note: Above Overview map includes locations of finance and investment offices
Slide 9: Attractive Geographic Footprint
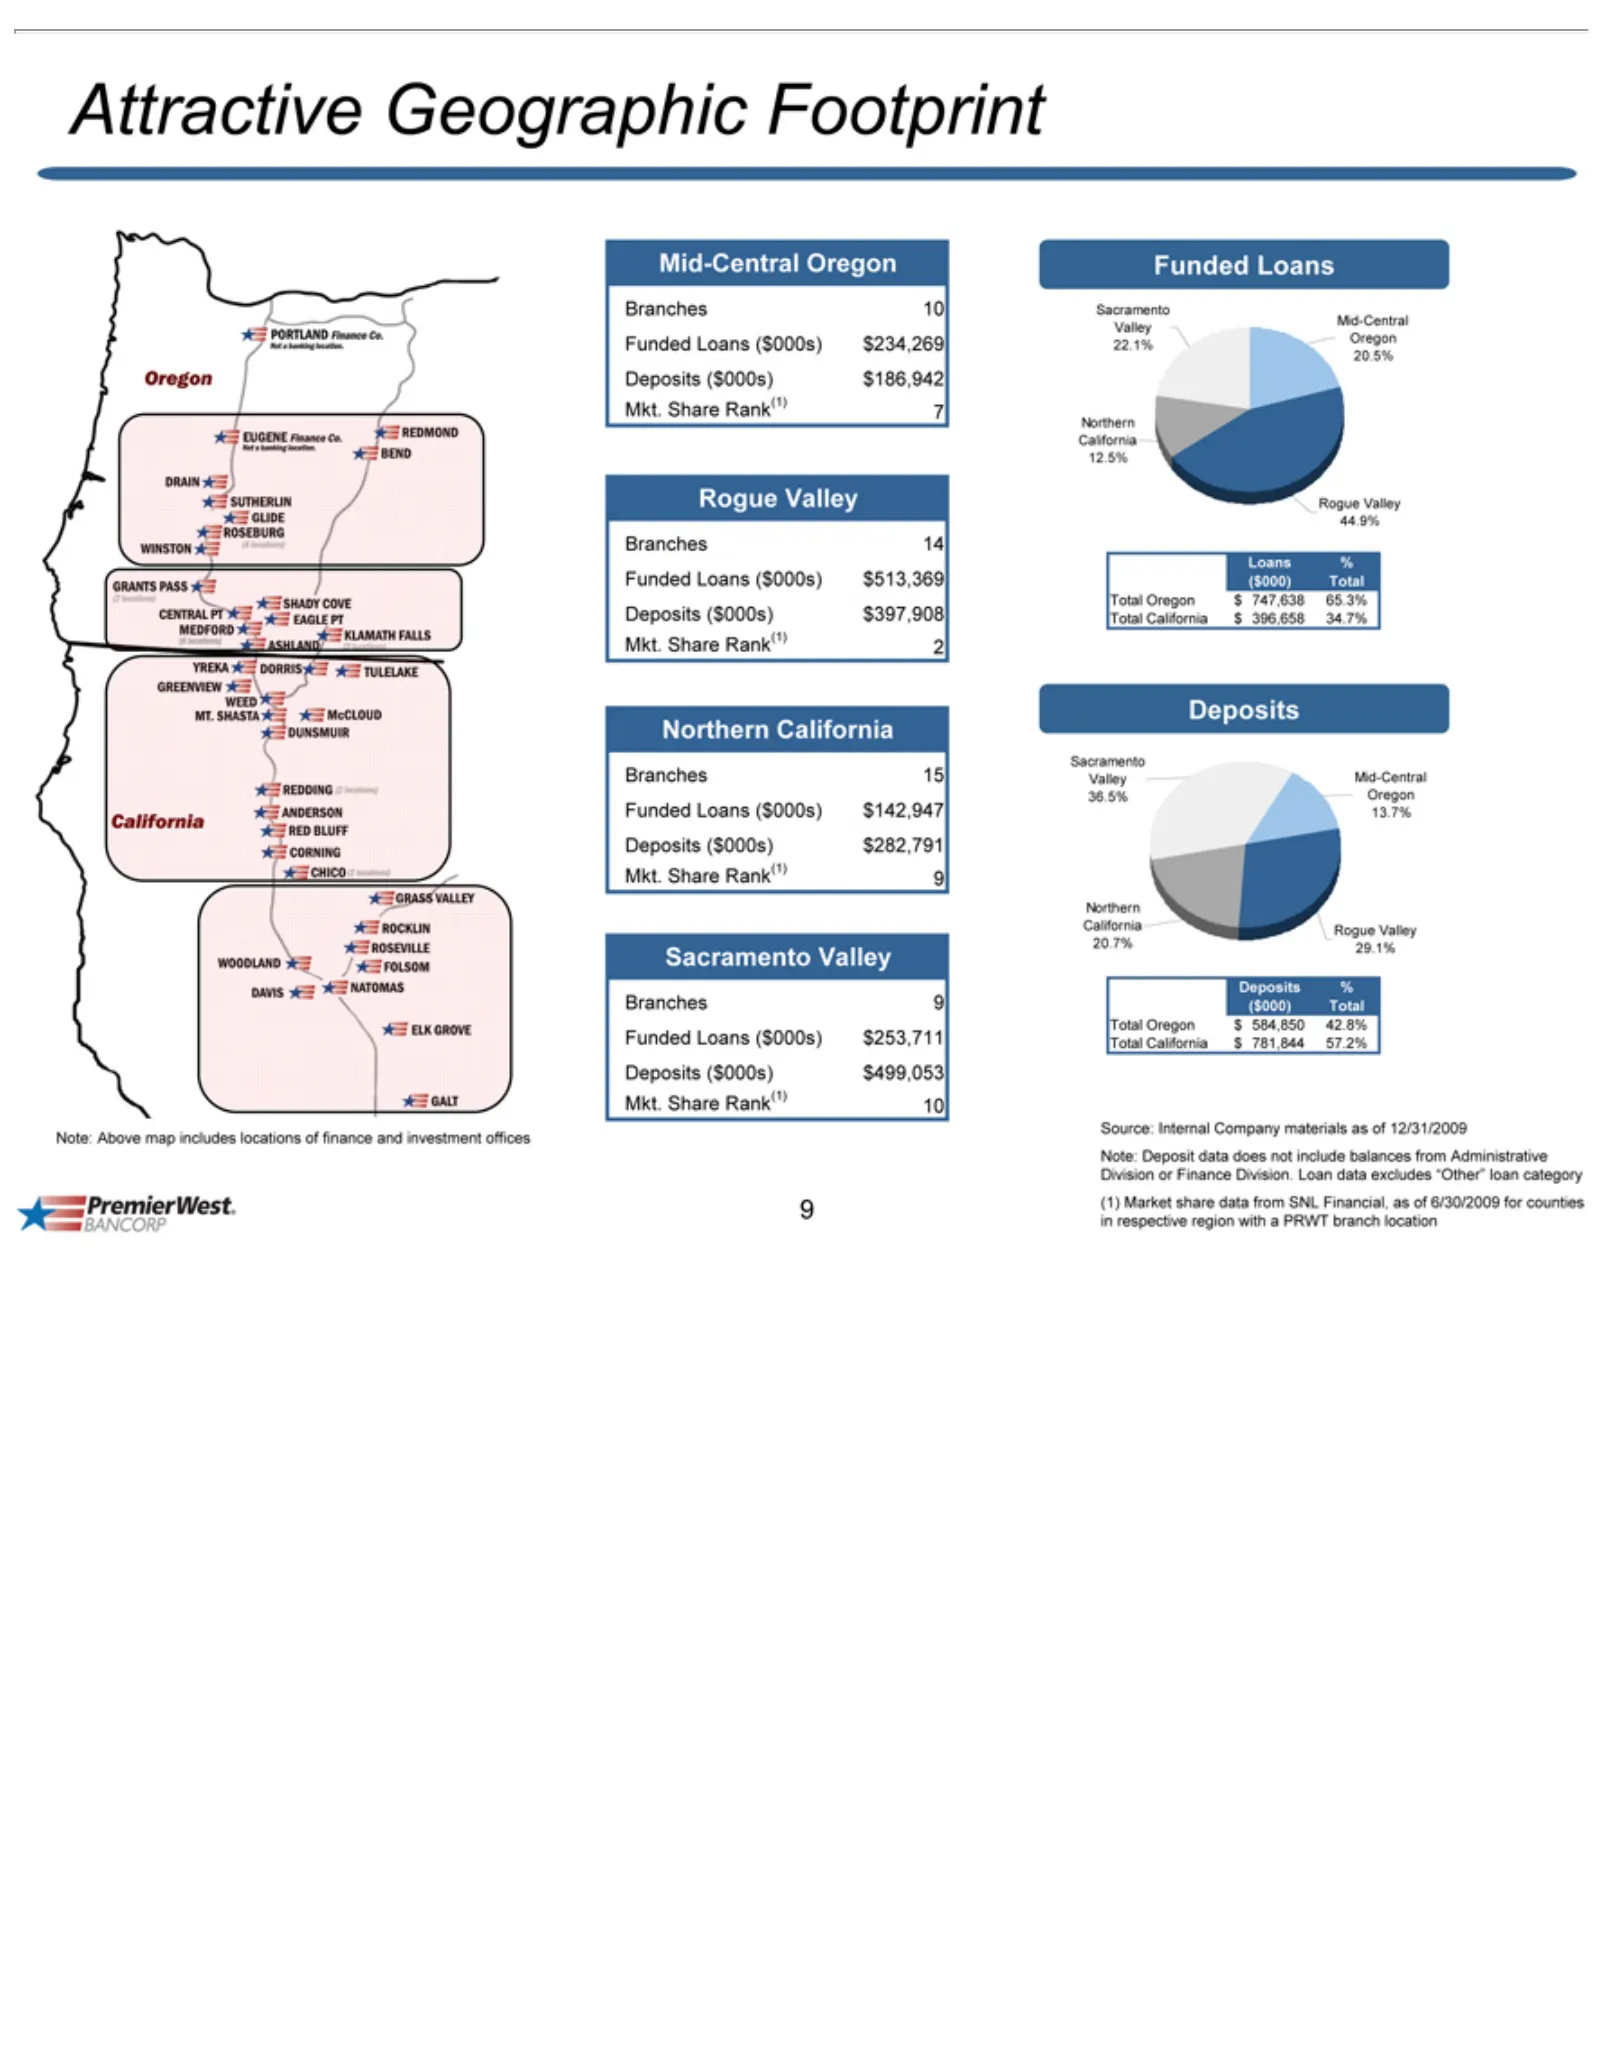
Attractive $234,269 $186,942 7R 14 $513,369 $397,908 2N 15 $142,947 $282,791 S 9F Branches $253,711 Mkt. $499,053 Note: 10 Funded Northern Mid-Central Rogue Loans % Total 65.3% $747,638 Sacramento Deposits 34.7% $396,658 acramento unded ogue orthern Total Share Oregon California Above ($000) Valley
Slide 10: Banking Branches and Deposit Market Share
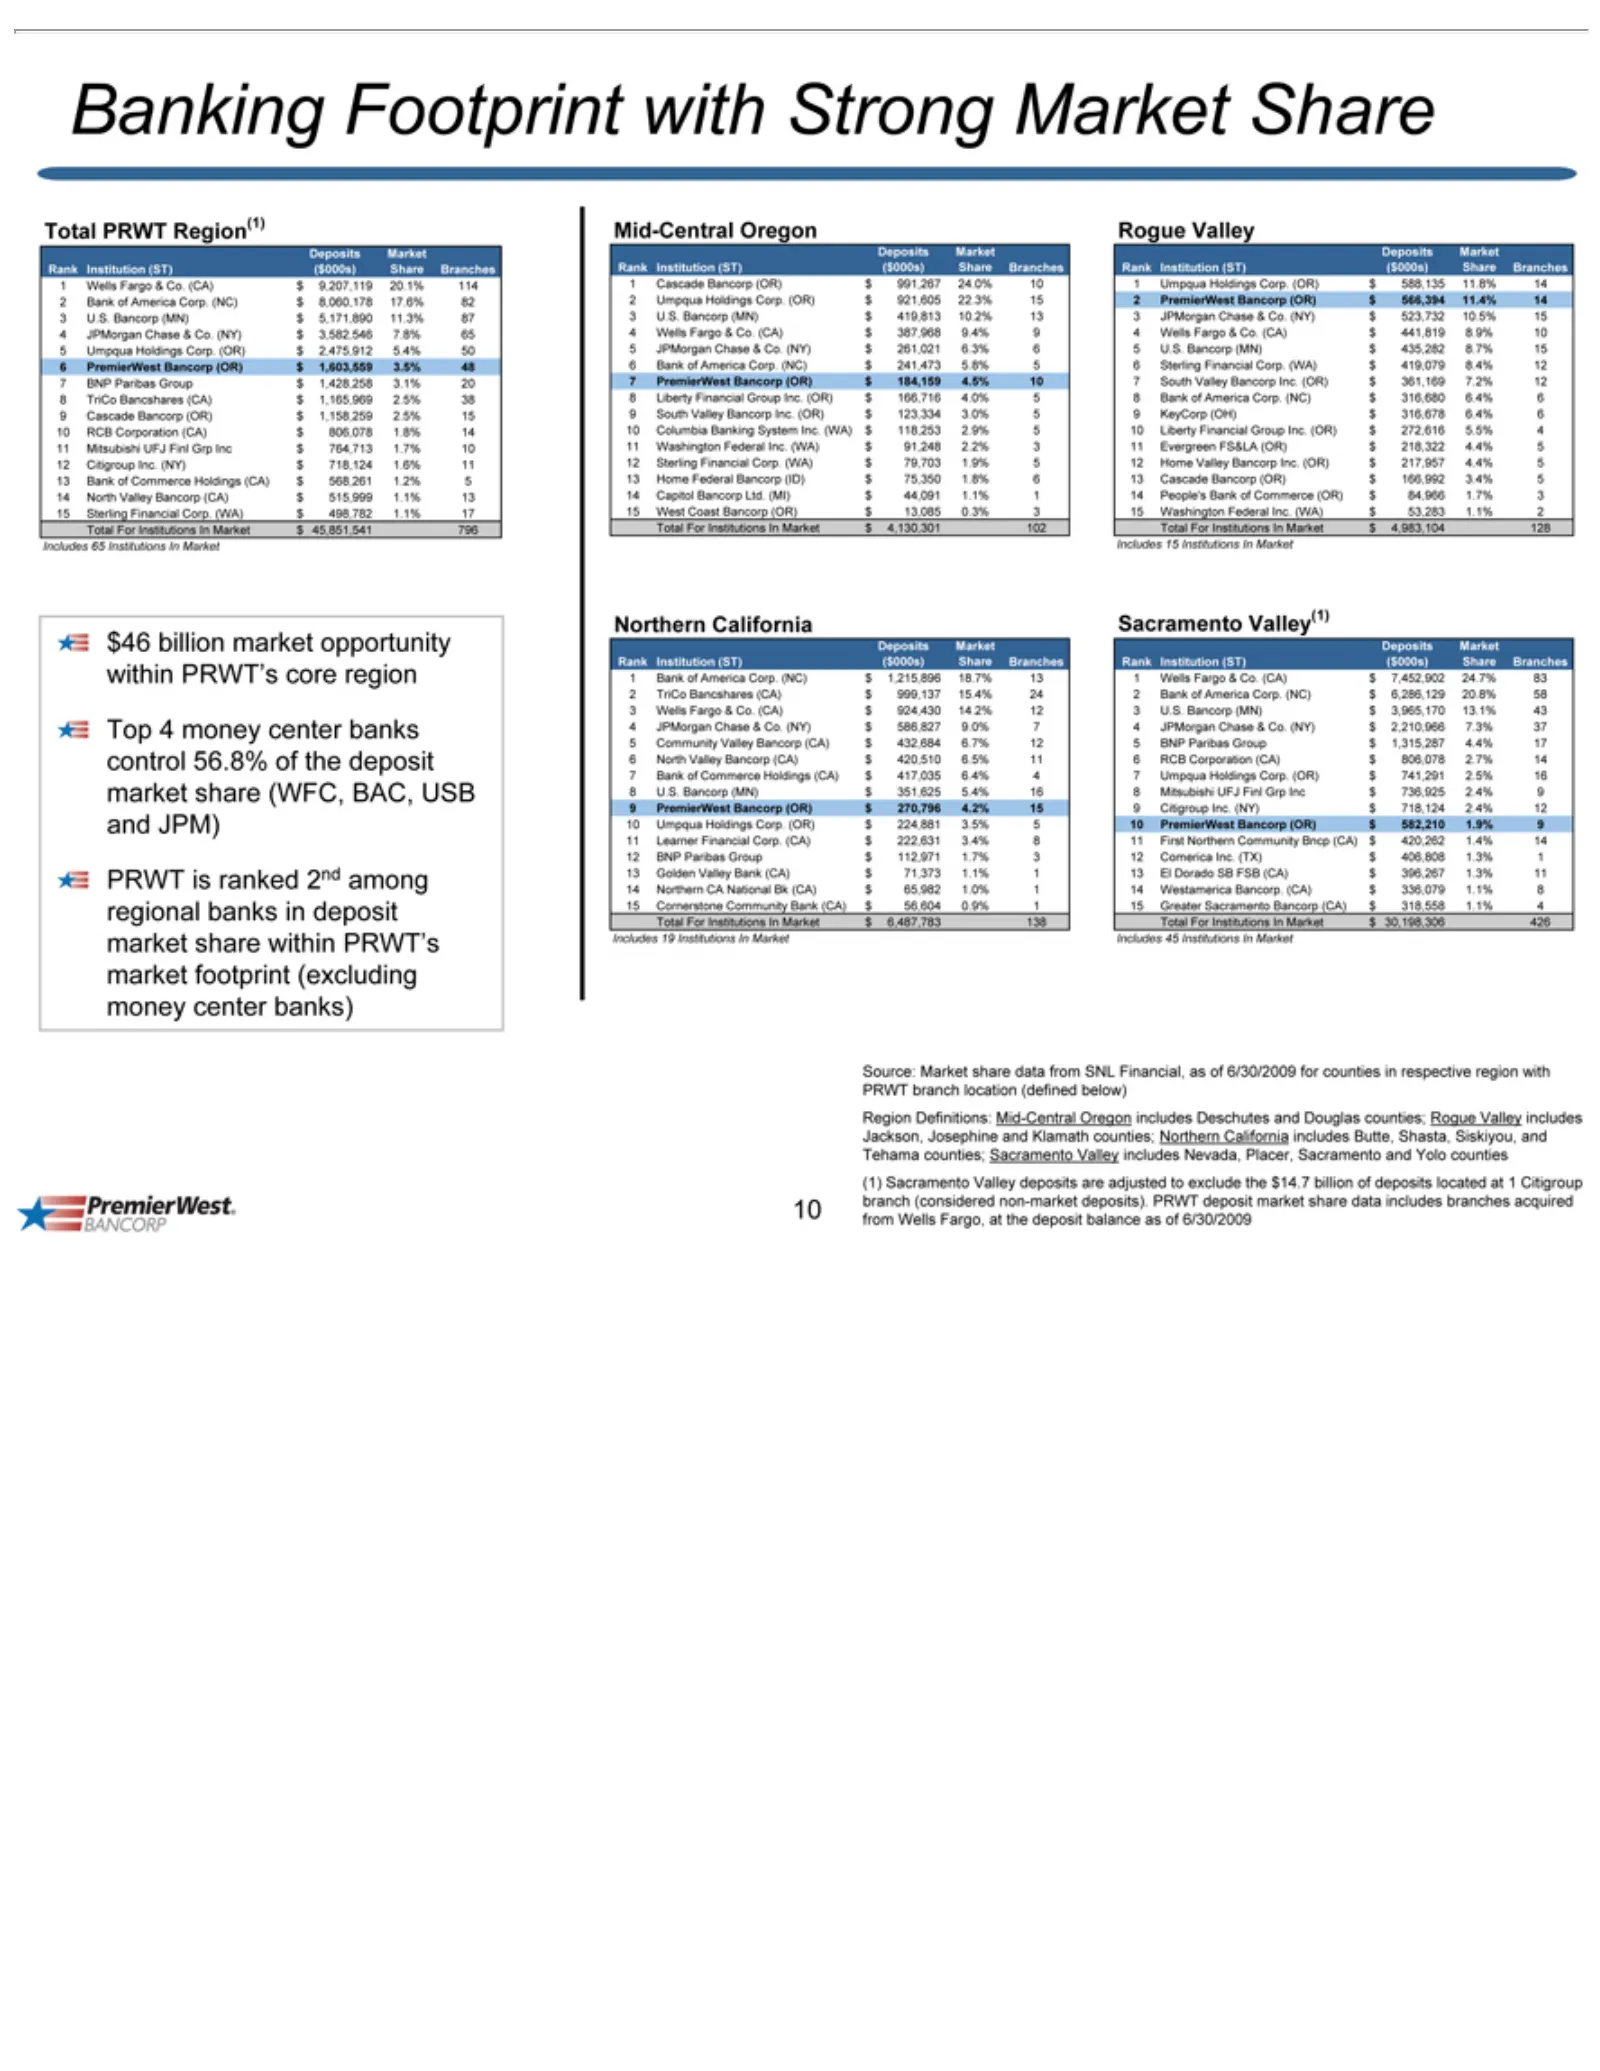
Banking Branches 114 20.1% $9,207,119 82 17.6% $8,060,178 87 11.3% $5,171,890 65 7.8% $3,582,546 50 $2,475,912 48 $1,603,559 20 3.1% $1,428,258 38 $1,165,969 RCB $1,158,259 Mitsubishi Citigroup $764,713 Bank 1.6% 1.2% $568,261 North $515,999 Total $498,782 796 $45,851,541 $46 Top PRWT Mid-Central 24
Slide 11: Q4 Update and Non-GAAP Core Earnings
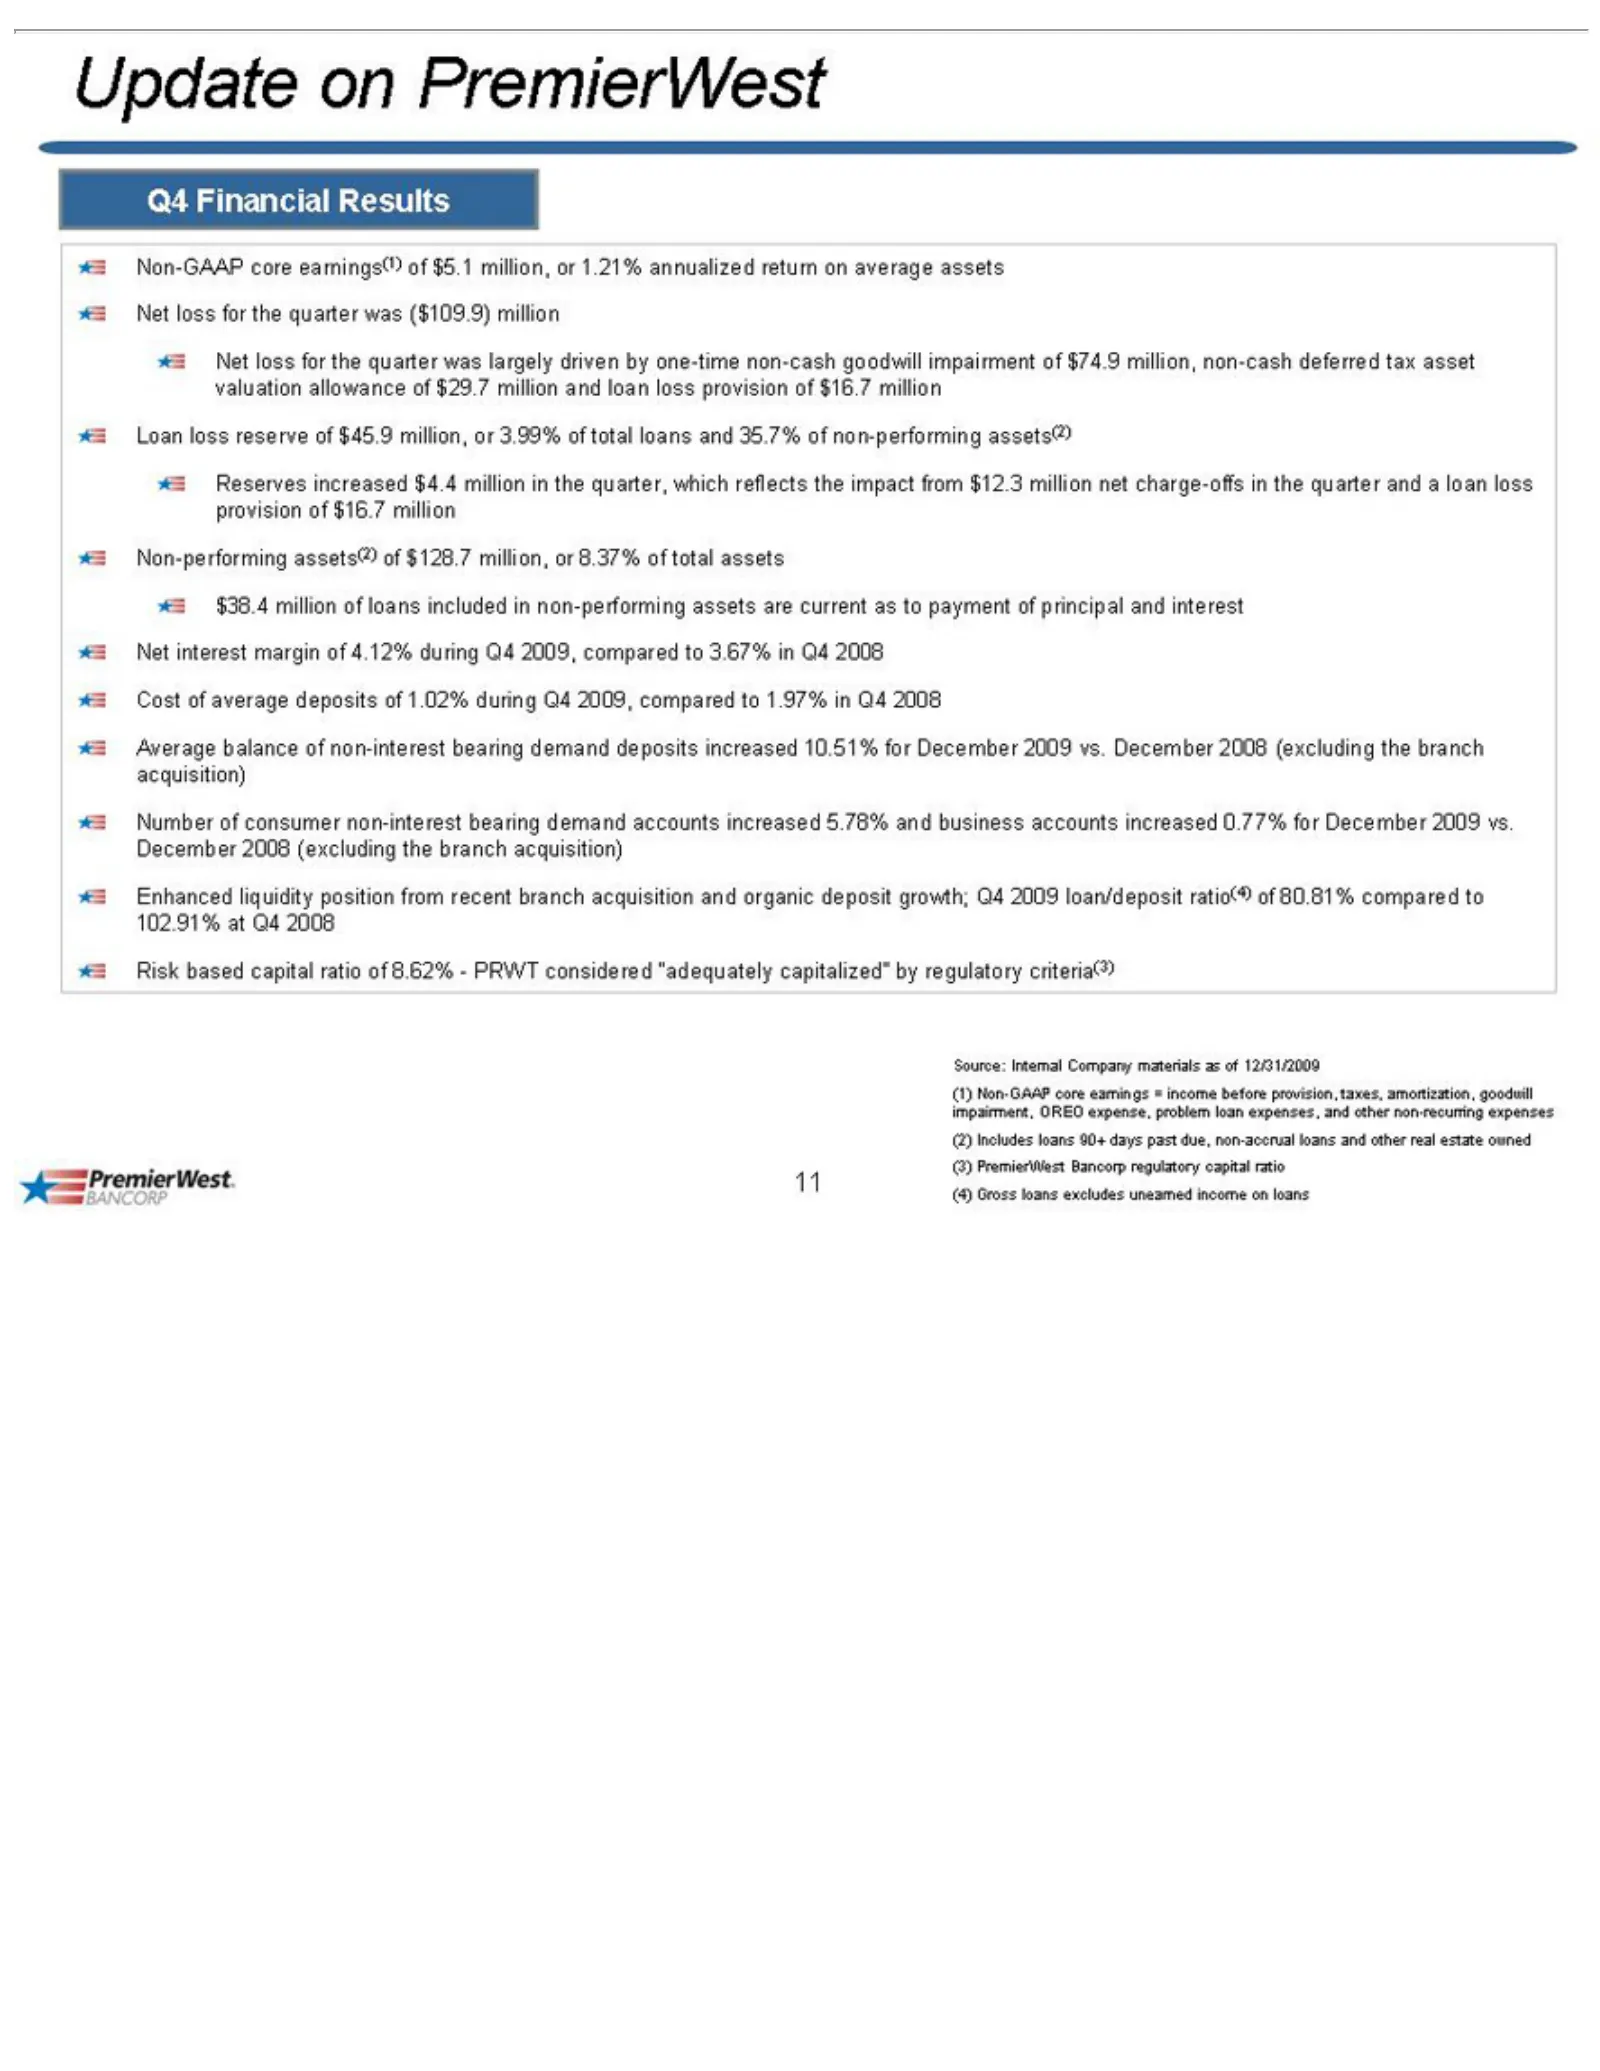
Update Q4 Non-GAAP Net Loan Reserves Non-performing 2009, Average Number Enhanced Risk Source: (1) accrual 11 Non-GAAP Financial loss based loss compared loans on Internal for of balance increased reserve liquidity PremierWest consumer capital the core Results and quarter core Company to assets(2) o
Slide 12: Successful Completed Branch Acquisition
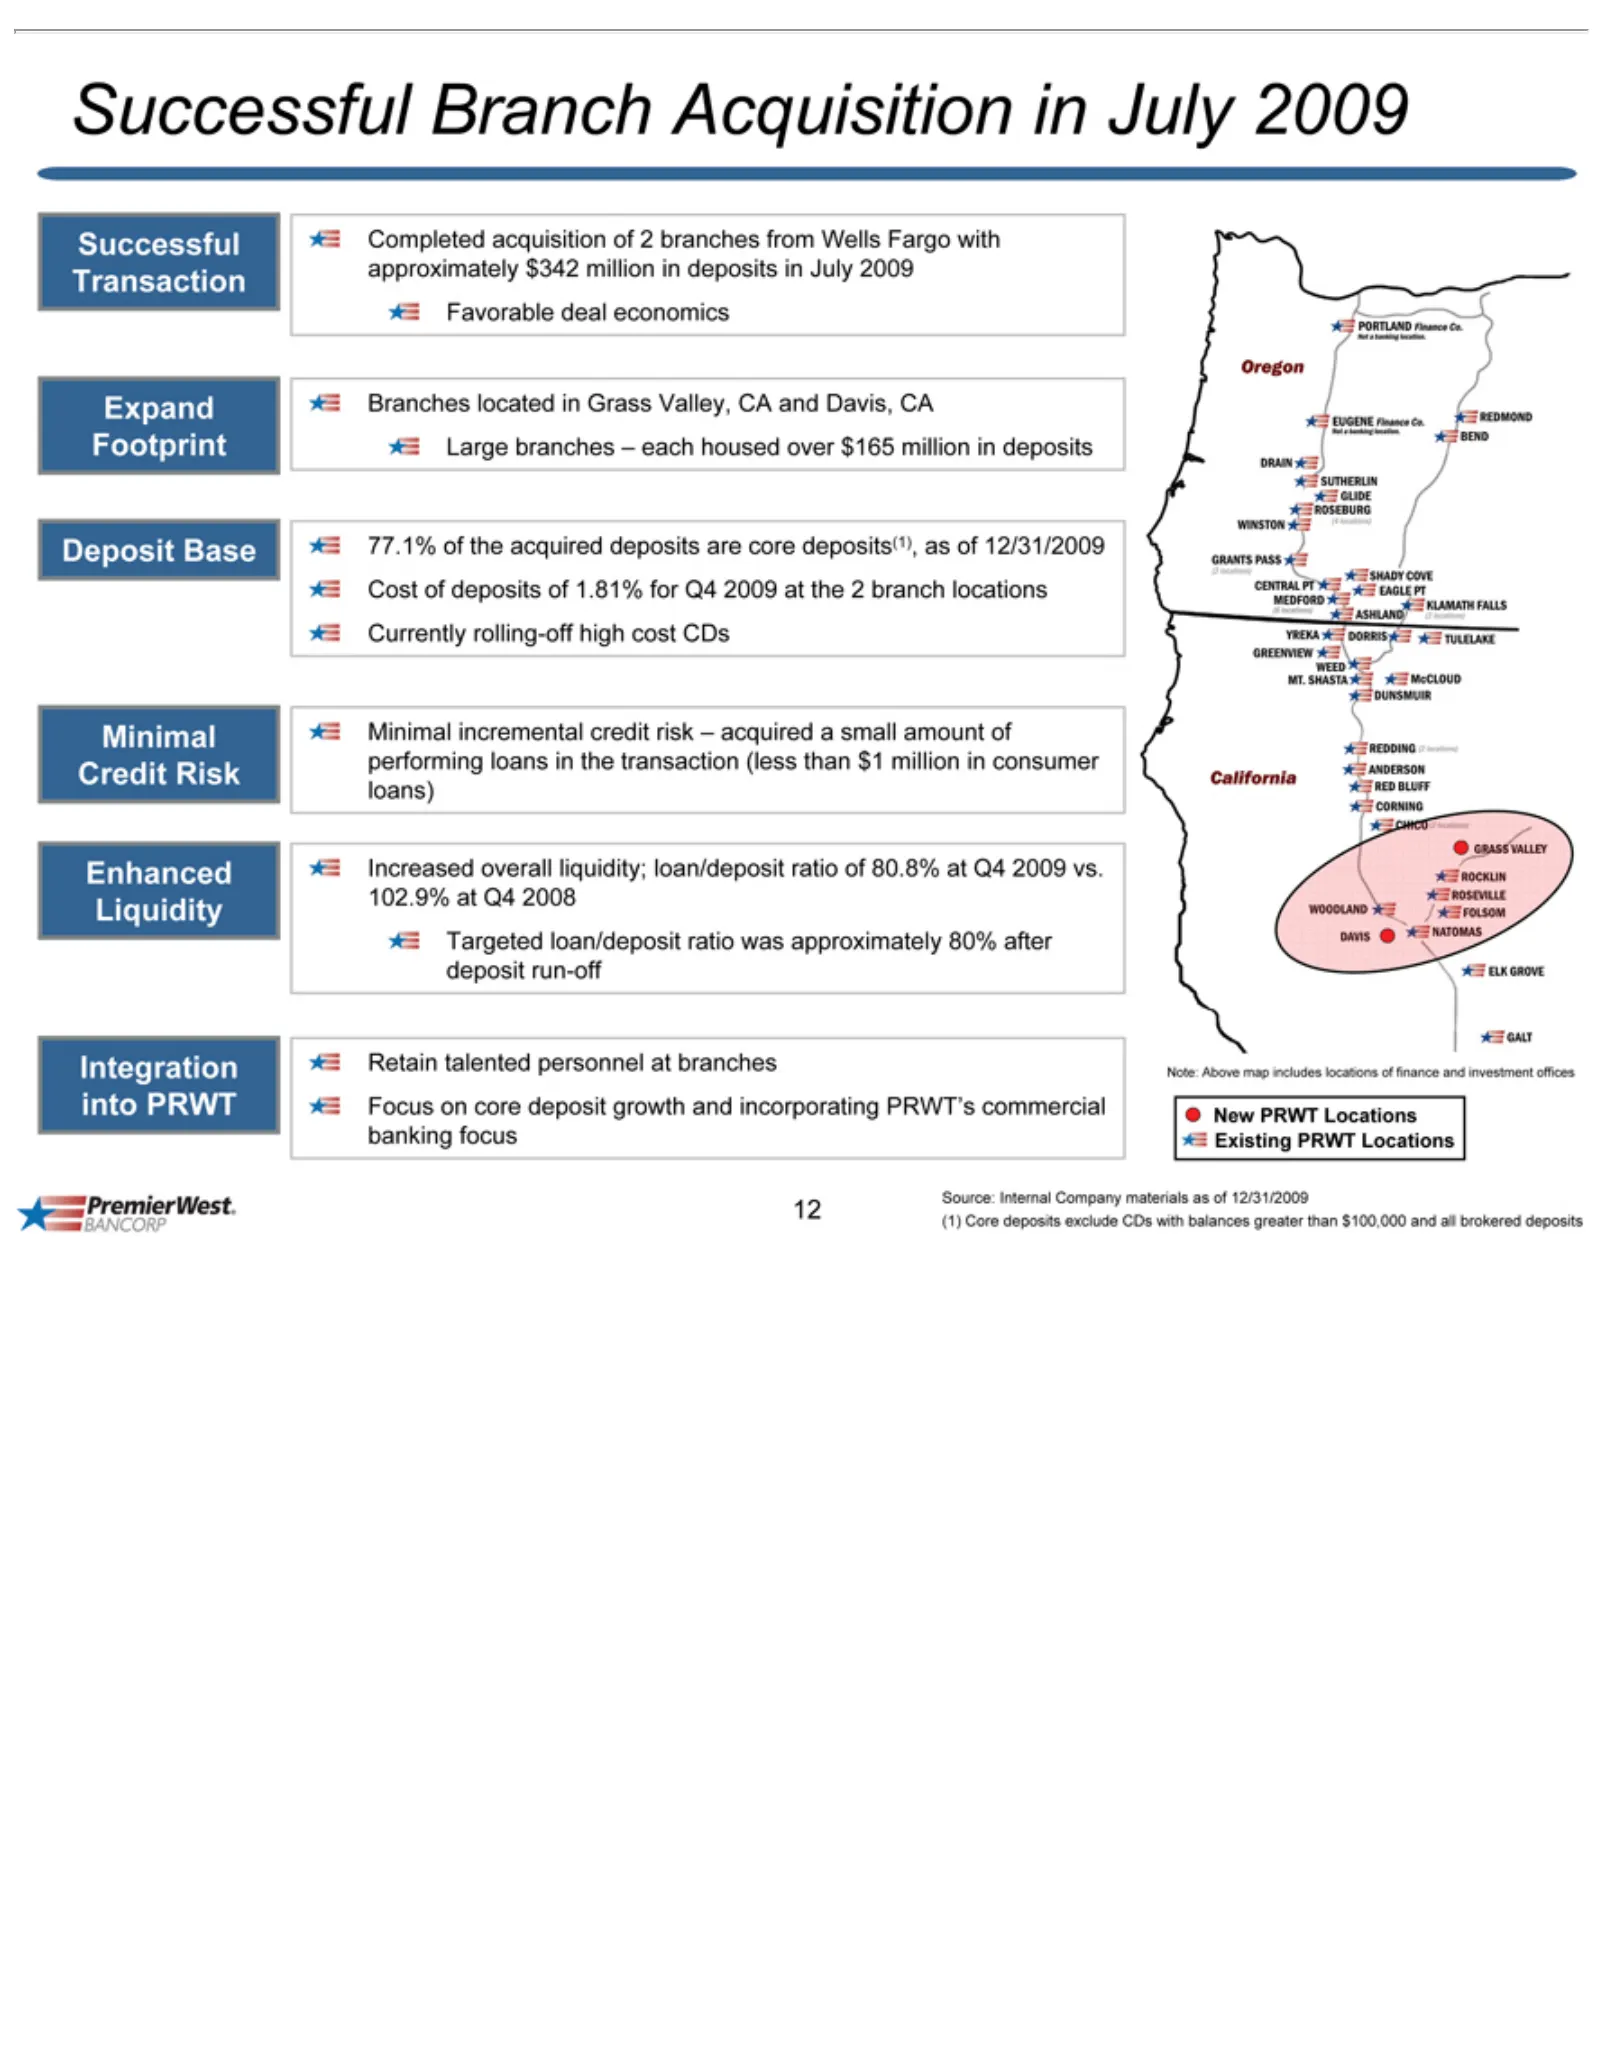
Successful Completed Branches Footprint Expand Large Deposit 77.1% Credit Minimal Enhanced Increased Integration Retain Focus Note: New Source: (1) 12 Core PRWT Above branches on Risk of talented Internal Base deposits incremental core the located overall Liquidity Transaction Branch into acquisitio
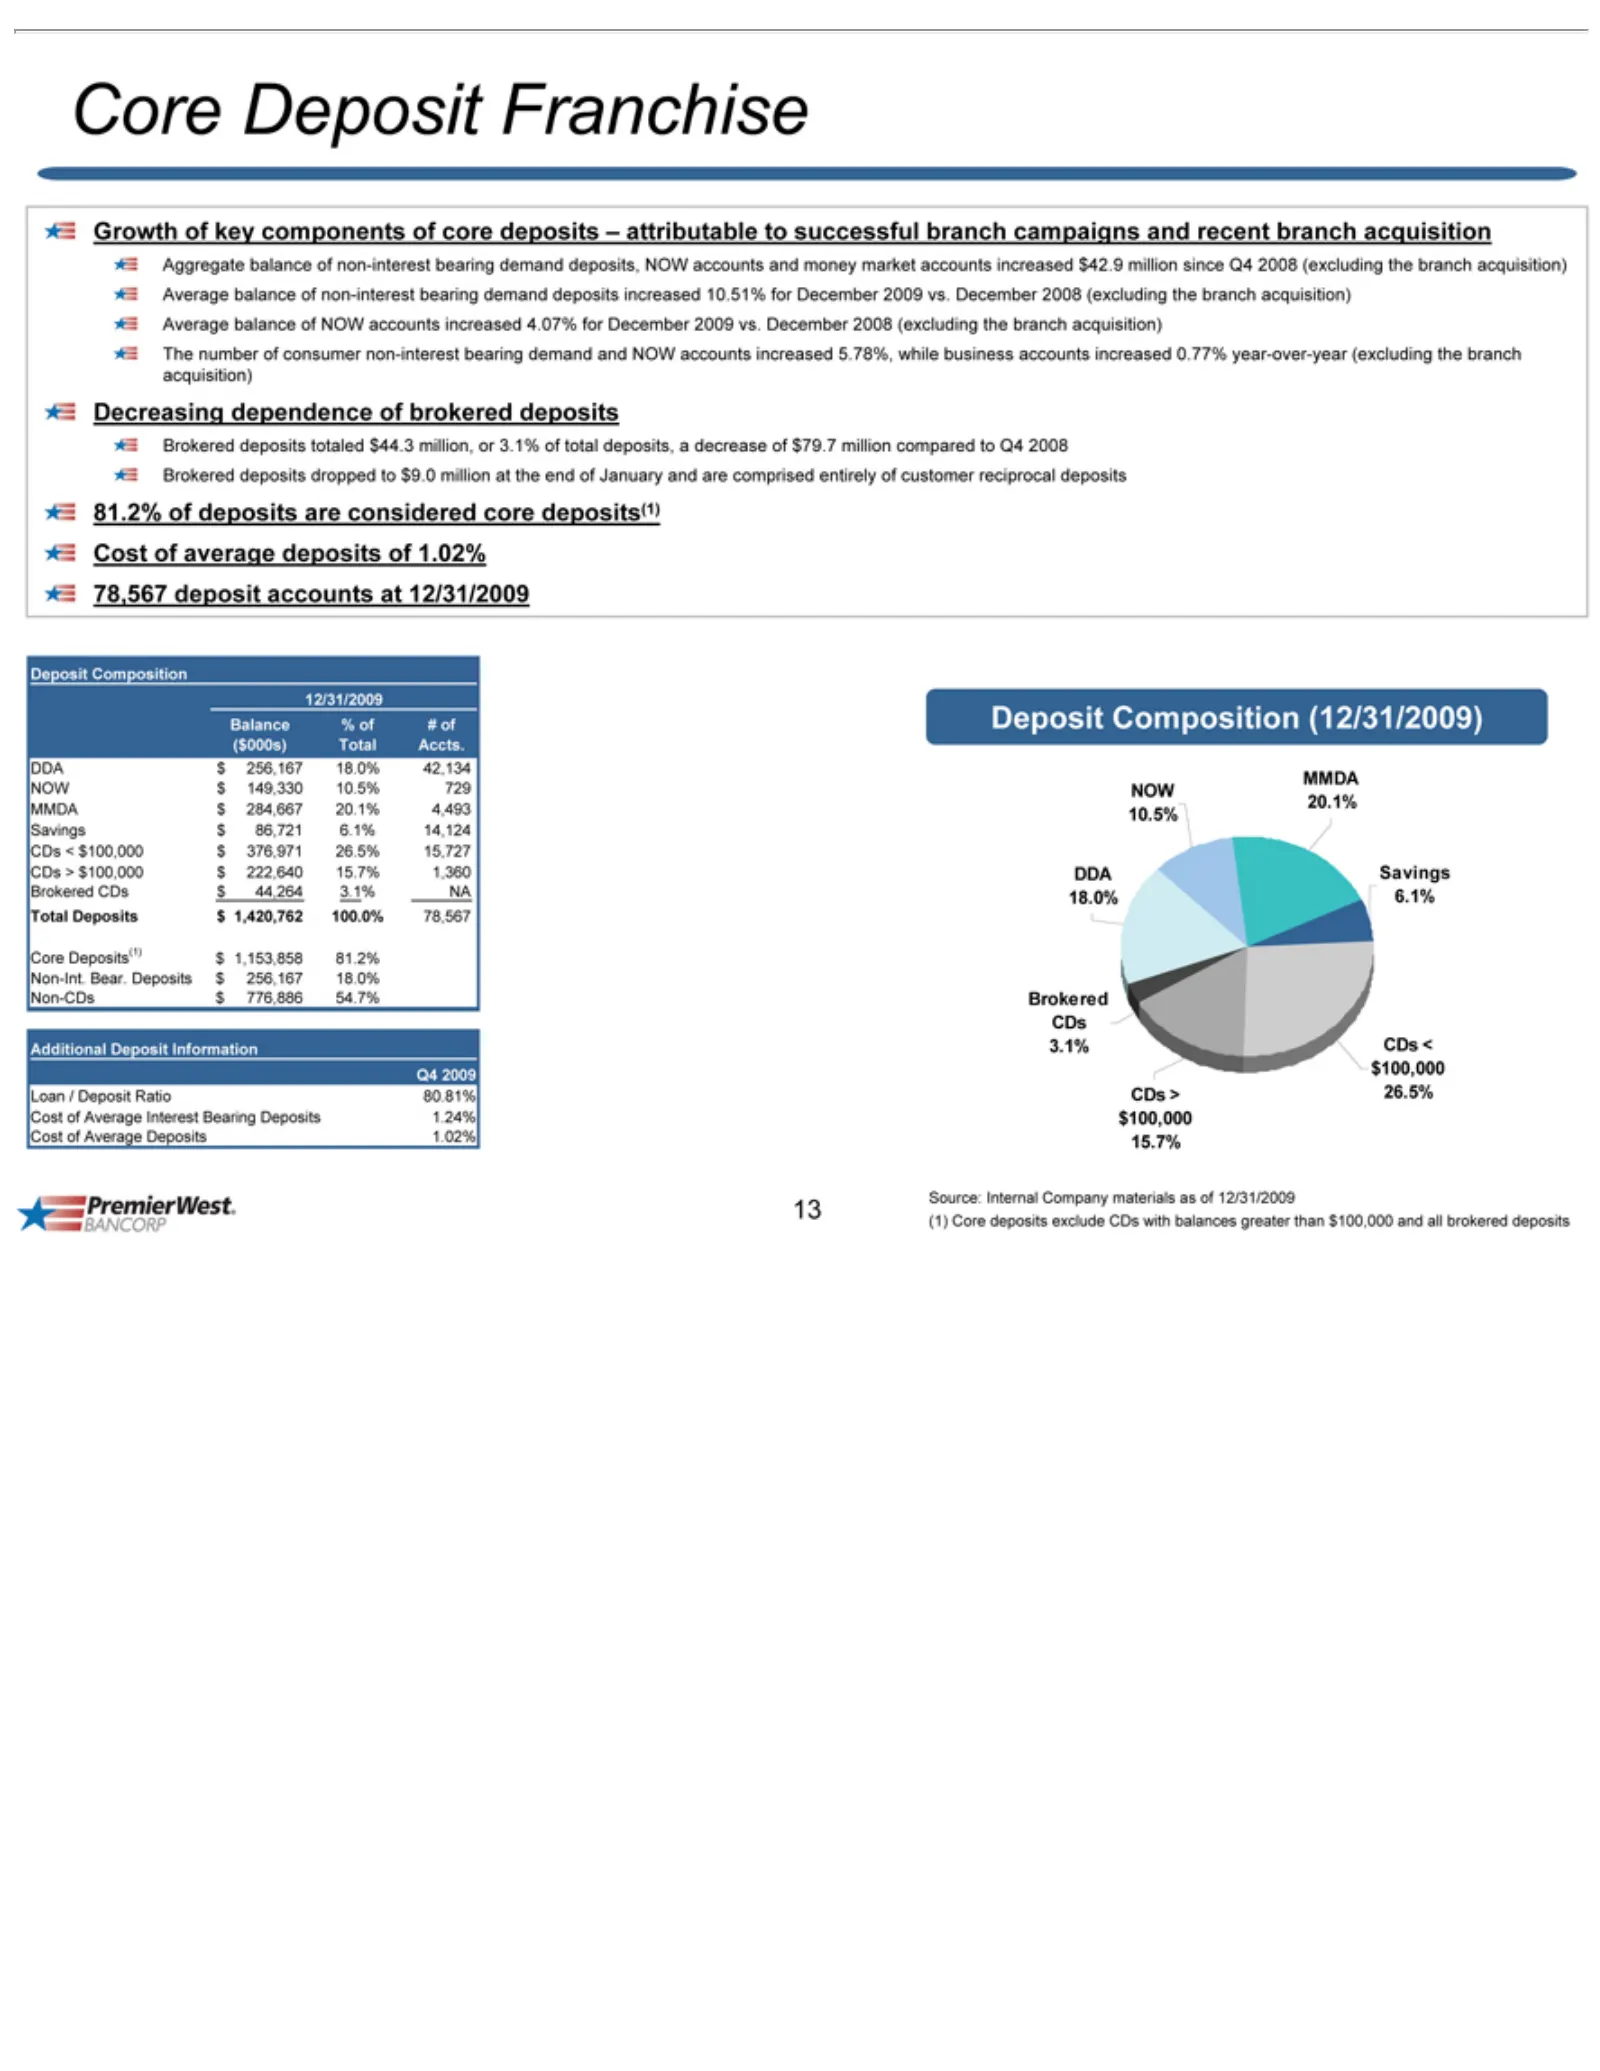
Slide 13: Core Deposit Growth
Growth Core Deposit Aggregate bearing (excluding Decreasingof key acquisition) demand Franchise components balance the dependence branch deposits of corebearing of non-interest acquisition) ofincreased brokered deposits The 10.51% deposits number– attributable demand for December of consumer to depo
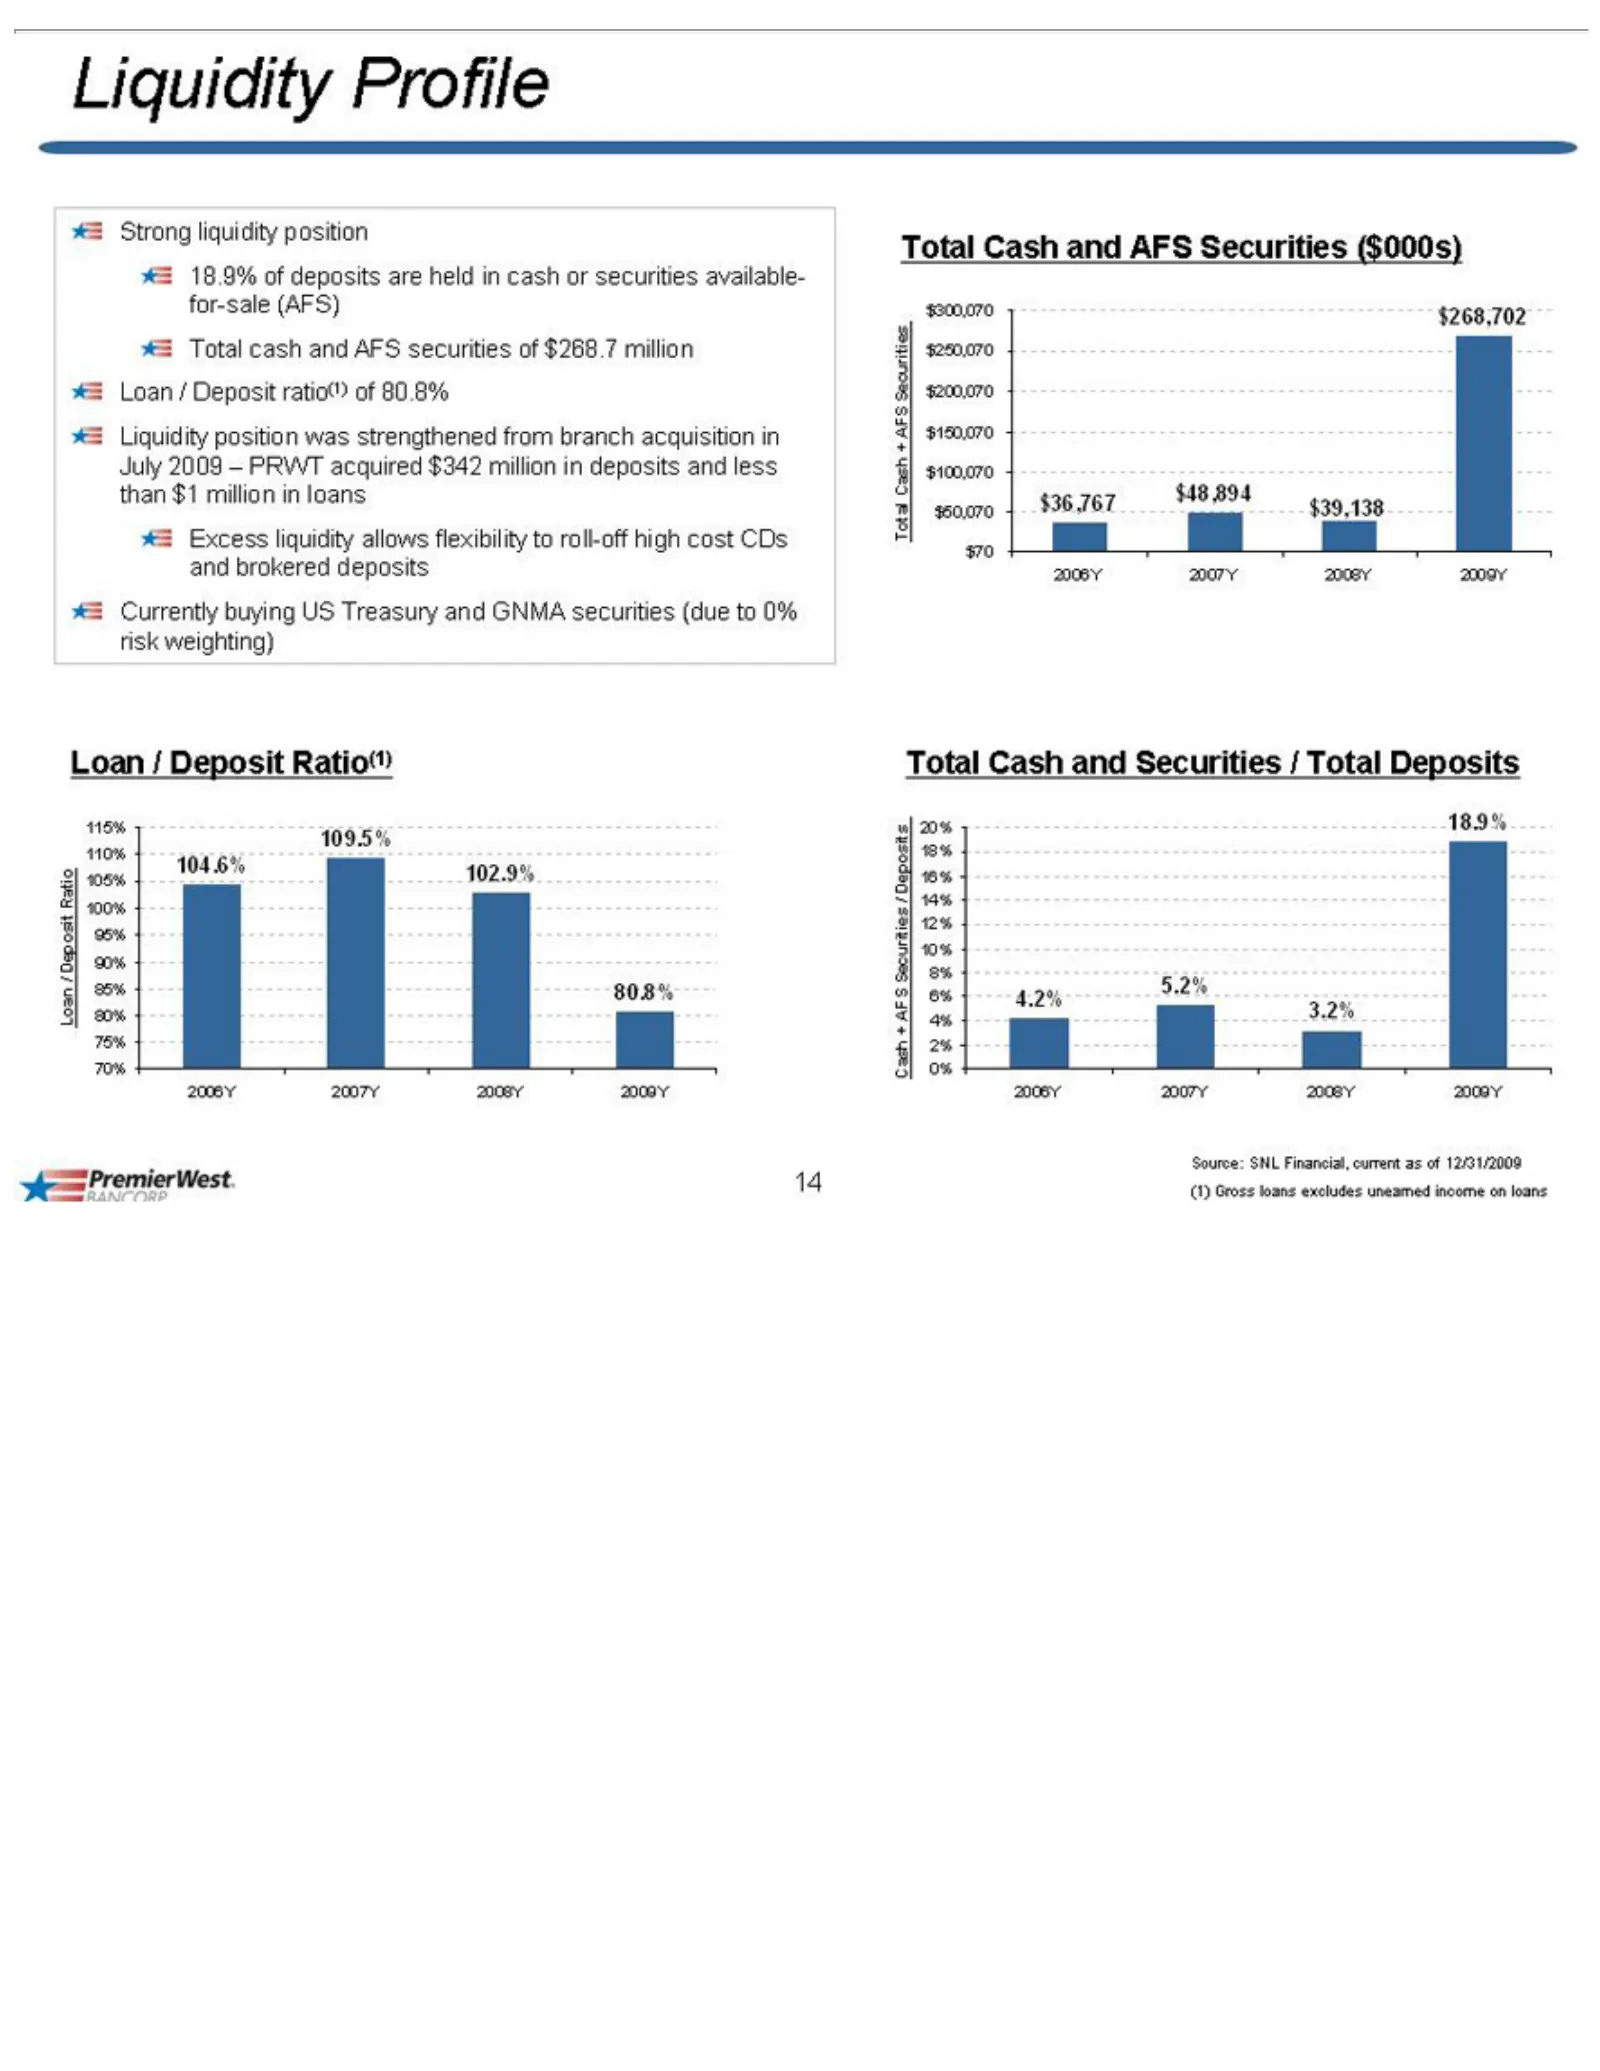
Slide 14: Strong Liquidity Position
Liquidity Strong July securities $300,070 $48,894 $268,702 Loan 115% 85% 104.6% 109.5% Total 80.8% Cash 20% 2006Y 5.2% Source: 18.9% 3.2% 14 2009 80% 18% + Cash /4.2% 110% Deposit of liquidity 2007Y AFS SNL 102.9% $39,138 deposits Profile $250,070 (due 75% 16% –and +PRWT 105% Securities AFS Financia
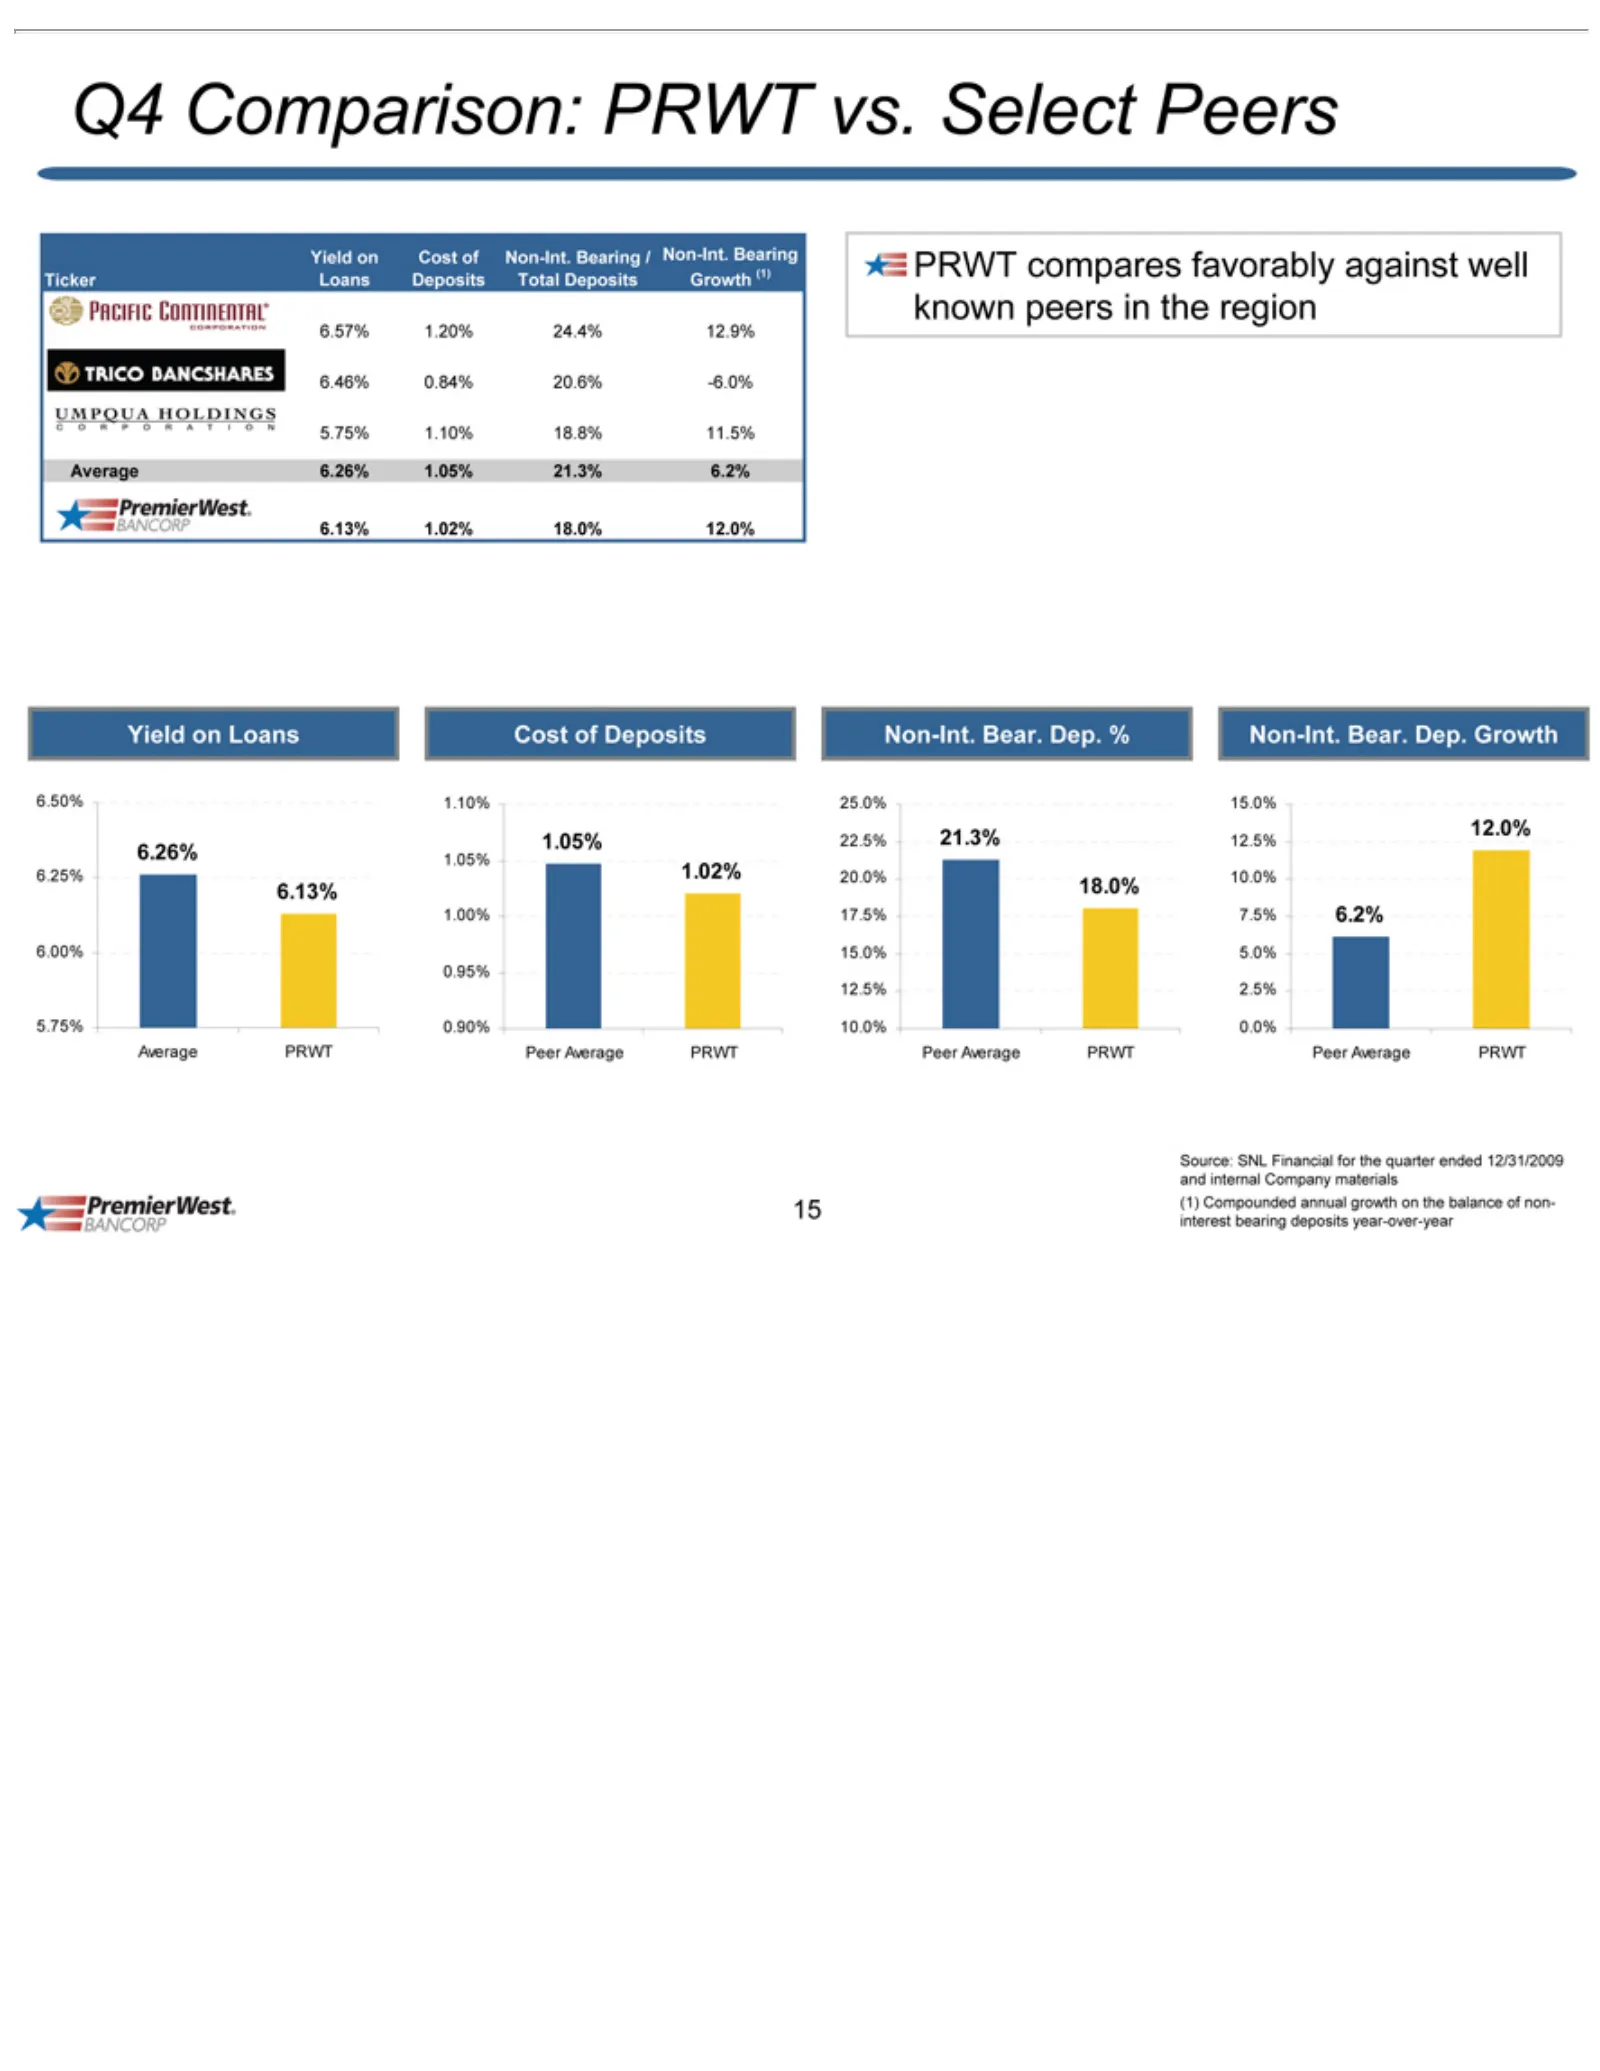
Slide 15: Q4 Comparison: PRWT vs. Peers
Q4 Comparison: Ticker 6.57% 6.46% PRWT Yield Average 5.75% 6.00% 6.13% 6.25% 6.26% 6.50% Cost 1.05% 1.10% 0.90% 0.95% 1.00% 22.5% 25.0% 20.0% 17.5% Non-Int. 12.5% 15.0% 7.5% 10.0% Peer 0.0% 2.5% 5.0% Source: 15 Average of 6.2% on Yield 1.20% 0.84% 1.10% 1.02% 21.3% 18.0% 12.0% compares Deposits SNL
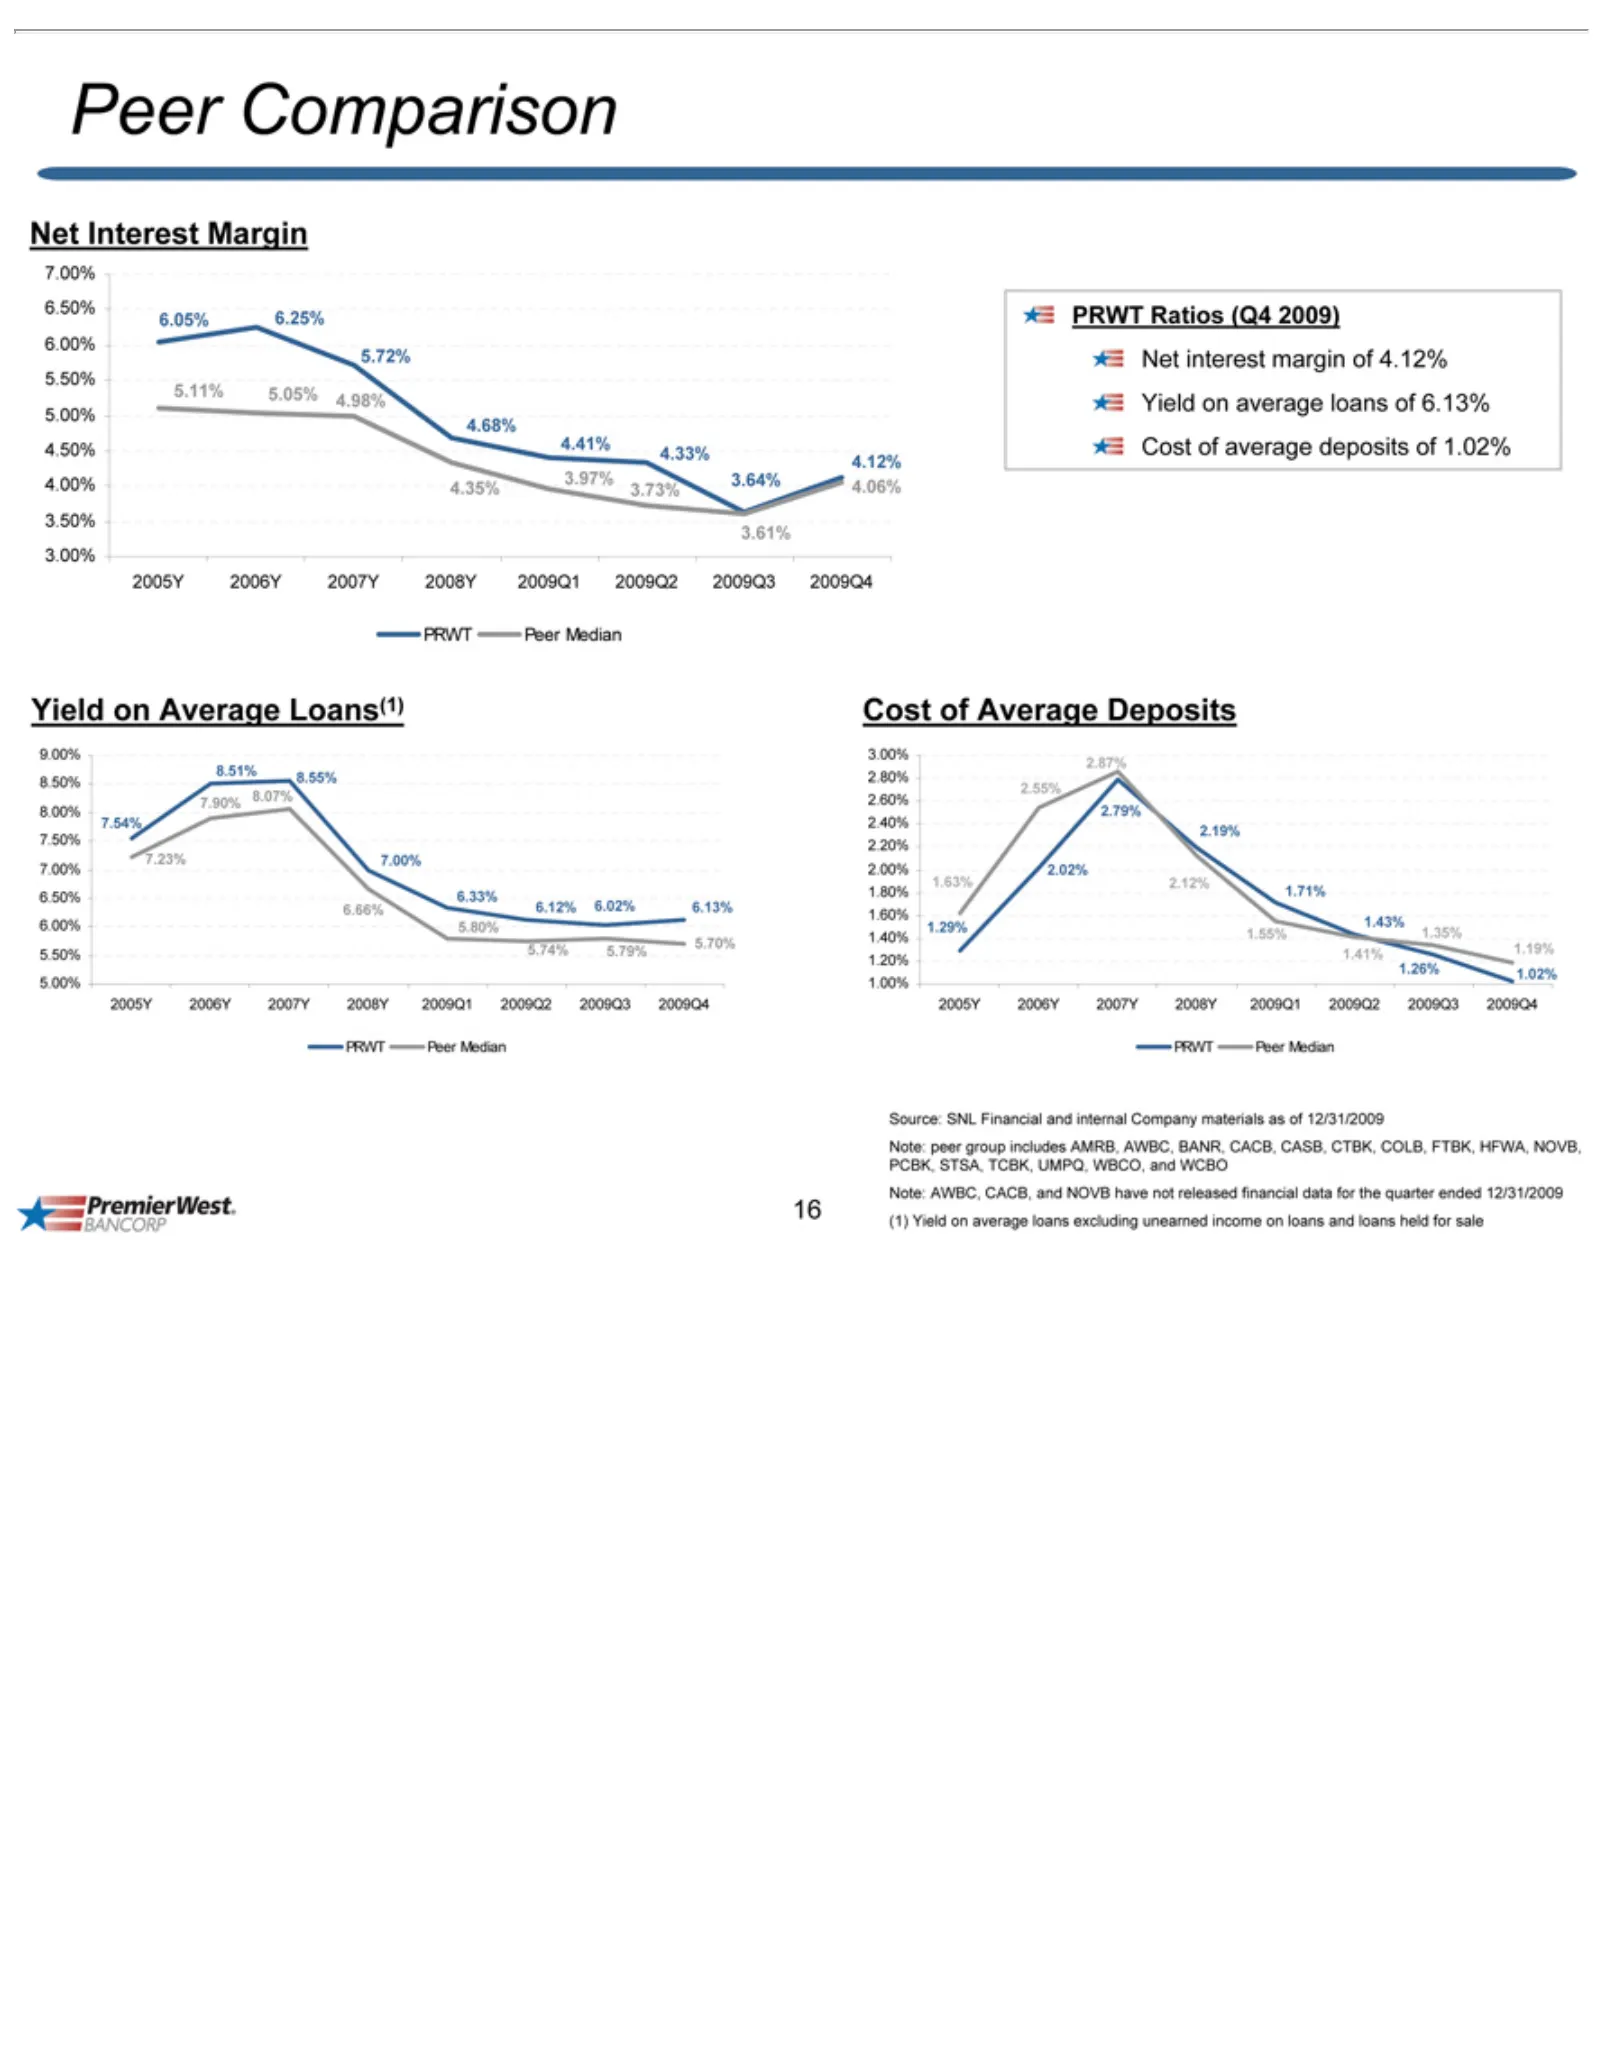
Slide 16: Peer Net Interest Margin Comparison
Peerinterest 5.11% 4.50% 4.00% 4.12% 3.50% Net Yield 8.50% 8.51% 9.00% 7.90% 7.00% 7.50% 7.54% 8.00% 6.50% 6.66% 6.00% 5.50% 5.00% Cost 3.00% 2.40% 2.79% 2.60% 2.55% 2.80% 2.00% 2.20% 1.63% 1.80% 1.40% 1.60% 1.41% 1.00% 1.20% 2005Y PRWT Source: Note: 16 Interest Comparison of AWBC, on peer 5.05% 6.0
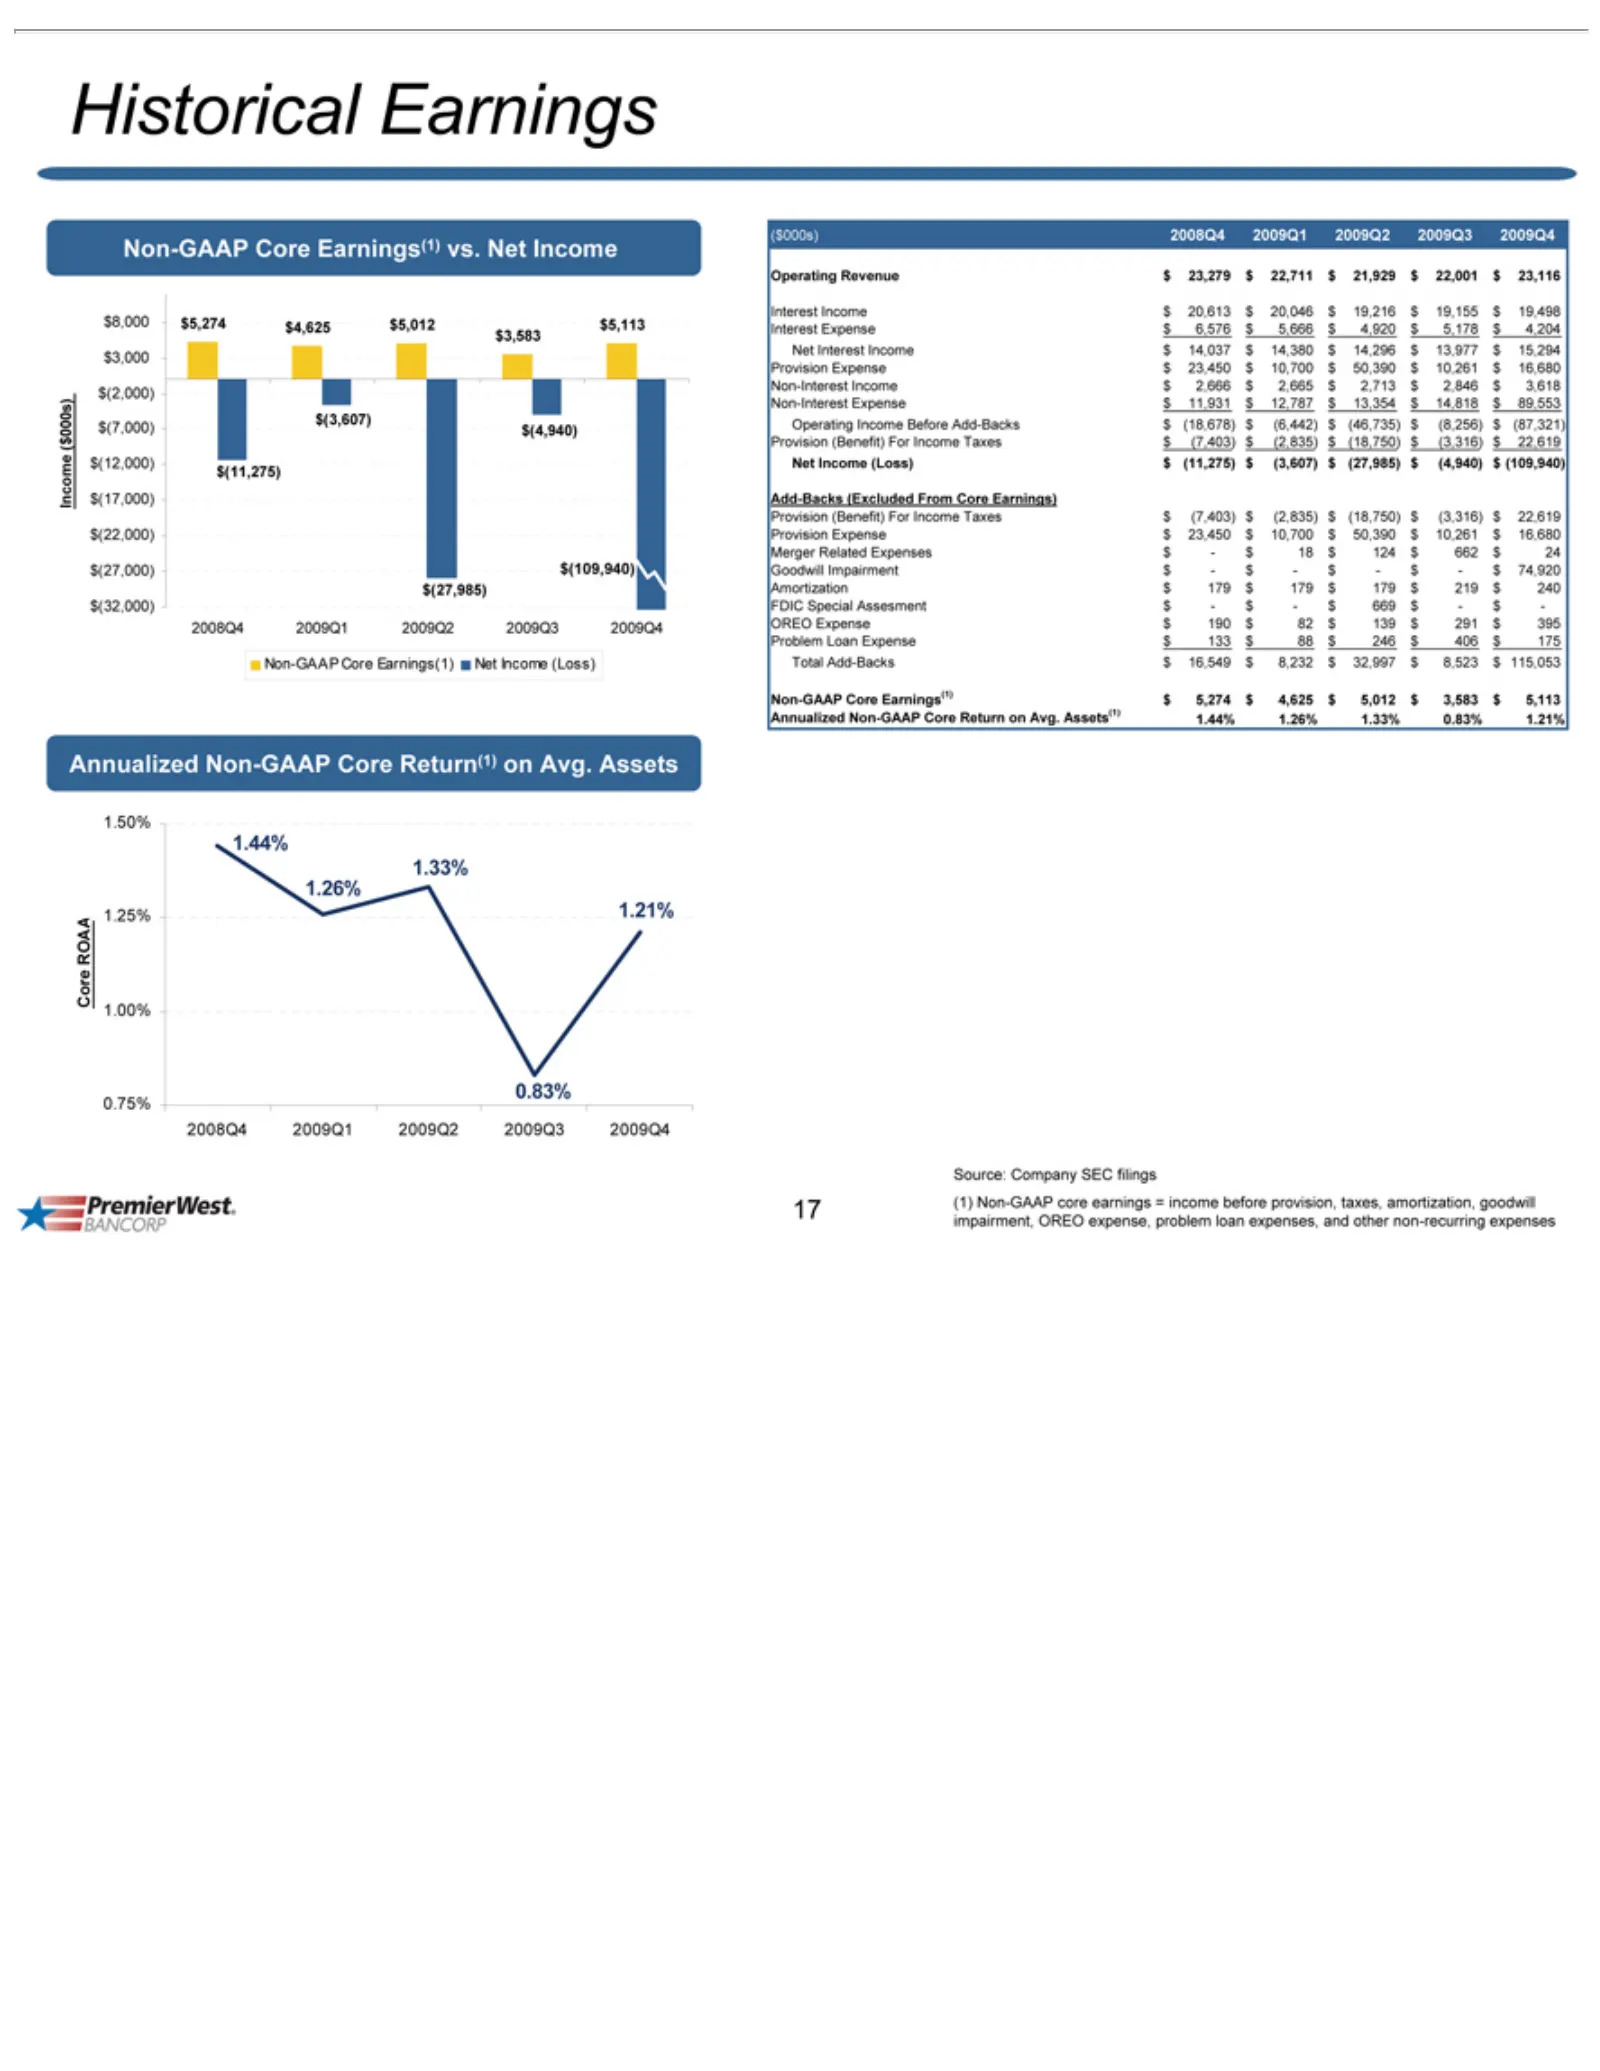
Slide 17: Historical Income and Core Earnings
Historical Income $8,000 $(7,000) $(3,607) $(2,000) $3,000 $3,583 $(12,000) $(27,000) $(22,000) $(17,000) $(32,000) $(27,985) ($000s) Interest Non-Interest Operating Net Add-Backs Provision Merger Goodwill Amortization FDIC OREO Problem Total Non-GAAP Annualized Core 1.25% 1.26% 1.33% 1.44% 1.50% 0.
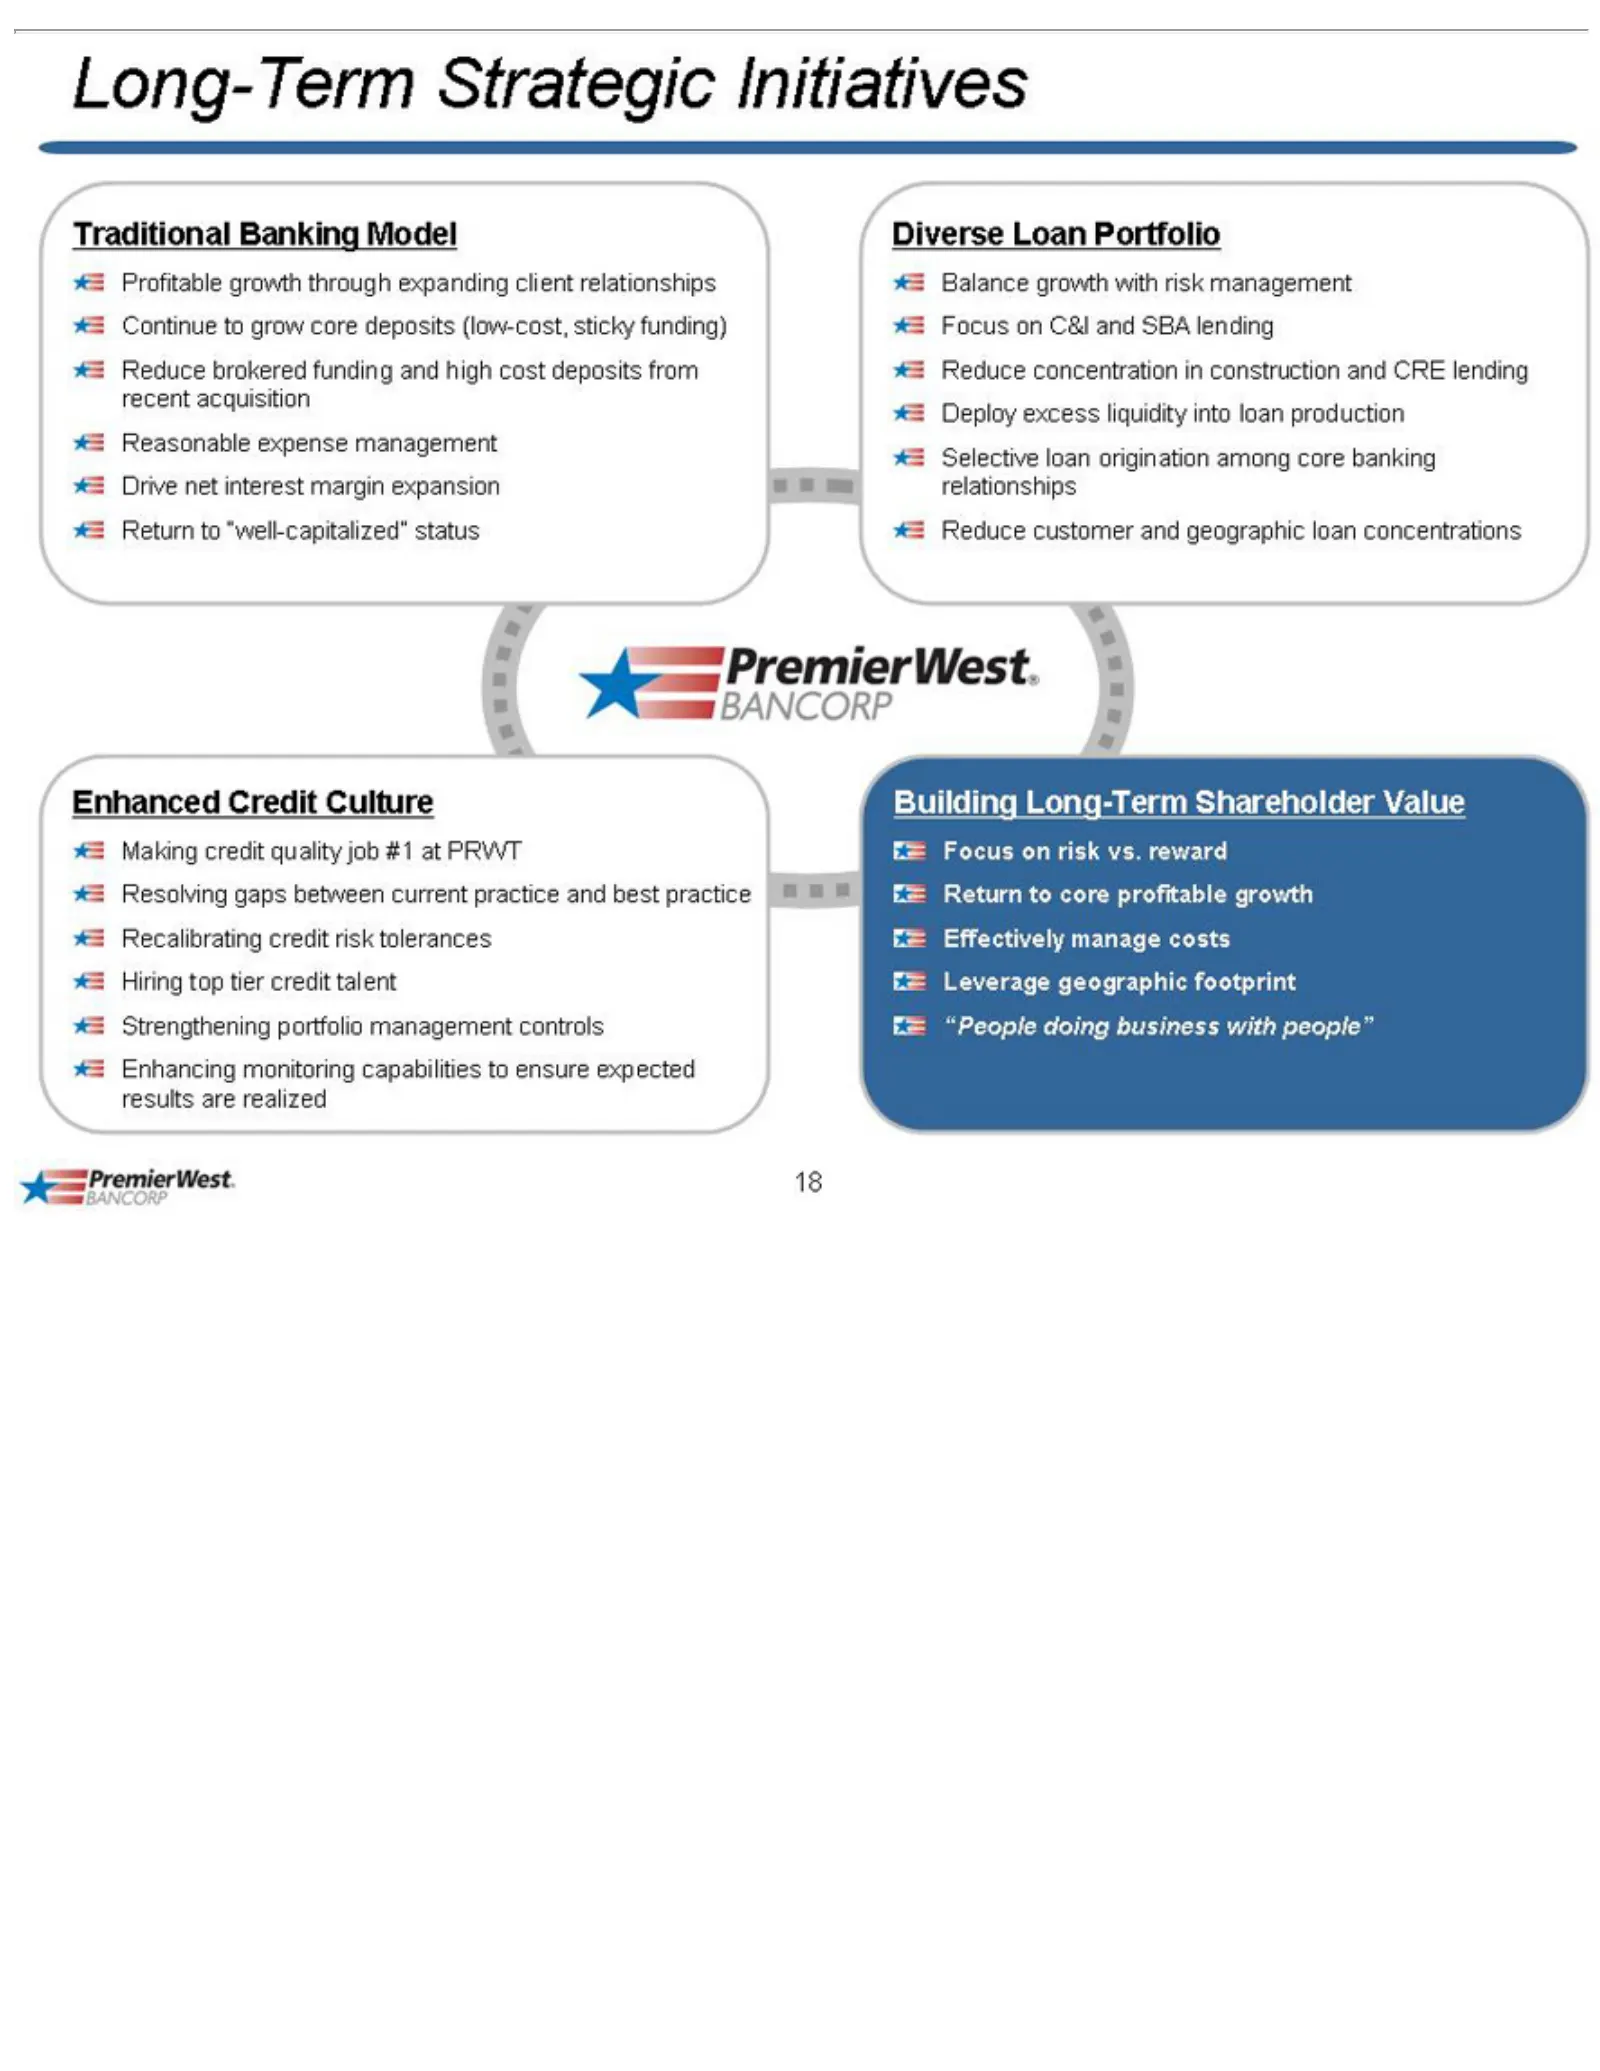
Slide 18: Long-Term Strategic Initiatives to Drive Shareholder Return
Long-Term Traditional Profitable management Diverse Balance Reduce Enhanced Making Resolving expected Building Focus “People 18 onconcentration Loan credit doing growth Long-Term results risk Credit growth gaps Banking Strategic Drive vs. Portfolio quality business between with are Culture reward th
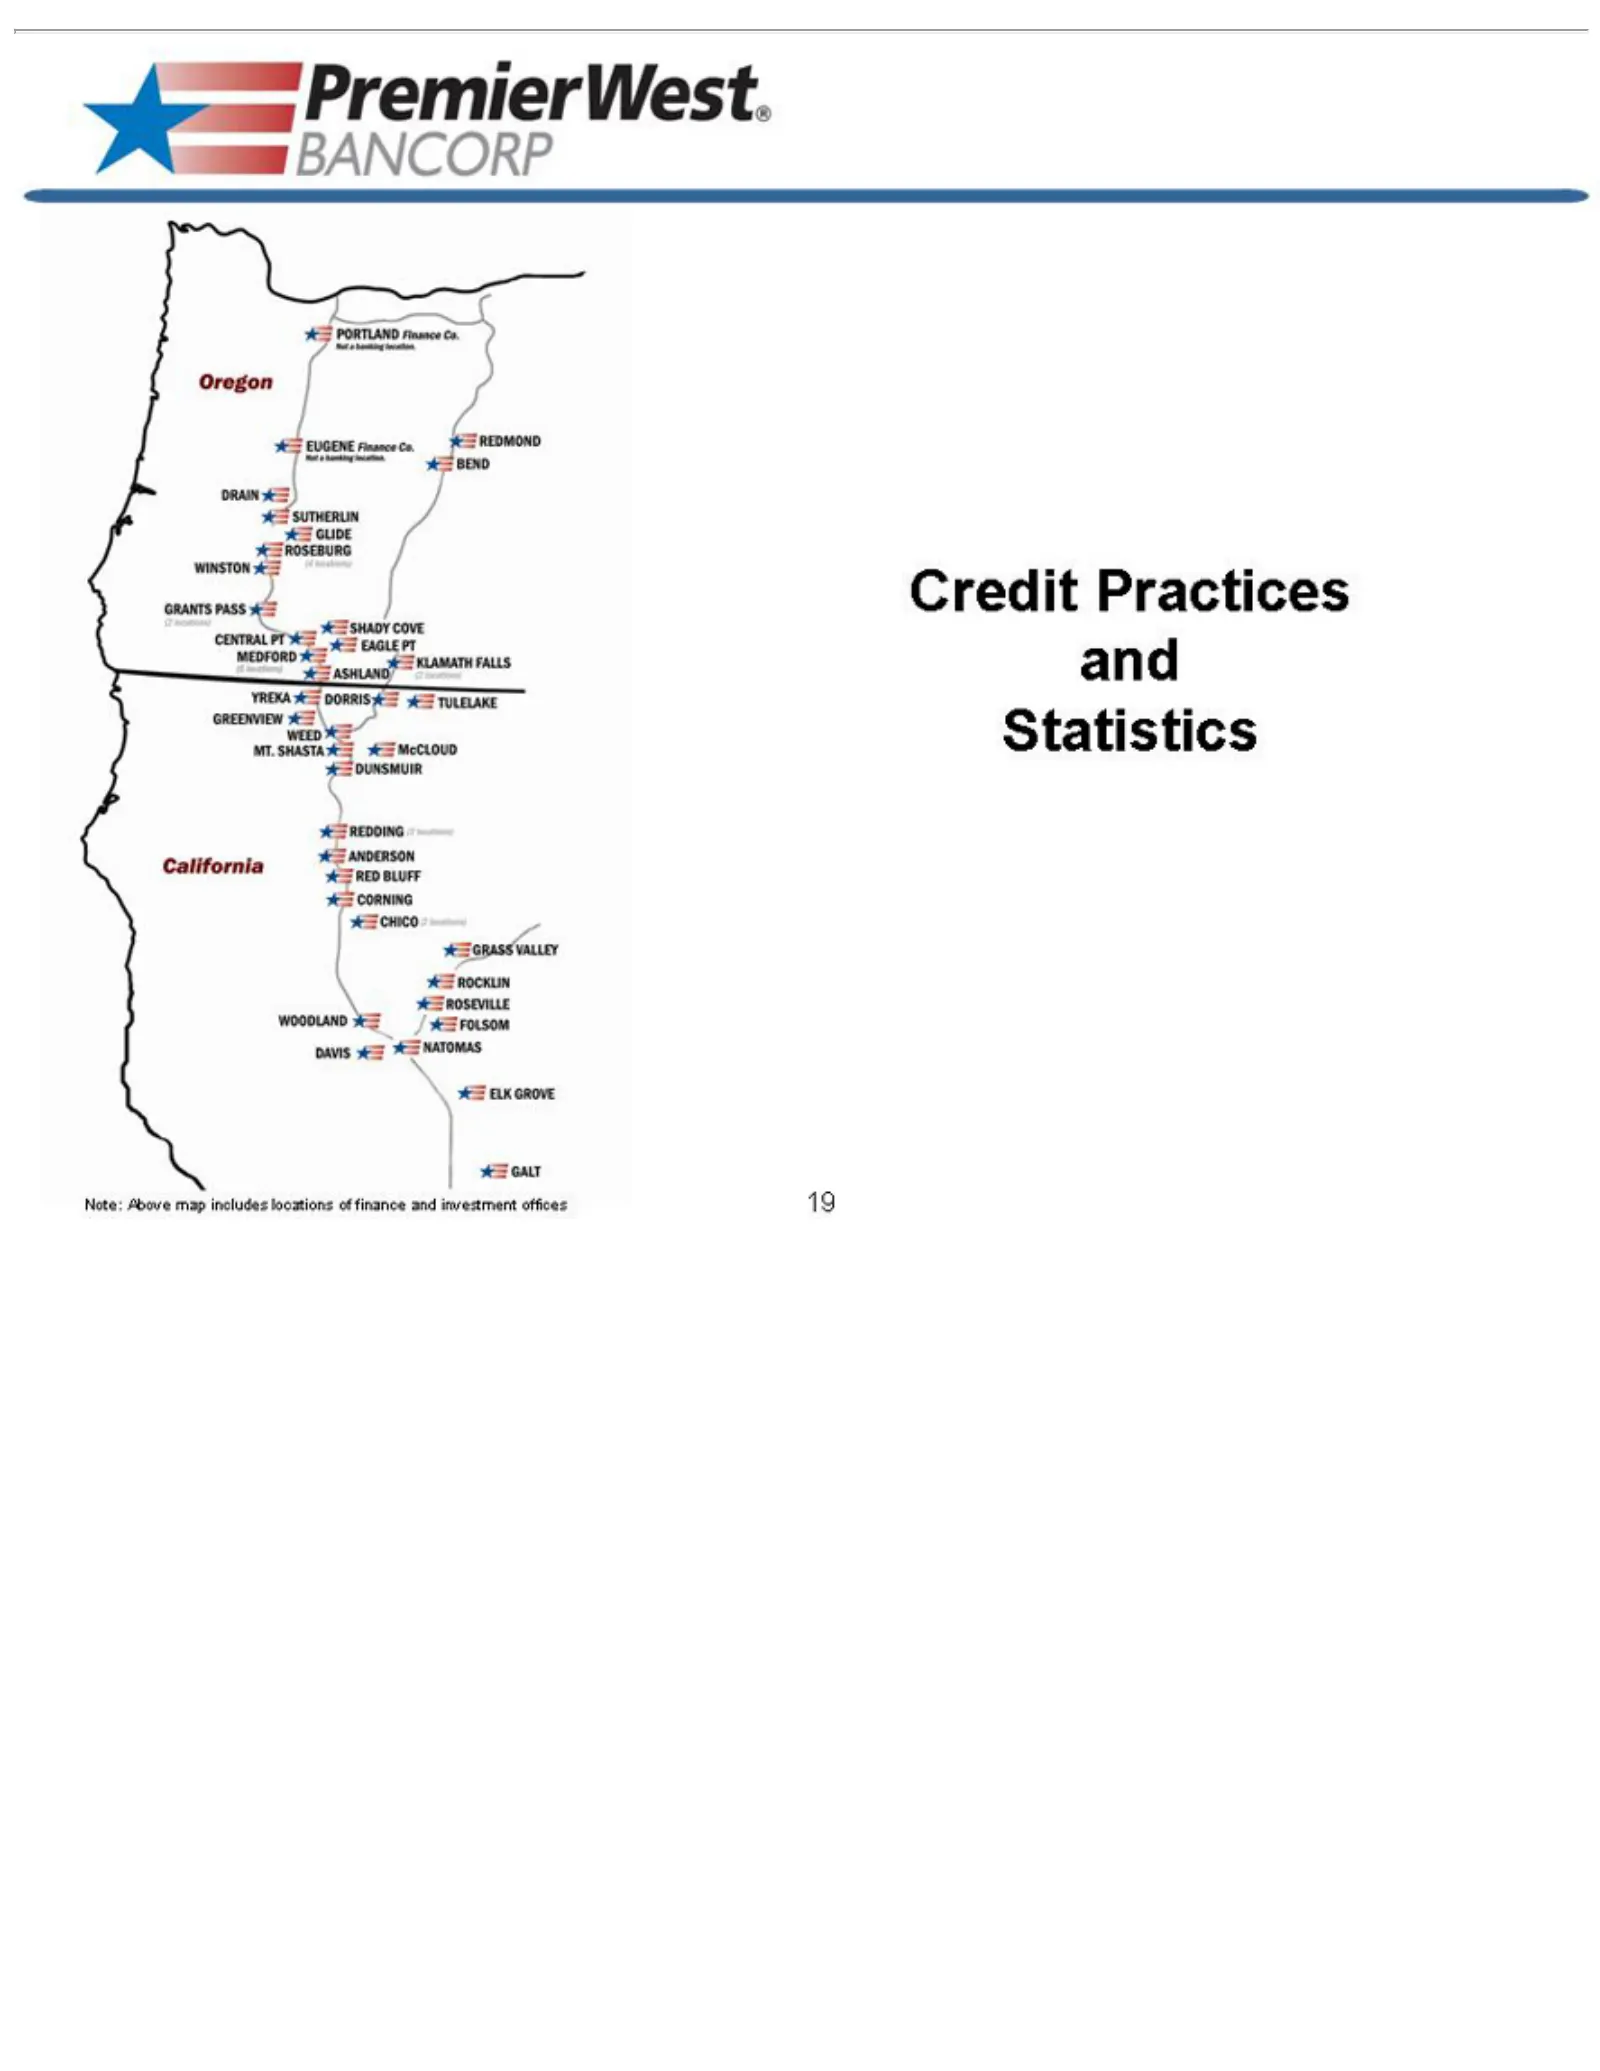
Slide 19: Credit Practices and Statistics
Note: Above Credit 19 Practices mapand includes Statistics locations of finance and investment offices
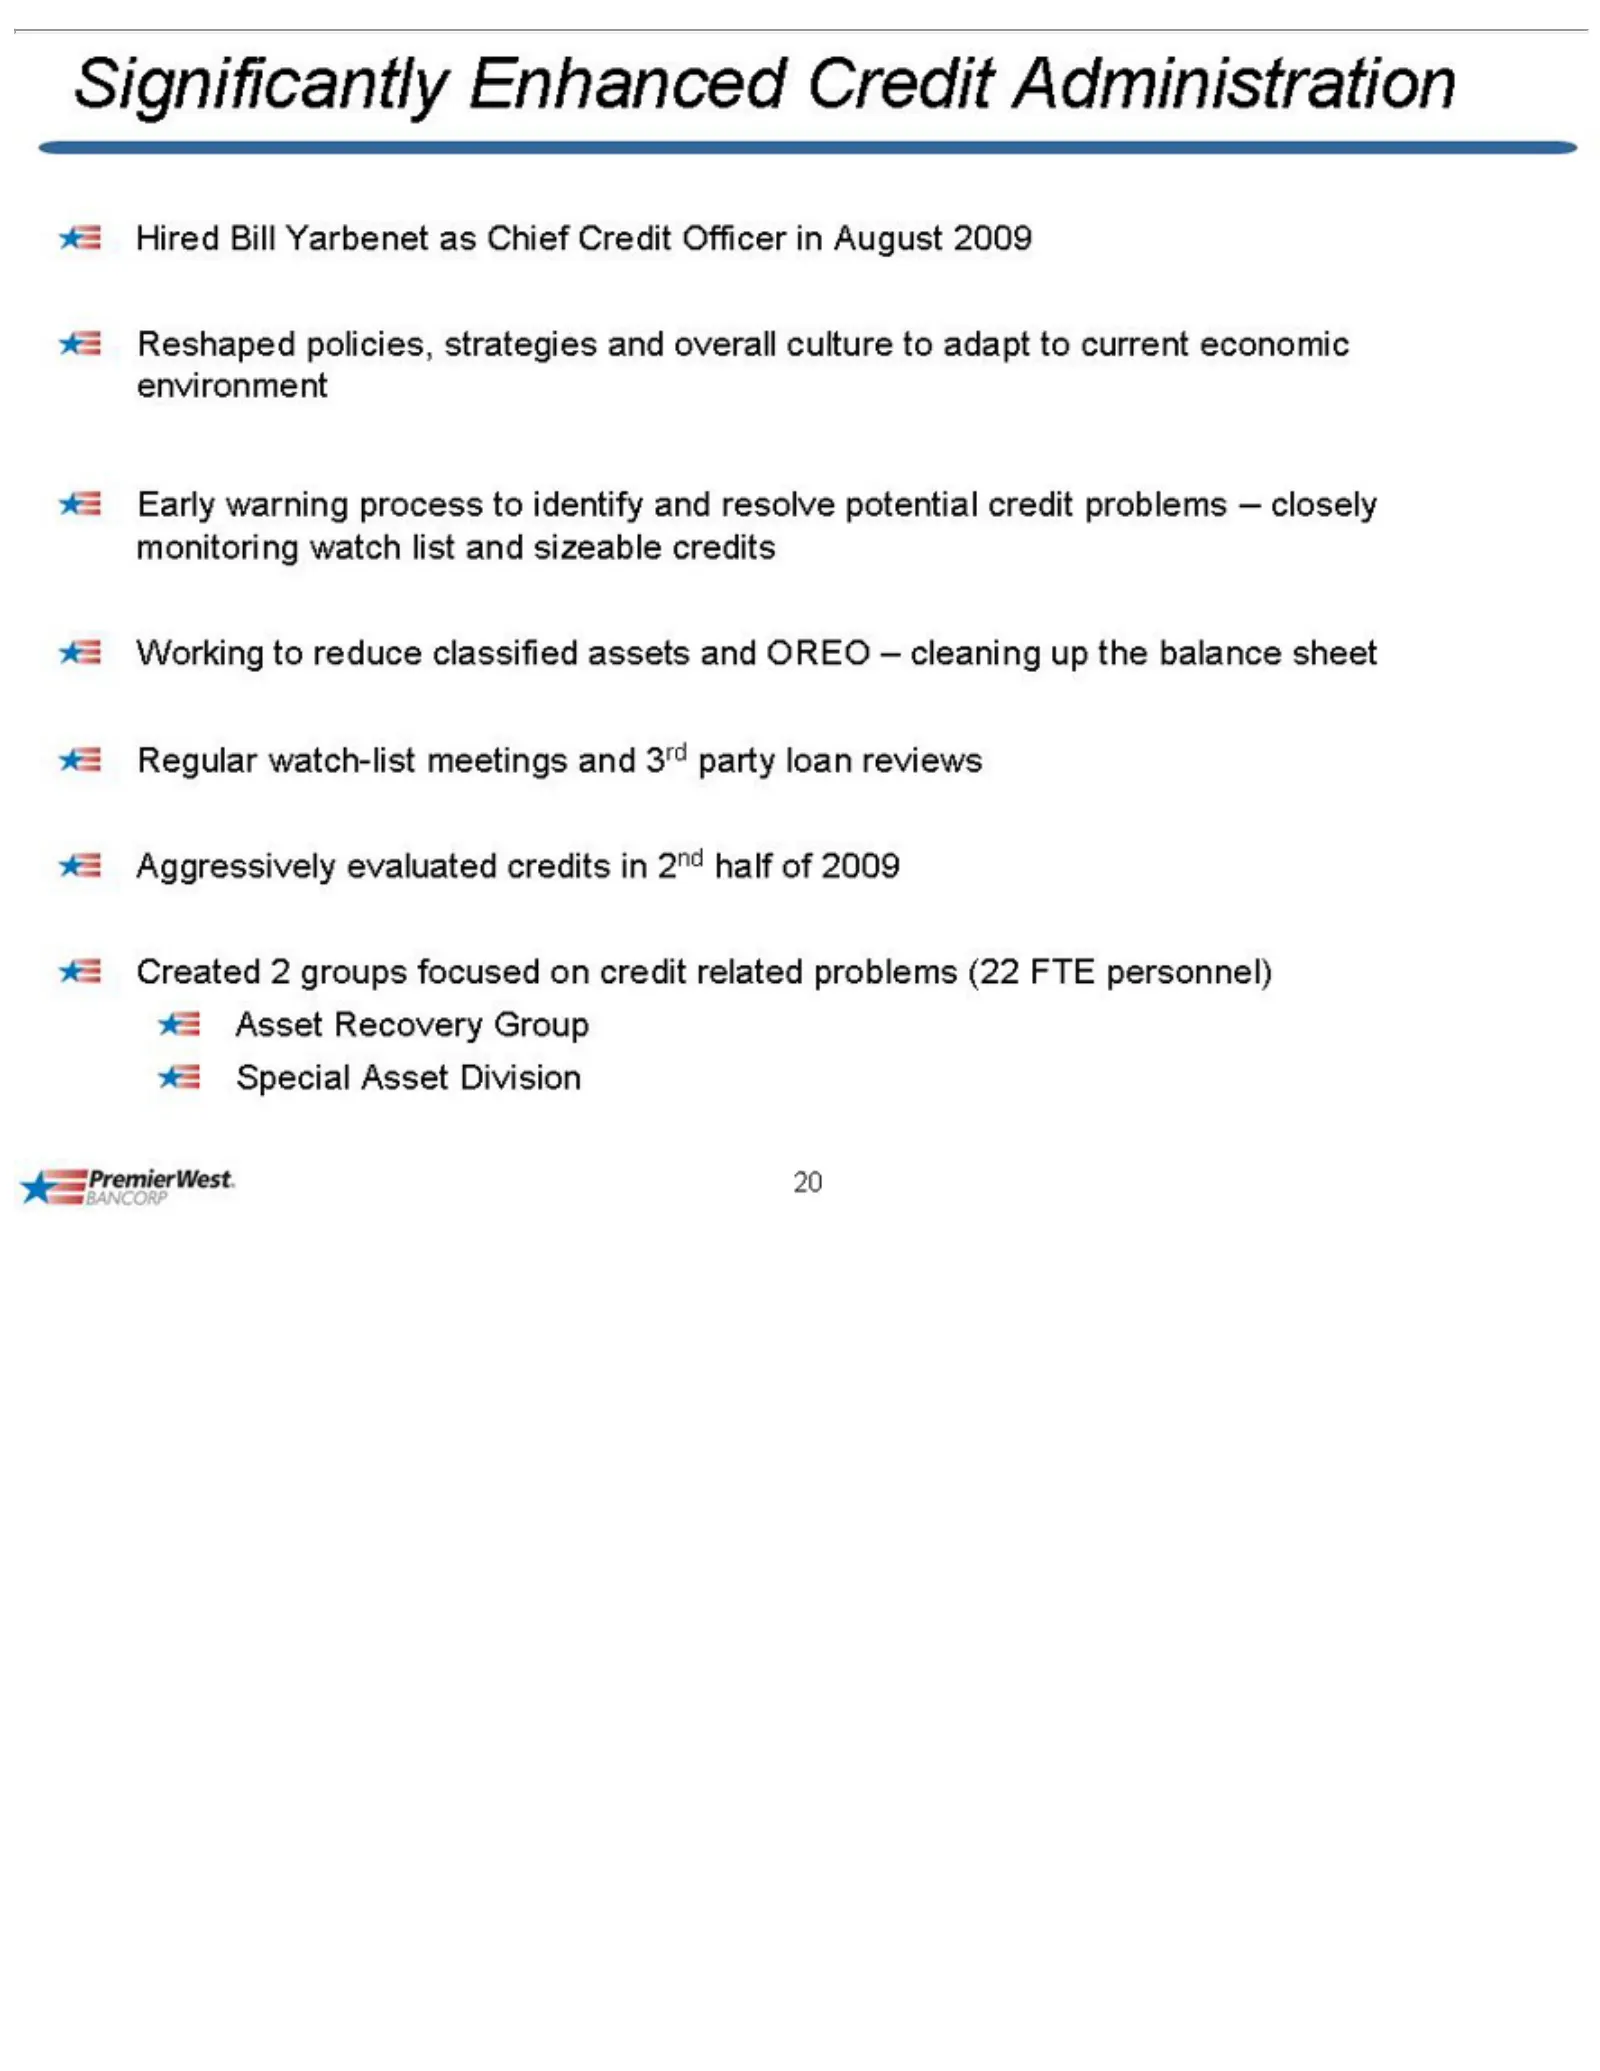
Slide 20: Significantly Reshaped Credit Culture
Significantly Hired Reshaped Early Working Created 20 warning Bill 2togroups policies, Yarbenet reduce Enhanced process focused classified strategies as Chief toCredit identify on Credit credit assets and Administration overall and related and Officer resolve OREO culture problems in potential Augus
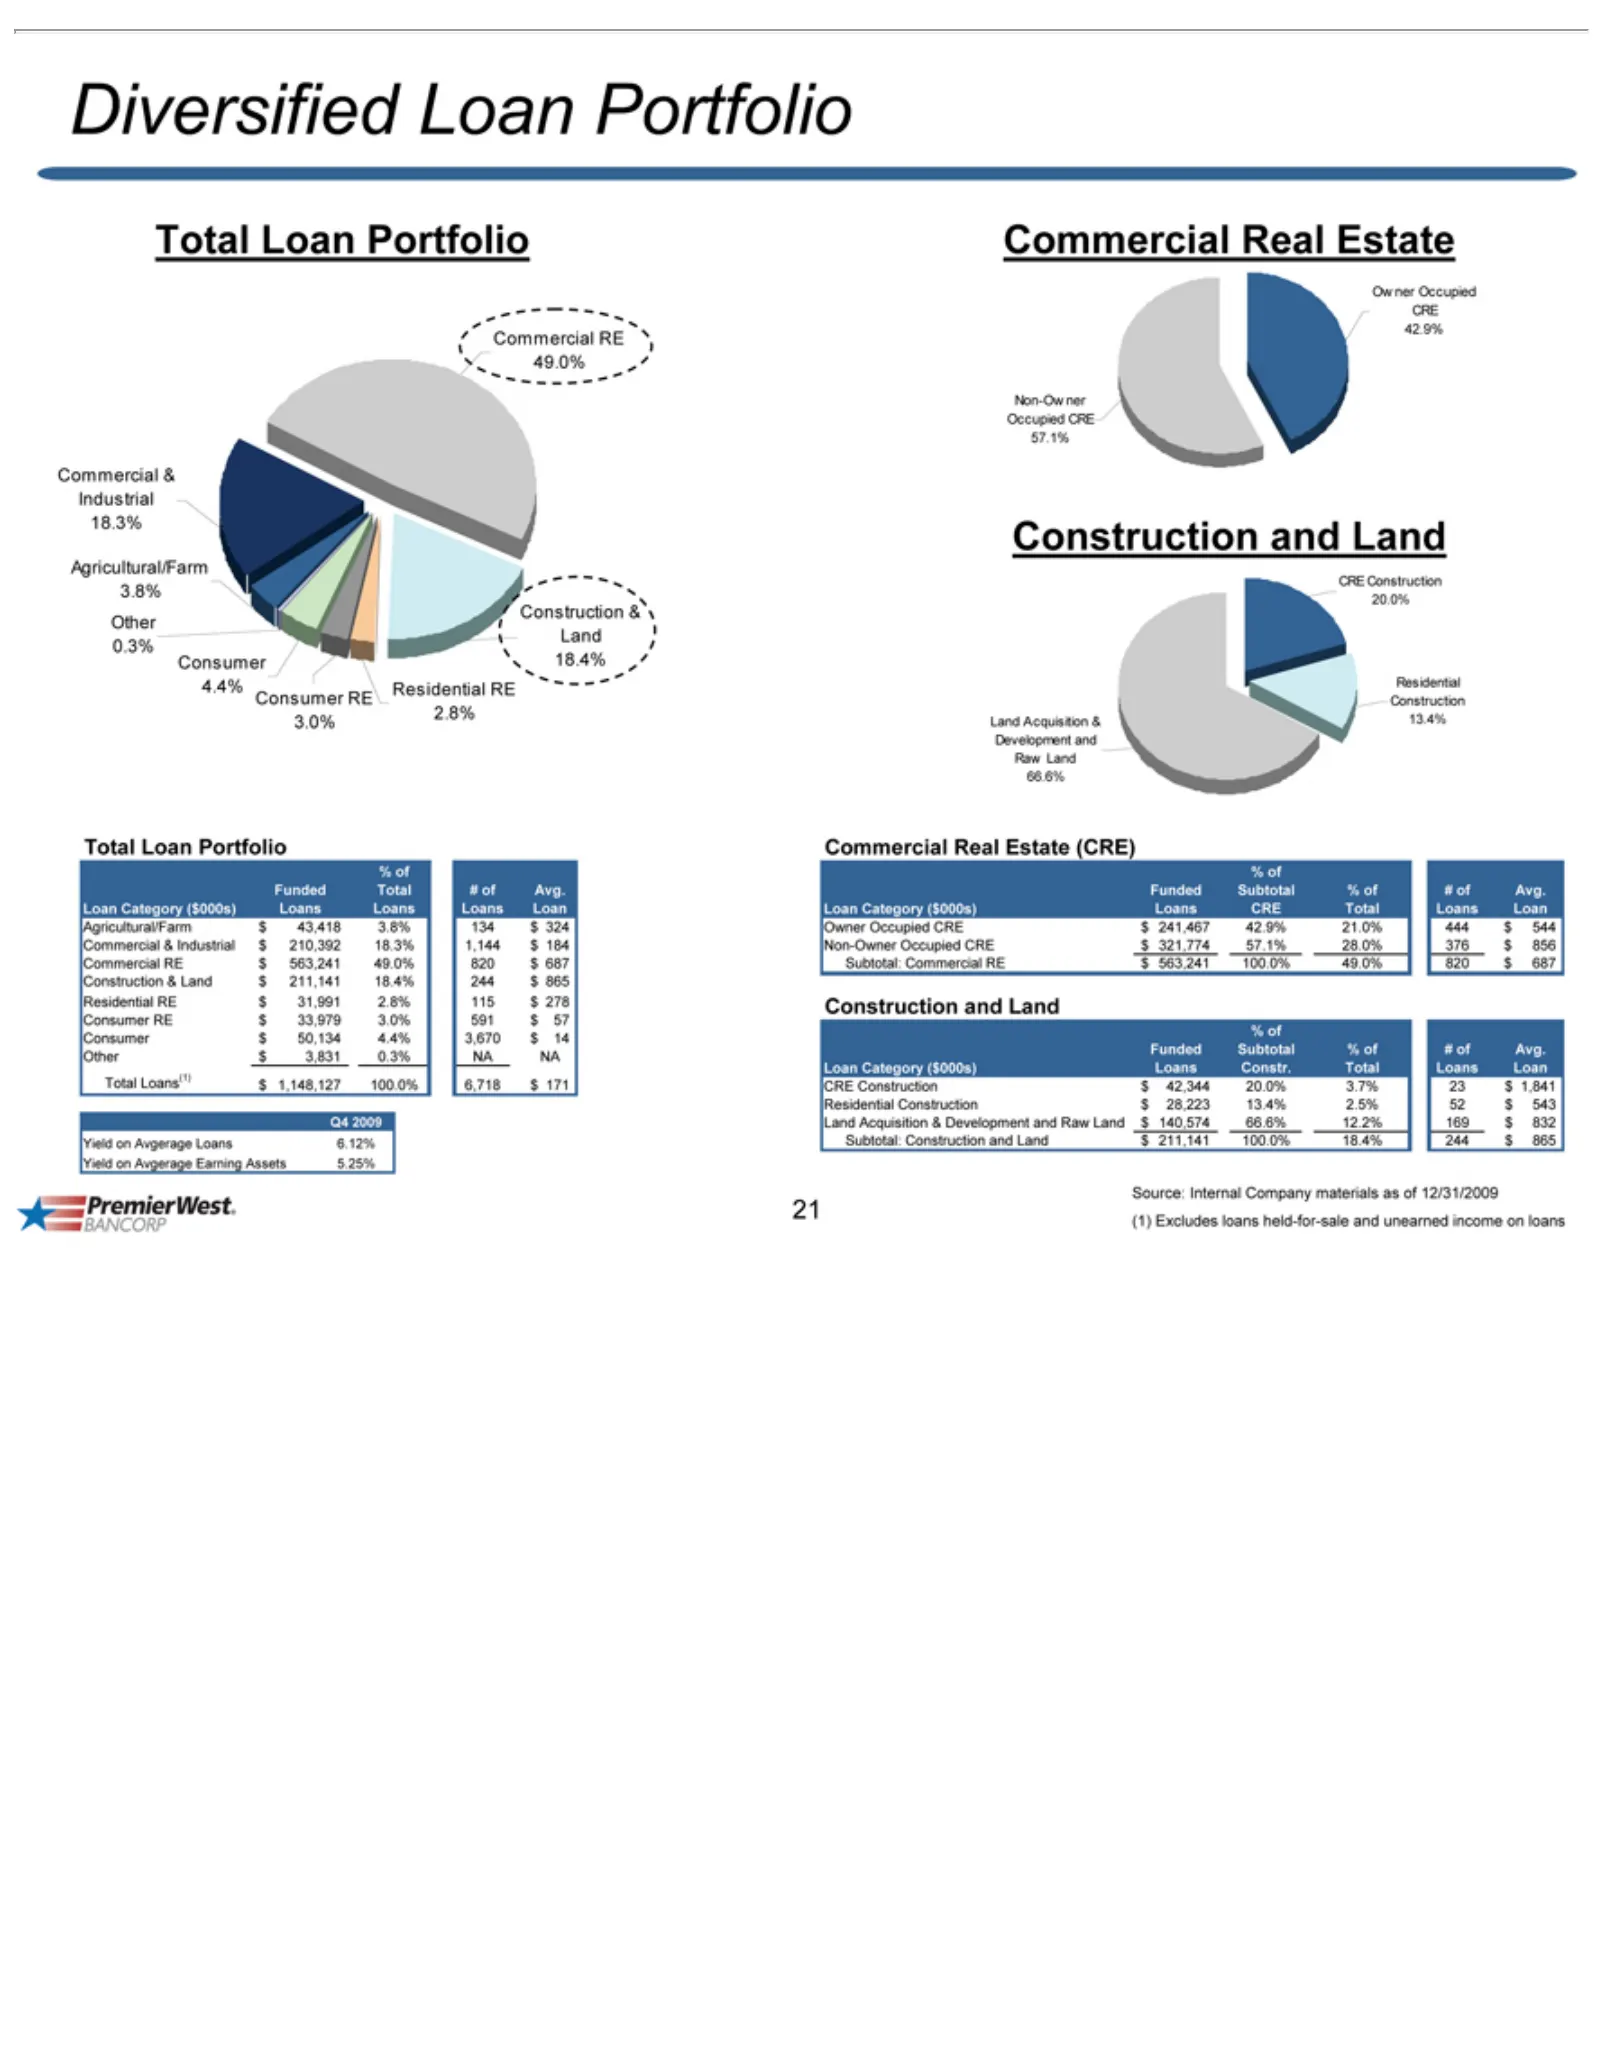
Slide 21: Diversified Loan Portfolio and CRE Detail
(1) Diversified 49.0% 3.8% 18.3% Industrial 4.4% 3.0% Occupied 42.9% 57.1% 20.0% Development Raw 66.6% Agricultural/Farm Consumer Other Total Q4 Yield Commercial Owner Non-Owner Construction Loan Funded #% Avg. CRE Residential Land Subtotal: Source: 21ofof2009 Loans Land Total Loan Subtotal Construc
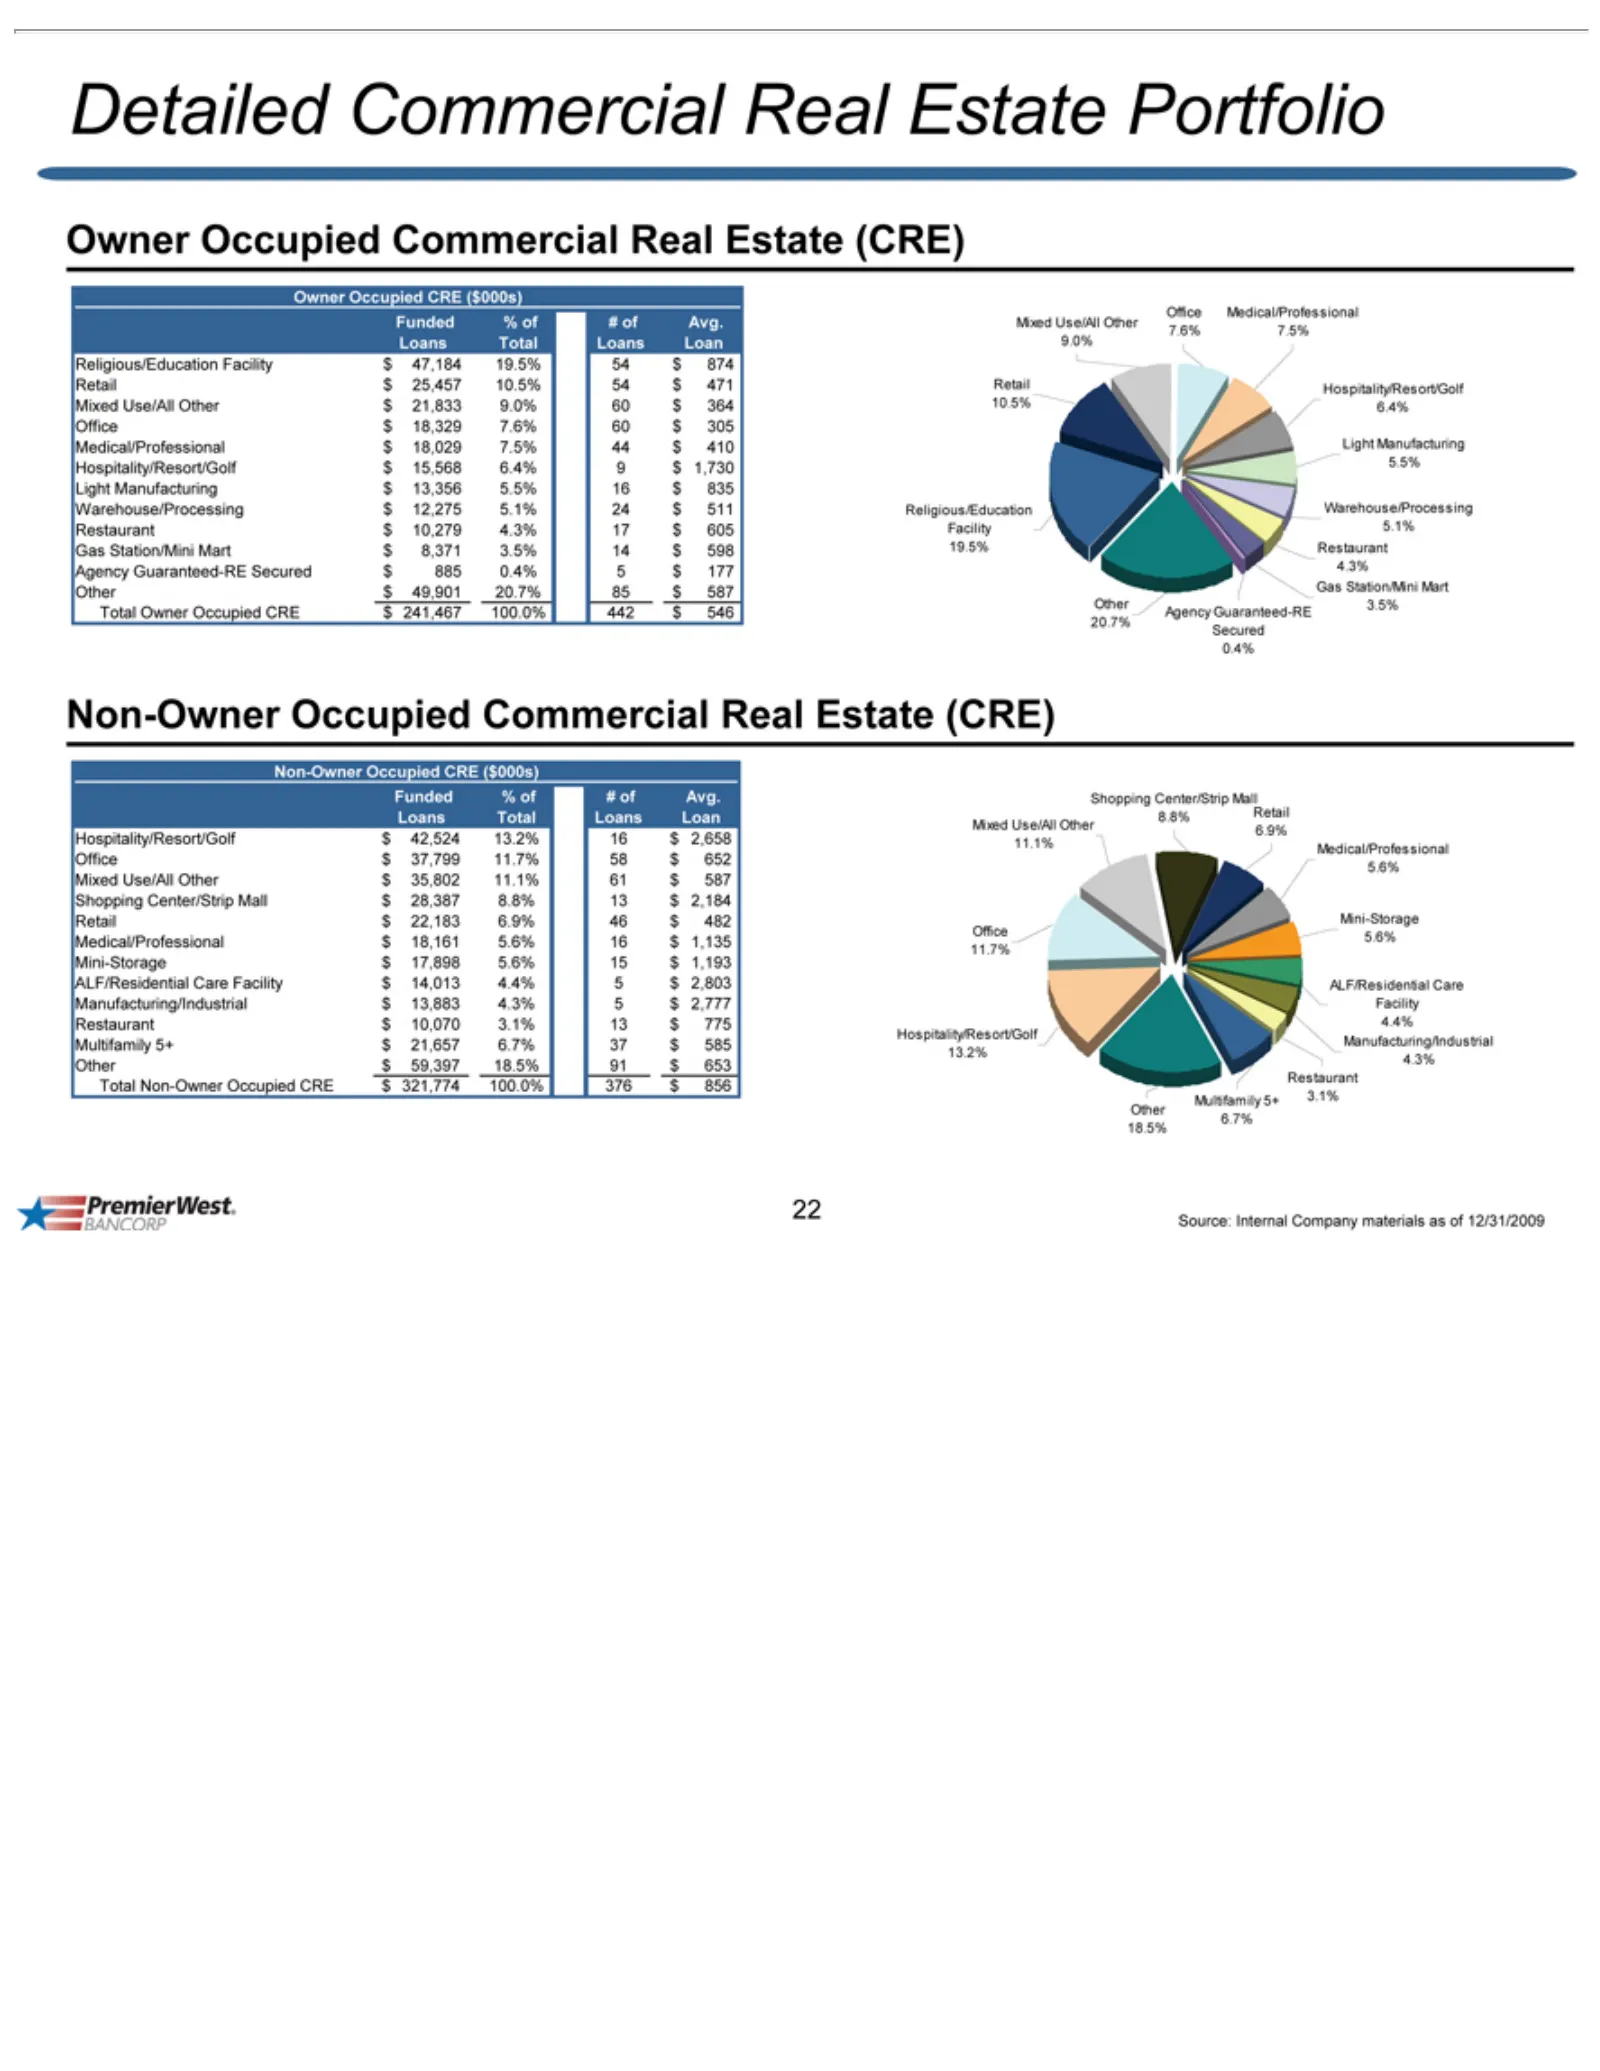
Slide 22: Detailed Owner and Non-Owner Occupied CRE
Detailed Owner #% Avg. 9.0% Light Religious/Education 5.5% Warehouse/Processing Gas Agency 0.4% Secured Non-Owner Funded Medical/Professional Manufacturing/Industrial Total Shopping Retail Mixed 11.1% Mini-Storage 5.6% ALF/Residential 11.7% Office Hospitality/Resort/Golf 4.4% Facility Restaurant 4.3
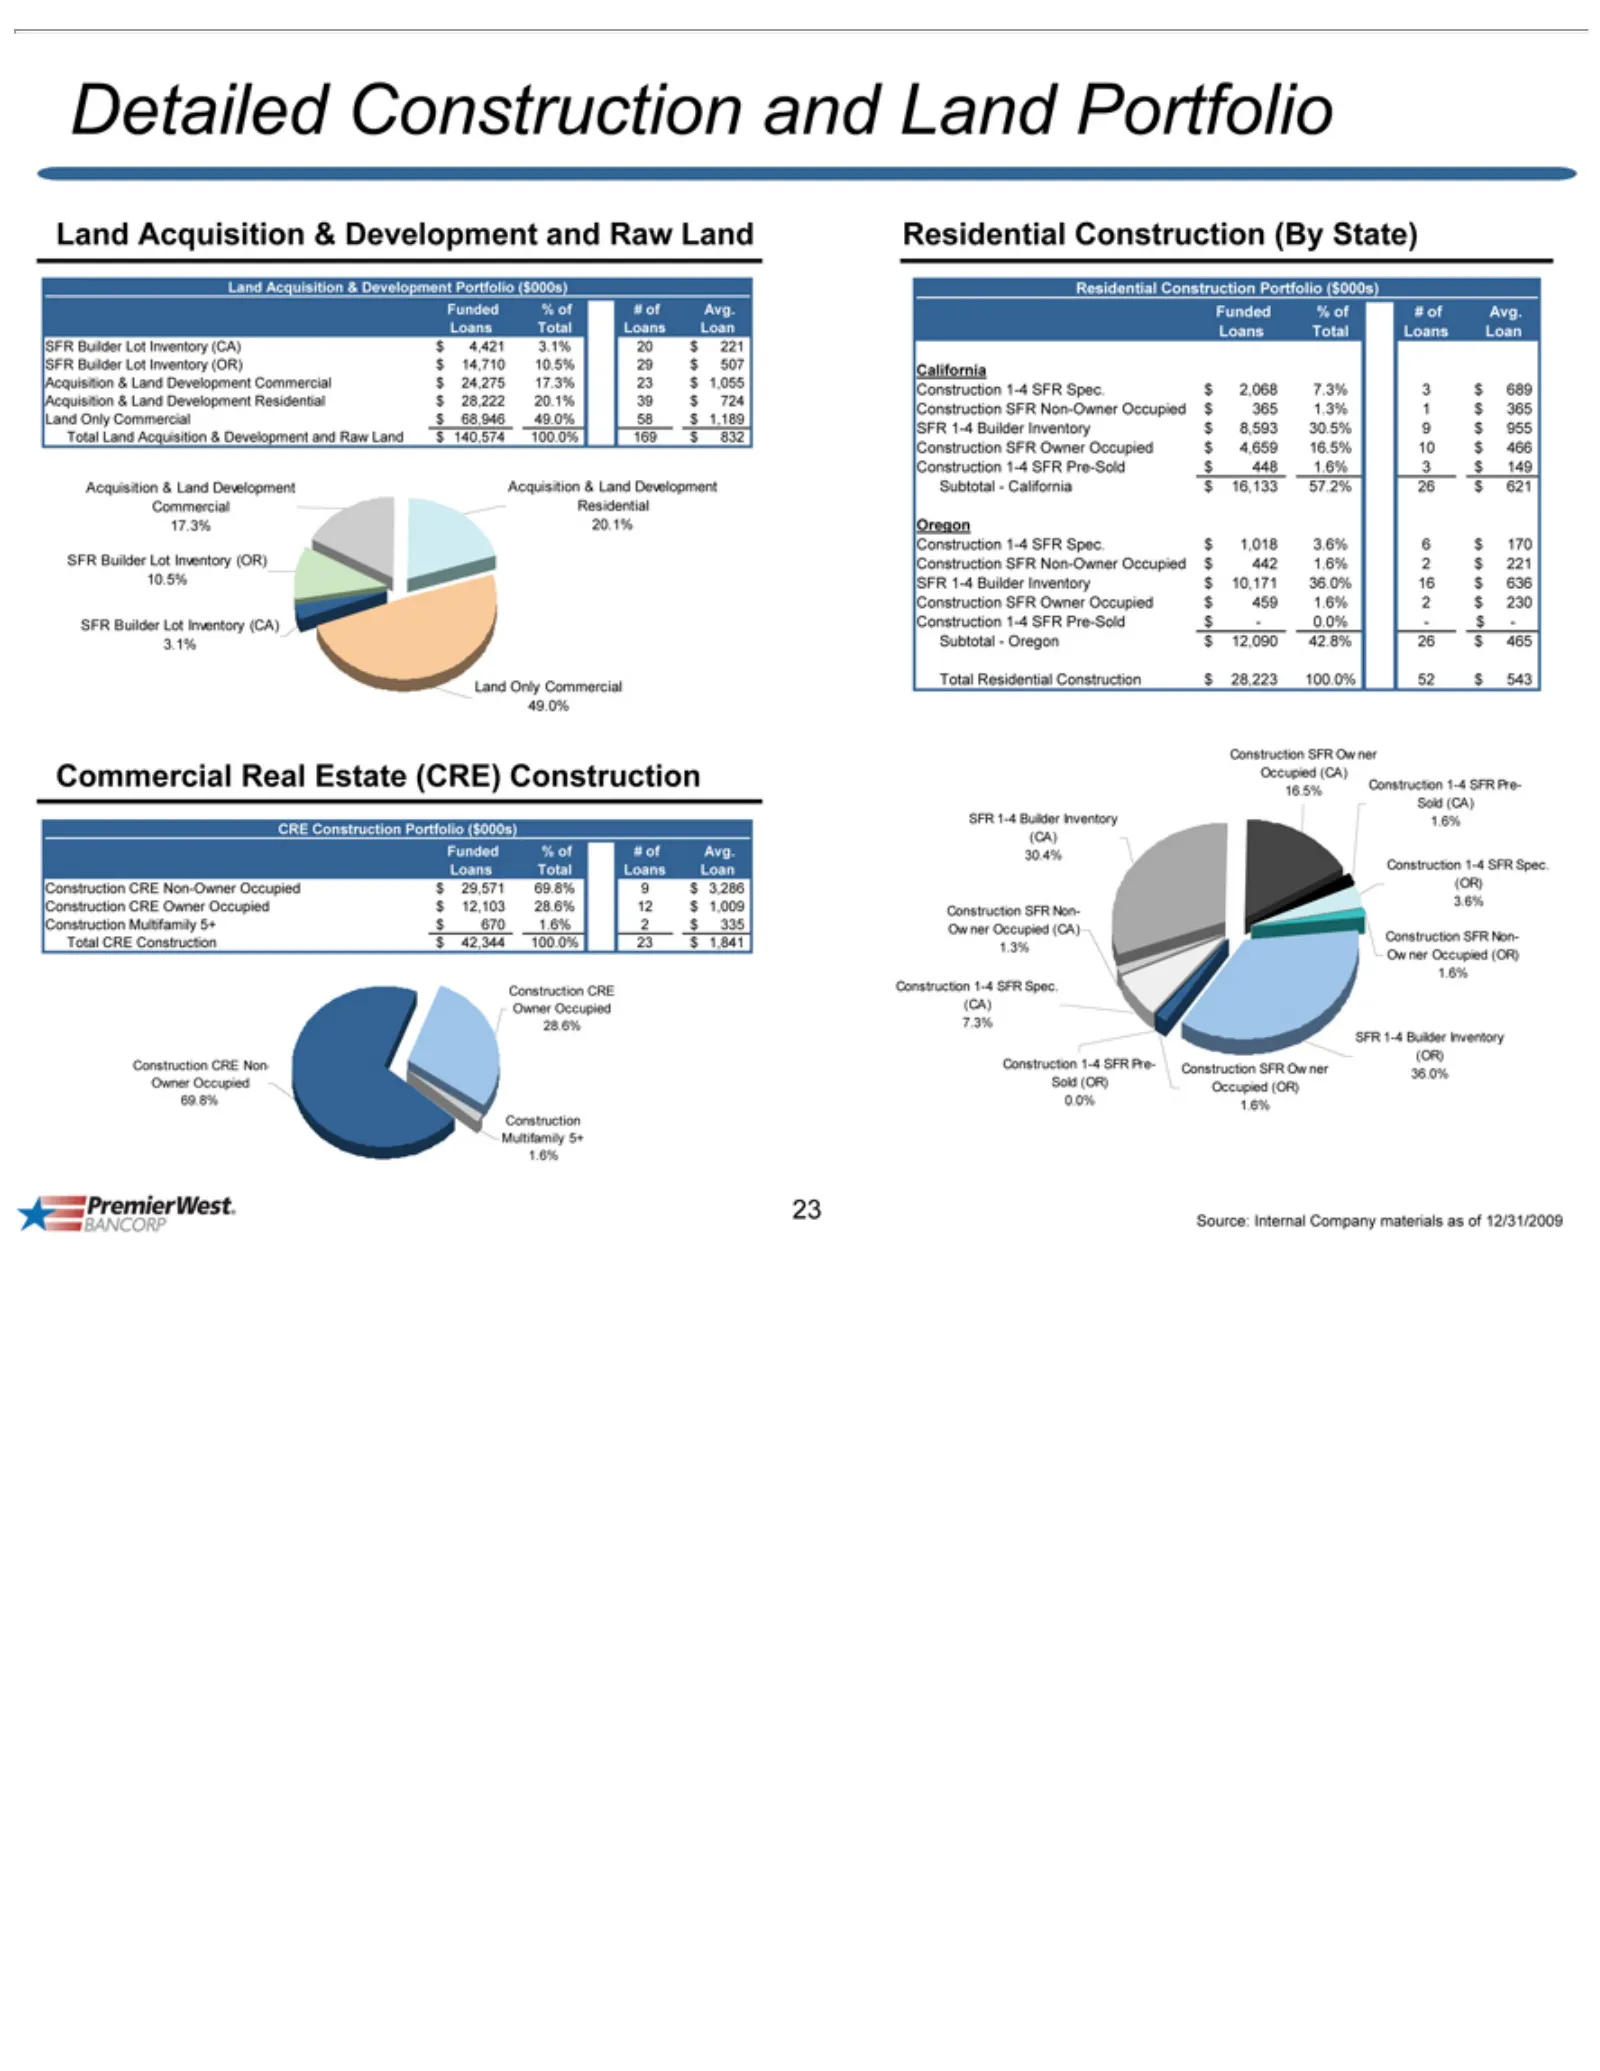
Slide 23: Detailed Acquisition and Land Development Construction
Detailed Acquisition 10.5% Land 3.1% Commercial 49.0% CRE 28.6% Multifamily 69.8% Residential Funded California Oregon Subtotal Total Occupied 16.5% 30.4% 3.6% Owner SFR 7.3% (CA) (OR) Construction Sold Source: 1.6% 23 Builder 1-4 (CA) (OR) Construction Acquisition Land CRE Residential Only 36.0% Co
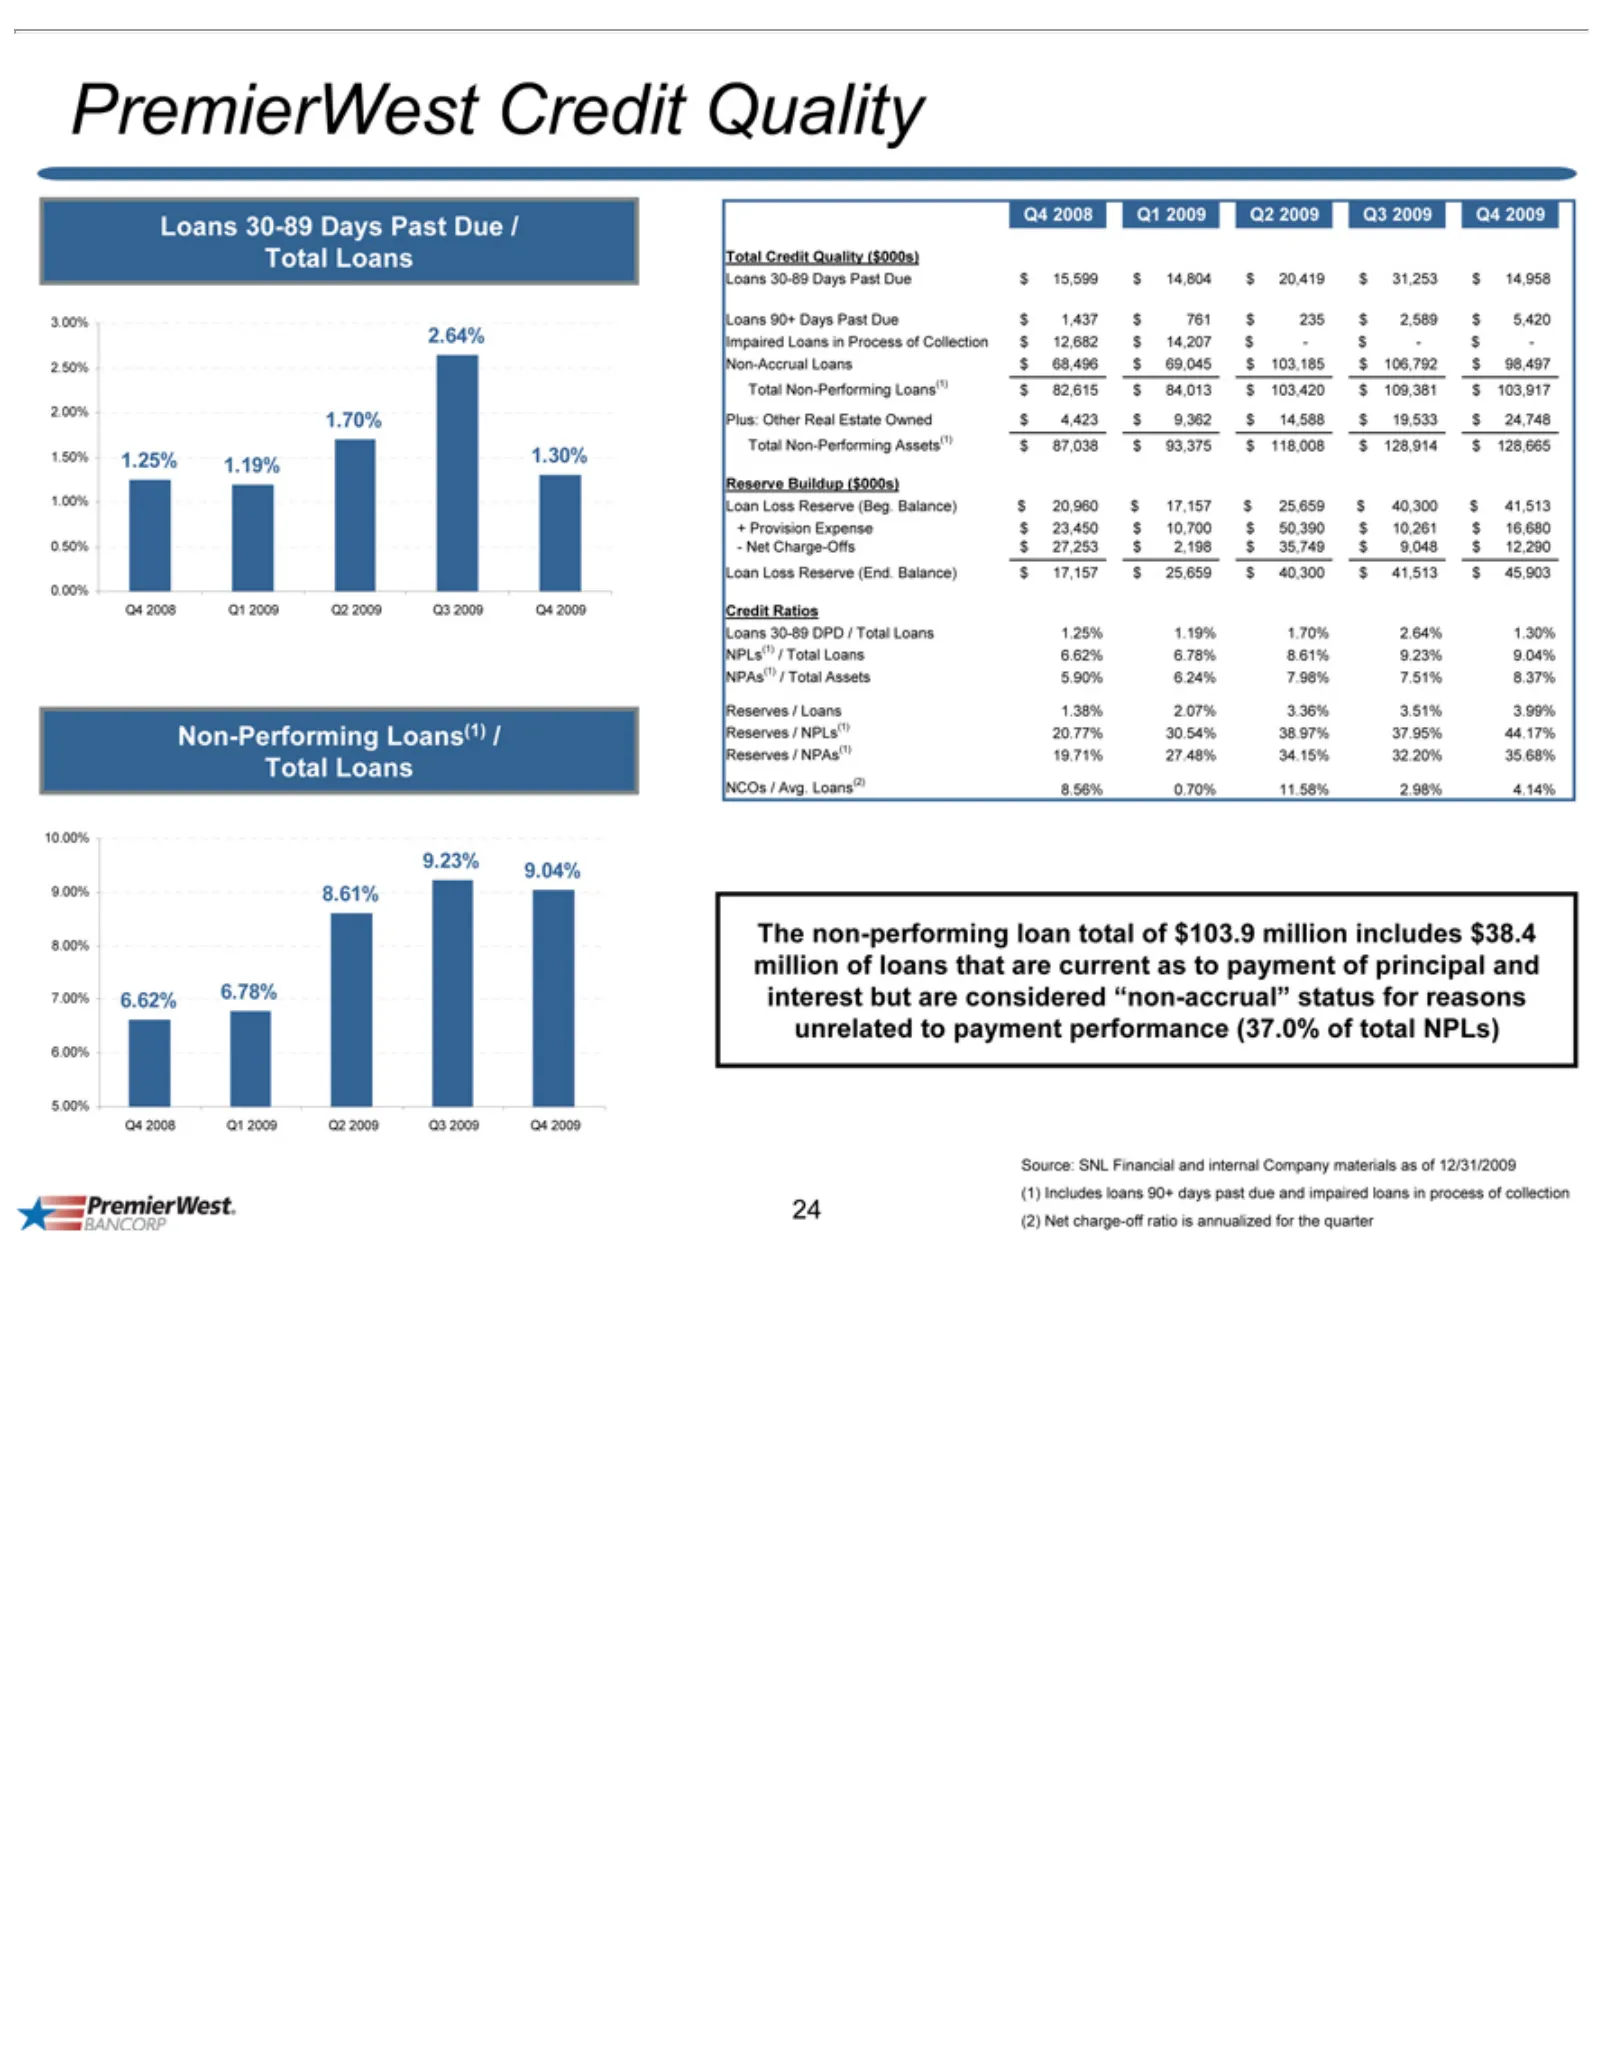
Slide 24: PremierWest Non-Performing Loans and Credit Quality
PremierWest 2.00% 2.50% 2.64% 3.00% 1.50% 0.00% 0.50% 1.00% Non-Performing 9.23% 10.00% 9.00% 7.00% 8.00% 5.00% 6.00% Q4 Impaired Non-Accrual Plus: Total Reserve -+ Loan Credit Loans NPLs(1) NPAs(1) Reserves NCOs The performance Source: 24Net Provision 2008 non-performing Other Charge-Offs Loans Cre
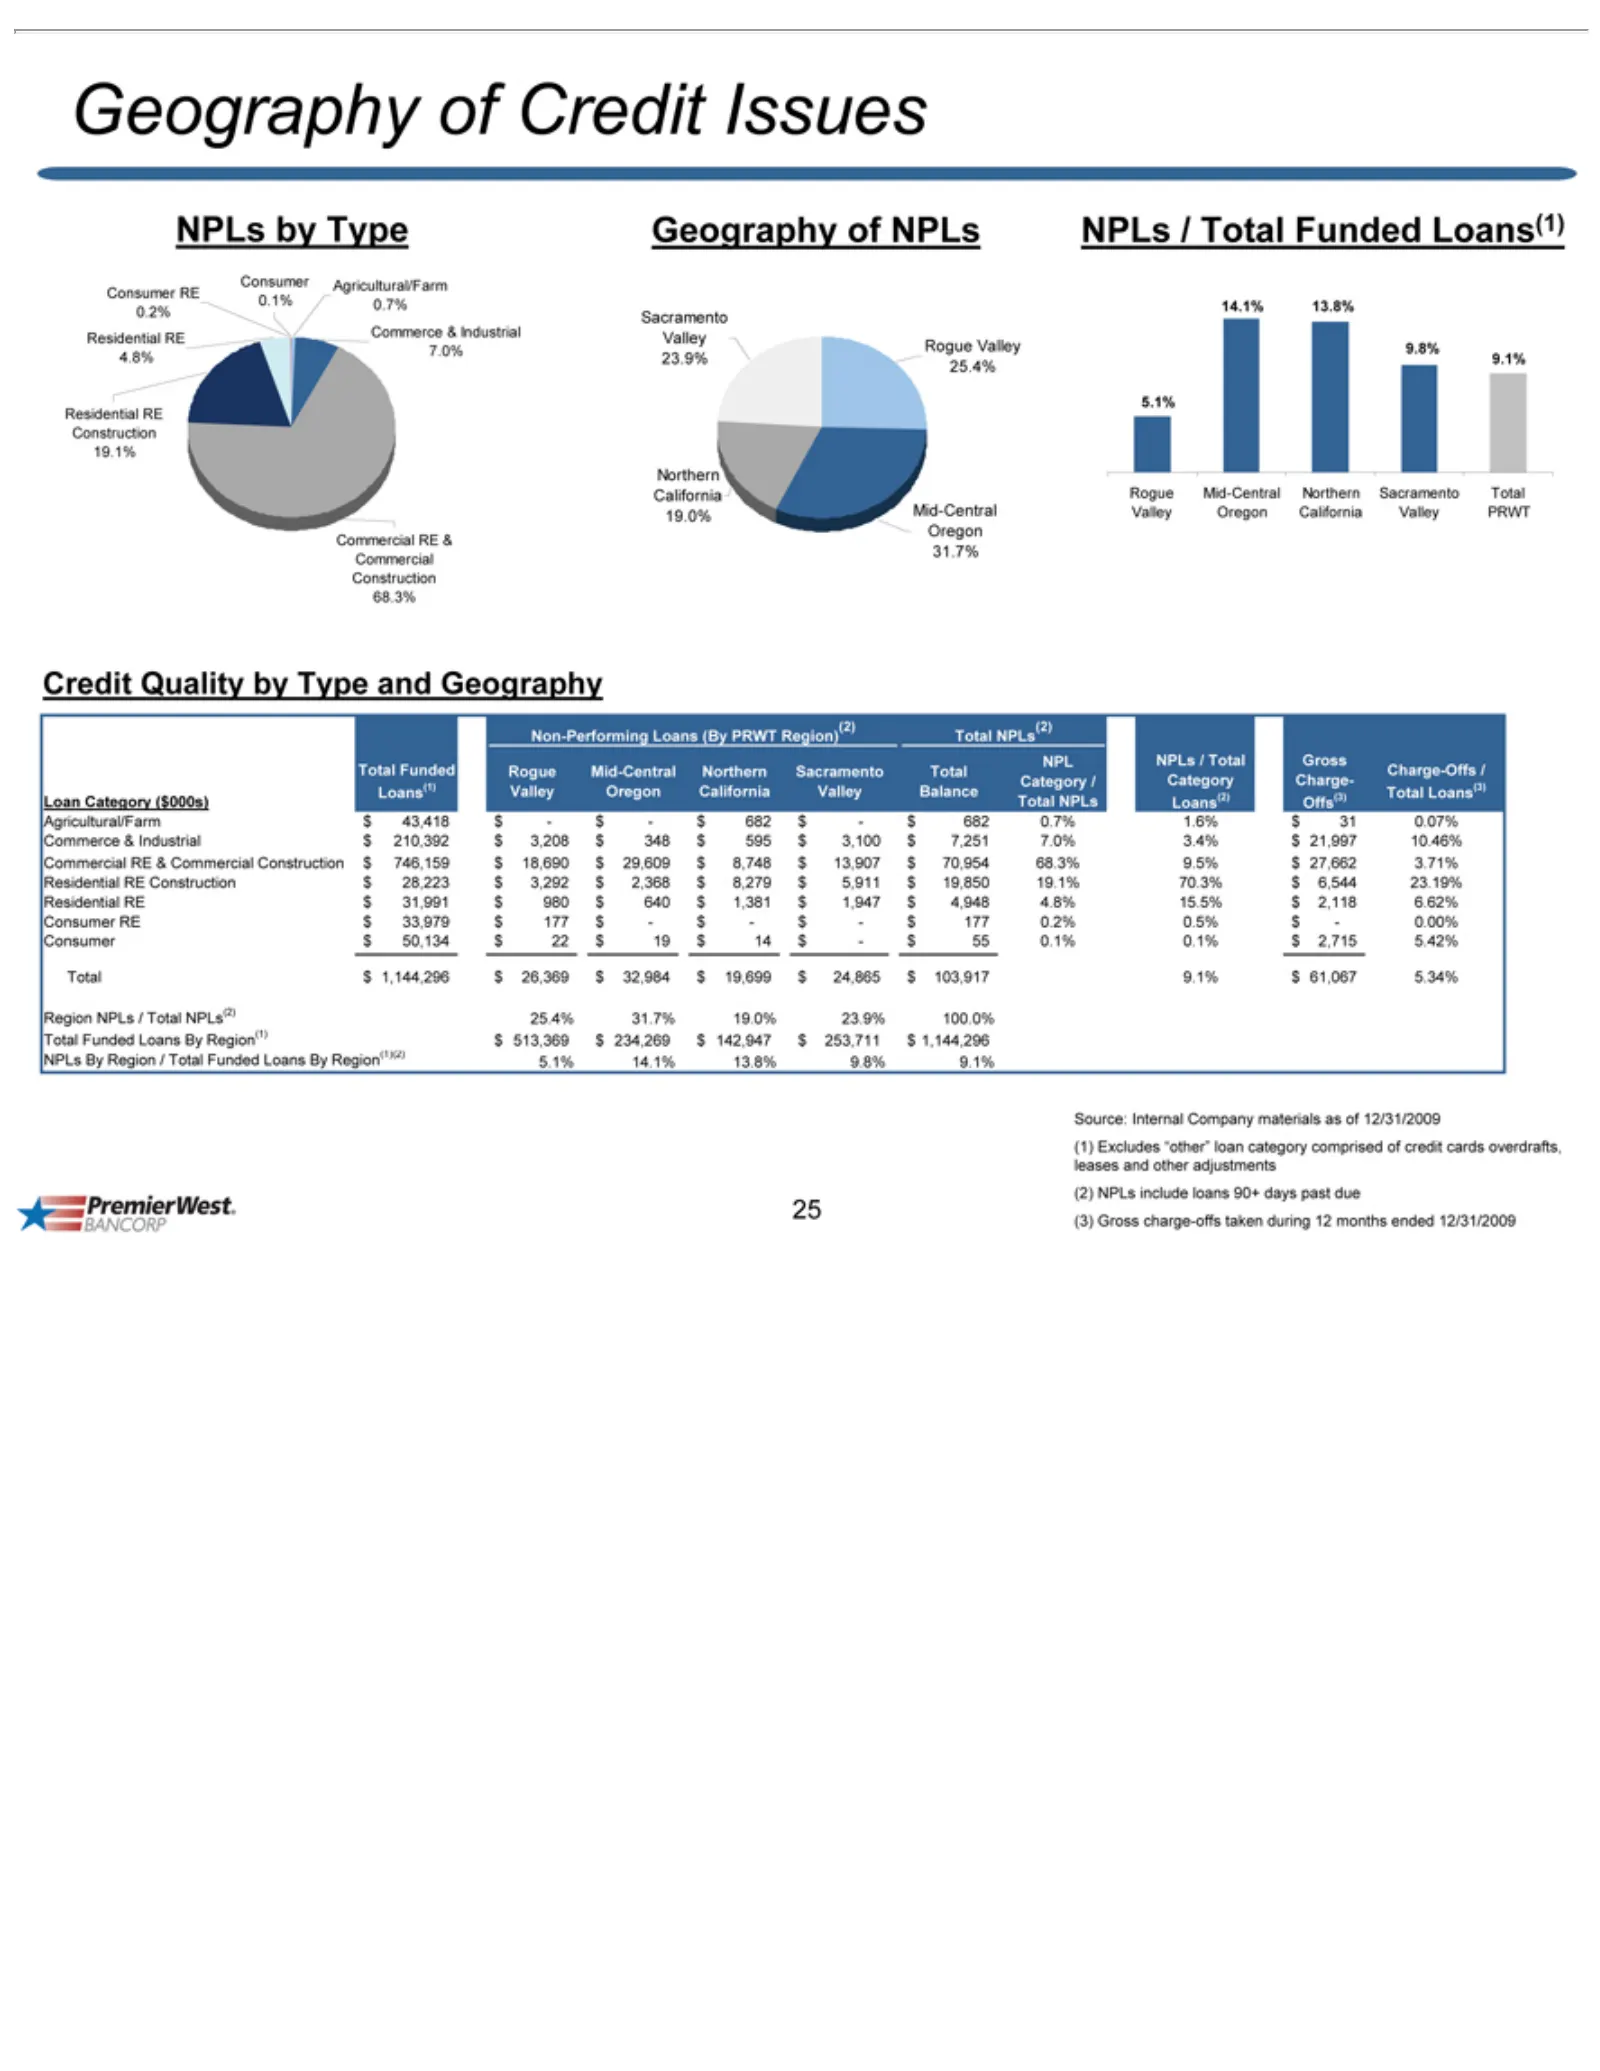
Slide 25: Non-Performing Loans by Geography and Type
19.1% Geography 68.3% Construction Sacramento 19.0% California Northern 14.1% Rogue 5.1% 9.1% 9.8% Credit Non-Performing Mid-Central Charge-Offs Loan Agricultural/Farm Commerce Commercial Residential Consumer Region Total NPLs Source: (1) 25 Excludes $Category Funded /by By Quality 13.8% Valley Tota
Slide 26: Appendix
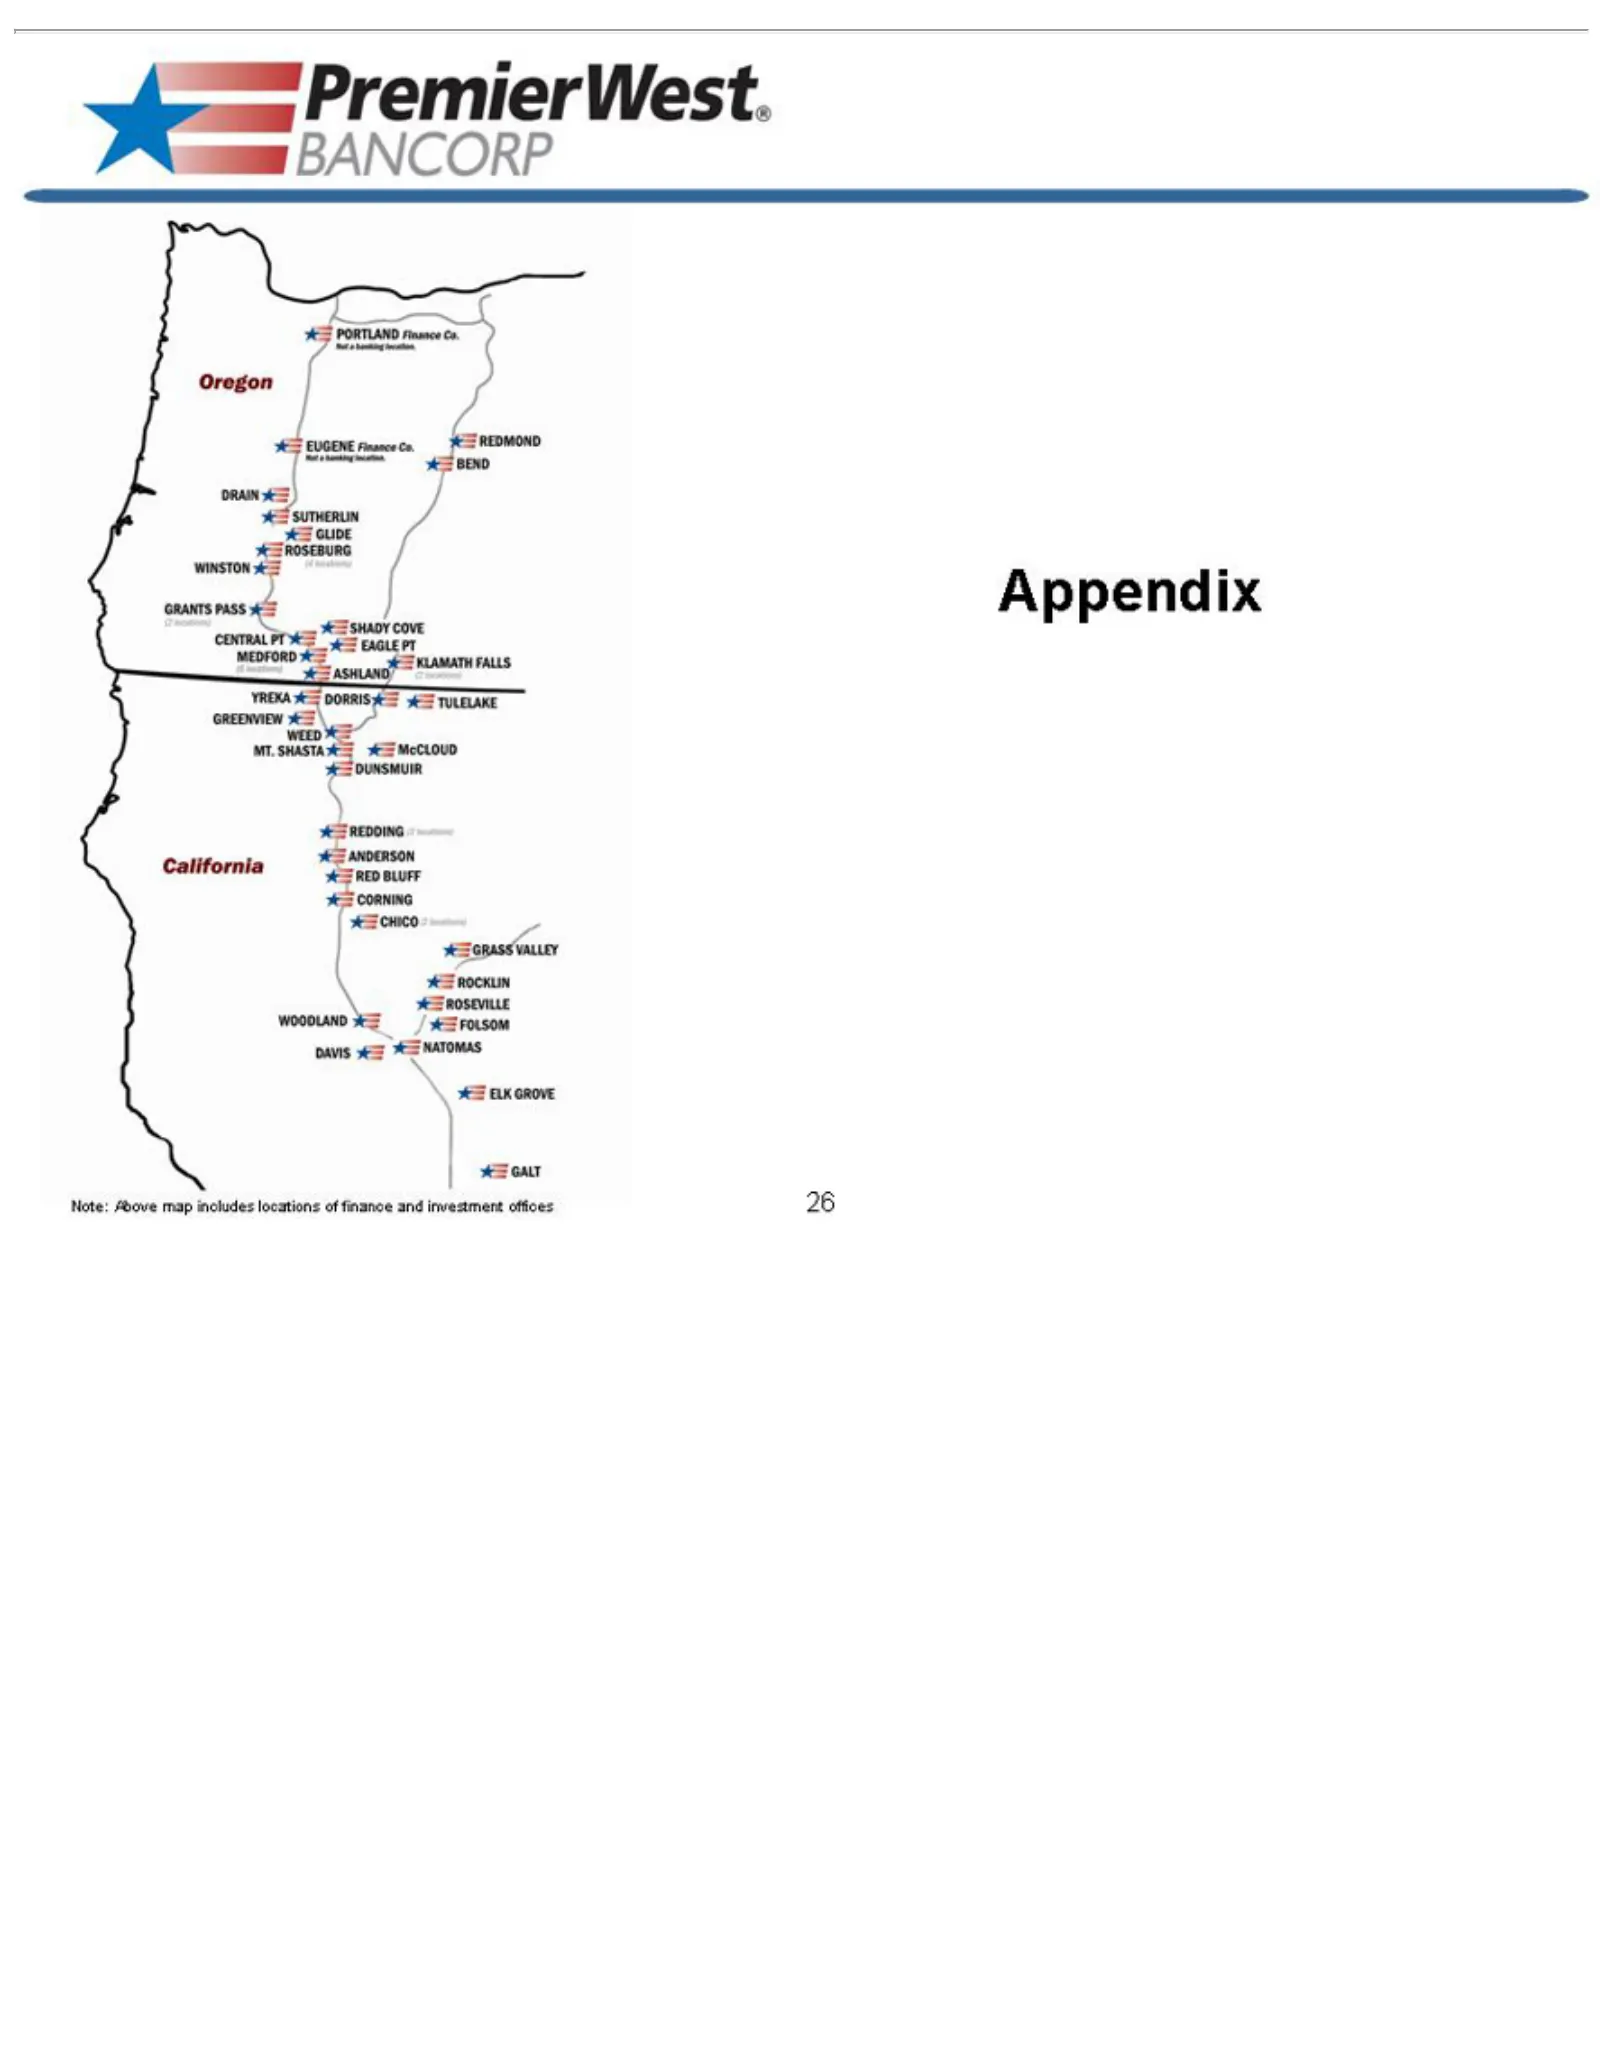
Note: Above map includes locations of finance and investment offices 26 Appendix
Slide 27: Historical Deal Activity
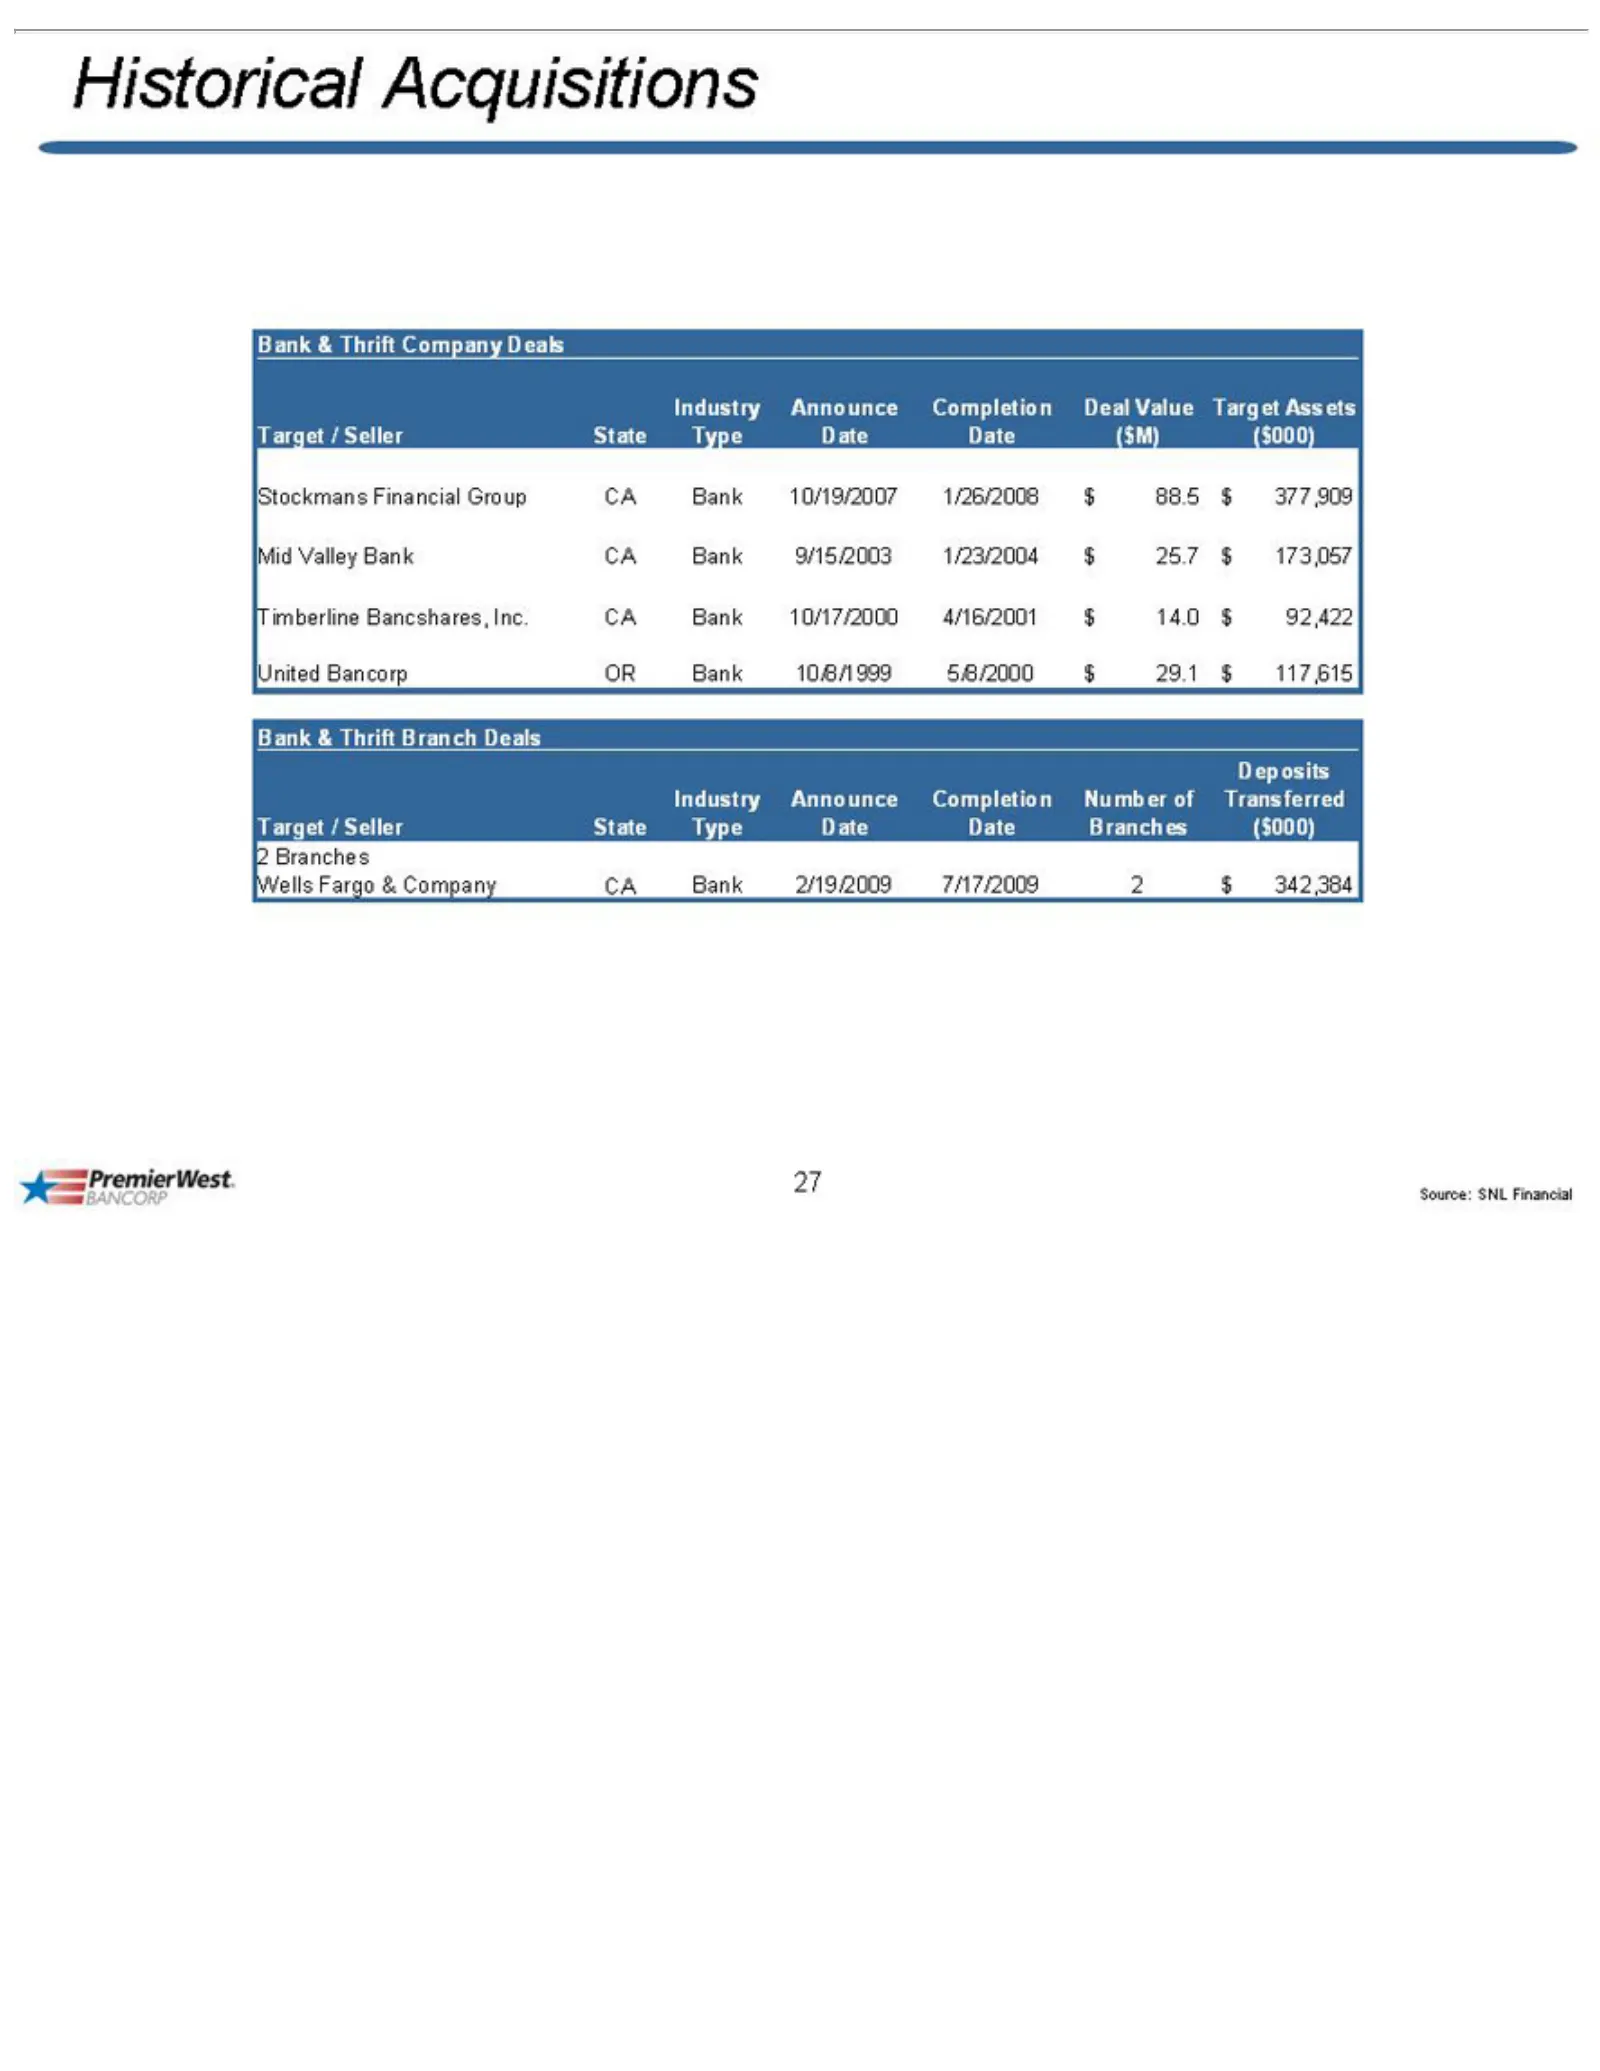
Historical Deal Stockmans Mid Timberline United Bank Target Industry State Announce Completion Number Deposits Wells Source: 27 Valley Value &Fargo Assets /Bancorp Seller Seller2 SNL Thrift of Type Transferred Acquisitions Date Branches Financial ($M) Bancshares, Bank Date &Financial ($000) Company
Slide 28: Insiders Rights Offering Participation
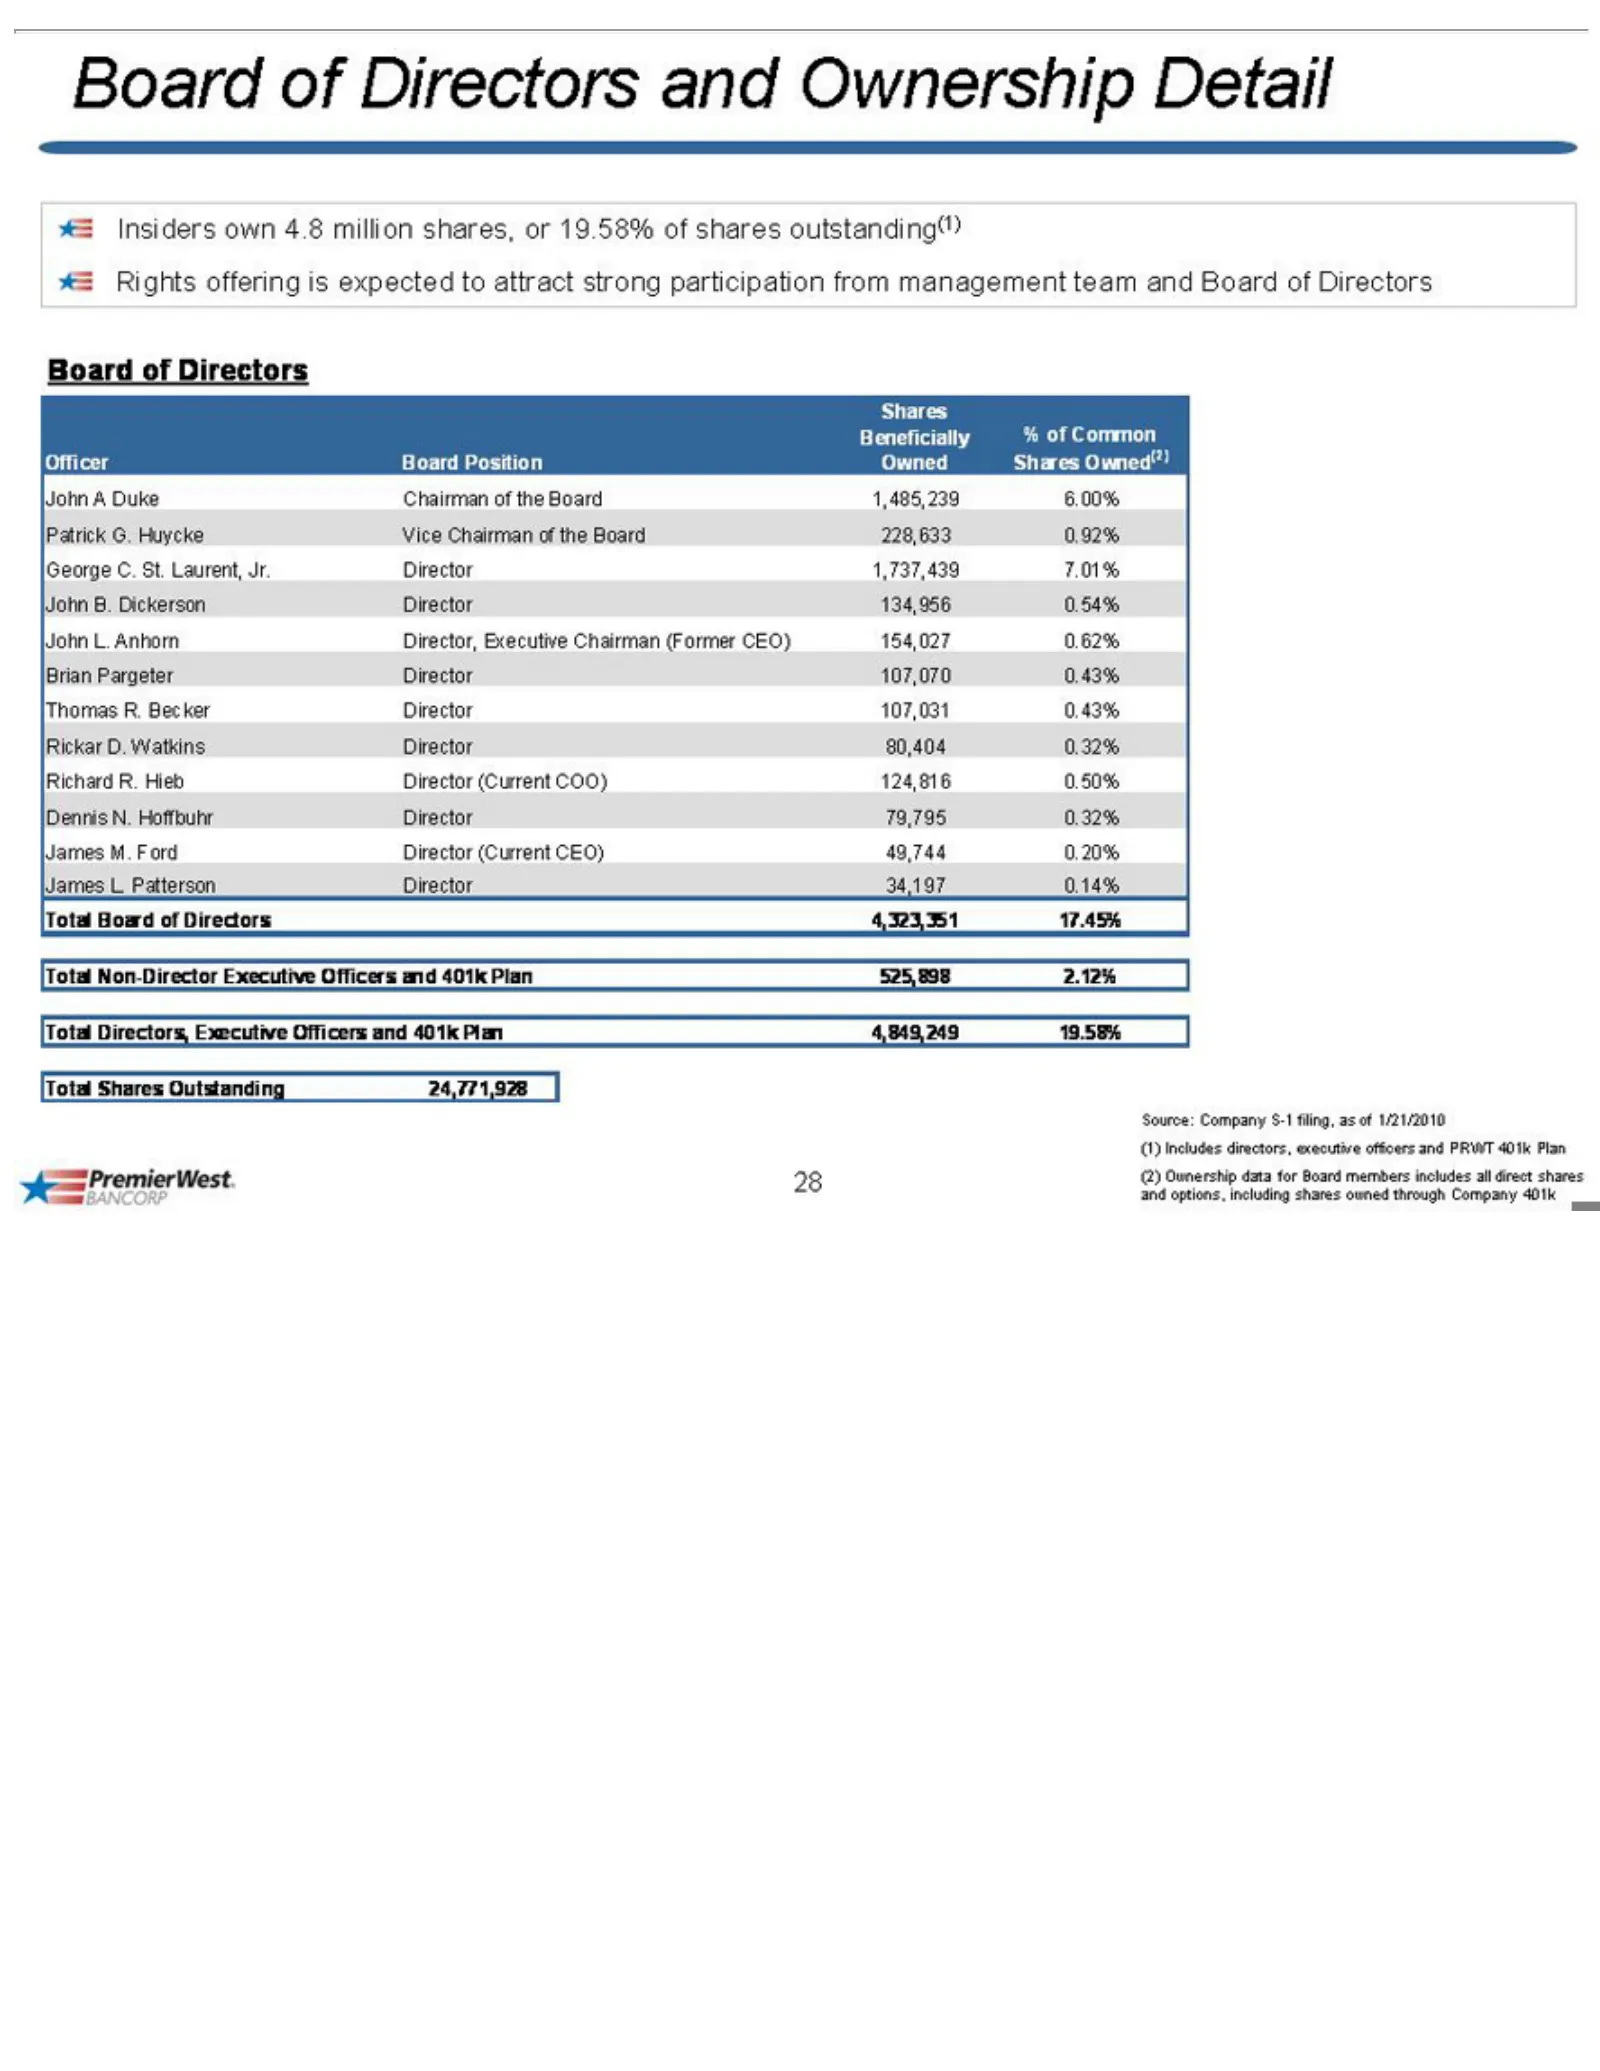
Insiders Rights Board Shares Owned Officer Patrick George John Brian Thomas Rickar Richard Dennis James Total Source: (1) 28 Includes A B. L. Board Non-Director Directors, Shares Pargeter of M. L. offering D. Beneficially Duke G. N. Board % C. Anhorn Company Dickerson R. own Directors Patterson Ford
Source: SEC EDGAR · FWP filed Feb 18, 2010
More decks from PremierWest Bancorp
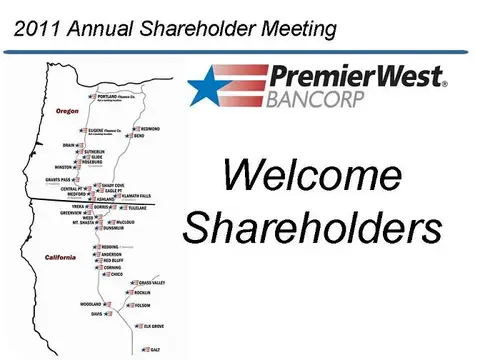 Shareholder Meeting (May 2011)27 slides · May 26, 2011
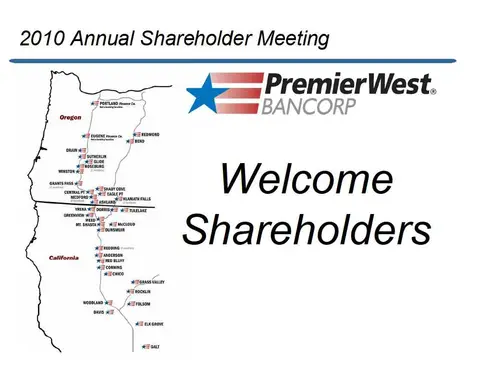 Shareholder Meeting (May 2010)29 slides · May 28, 2010
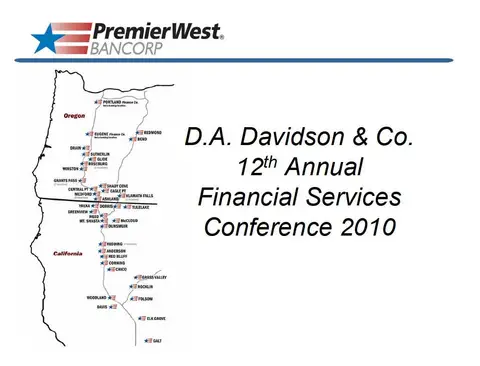 D.A. Davidson & Co. Annual Financial Services Conference 201027 slides · May 12, 2010
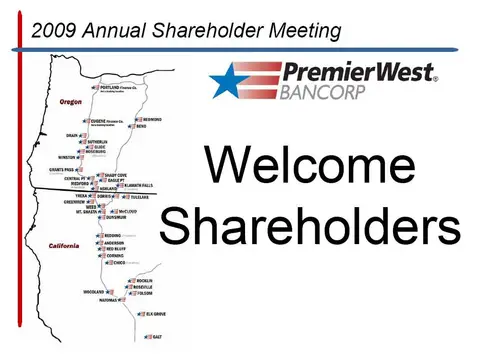 Shareholder Meeting (June 2009)27 slides · Jun 24, 2009
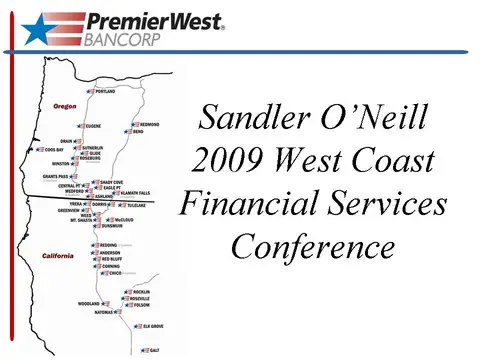 Sandler O'Neill 2009 West Coast Financial Services Conference16 slides · Feb 26, 2009
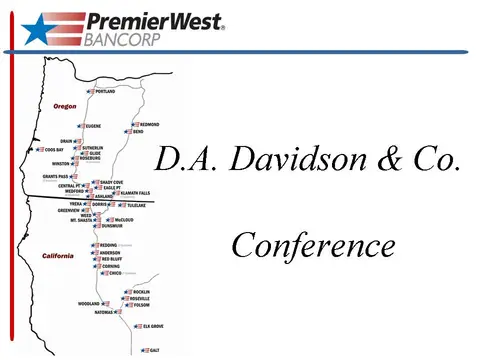 D.A. Davidson & Co. Conference (February 2009)13 slides · Feb 19, 2009