PremierWest Bancorp — Shareholder Meeting (June 2009)
27 slides from PremierWest Bancorp's shareholder meeting presentation, Jun 24, 2009
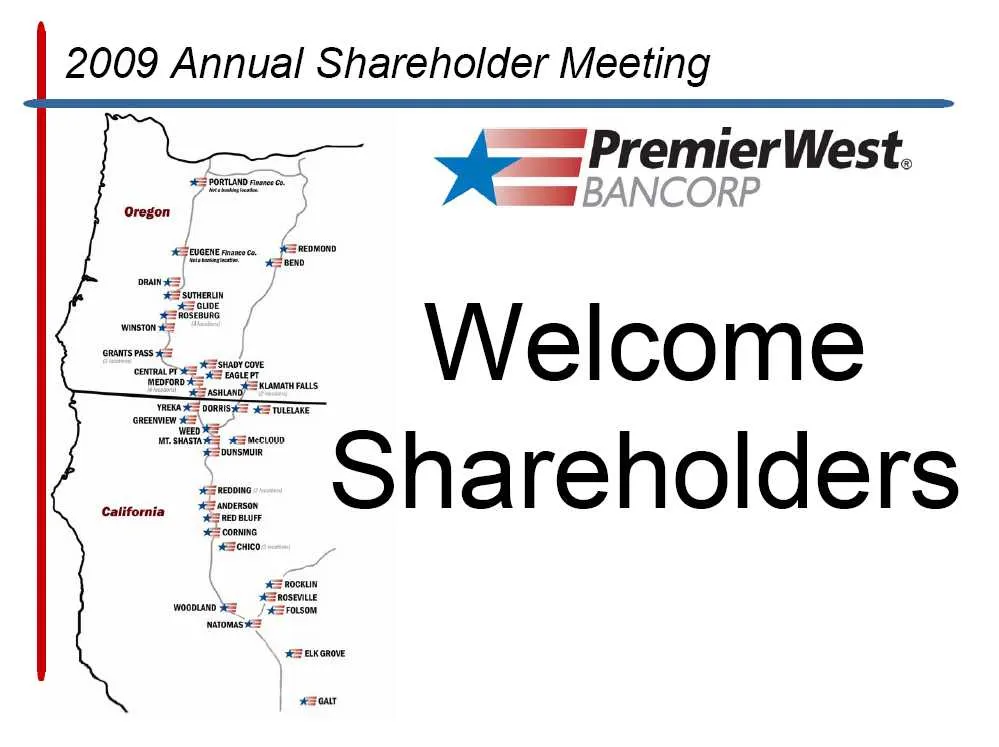
Slide 1: 2009 Annual Shareholder Meeting
2009 Annual Shareholder Meeting <= PremierWest. fc wae BANCORP . Welcome Shareholders
Slide 2: Introductions
Introductions
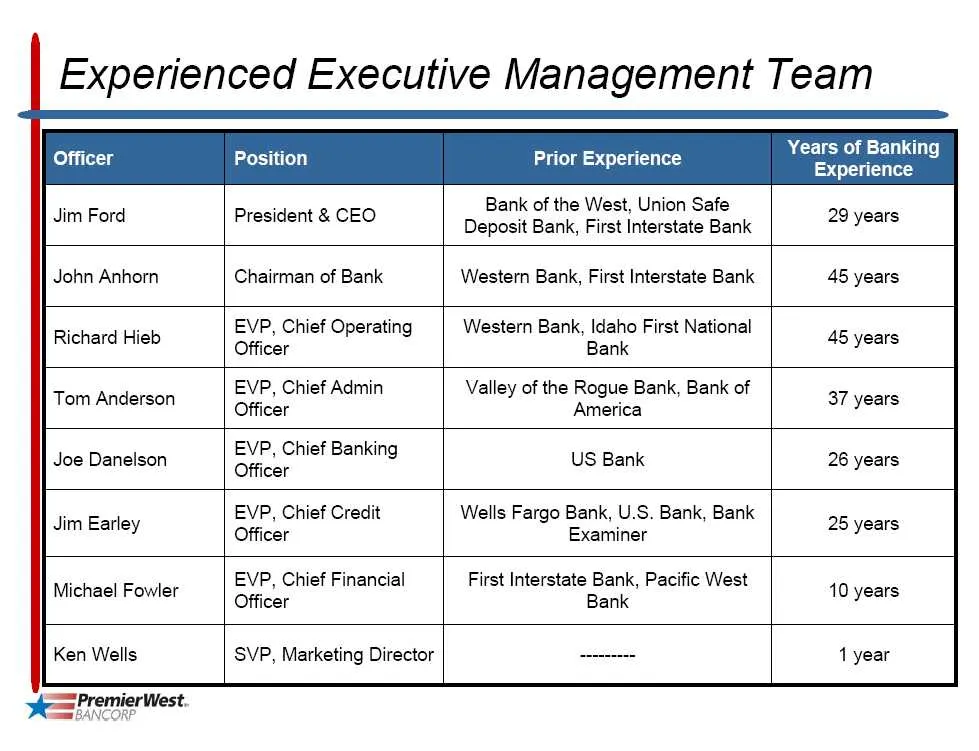
Slide 3: Experienced Executive Management Team
Experienced Executive Management Team Jim Ford Position President & CEO Prior Experience Bank of the West, Union Safe Deposit Bank, First Interstate Bank Years of Banking Experience 29 years John Anhorn Chairman of Bank Western Bank, First Interstate Bank 45 years Richard Hieb EVP, Chief Operating O
Slide 4: Management's Report
Management's Report
Slide 5: Forward Looking Statement Disclosure
Forward Looking Statement Disclosure This presentation may include “forward-looking statements” about PremierWest. Forward-looking statements generally include financial projections; descriptions of plans or objectives of management for future operations, products or services; forecasts of future ec
Slide 6: Net Income / Loan Loss Provision
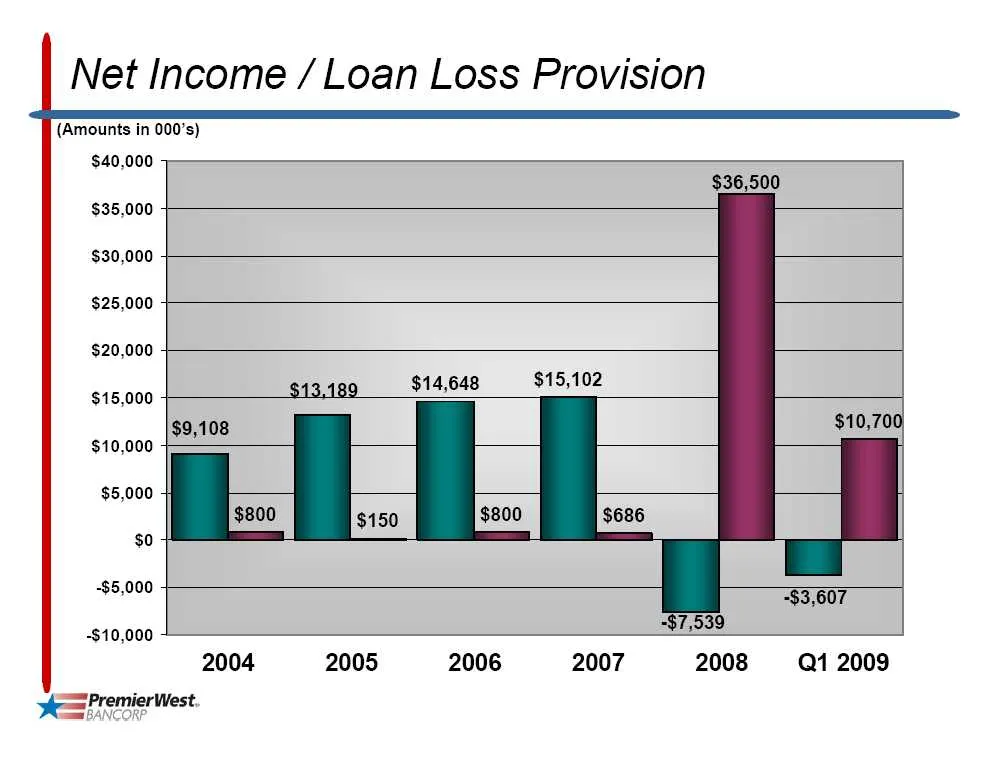
$40,000 $35,000 $30,000 $25,000 $20,000 $15,000 $10,000 $5,000 $0 -$5,000 -$10,000 Net Income / Loan Loss Provision (Amounts in 000’s) $36,500 $13,189 $14,648 $15,102 $10,700, ~$7,539 -$3,607 2004 yes PremierWest, 2005 2006 2007 2008 Q1 2009
Slide 7: Core Deposit Franchise
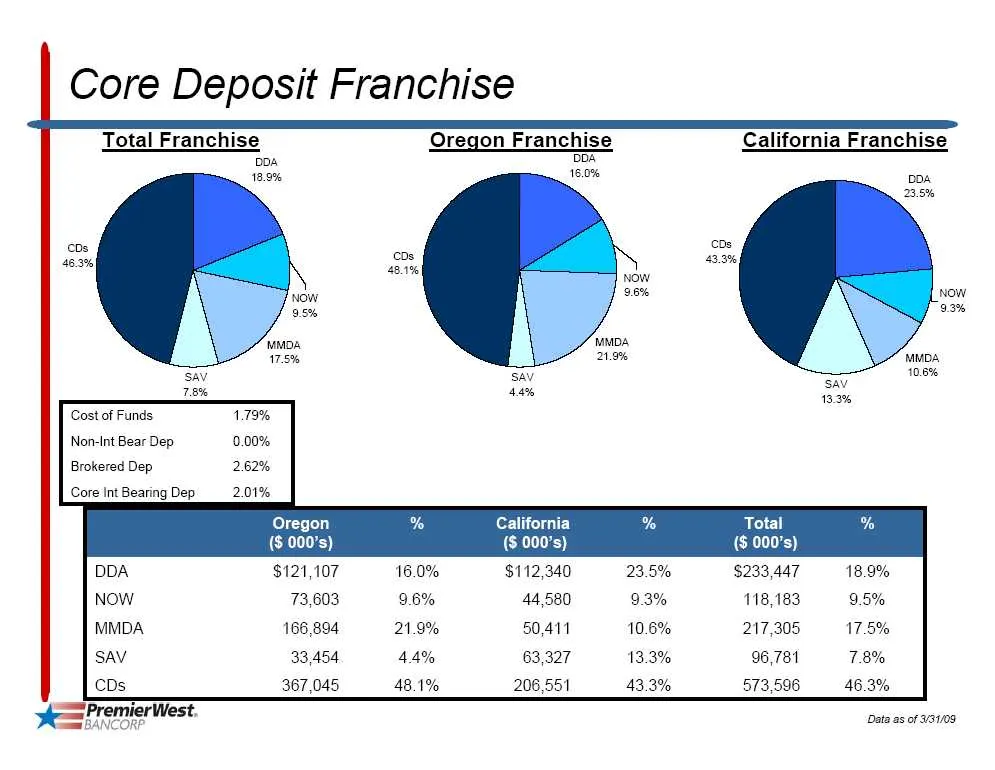
Core Deposit Franchise Total Franchise Oregon Franchise Ban DOA 18.9% Lead Cost of Funds Non-Int Bear Dep Brokered Dep Core int Bearing Dep Oregon California Total ($ 000’s) (S 000’s) ($ 000’s) $121,107 $112,340 $233,447 73,603 44,580 118,183 166,894 50,411 217,305 33,454 63,327 96,784 367,045 206,5
Slide 8: PremierWest and Peer Margins
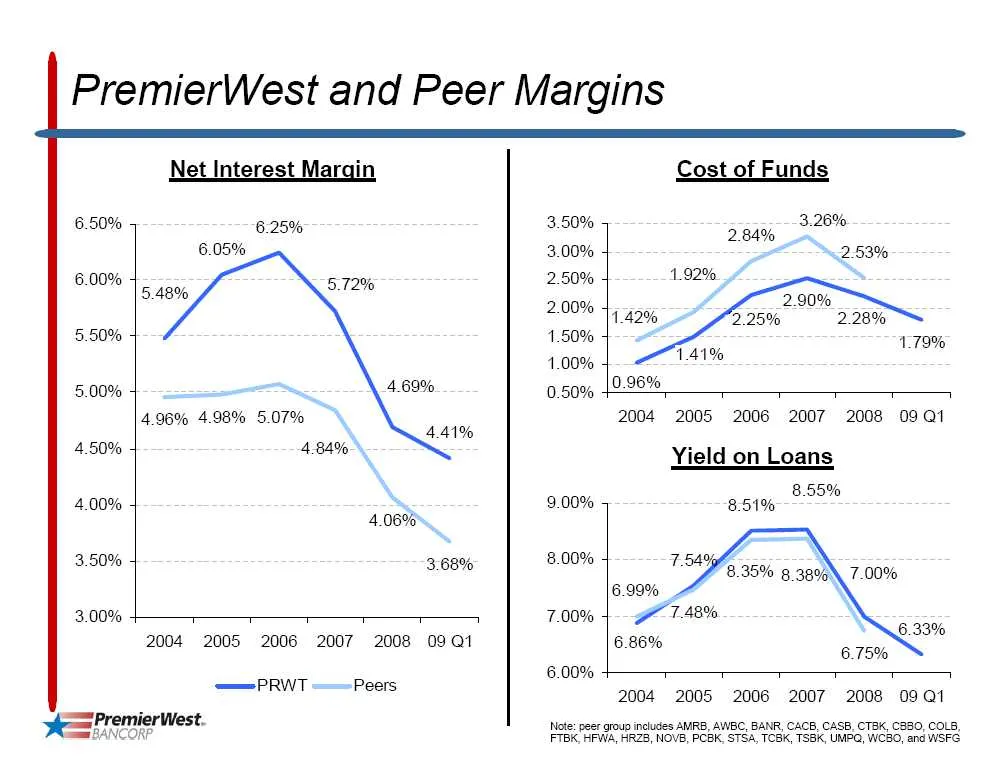
PremierWest and Peer Margins 6.50% 6.00% 5.50% 5.00% 4.50% 4.00% 3.50% 3.00% aS! Net Interest Margin 6.25% 6.05% 5.48% 4.69% 4.96% 4.98% 5.07% 4.84% 4.41% 4.06% 3.68% 2004 2005 2006 2007 2008 09Q1 ——PRWT Peers PremierWest. Cost of Funds 3.50% 3.26% 2.84% 3.00% “253% 2.50% 1.92% 94 2.90% 2.00% 74 42%
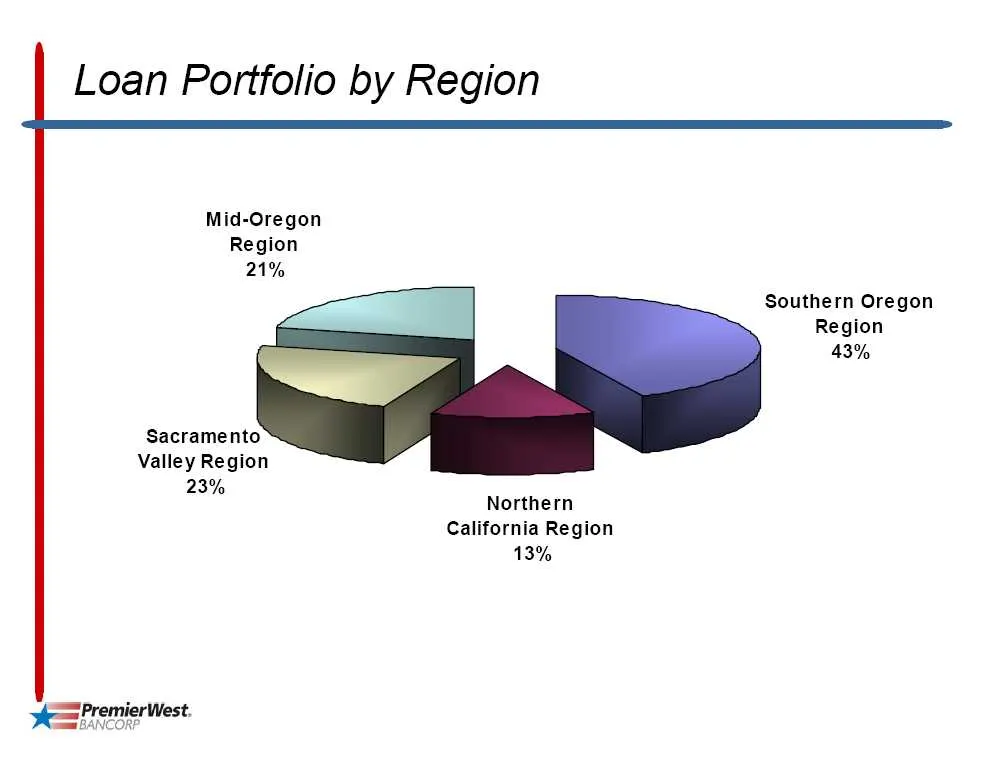
Slide 9: Loan Portfolio by Region
Loan Portfolio by Region Mid-Oregon Region 21% Southern Oregon Region 43% Sacramento Valley Region 23% Northern California Region 13% y= PremierWest.
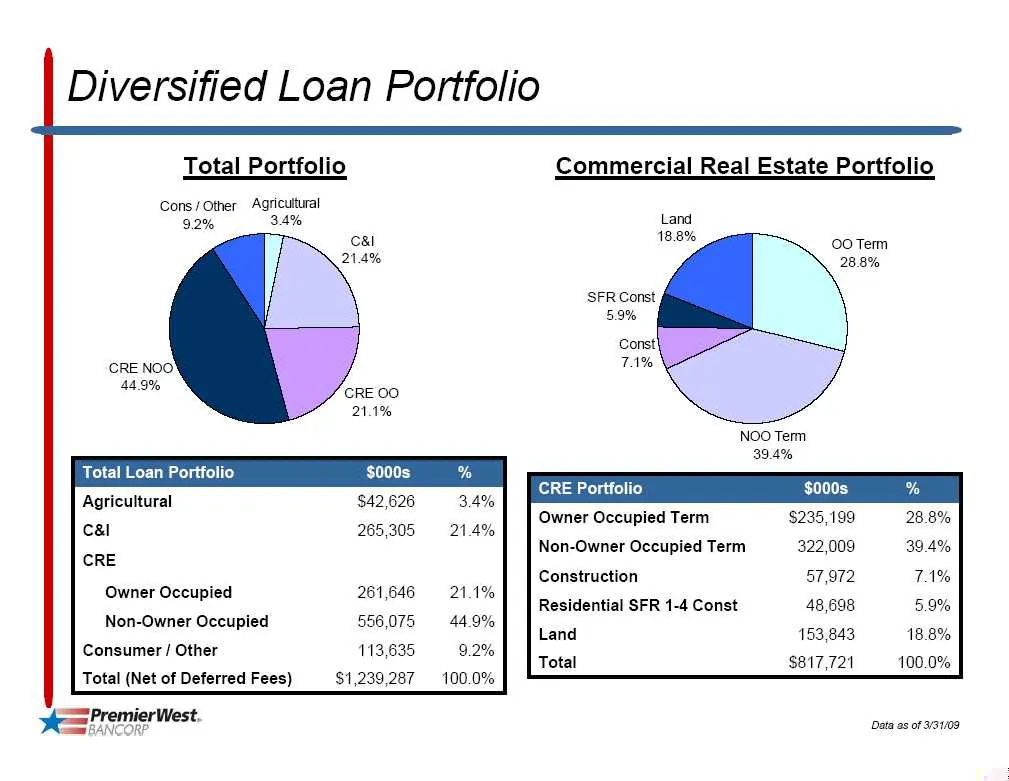
Slide 10: Diversified Loan Portfolio
Diversified Loan Portfolio Total Portfolio Commercial Real Estate Portfolio Cons / Other Agricultural 9.2% 3.4% Land 18.8% 00 Term 28.8% SFR Const 59% Const! TA% Total Loan Portfolio CRE Portfolio Owner Occupied Term $235,199 Non-Owner Occupied Term 322,009 Construction 57,972 Residential SFR 1-4 Co
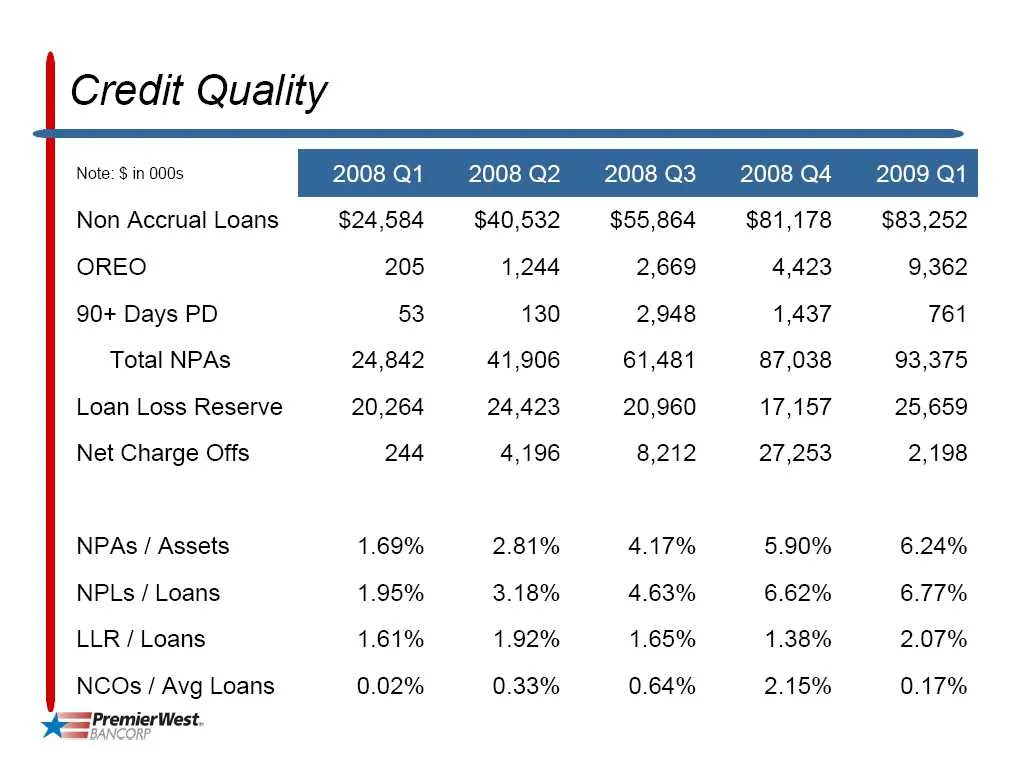
Slide 11: Credit Quality
Credit Quality Note: $ in 000s 2008 Q1 2008Q2 2008Q3 2008Q4 2009Q1 Non AccrualLoans $24,584 $40,532 © $55,864. $81,178 $83,252 OREO 205 1,244 2,669 4,423 9,362 90+ Days PD 53 130 2,948 1,437 761 Total NPAs 24,842 41,906 61,481 87,038 93,375 Loan Loss Reserve 20,264 24,423 20,960 17,157 25,659 Net Ch
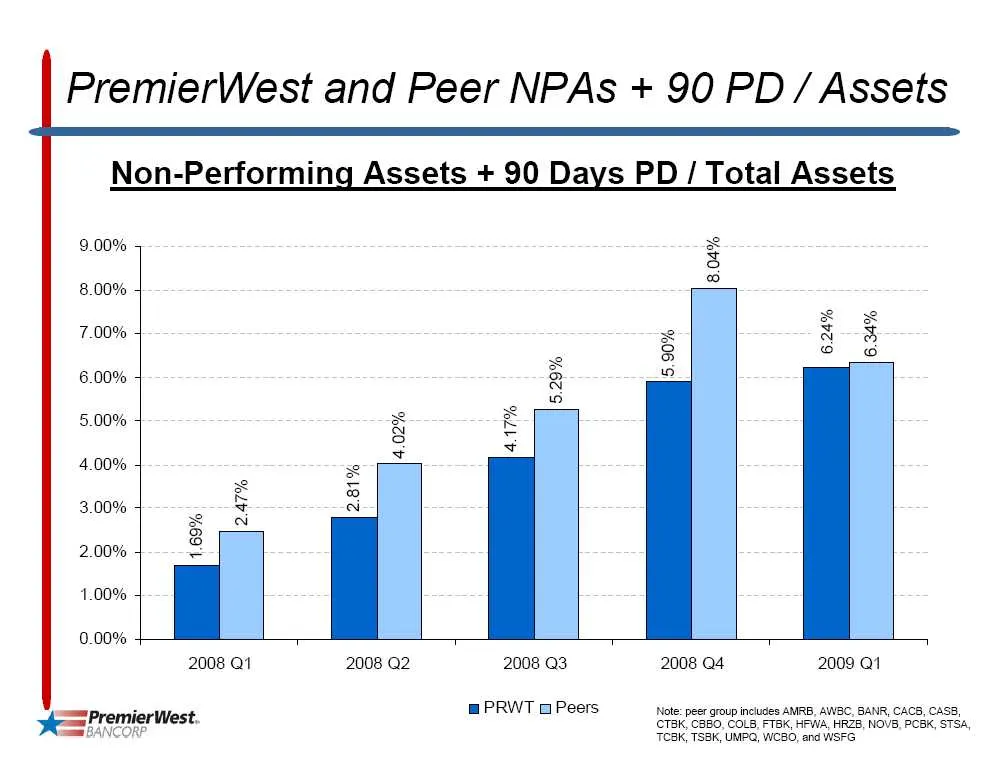
Slide 12: PremierWest and Peer NPAs + PD / Assets
PremierWest and Peer NPAs + 90 PD / Assets Non-Performing Assets + 90 Days PD / Total Assets 9.00% x & 8.00% © x x 7.00% x2 as #2 3 a 6.00% g © . 8 5.00% x z N S d = + 4.00% e £ 5 3.00% = ai x a 8 2.00% 1.00% 0.00% 2008 Q1 2008 Q2 2008 Q3 2008 Q4 2009 Q1 aries m PRWT a Peers Note: per group incudes
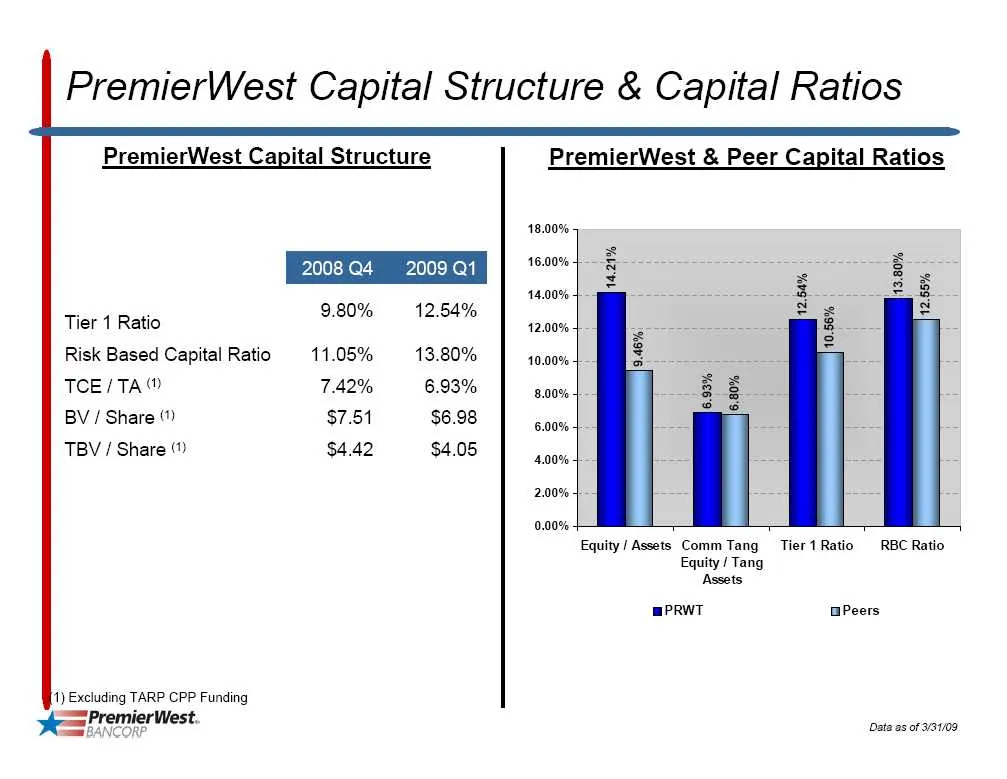
Slide 13: PremierWest Capital Structure & Capital Ratios
PremierWest Capital Structure & Capital Ratios PremierWest Capital Structure Tier 1 Ratio Risk Based Capital Ratio TCE/TA‘ BV / Share ‘) TBV / Share (*) 1) Excluding TARP CPP Funding ee PremierWest. NCORP 9.80% 11.05% 7.42% $7.51 $4.42 2008 Q4 2009 Q1 12.54% 13.80% 6.93% $6.98 $4.05 PremierWest & Pe
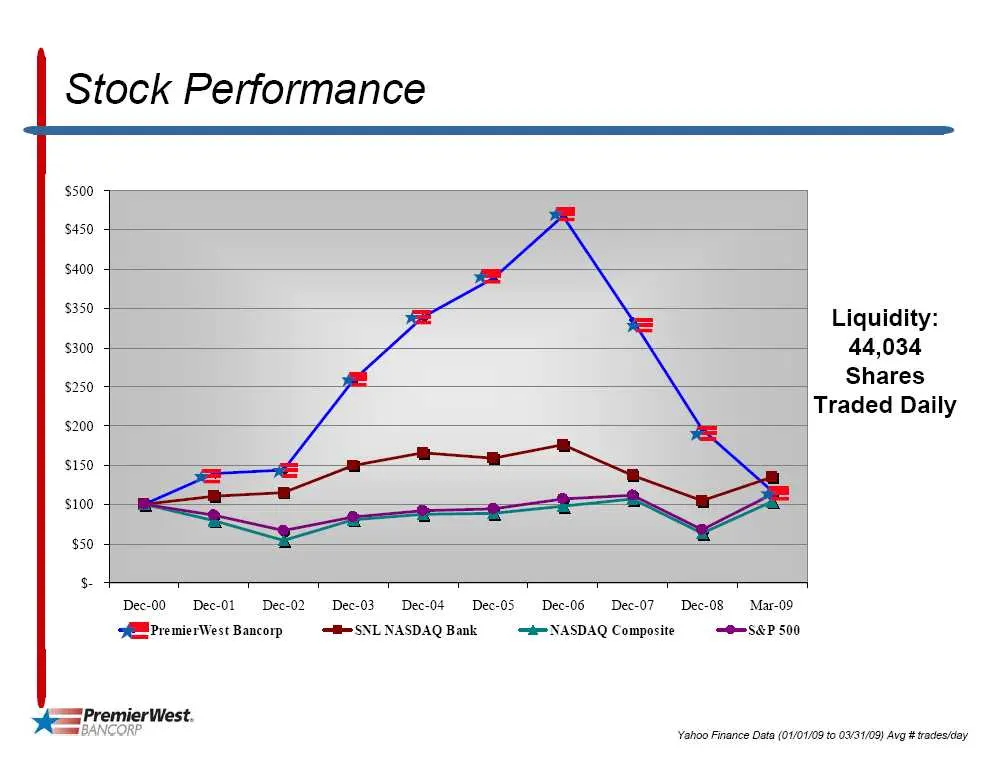
Slide 14: Stock Performance
Stock Performance Liquidity: 44,034 Shares Traded Daily Dec-00 Dec-01 Dec-02 Dec-03 Dec-04 Dec-05 Dec-06 Dec-07 Dec-08 Mar-09° AMPremies West Bancorp HSSNLNASDAQ Bank = NASDAQ Composite. <®=S&P 500 mam Premier West. P Yahoo Finance Data (01/0109 to 091/09) Avg # trades/eay
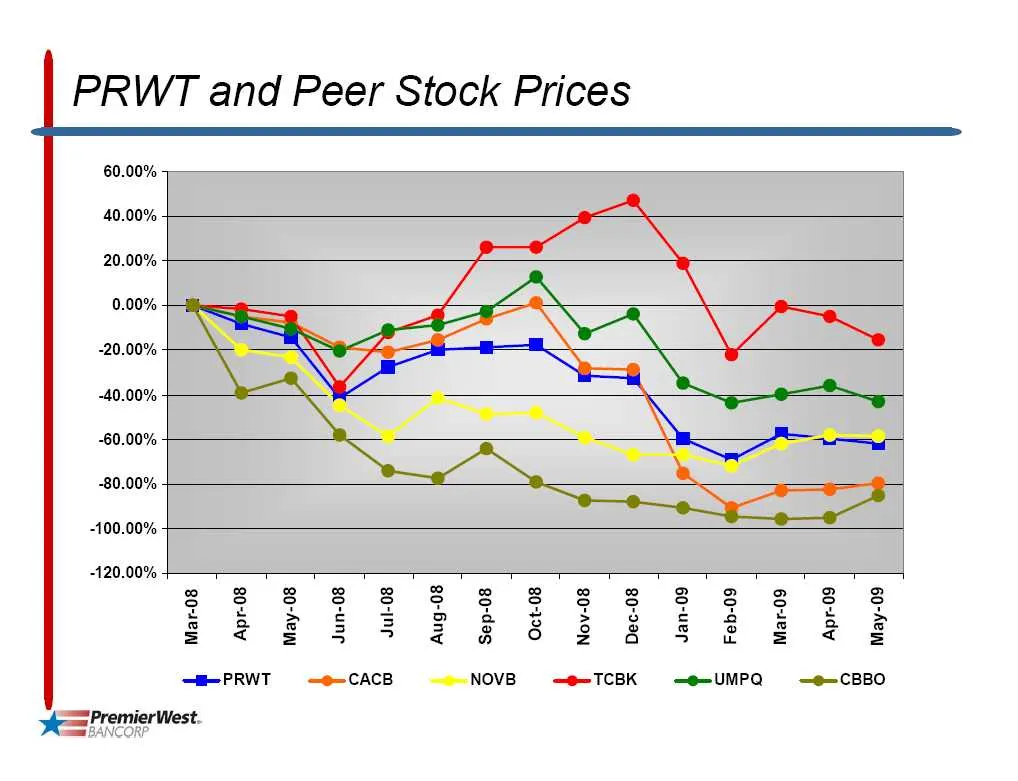
Slide 15: PRWT and Peer Stock Prices
PRWT and Peer Stock Prices 60.00% 40.00% 20.00% 0.00% -20.00% -40.00% -60.00% -80.00% -100.00% -120.00% Mar-08 Apr-08 May-08 Jun-08 Jul-08 Aug-08 Sep-08 Oct-08 Nov-08 Dec-08 Jan-09 Feb-09 Mar-09 Apr-09 May-09 —mPRWT —®-CACB ~~ NOVB —eTCBK —eUMPQ —®—CBBO eS PremierWest.
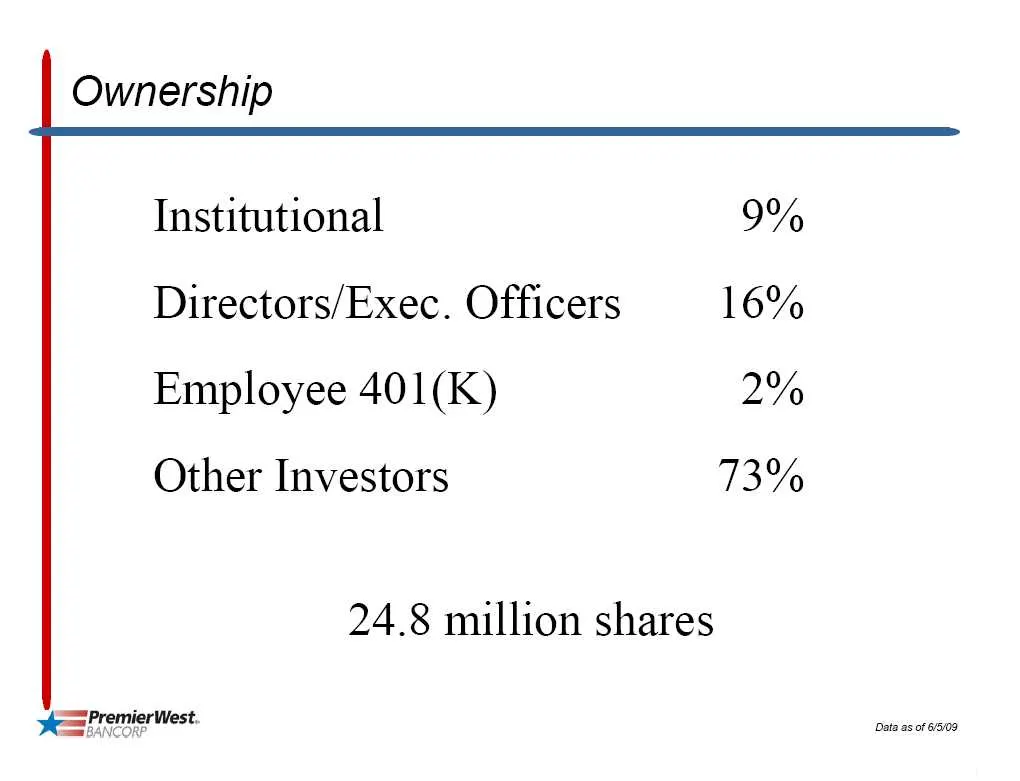
Slide 16: Ownership
Ownership Institutional 9% Directors/Exec. Officers 16% Employee 401(K) 2% Other Investors 73% 24.8 million shares ee PremierWest. Data as of 65/09
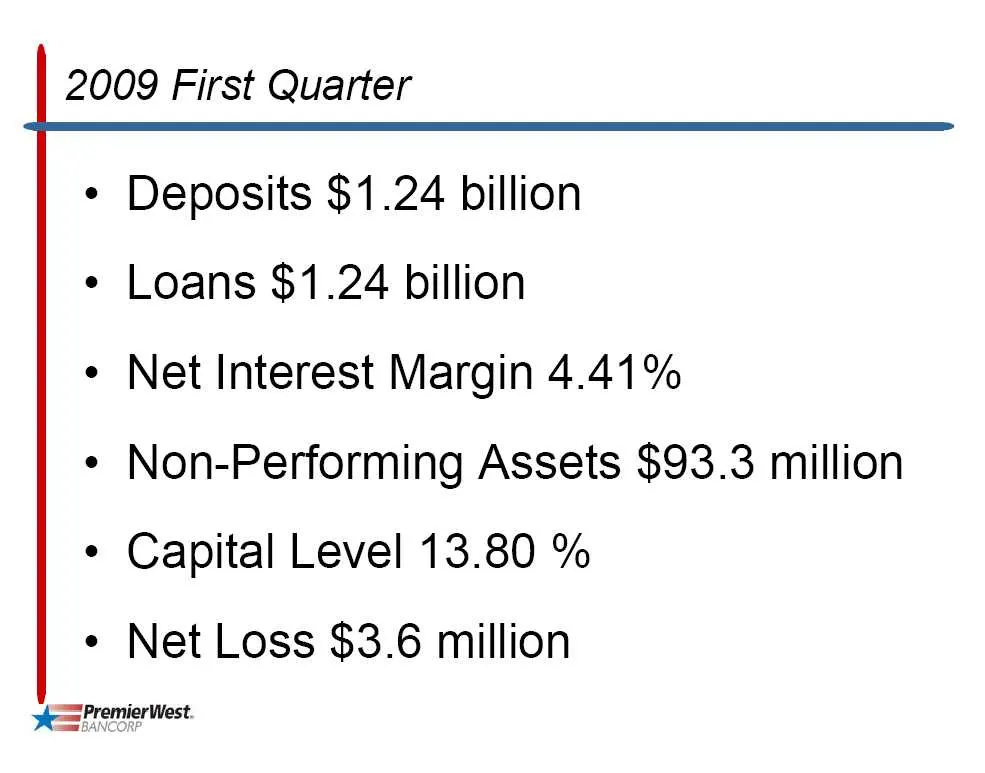
Slide 17: 2009 First Quarter
2009 First Quarter * Deposits $1.24 billion * Loans $1.24 billion ¢ Net Interest Margin 4.41% ¢ Non-Performing Assets $93.3 million * Capital Level 13.80 % ¢ Net Loss $3.6 million eS PremierWest
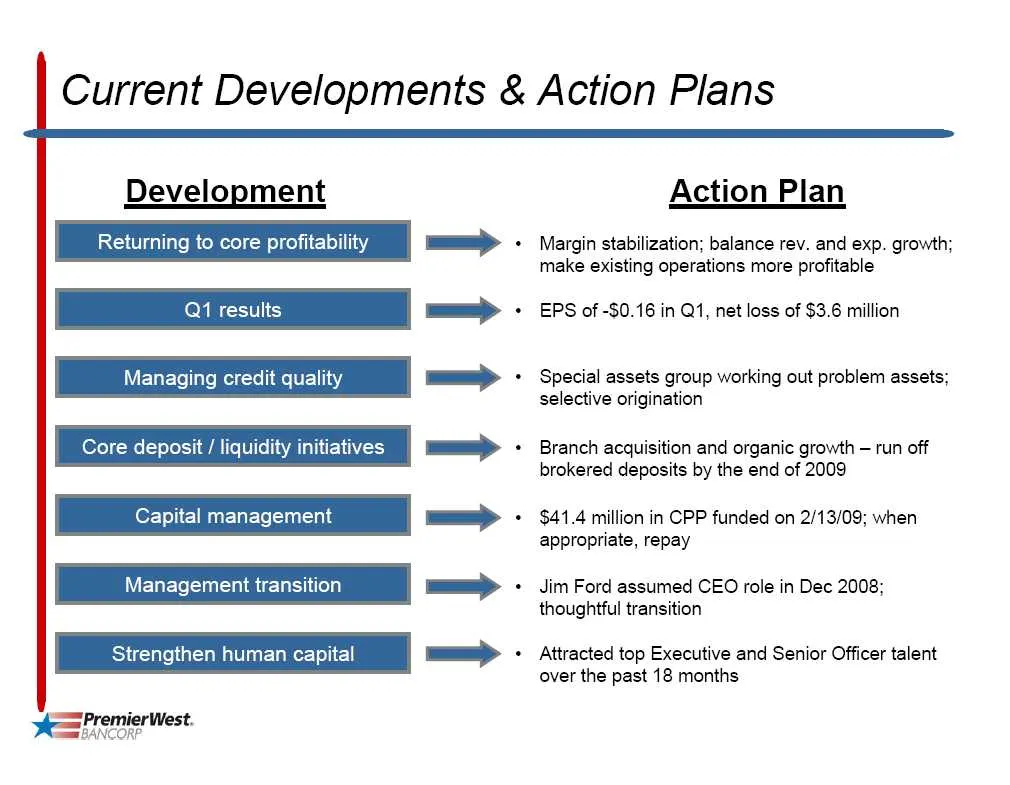
Slide 18: Current Developments & Action Plans
Current Developments & Action Plans Development <i — a — <<< — = — <= — << — <= — yes PremierWest. fs BANCORP Action Plan Margin stabilization; balance rev. and exp. growth; make existing operations more profitable EPS of -$0.16 in Q1, net loss of $3.6 million Special assets group working out proble
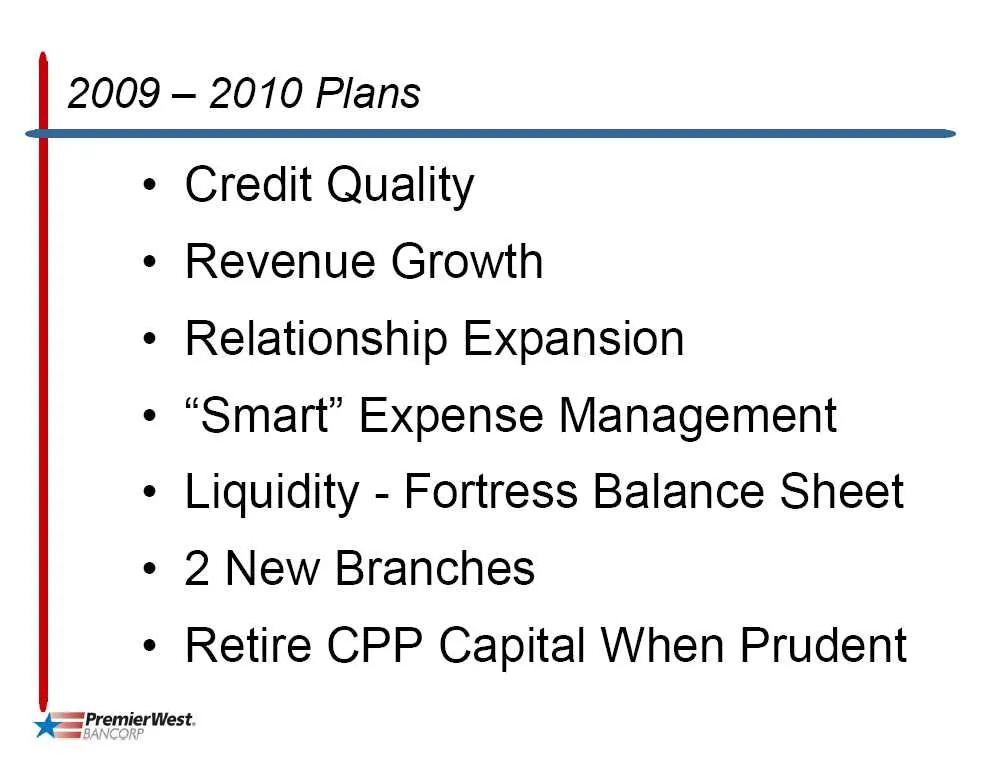
Slide 19: 2009 - 2010 Plans
2009 — 2010 Plans ¢ Credit Quality « Revenue Growth * Relationship Expansion * “Smart” Expense Management * Liquidity - Fortress Balance Sheet ¢ 2 New Branches * Retire CPP Capital When Prudent eS PremierWest
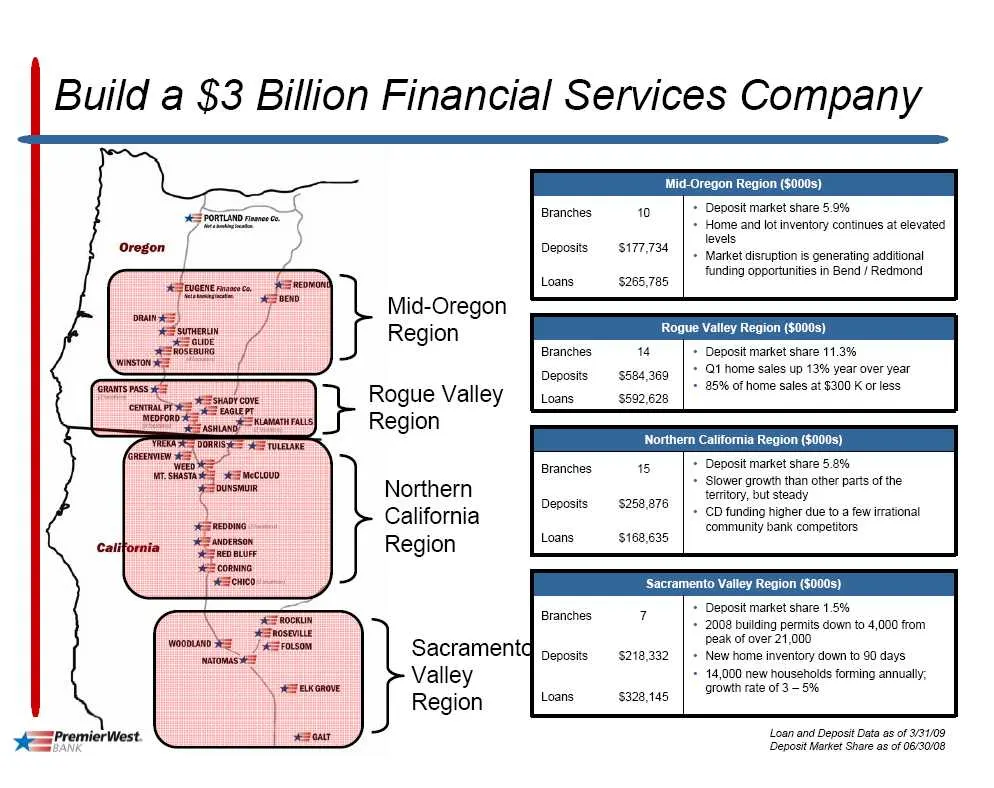
Slide 20: Build a $3 Billion Financial Services Company
Build a $3 Billion Financial Services Company Mid-Oregon Region ($000s) mee 7 * Deposit market share 5.9% + Home and lot inventory continues at elevated levels * Market disruption is generating additional funding opportunities in Bend / Redmond Deposits $177,734 Loans $265,785 Mid-Oregon Region Rogu
Slide 21: Expanding Funding: Pending Branch Acquisition
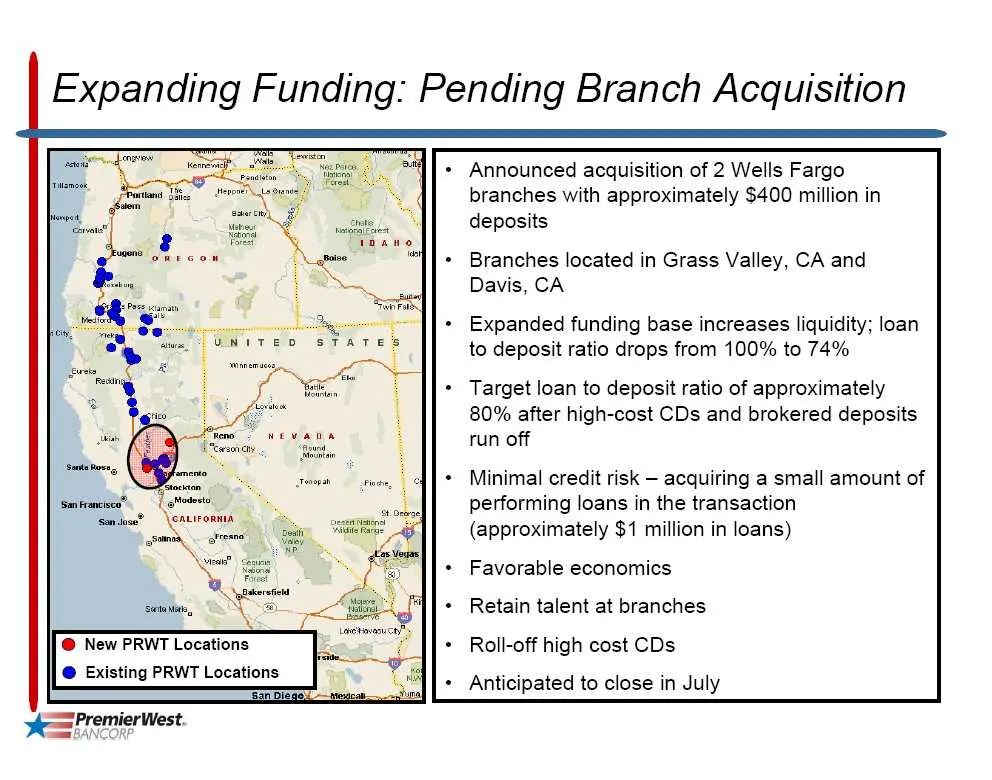
Expanding Funding: Pending Branch Acquisition Announced acquisition of 2 Wells Fargo branches with approximately $400 million in deposits Branches located in Grass Valley, CA and Davis, CA Expanded funding base increases liquidity; loan to deposit ratio drops from 100% to 74% Target loan to deposit
Slide 22: Proposals for Action by Shareholders
Proposals for Action by Shareholders
Slide 23: Election of Board Members
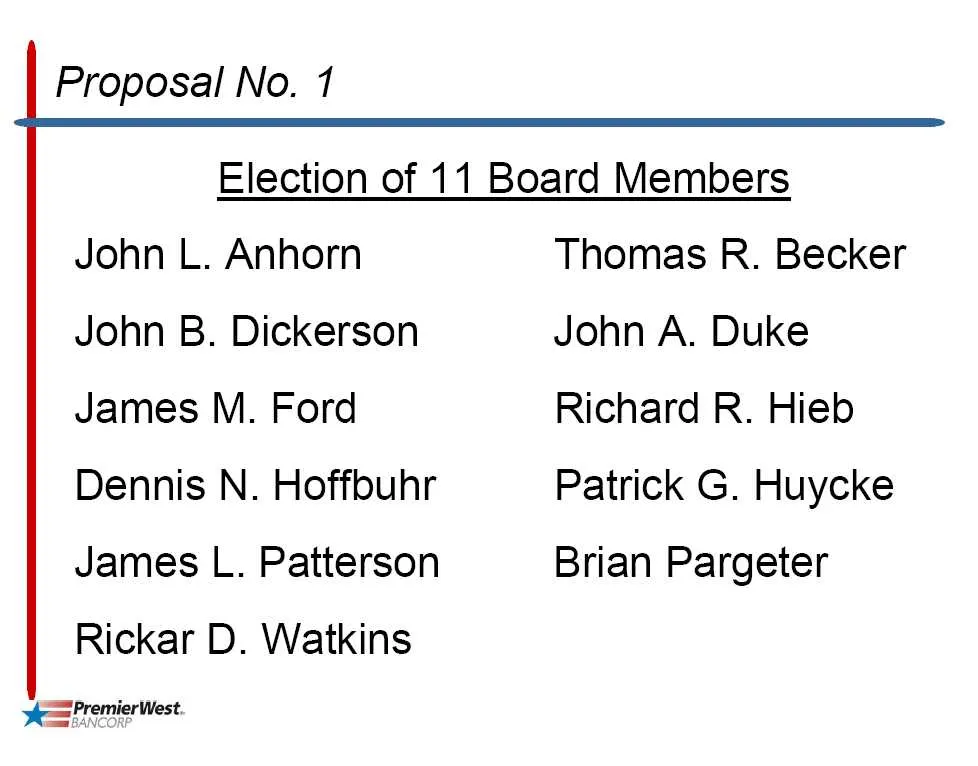
Proposal No. 1 Election of 11 Board Members John L. Anhorn John B. Dickerson James M. Ford Dennis N. Hoffouhr James L. Patterson Rickar D. Watkins y= PremierWest Thomas R. Becker John A. Duke Richard R. Hieb Patrick G. Huycke Brian Pargeter
Slide 24: Ratify Appointment of Moss Adams, LLP
Proposal No. 2 Ratify Appointment of Moss Adams, LLP as Independent Public Accountants eS PremierWest
Slide 25: Advisory Vote on Executive Compensation
Proposal No. 3 Advisory Vote on Executive Compensation Arrangements and Policies ee PremierWest.

Slide 26: VOTE
VOTE
Slide 27: PremierWest Bancorp
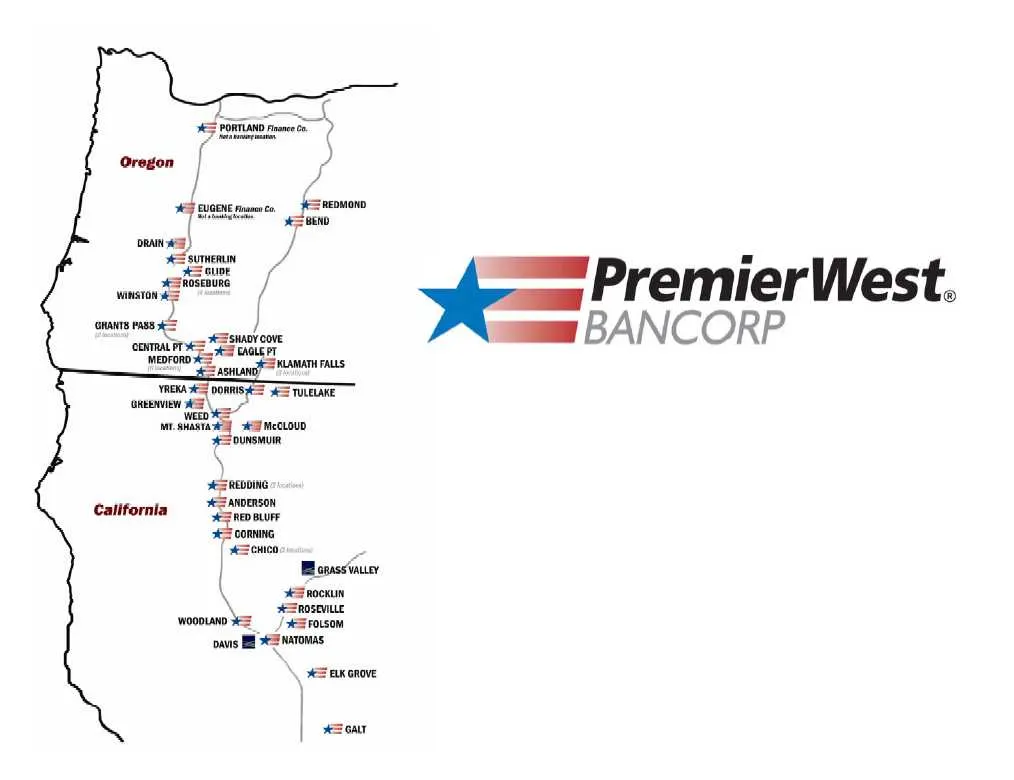
ye PremierWest. sams BANCORP YREKAFES DORNISAS = TOLELANE omesiew eS \ wee’ ar shasta A MecLOUD = DUNSMUIR ) eS REDDING Catttonin nam == CORNING | eS cmico. Blomssiaucy ES ROCKIN SRoseve ‘woooLaND _/ se rosom oan BE Sas SK GROVE | 2S 0ur
Source: SEC EDGAR · 8-K filed Jun 24, 2009
More decks from PremierWest Bancorp
 Shareholder Meeting (May 2011)27 slides · May 26, 2011
 Shareholder Meeting (May 2010)29 slides · May 28, 2010
 D.A. Davidson & Co. Annual Financial Services Conference 201027 slides · May 12, 2010
 IPO Roadshow (February 2010)28 slides · Feb 18, 2010
 Sandler O'Neill 2009 West Coast Financial Services Conference16 slides · Feb 26, 2009
 D.A. Davidson & Co. Conference (February 2009)13 slides · Feb 19, 2009