PremierWest Bancorp — D.A. Davidson & Co. Annual Financial Services Conference 2010
27 slides from PremierWest Bancorp's conference presentation, May 12, 2010
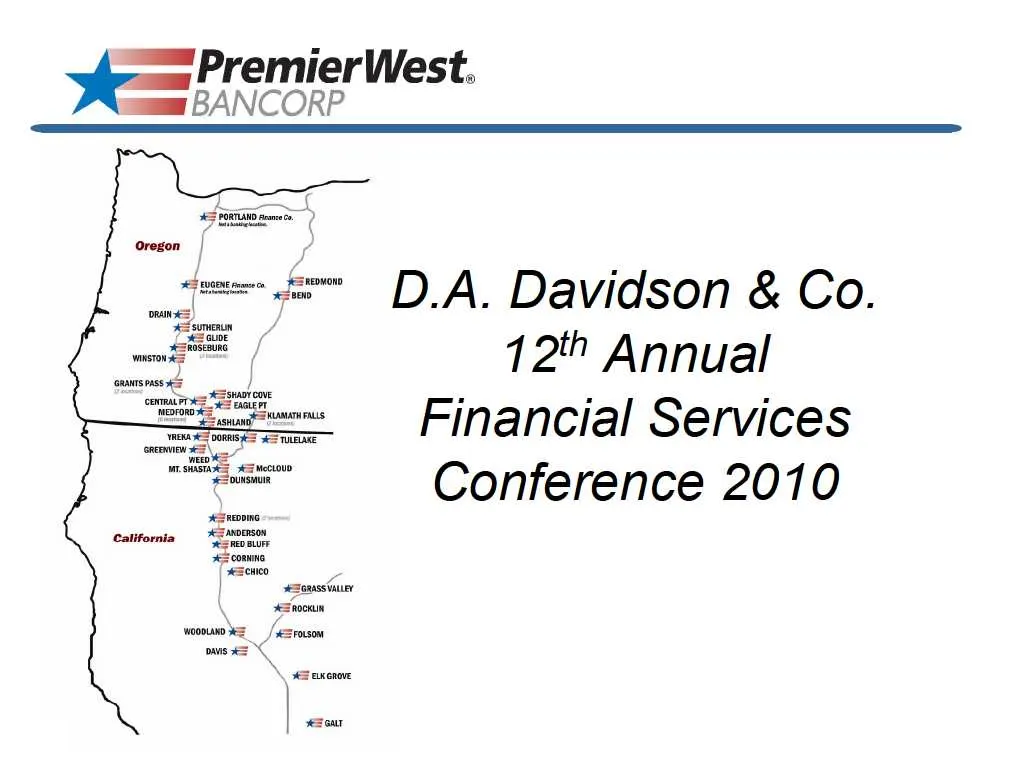
Slide 1: PremierWest Bancorp - D.A. Davidson Annual Financial Services Conference 2010
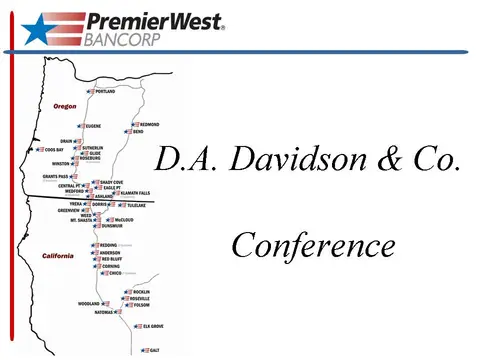
===" PremierWest. mmm BANCORP D.A. Davidson & Co. 72! Annual Financial Services Conference 2010
Slide 2: Forward Looking Statement Disclosure
Forward Looking Statement Disclosure This presentation may include “forward-looking statements” about PremierWest. Forward-looking statements generally include financial projections; descriptions of plans or objectives of management for future operations, products or services; forecasts of future ec
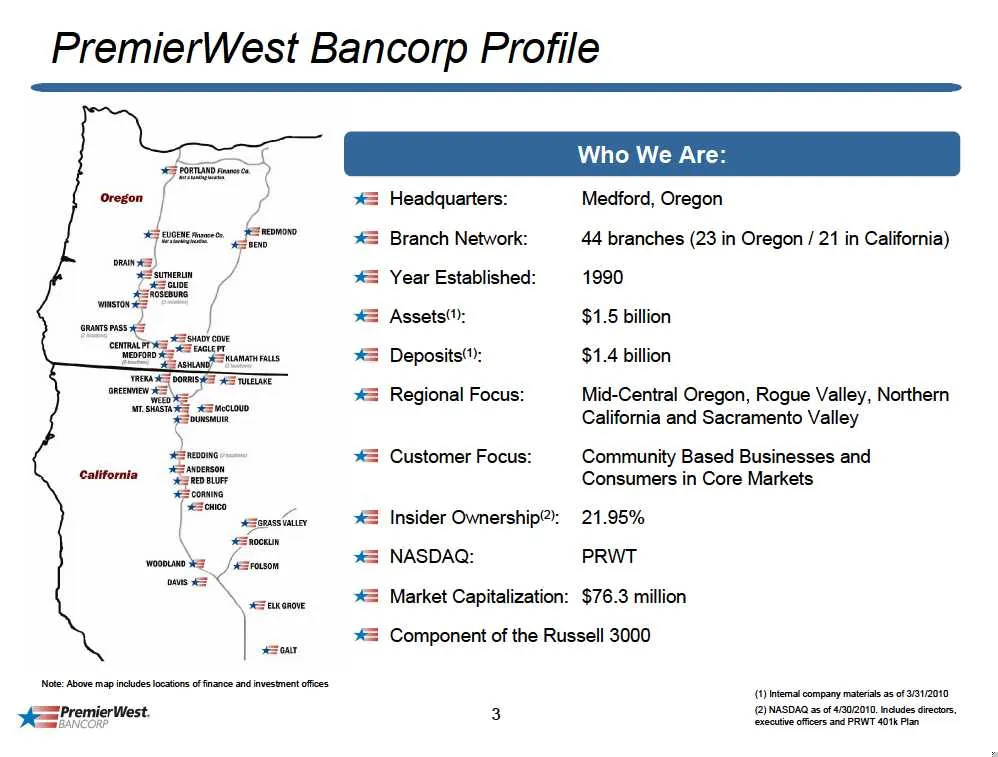
Slide 3: PremierWest Bancorp Profile
PremierWest Bancorp Profile Who We Are = Headquarters: Medford, Oregon *S Branch Network: 44 branches (23 in Oregon / 21 in California) *S Year Established: 1990 S Assets!): $1.5 billion *= Deposits ): $1.4 billion %*= Regional Focus: Mid-Central Oregon, Rogue Valley, Northern California and Sacrame
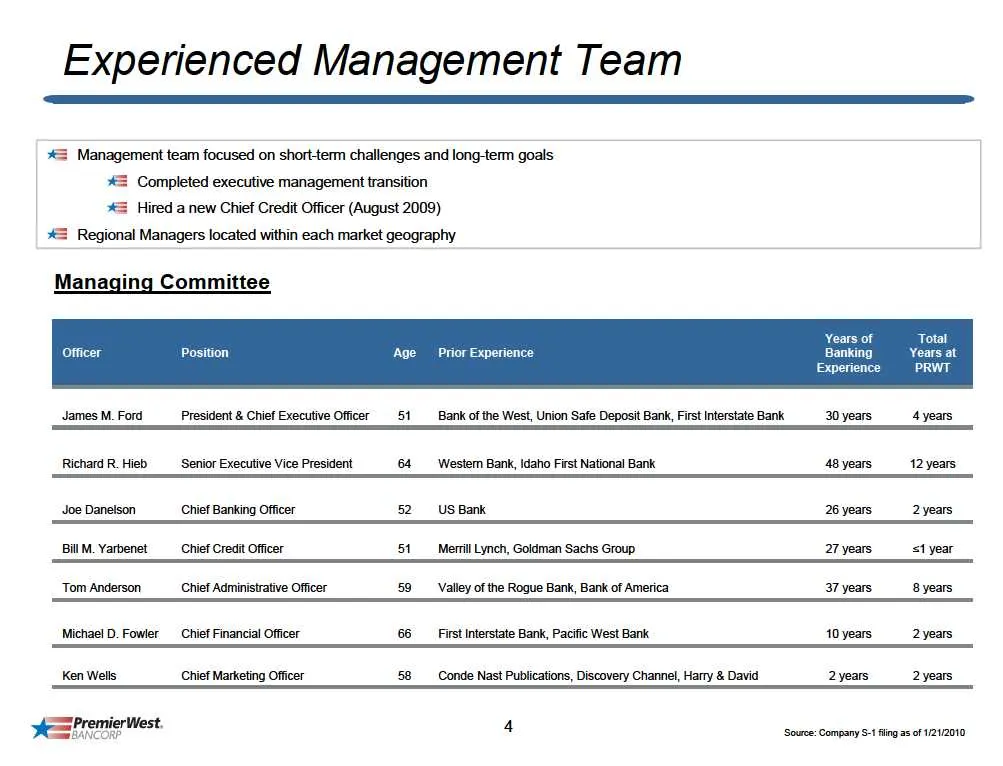
Slide 4: Experienced Management Team
Experienced Management Team 4 Management team focused on short-term challenges and long-term goals #2 Completed executive management transition 4 Hired a new Chief Credit Officer (August 2009) 42 Regional Managers located within each market geography Managing Committee Years of Total Officer Positio
Slide 5: Franchise Overview
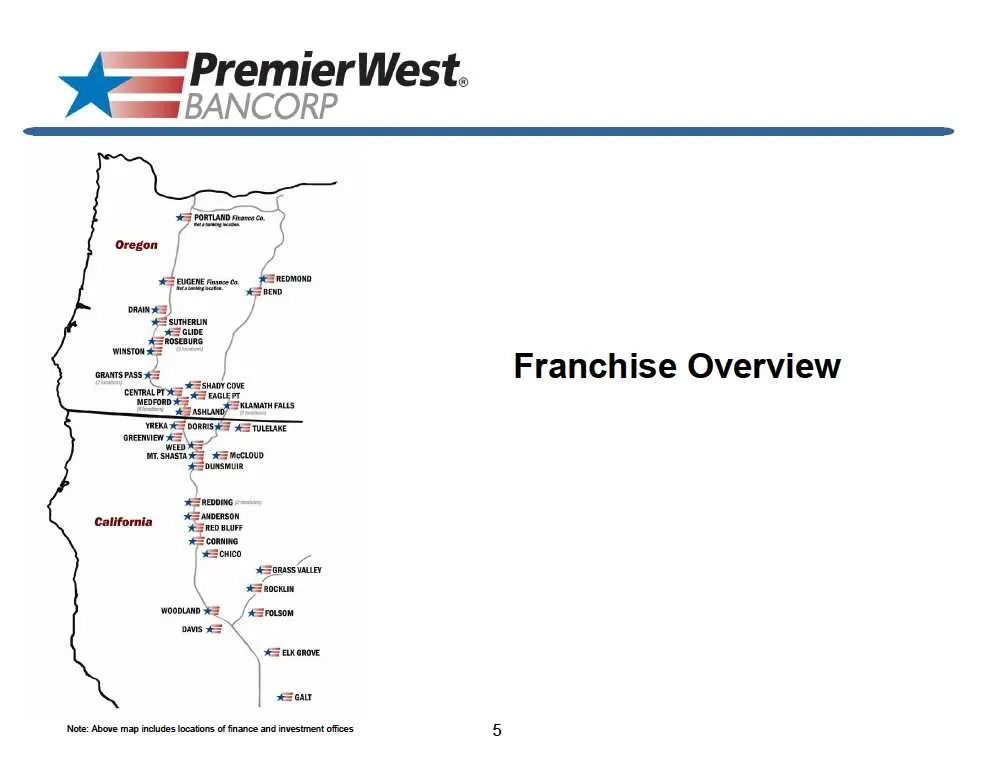
—== PremierWest. mmm BANCORP Franchise Overview
Slide 6: Attractive Geographic Footprint
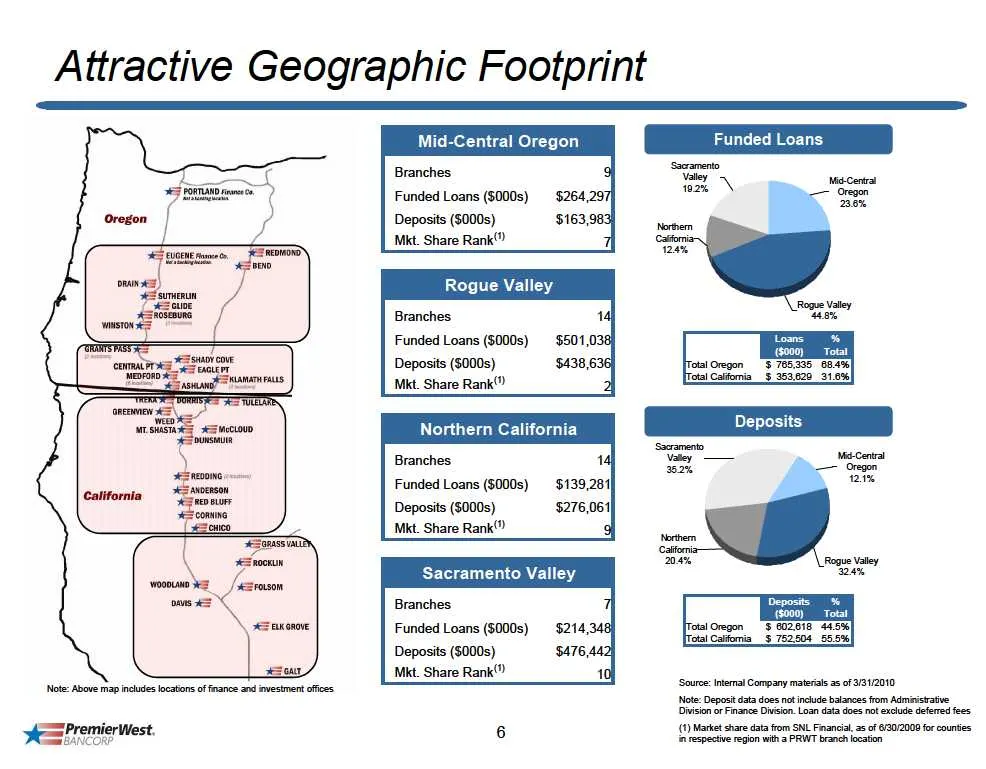
Attractive Geographic Footprint "Note: Above map incues locations of fnance ad investment offices veering west Mid-Central Oregon Branches Funded Loans ($000s) $264.29; Deposits ($000s) $163,98 Mkt. Share Rank? Rogue Valley Branches Funded Loans (000s) ($000) Total Deposss (eons) tal Oregon $7055.08
Slide 7: Core Deposit Franchise
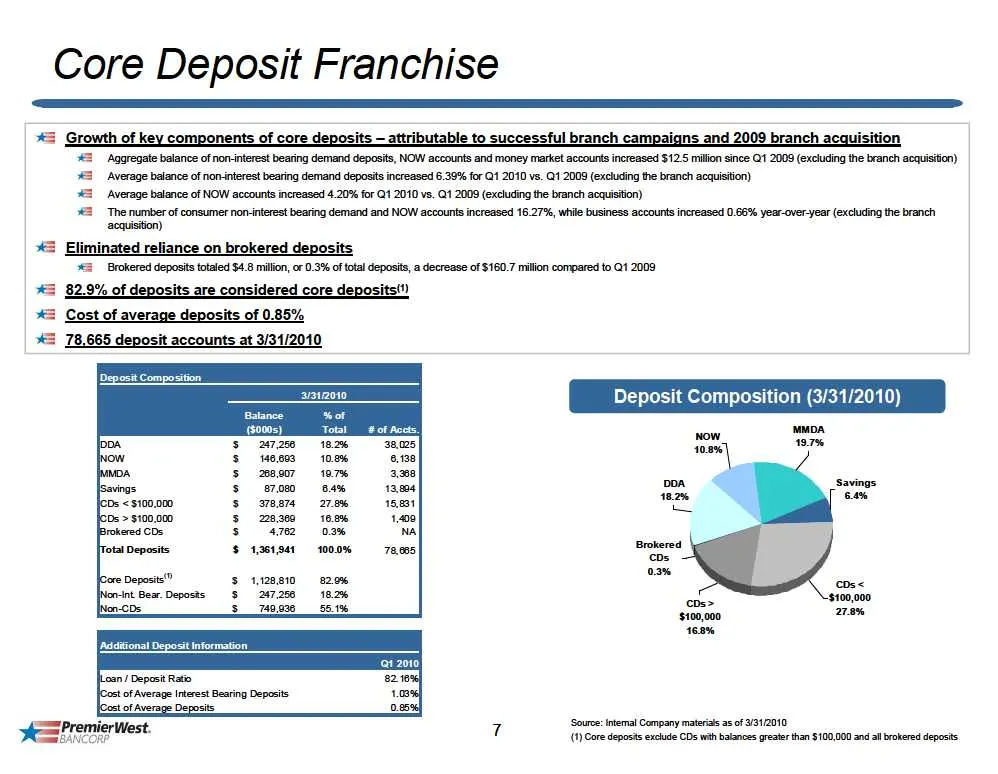
Core Deposit Franchise *3 Growth of key components of core deposits — attributable to successful branch campaigns and 2009 branch acquisition ‘Aggregate balance of non interest bearing demand deposits, NOW accounts and money market accounts increased $12.5 milion since Qt 2009 (excluding the branch
Slide 8: Banking Footprint with Strong Market Share
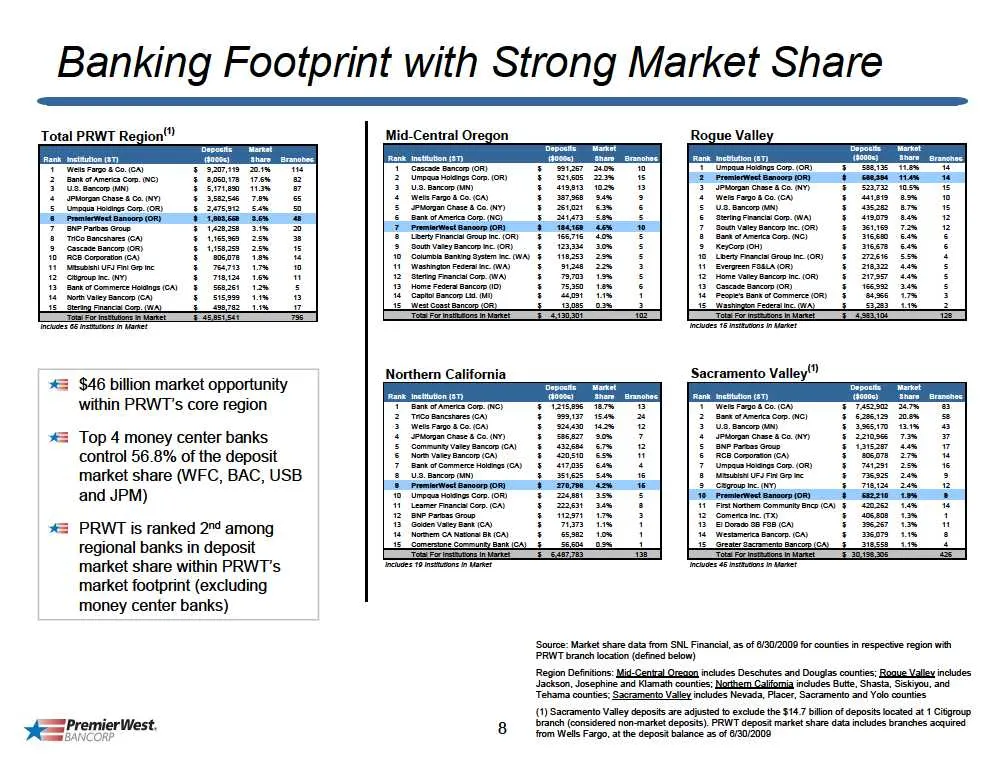
Banking Footprint with Strong Market Share Total PRWT Region" Mid-Central Oregon Rogue Valle es Fe ober enet——¢E Et $46 billion market opportunity within PRWT's core region Top 4 money center banks control 56.8% of the deposit market share (WFC, BAC, USB and JPM) PRWT is ranked 24 among regional ban
Slide 9: Liquidity Profile
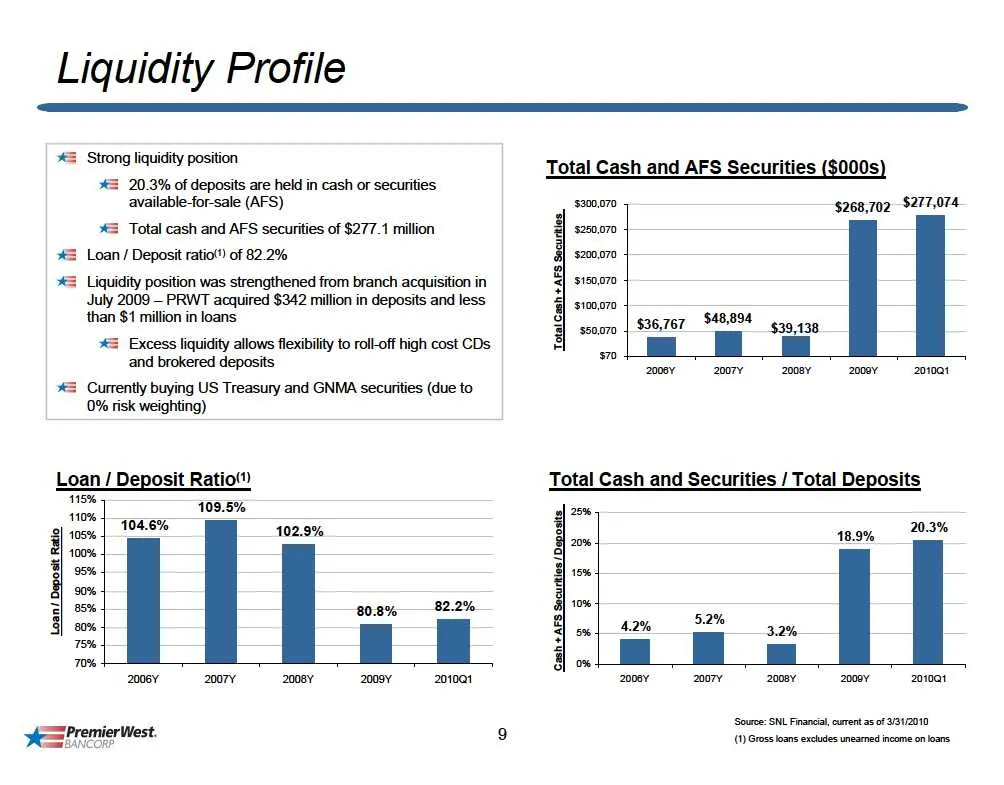
Liquidity Profile 3 Strong liquidity position 42 20.3% of deposits are held in cash or securities available-for-sale (AFS) ¥ Total cash and AFS securities of $277.1 million %3 Loan / Deposit ratio) of 82.2% 2 Liquidity position was strengthened from branch acquisition in July 2009 — PRWT acquired $3
Slide 10: Peer Comparison
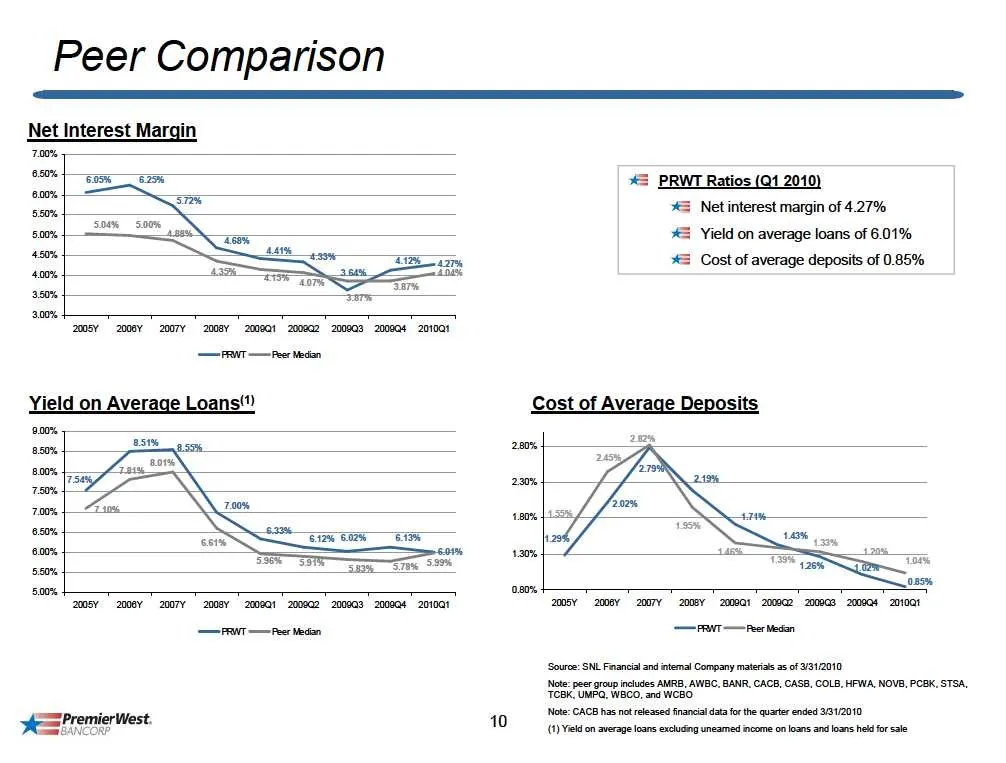
Peer Comparison Net Interest Margin 700% 50% O_o 00% 50% 500% 500% 500% 450% ee o 0% 00% Yield on Average Loans") 00% ate 00% 750% 700% ome *= PRWT Ratios (Q1 2010) % Net interest margin of 4.27% 4 Yield on average loans of 6.01% 4S Cost of average deposits of 0.85% Cost of Average Deposits en 50% 5
Slide 11: Credit Practices
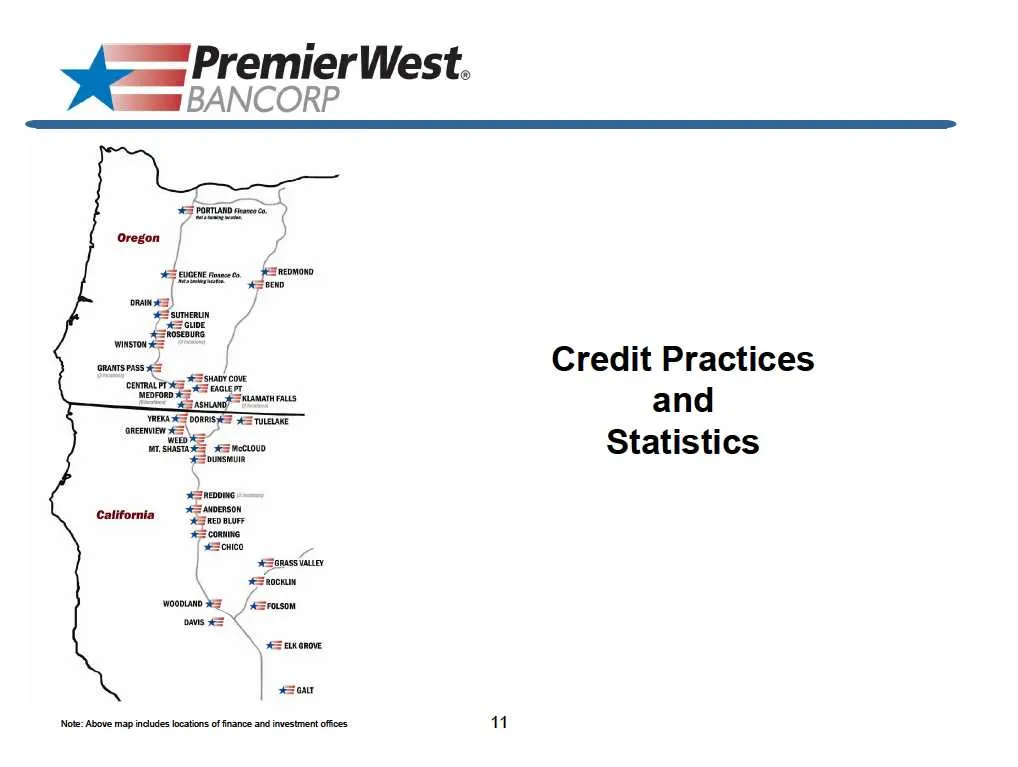
ye PremierWest. sume BANCORP Credit Practices a hee a and woth naan Statistics omalprseg *zunreme California = *=saeon
Slide 12: Significantly Enhanced Credit Administration
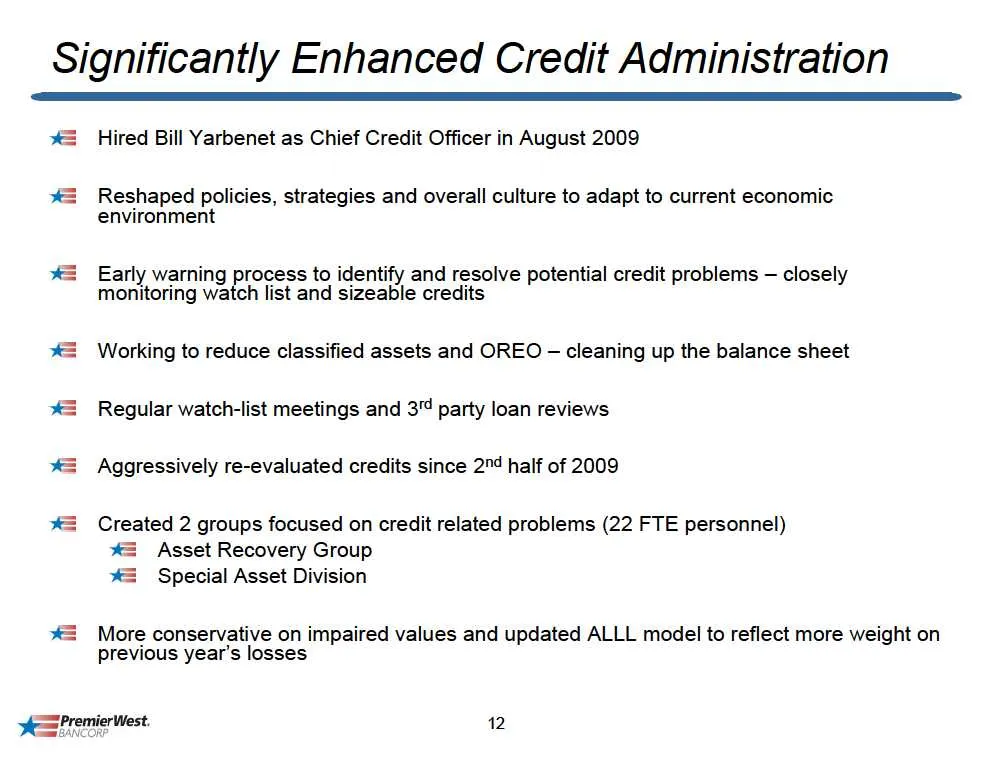
Significantly Enhanced Credit Administration *= Hired Bill Yarbenet as Chief Credit Officer in August 2009 *= Reshaped policies, strategies and overall culture to adapt to current economic environment ¥*= Early warning process to identify and resolve potential credit problems — closely monitoring wa
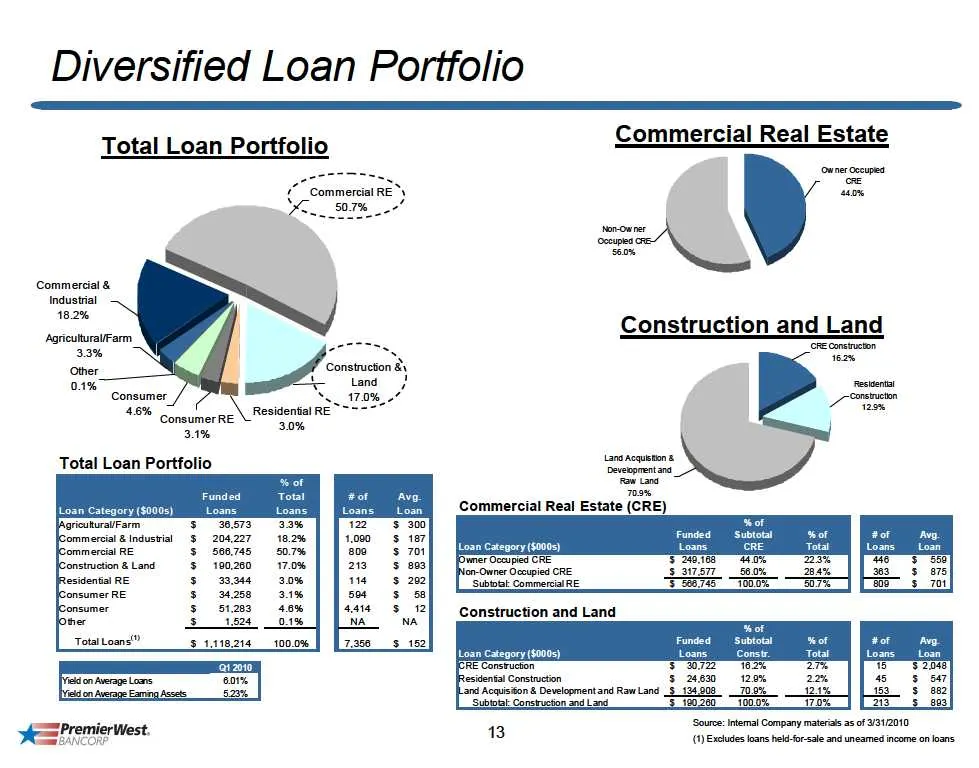
Slide 13: Diversified Loan Portfolio
Diversified Loan Portfolio Total Loan Portfolio Commercial Real Estate — orn cers 7 Commercial RE) are -Y Commercial & Industial 18.2% . Construction and Land GERadiam: “onstruction ang !and 33% Gaur corn ‘constructon 8 ee | rece Se 17.0% 2” a 4.5% oneumer Re \ Residential RE a 30% i tans Acquistion
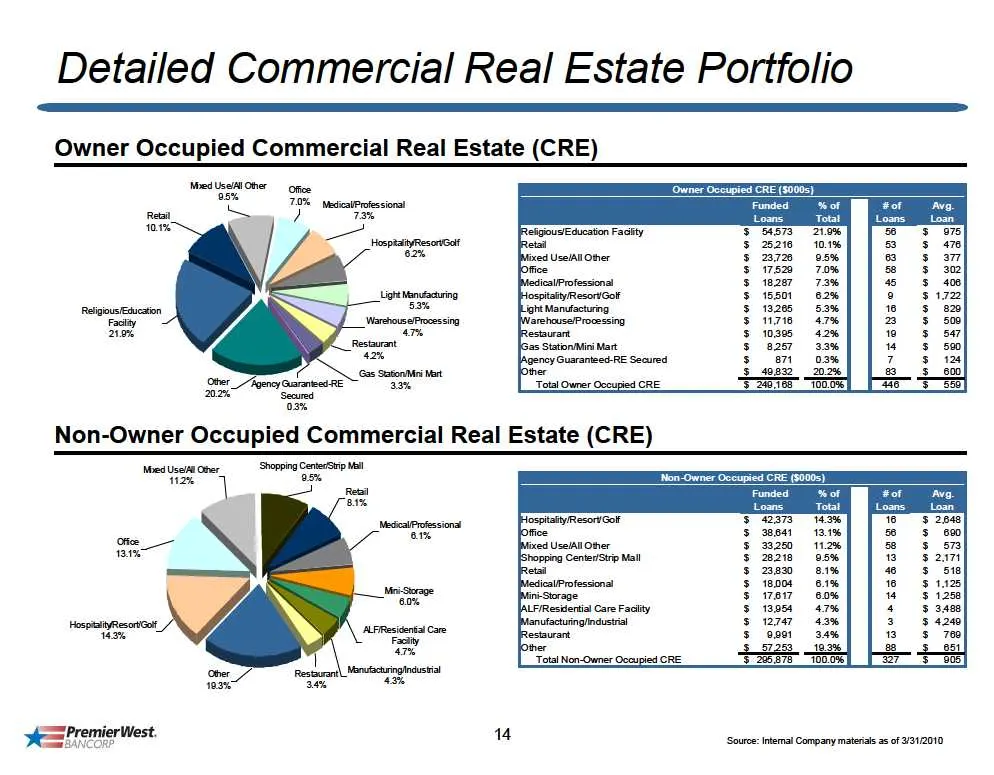
Slide 14: Detailed Commercial Real Estate Portfolio
Detailed Commercial Real Estate Portfolio Owner Occupied Commercial Real Estate (CRE) Med UseAl Ober ofce (Owner Occupied CRE (5000s) Funded ‘of o5% = RelijousrEdueston Facly WarehouseProcessng 28% 47% Med Usa Cher = | ‘Mon-Owner Oceupied CRE (50005) Funded ‘of Loans Total 14 ‘Source: intemal Compan
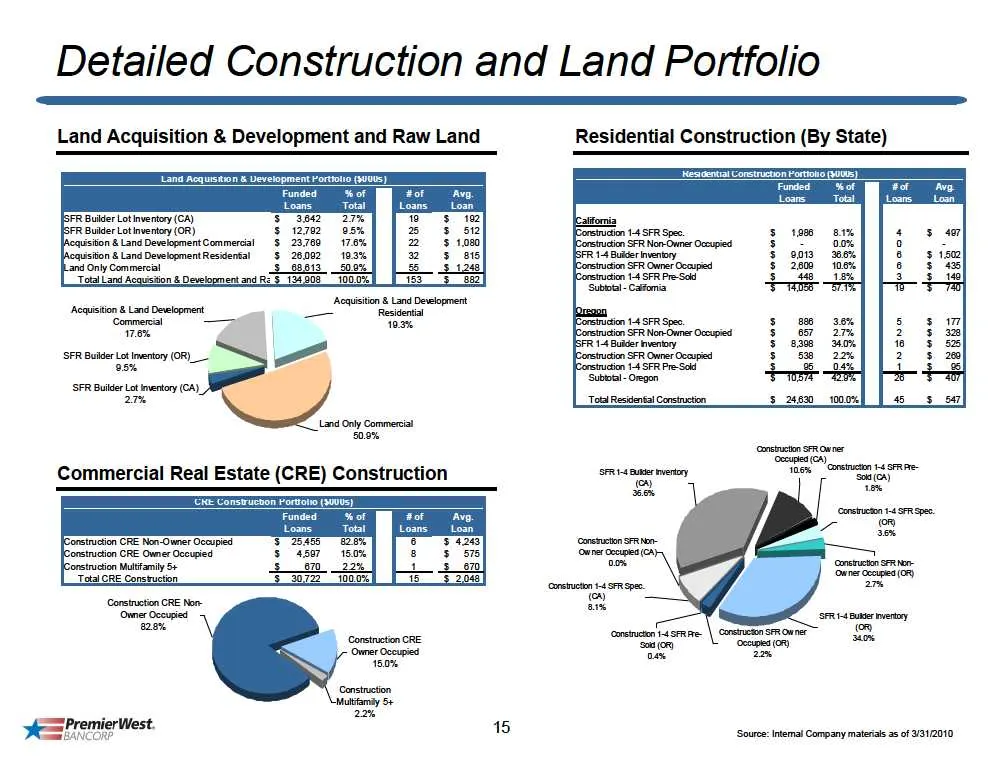
Slide 15: Detailed Construction and Land Portfolio
Detailed Construction and Land Portfolio ion & Development and Raw Land Land Aequisiton & evelopment Fortoto ($000) Funded % of Loans Total Sana 3 12702 3 23700 ‘SFR Builder Lot imentory (OR)_— 5% ‘SFR Builder Lot inventory (CA) 27% Land Only Commercat ‘0a% Commercial Real Estate (CRE) Construction
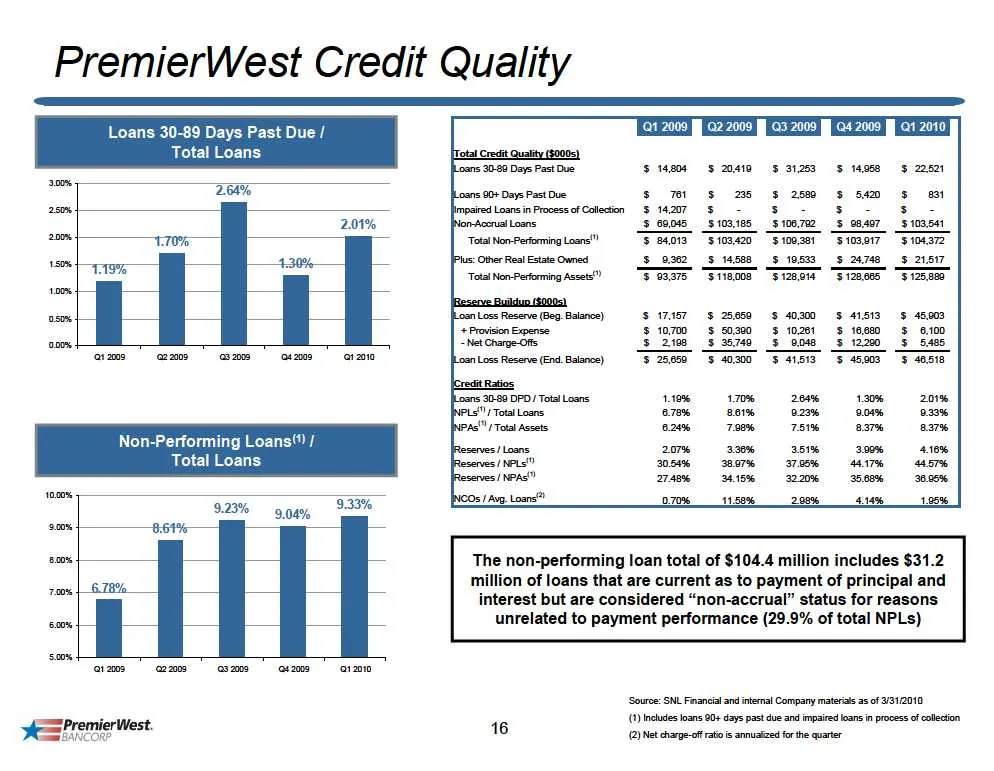
Slide 16: PremierWest Credit Quality
PremierWest Credit Quality Loans 30-89 Days Past Due/ Total Loans Non-Performing Loans‘) / Total Loans Hearne et @22009 Qi 2010 3 meso 3 2580 sat s $10,702 3 on4o7 3103541 Stooss sios17 "$104s72 $1953 5 24748 _§ 21517 Sizsers “Siaees "3 2.860 3 40300 $ 41813 $ 45003 3 10281 $ 1680 $6,100 Soo $1220 5
Slide 17: Geography of Credit Issues
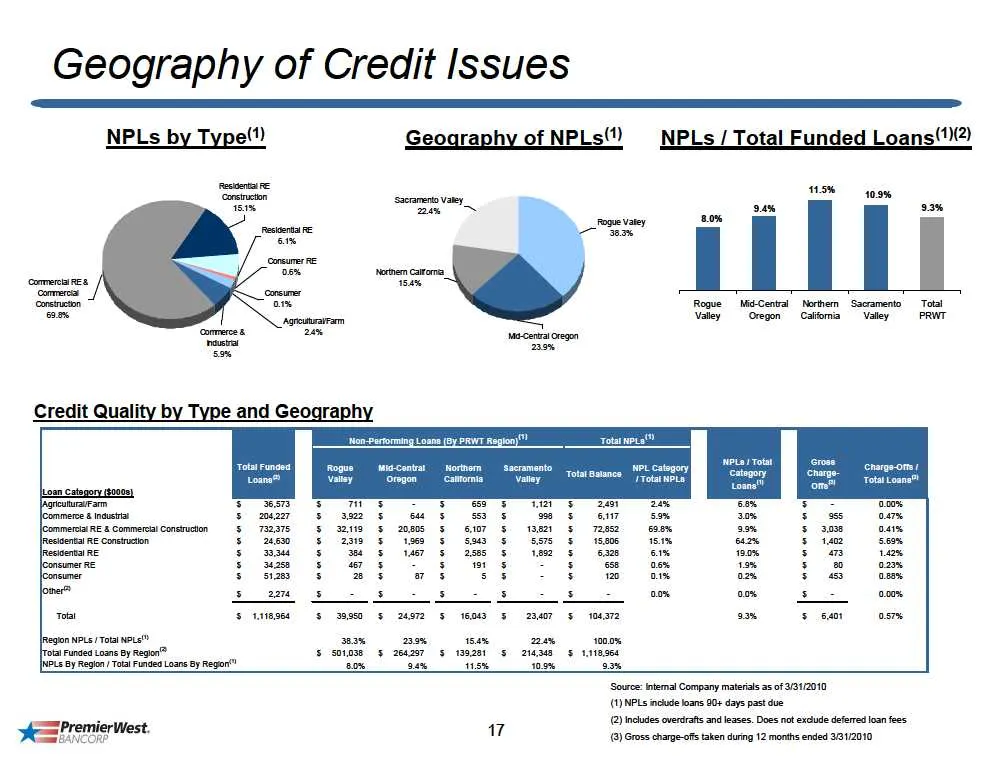
Geography of Credit Issues NPLs by Type() Geography of NPLs“) NPLs / Total Funded Loans(2) ‘crencton aaa 15% 09% 150% 2 24% 238 = 20% Pesertal rE i ae, cs armen carom comercines rs am Rogue Mi-Cental Nerhem “Sacramento Total Valey Oregon. Calfomia Valley PRT ‘commerce 2a Ma cena oregon on-Bertoming
Slide 18: Earnings and Current Events
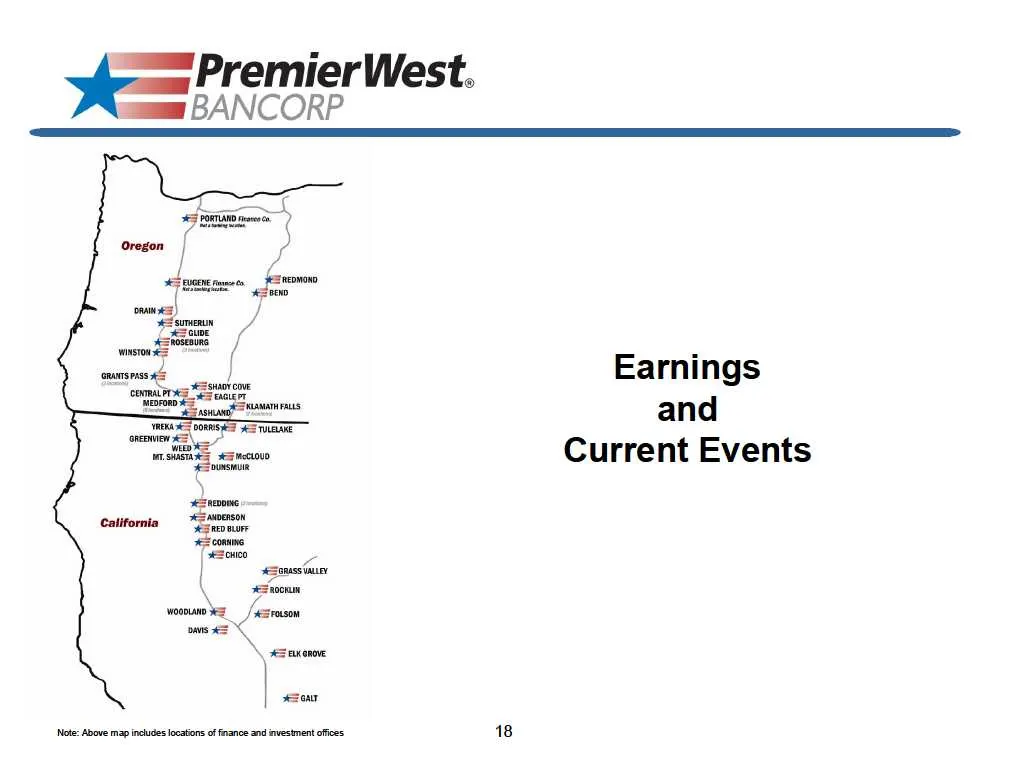
yie== PremierWest. sums BANCORP Earnings and Current Events
Slide 19: Update on PremierWest
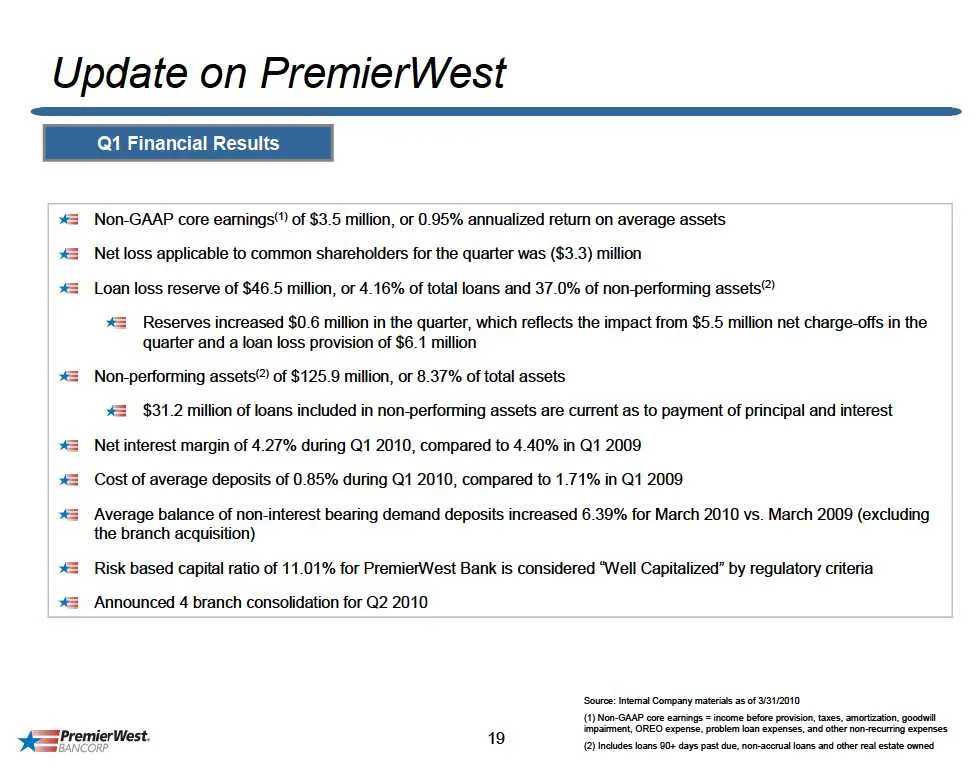
Update on PremierWest Q1 Financial Results Non-GAAP core earings" of $3.5 million, or 0.95% annualized retum on average assets i 42. Netloss applicable to common shareholders for the quarter was ($3.3) million 42 Loan loss reserve of $46.5 million, or 4.16% of total loans and 37.0% of non-performing
Slide 20: Current Developments & Action Plans
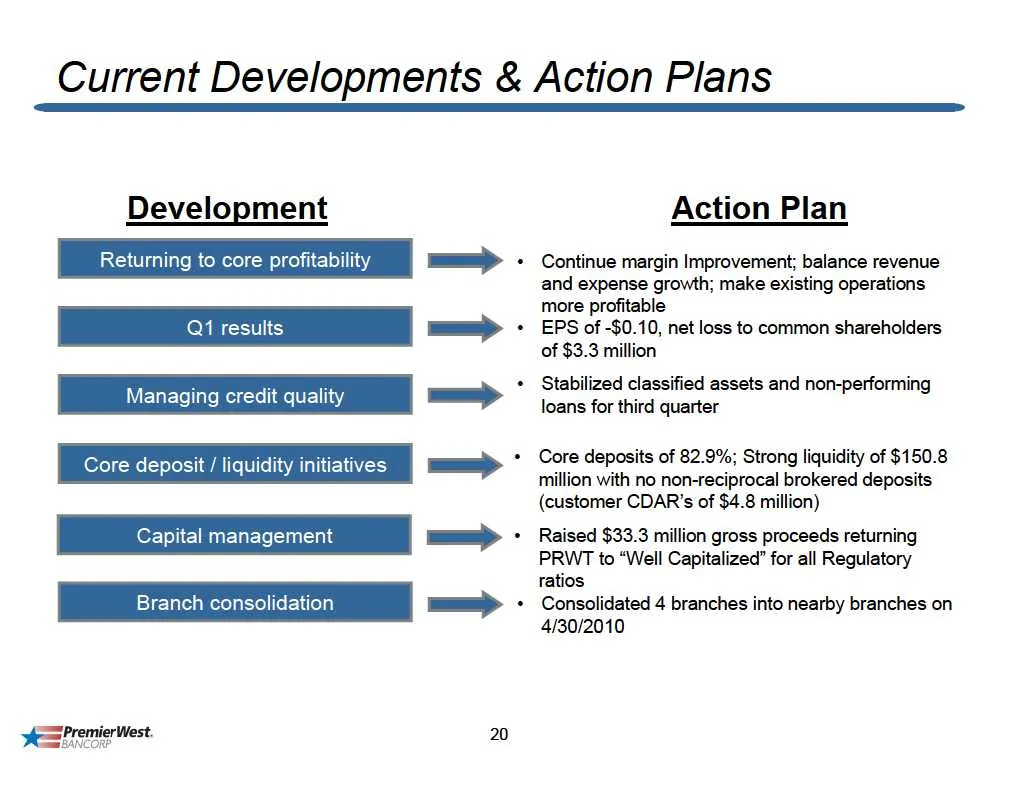
Current Developments & Action Plans Development < — a — <a — I< — = — =< — - setae et 20 Action Plan Continue margin Improvement; balance revenue and expense growth; make existing operations more profitable EPS of -$0.10, net loss to common shareholders of $3.3 million Stabilized classified assets a
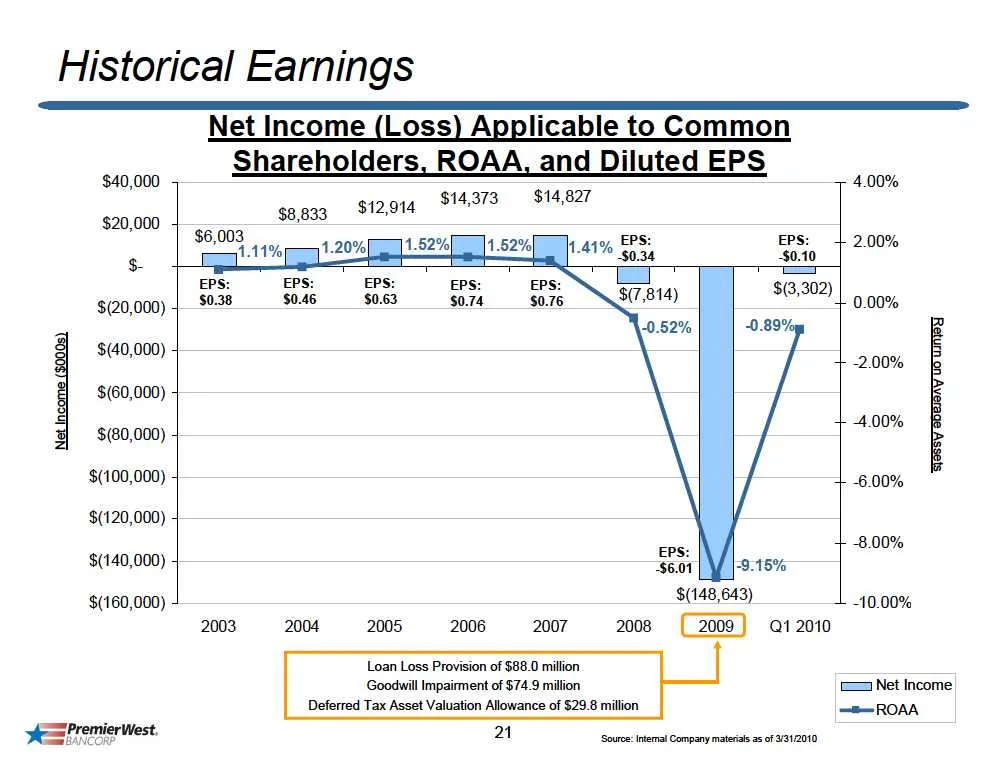
Slide 21: Historical Earnings
Historical Earnings $(20,000) 3 $140,000) $(60,000) Net I $(80,000) $(100,000) $(120,000) $(140,000) $(160,000) sePromieese Net Income (Loss) A licable to Common Shareholders, ROAA, and Diluted EPS $14,827 yo gaan st201a S14378 f $6,003 y, EPS: eps: 42.00% {41% $0.34 $0.10 - u EPS: EPS: EPS: EPS: $0
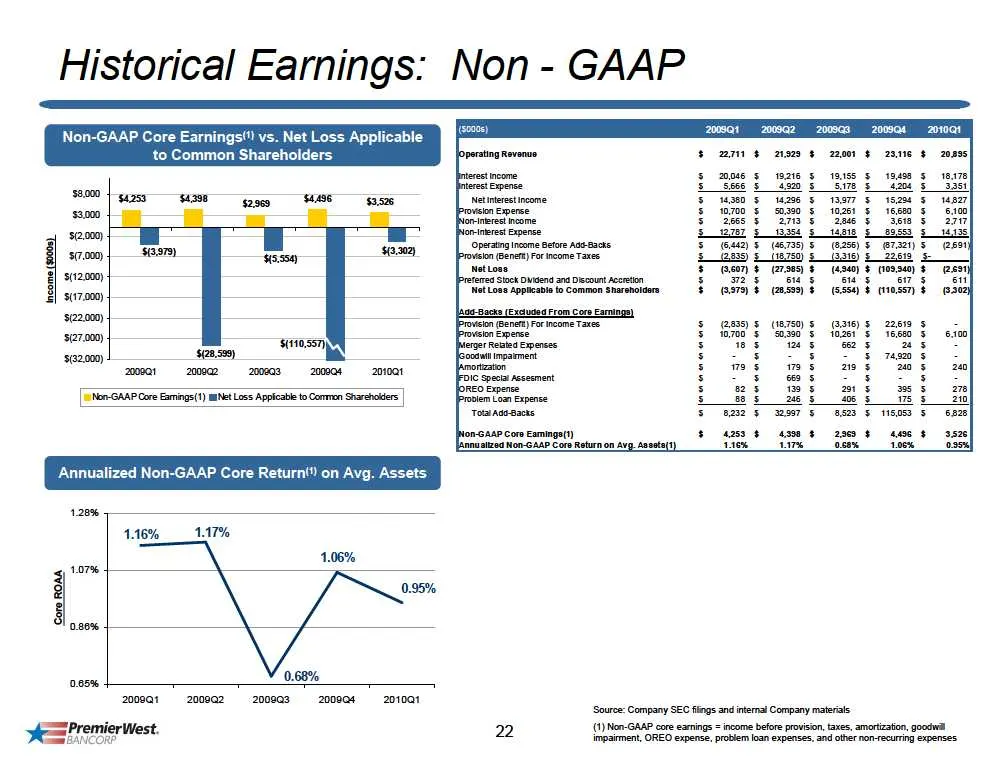
Slide 22: Historical Earnings: Non-GAAP
Historical Earnings: Non - GAAP 2o0sq3 200804 AAP Core Earnings" vs. Net Loss Ap to Common Shareholders 5 (6atz) § 45735) § (8256) § TSAI) £ Bay § tera § (aoe) § Sere (2607) $_ (2730s) $ (4300) $ (108360) m2 5 cw Chea ear eas) enassn, geo s ver) ‘roo § ‘Ssas0 5 5 . lon GAP Core Eamngo() a ee ee azo
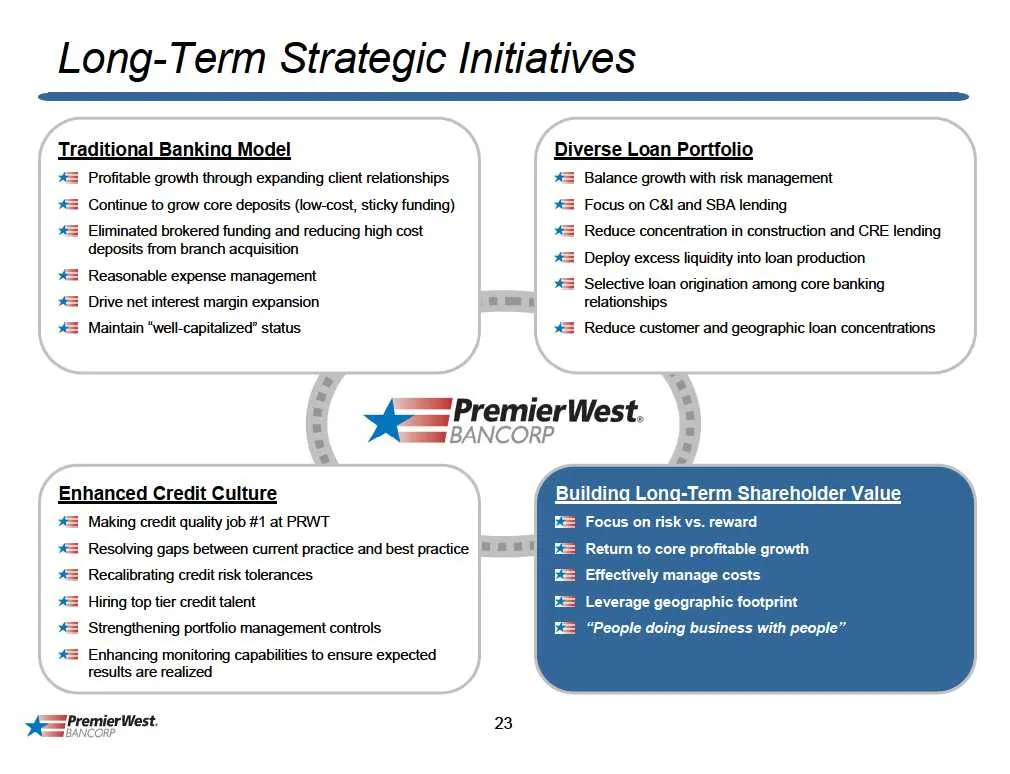
Slide 23: Long-Term Strategic Initiatives
Long-Term Strategic Initiatives Diverse Loan Portfolio Balance growth with risk management Focus on C&l and SBA lending Reduce concentration in construction and CRE lending Deploy excess liquidity into loan production Selective loan origination among core banking relationships Reduce customer and ge
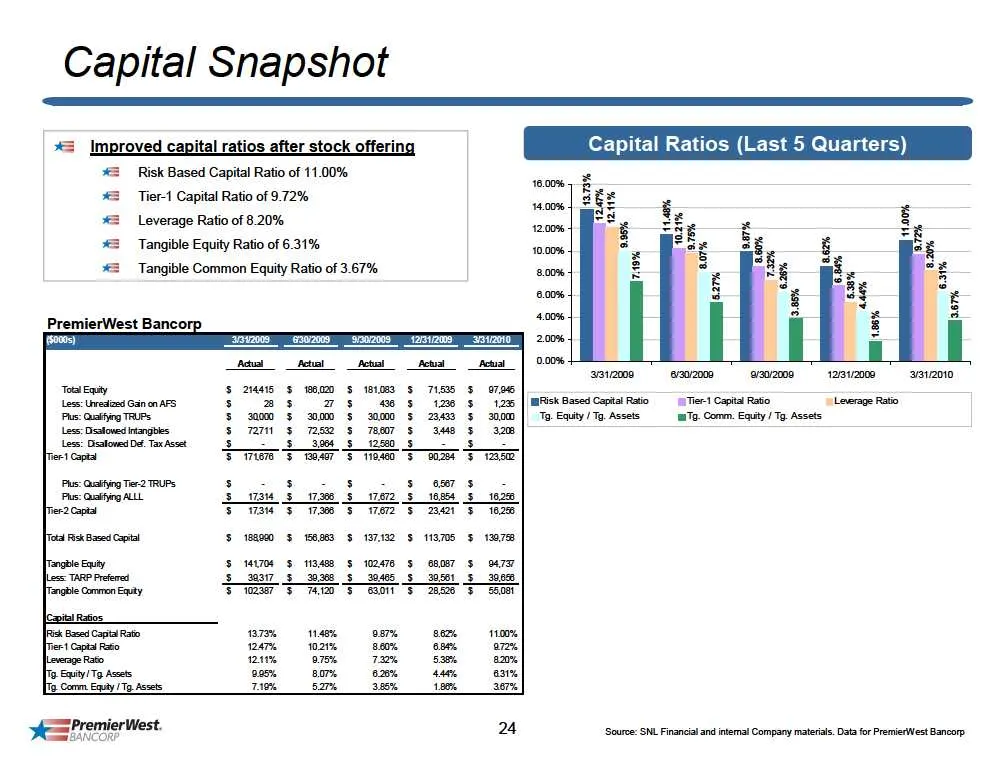
Slide 24: Capital Snapshot
Capital Snapshot *= Improved capital ratios after stock offerin: Risk Based Capital Ratio of 11.00% Tier-1 Capital Ratio of 972% Leverage Ratio of 8.20% Tangible Equity Ratio of 6.31% Tangible Common Equity Ratio of 3.67% hath a PremierWest Bancorp e100 12010 Fisk Based Captal Rio Tier 1 Capital ato
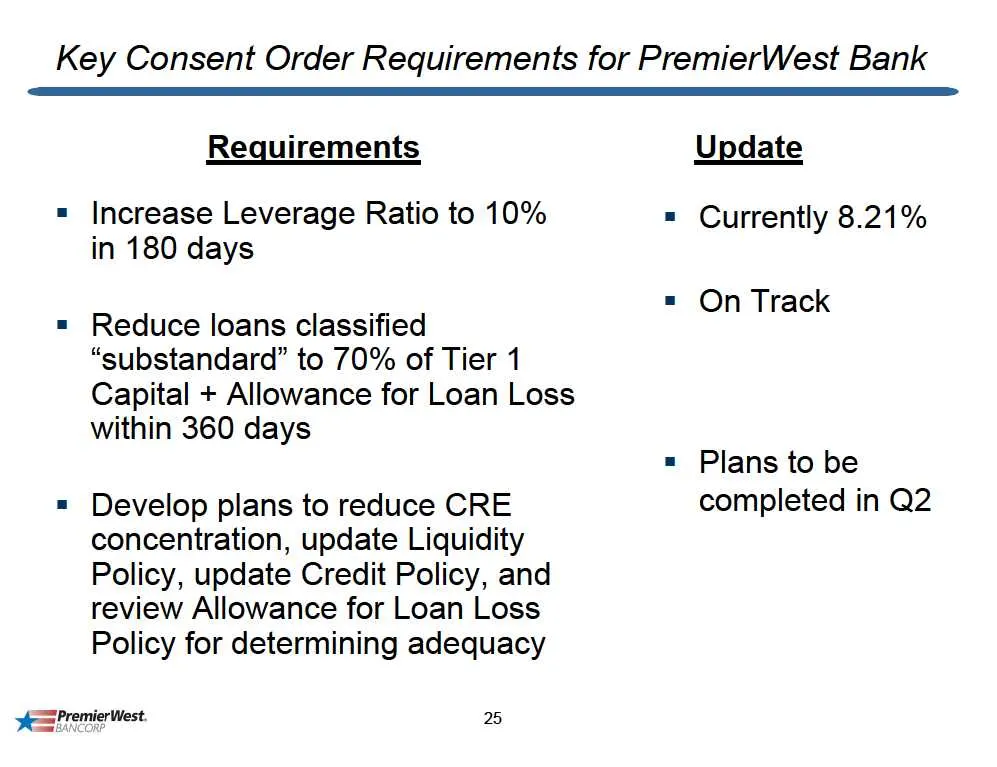
Slide 25: Key Consent Order Requirements for PremierWest Bank
Key Consent Order Requirements for PremierWest Bank Requirements Update = Increase Leverage Ratio to 10% = Currently 8.21% in 180 days = On Track = Reduce loans classified “substandard” to 70% of Tier 1 Capital + Allowance for Loan Loss within 360 days = Plans to be = Develop plans to reduce CRE com
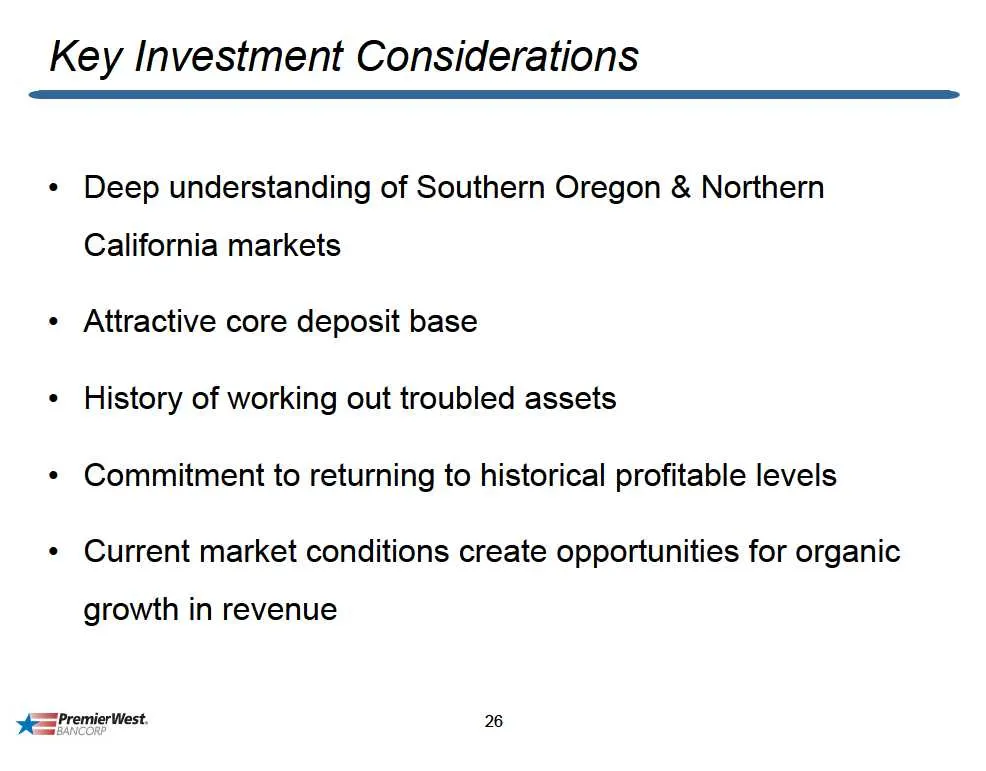
Slide 26: Key Investment Considerations
Key Investment Considerations *« Deep understanding of Southern Oregon & Northern California markets ¢ Attractive core deposit base ¢ History of working out troubled assets * Commitment to returning to historical profitable levels ¢ Current market conditions create opportunities for organic growth i
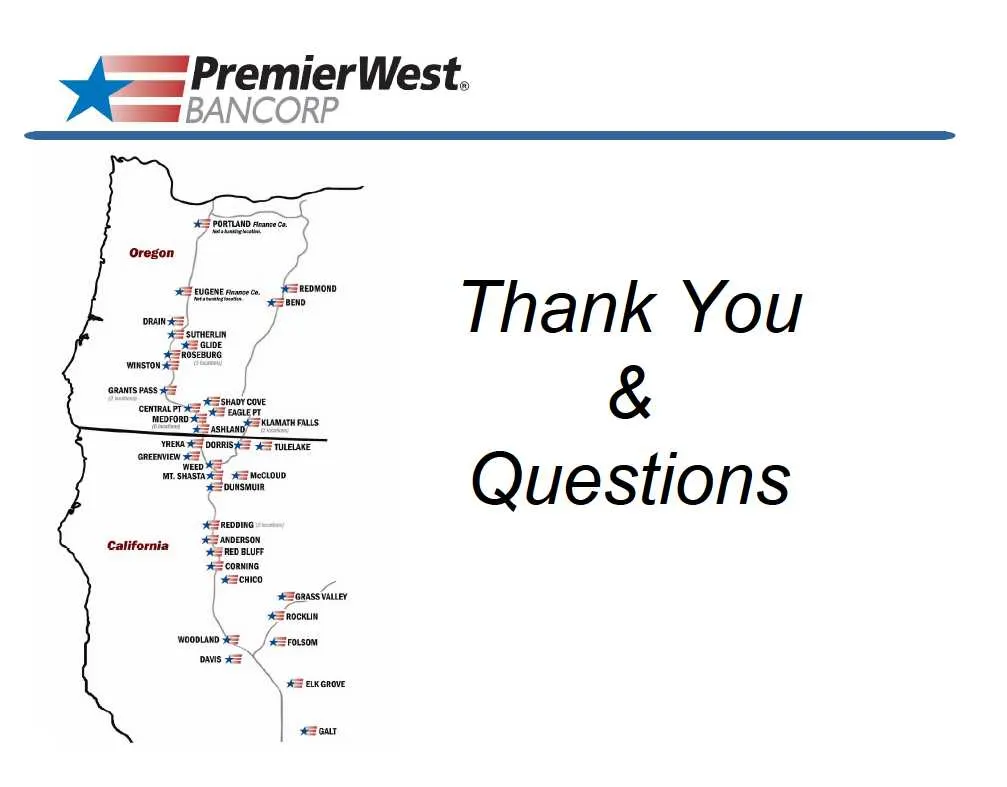
Slide 27: Thank You - Questions
==" PremierWest. mmm BANCORP Thank You & Questions
Source: SEC EDGAR · 8-K filed May 12, 2010
More decks from PremierWest Bancorp
 Shareholder Meeting (May 2011)27 slides · May 26, 2011
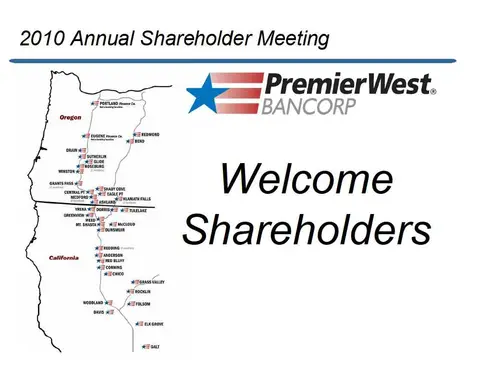 Shareholder Meeting (May 2010)29 slides · May 28, 2010
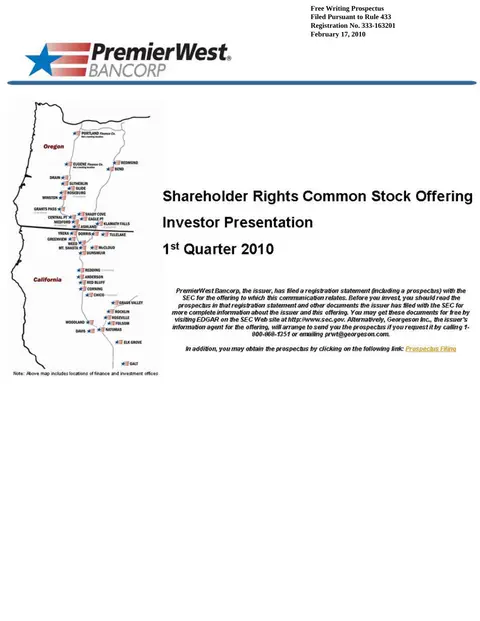 IPO Roadshow (February 2010)28 slides · Feb 18, 2010
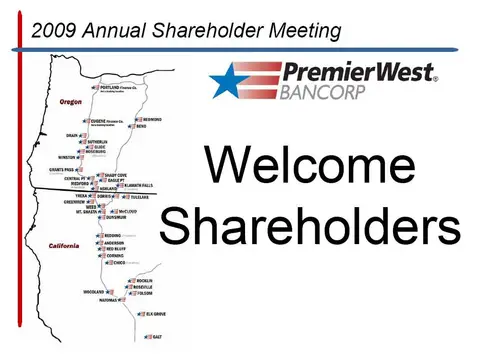 Shareholder Meeting (June 2009)27 slides · Jun 24, 2009
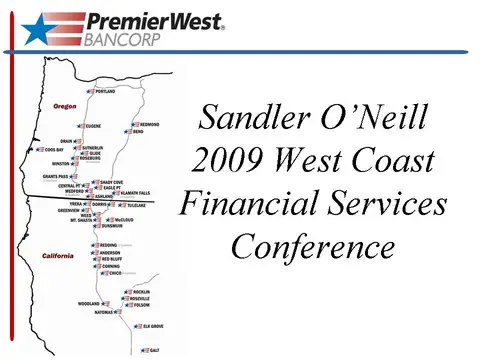 Sandler O'Neill 2009 West Coast Financial Services Conference16 slides · Feb 26, 2009
 D.A. Davidson & Co. Conference (February 2009)13 slides · Feb 19, 2009