DNB Financial — Shareholder Meeting (April 2016)
31 slides from DNB Financial's shareholder meeting presentation, Apr 27, 2016
Slide 1: Welcome: DNB Financial Corporation Annual Shareholder Meeting
WelcomeDNB Financial CorporationAnnual Shareholder MeetingApril 27, 2016
Slide 2: Financial Results
Financial Results Gerald F. SoppExecutive Vice PresidentChief Financial Officer
Slide 3: Net Income
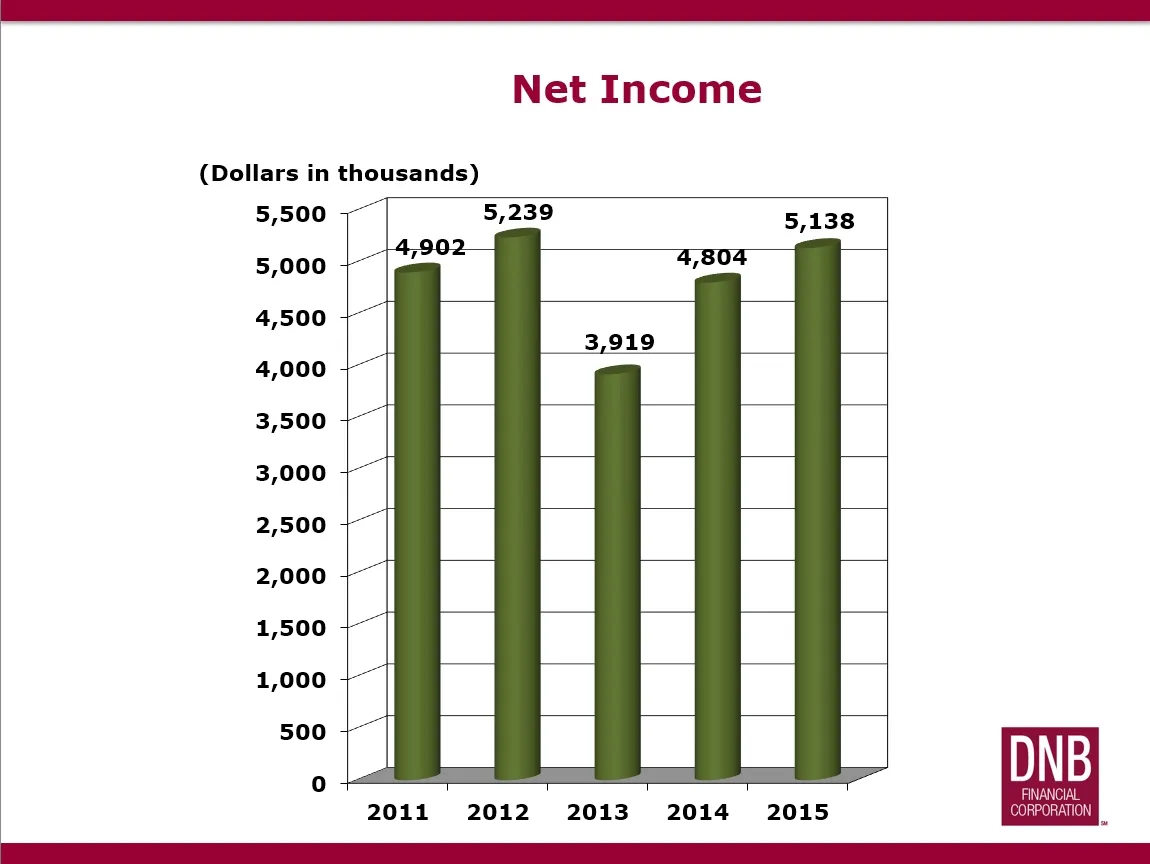
ee Net Income (Dollars in thousands) 5,500 7 5,239 5,138 14,902 5,000 4,500 4,000 3,500 3,000 2,500 2,000 1,500 1,000 500 2011 2012 2013 2014 2015
Slide 4: 2015 Major Accomplishments
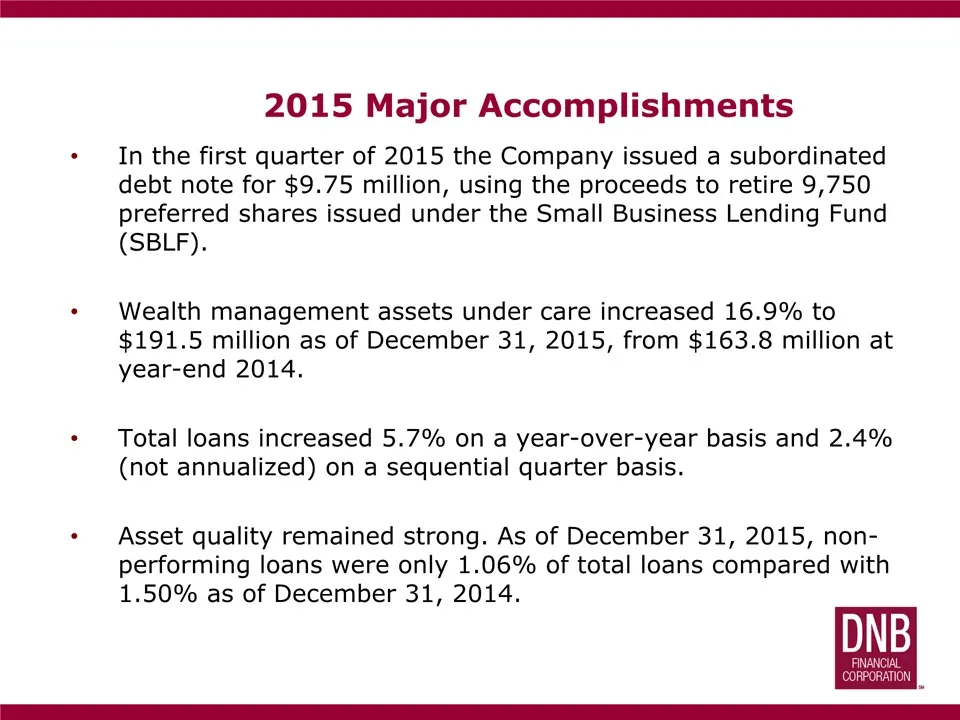
2015 Major Accomplishments In the first quarter of 2015 the Company issued a subordinated debt note for $9.75 million, using the proceeds to retire 9,750 preferred shares issued under the Small Business Lending Fund (SBLF). Wealth management assets under care increased 16.9% to $191.5 million as of
Slide 5: 2015 Major Accomplishments
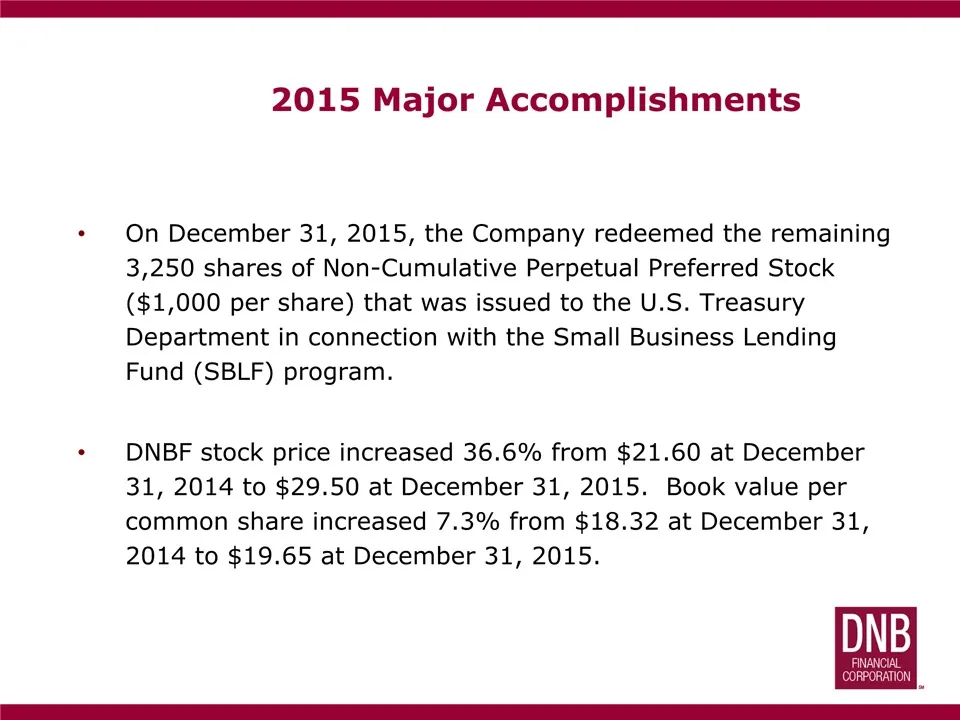
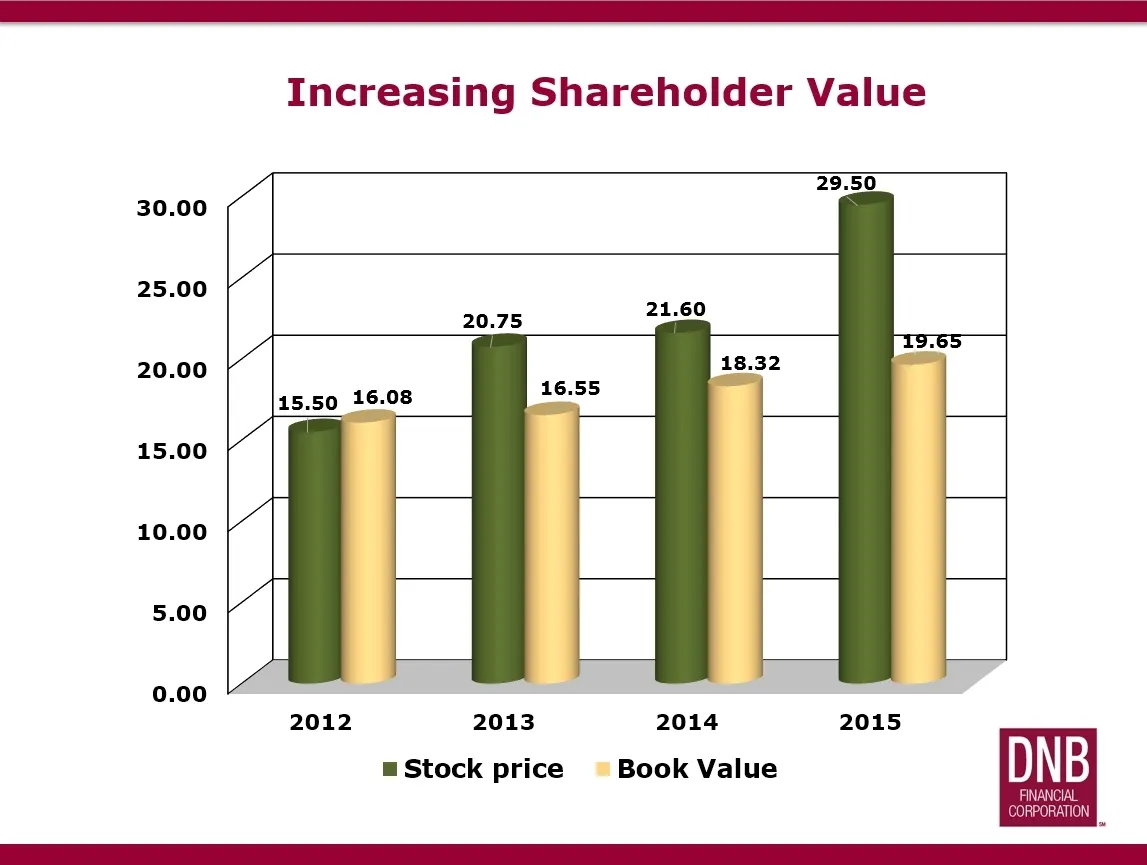
On December 31, 2015, the Company redeemed the remaining 3,250 shares of Non-Cumulative Perpetual Preferred Stock ($1,000 per share) that was issued to the U.S. Treasury Department in connection with the Small Business Lending Fund (SBLF) program.DNBF stock price increased 36.6% from $21.60 at Decem
Slide 6: Net Revenues
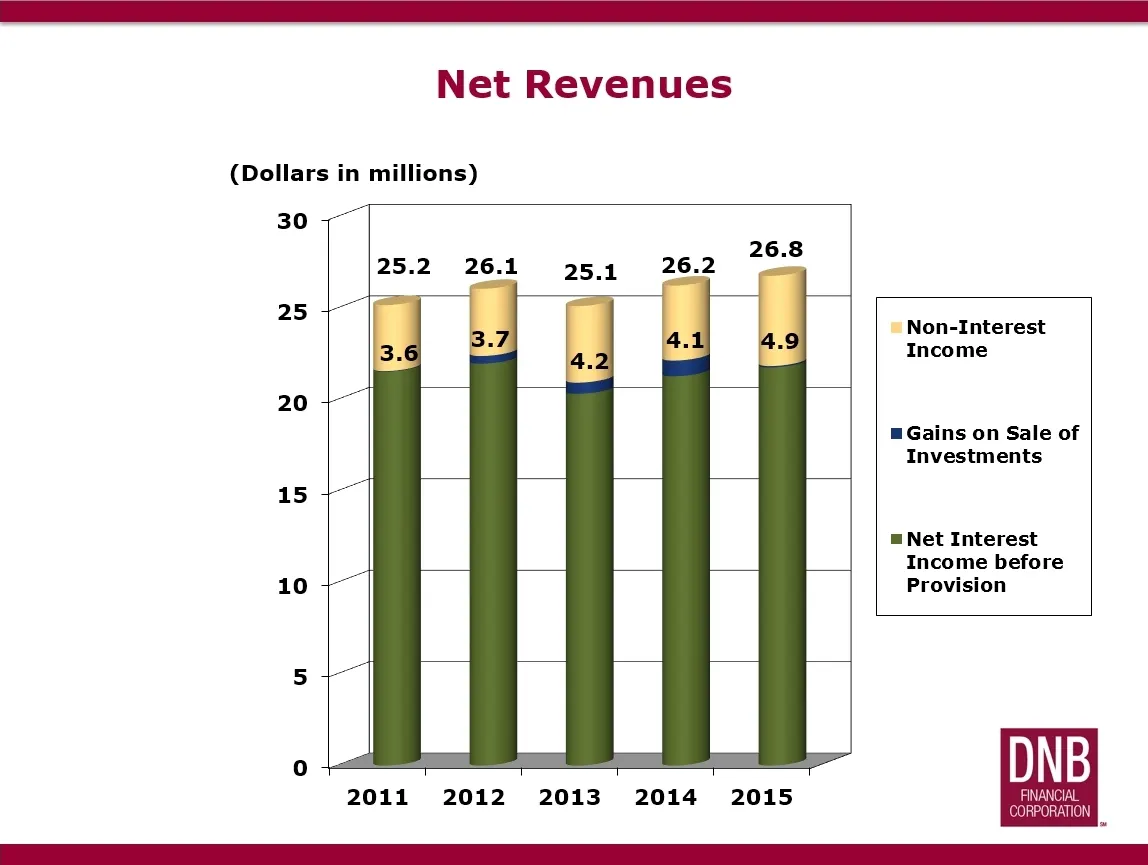
Net Revenues (Dollars in millions) 30 7 25 . Non-Interest Income 20 mGains on Sale of Investments 15 = Net Interest Income before Provision 10 2011 2012 2013 2014 2015
Slide 7: Total Assets
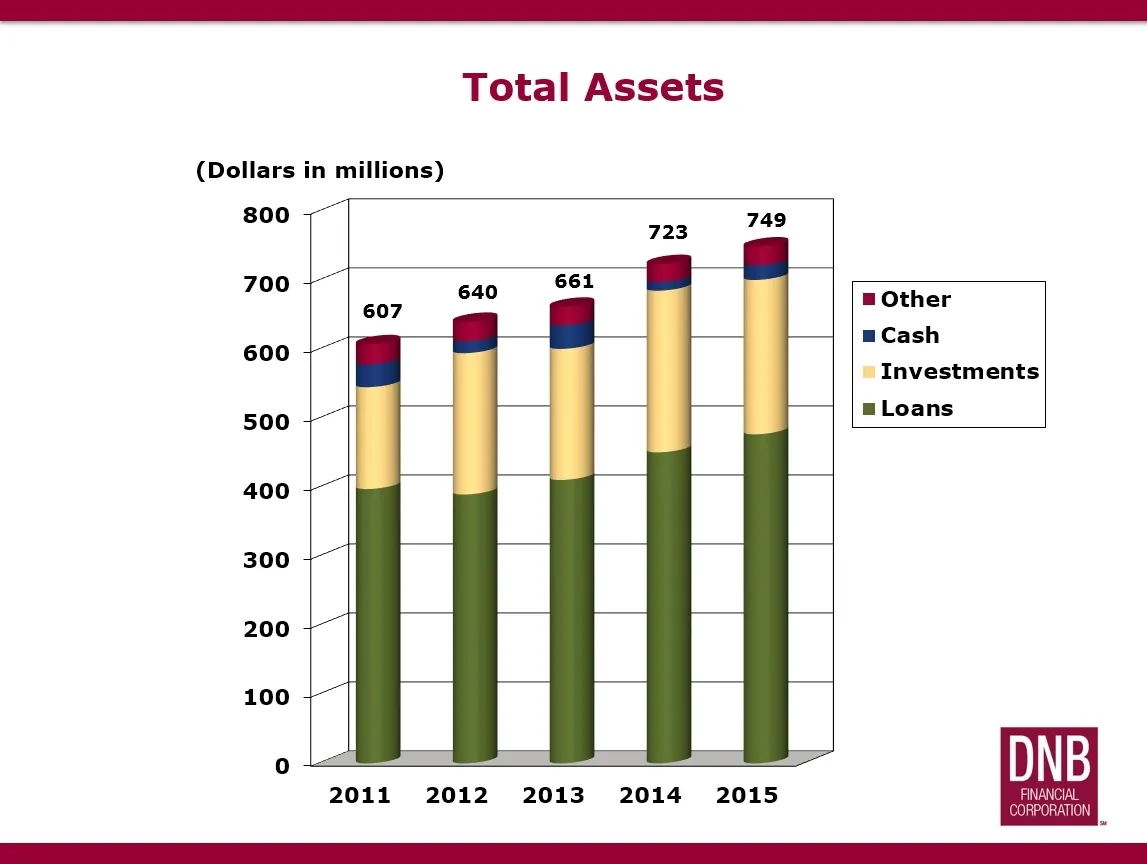
ee Total Assets (Dollars in millions) 800 5 700 + 723 749 661 640 TT 607 m= Other mCash 600 ; TT » Investments 500 | mLoans 400 5 300 ; 200 ; 100 + 1) 2011 2012 2013 2014 2015
Slide 8: Loan and Lease Portfolio
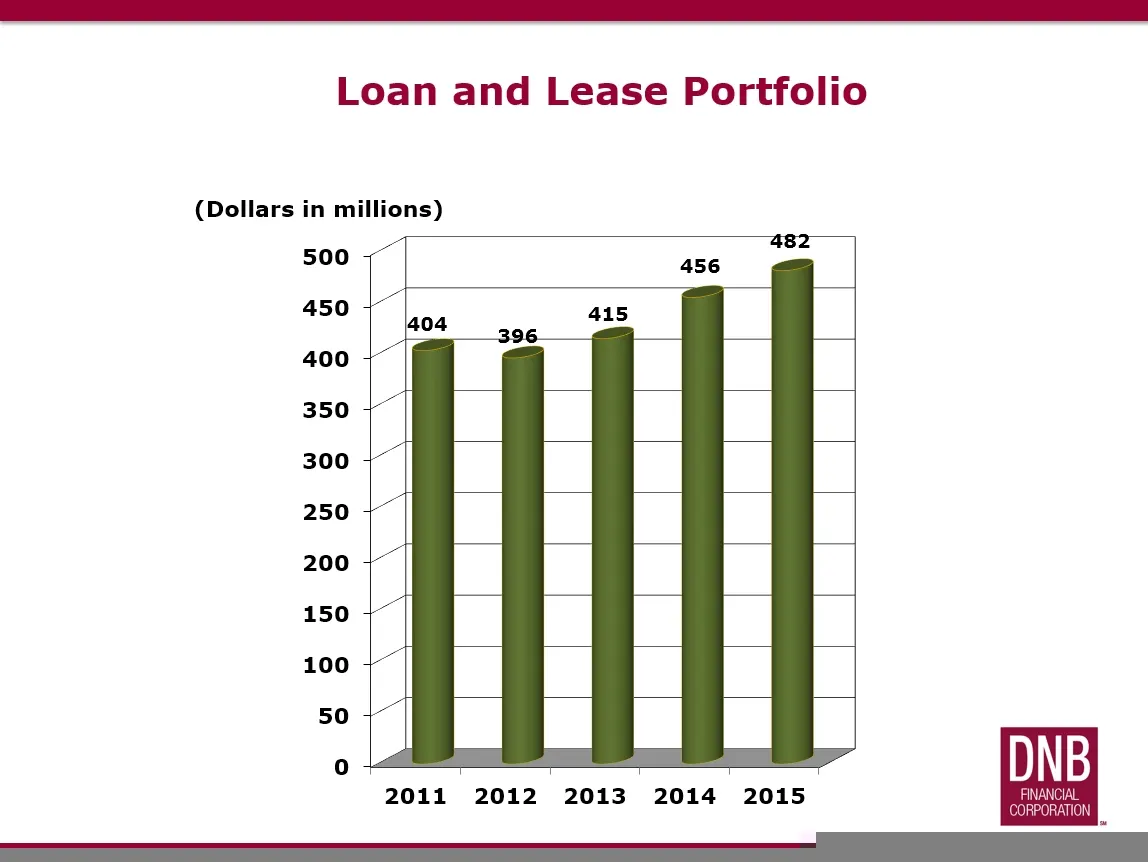
Loan and Lease Portfolio (Dollars in millions) 500 7 456 450 1 hh04 415 400 + 350 5 300 5 250 | 200 | 150 + 100 + 50 | o - 2011 2012 2013 2014 2015
Slide 9: Total Deposits
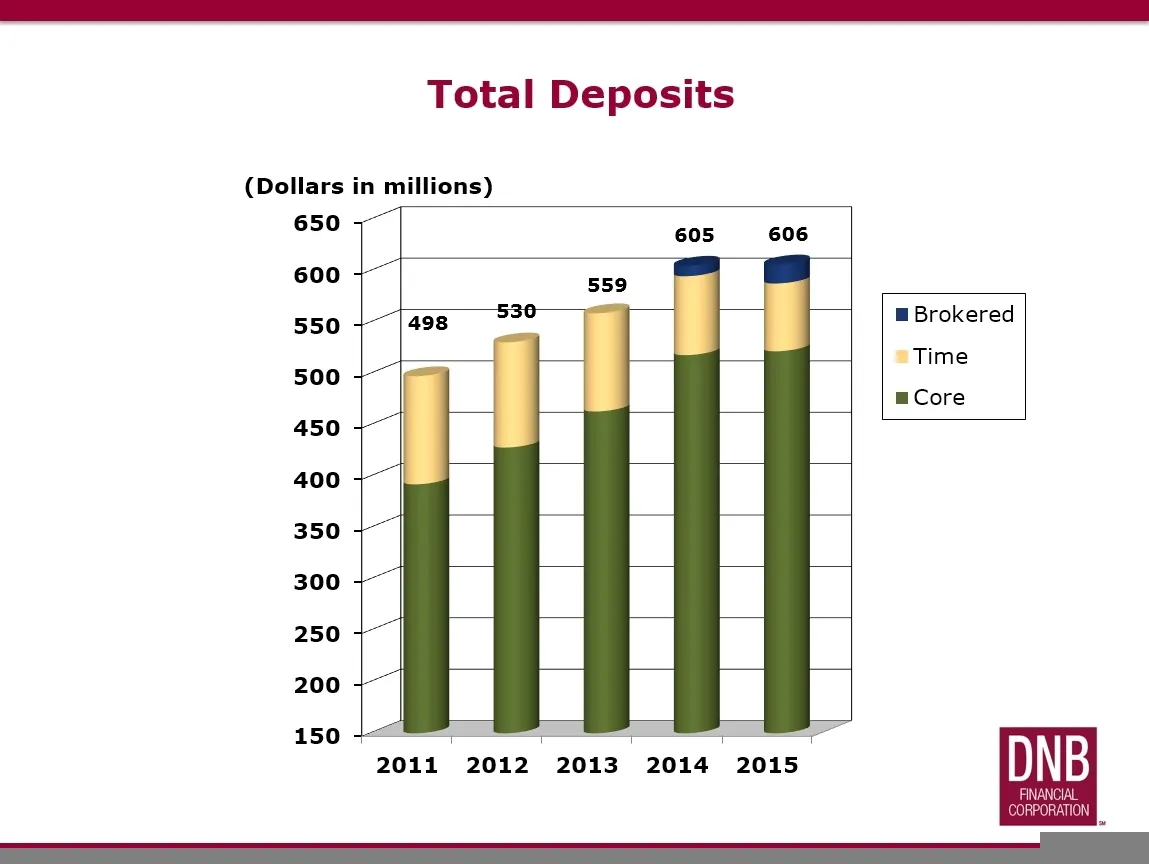
Total Deposits (Dollars in millions) 650 5 600 5 605 606 559 550 +~|498 538 m Brokered Time 500 - mCore 450 5 400 5 350 5 300 5 250 + 200 - 150 : : : f — 2011 2012 2013 2014 2015 D B
Slide 10: Tangible Common Equity
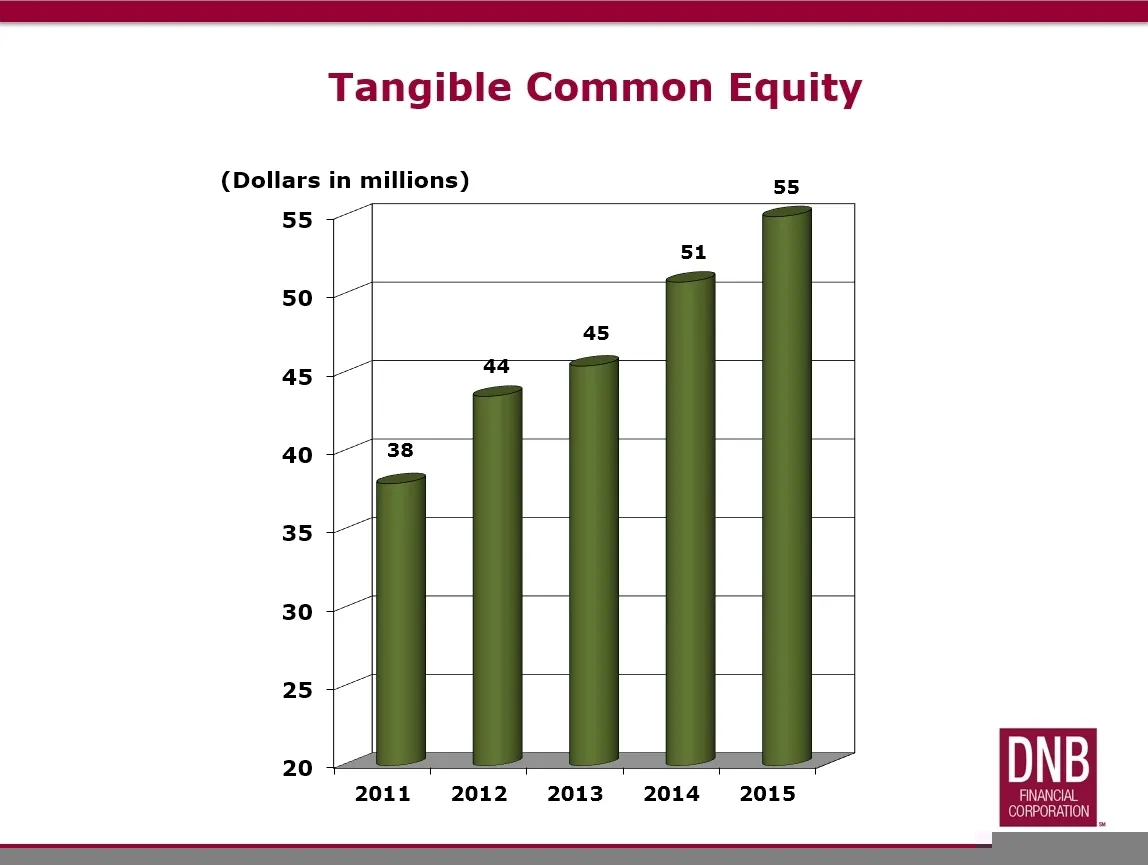
Tangible Common Equity (Dollars in millions) 55 55 4 51 50 5 45 45 4 40 {| 38 35 7 30 7 25 7 2011 2012 2013 2014 2015
Slide 11: Increasing Shareholder Value
Increasing Shareholder Value
Slide 12: First Quarter Results
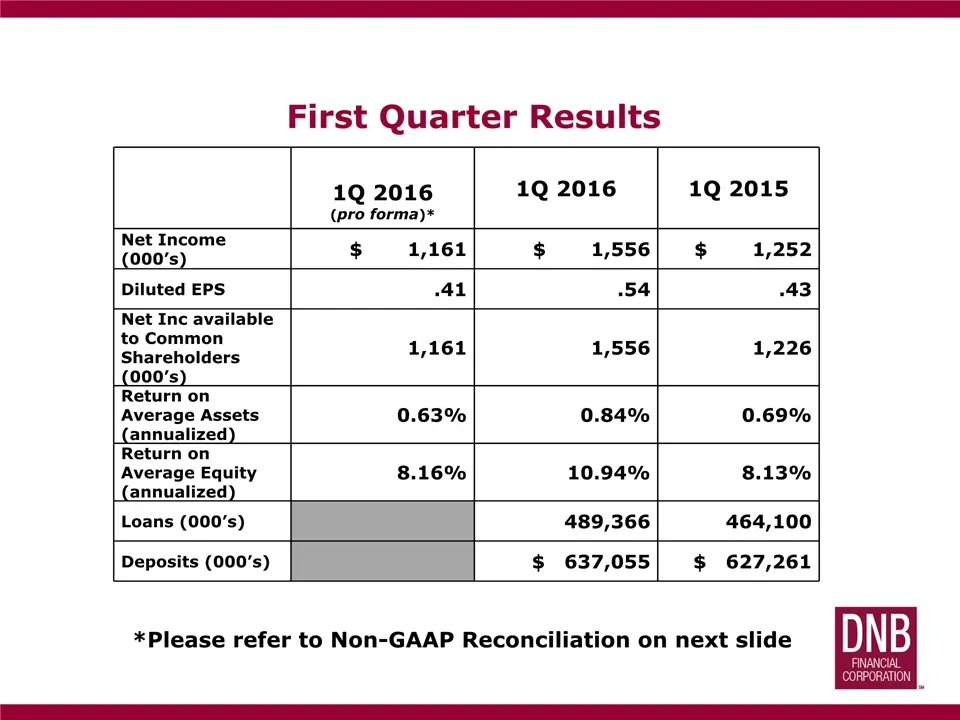
First Quarter Results 1Q 2016(pro forma)* 1Q 2016 1Q 2015 Net Income (000’s) $ 1,161 $ 1,556 $ 1,252 Diluted EPS .41 .54 .43 Net Inc available to Common Shareholders (000’s) 1,161 1,556 1,226 Return on Average Assets (annualized) 0.63% 0.84% 0.69% Return on Average Equity (annualized) 8.16% 10.94% 8
Slide 13: Reconciliation of Non-GAAP Financial Measures
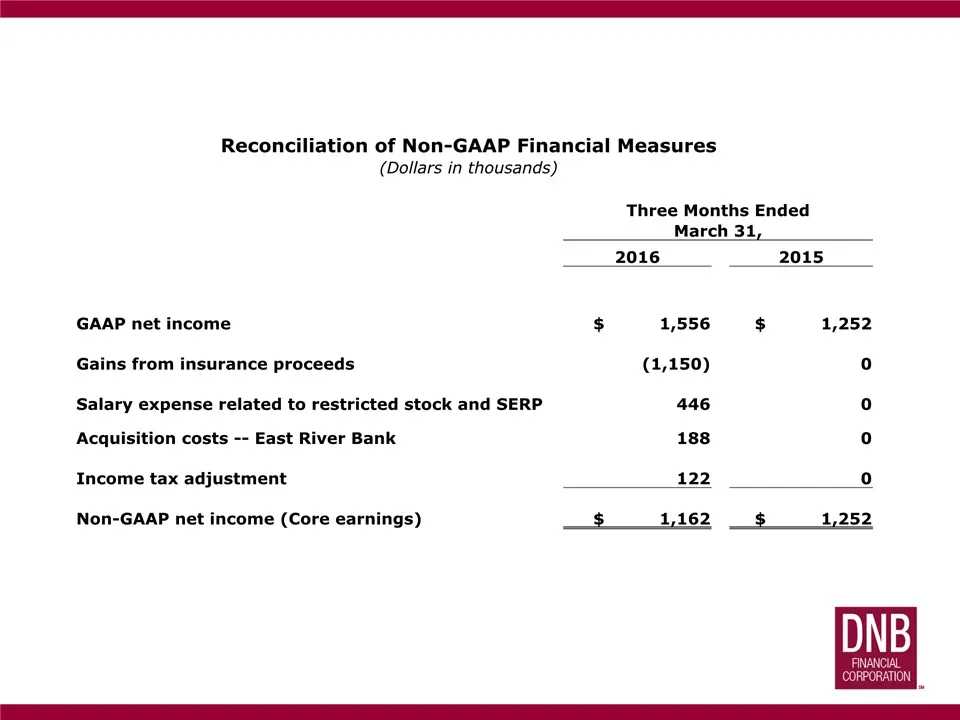
Reconciliation of Non-GAAP Financial Measures (Dollars in thousands) Three Months Ended March 31, 2016 2015 GAAP net income $ 1,556 $ 1,252 Gains from insurance proceeds (1,150) 0 Salary expense related to restricted stock and SERP 446 0 Acquisition costs -- East River Bank 188 0 Income tax adjustme
Slide 14: Acquisition of East River Bank
Acquisition of East River Bank William J. HiebPresident and Chief Executive Officer
Slide 15: Forward-looking Information
Forward-looking Information This presentation contains “forward-looking statements” within the meaning of the Private Securities Litigation Reform Act of 1995. These statements include, but are not limited to, expectations or predictions of future financial or business performance, conditions relati
Slide 16: Important Additional Information and Where to Find It
Important Additional Informationand Where to Find It DNB intends to file with the SEC a Registration Statement on Form S-4 relating to the proposed merger, which will include a prospectus for the offer and sale of DNB common stock as well as the joint proxy statement of DNB and East River for the so
Slide 17: Table of Contents
Table of Contents Transaction Summary and RationaleAbout East River BankThe Merger
Slide 18: Transaction Summary and Rationale
Transaction Summary and Rationale
Slide 19: Summary
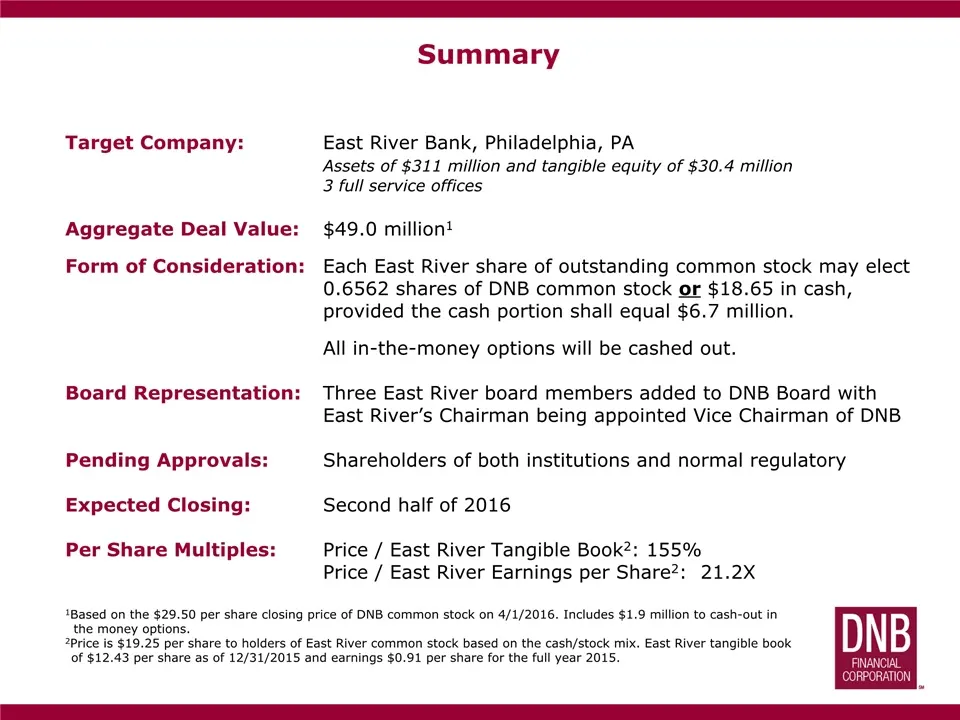
Summary Target Company: East River Bank, Philadelphia, PA Assets of $311 million and tangible equity of $30.4 million 3 full service offices Aggregate Deal Value: $49.0 million1Form of Consideration: Each East River share of outstanding common stock may elect 0.6562 shares of DNB common stock or $18
Slide 20: Compelling Strategic Value
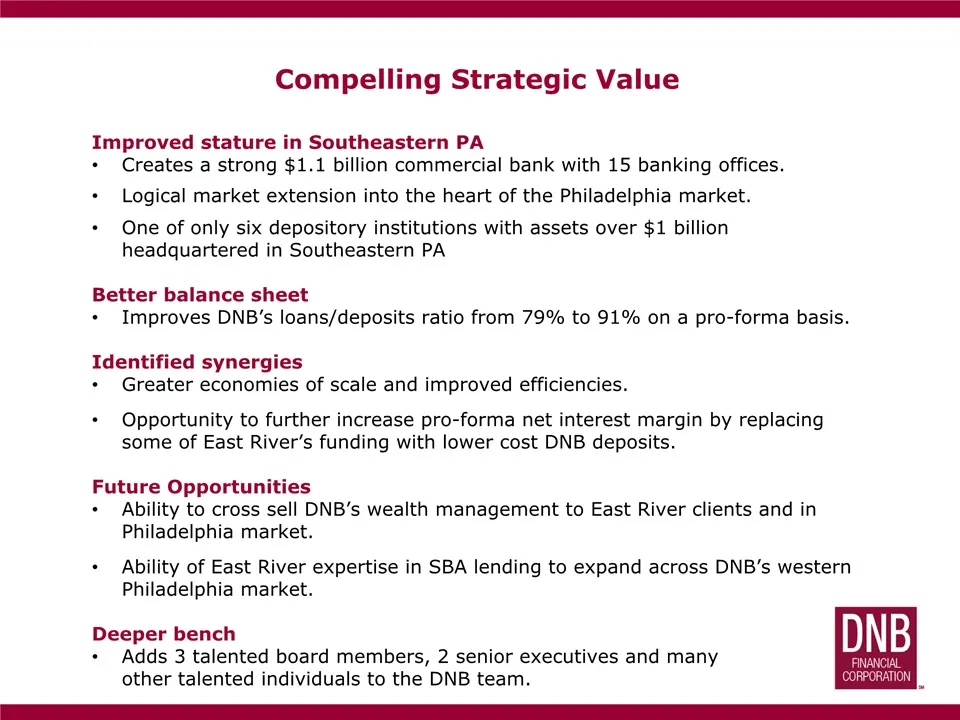
Compelling Strategic Value Improved stature in Southeastern PACreates a strong $1.1 billion commercial bank with 15 banking offices.Logical market extension into the heart of the Philadelphia market.One of only six depository institutions with assets over $1 billion headquartered in Southeastern PAB
Slide 21: Better Balance Sheet
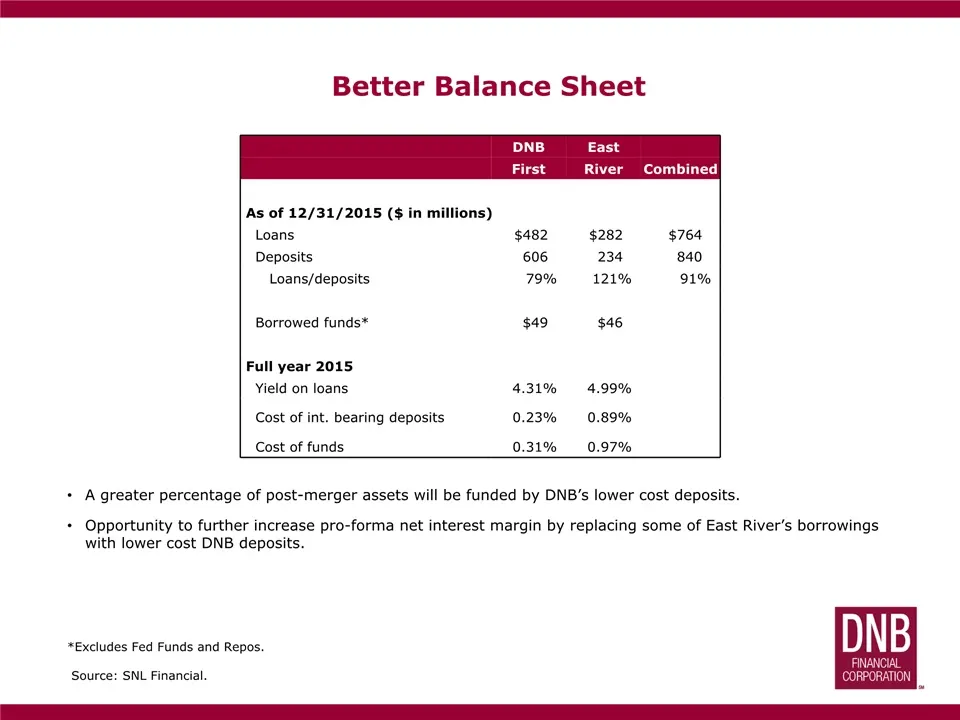
Better Balance Sheet A greater percentage of post-merger assets will be funded by DNB’s lower cost deposits.Opportunity to further increase pro-forma net interest margin by replacing some of East River’s borrowings with lower cost DNB deposits.*Excludes Fed Funds and Repos. Source: SNL Financial. DN
Slide 22: Loan Mix
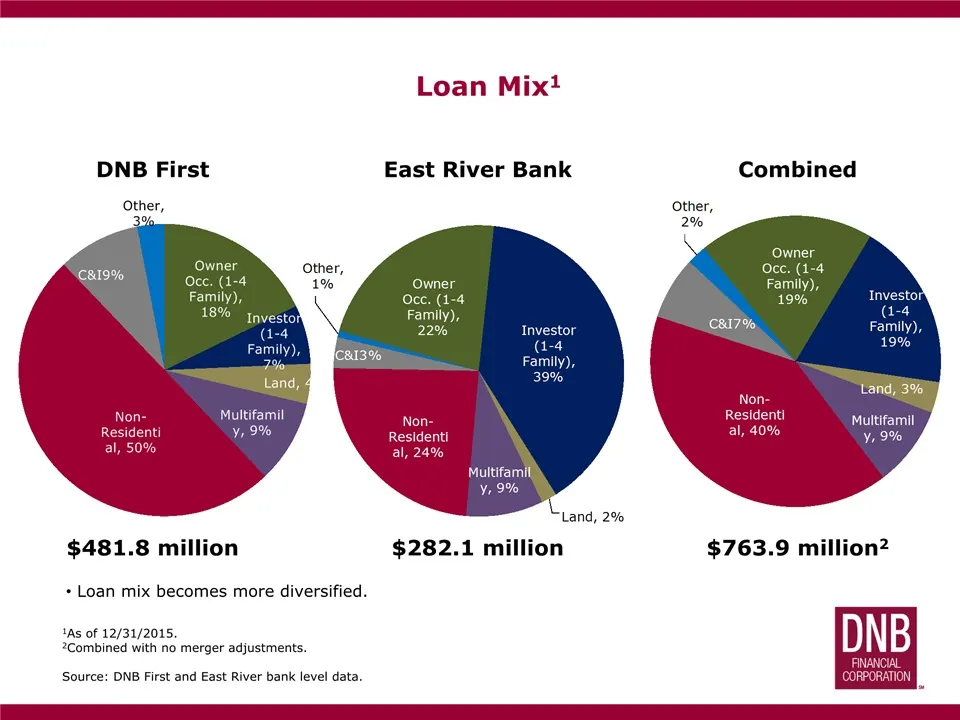
Loan Mix1 1As of 12/31/2015.2Combined with no merger adjustments.Source: DNB First and East River bank level data. DNB First $481.8 million East River Bank $282.1 million Combined $763.9 million2 Loan mix becomes more diversified.

Slide 23: About East River Bank
About ARE ast River Bank
Slide 24: East River Bank Overview
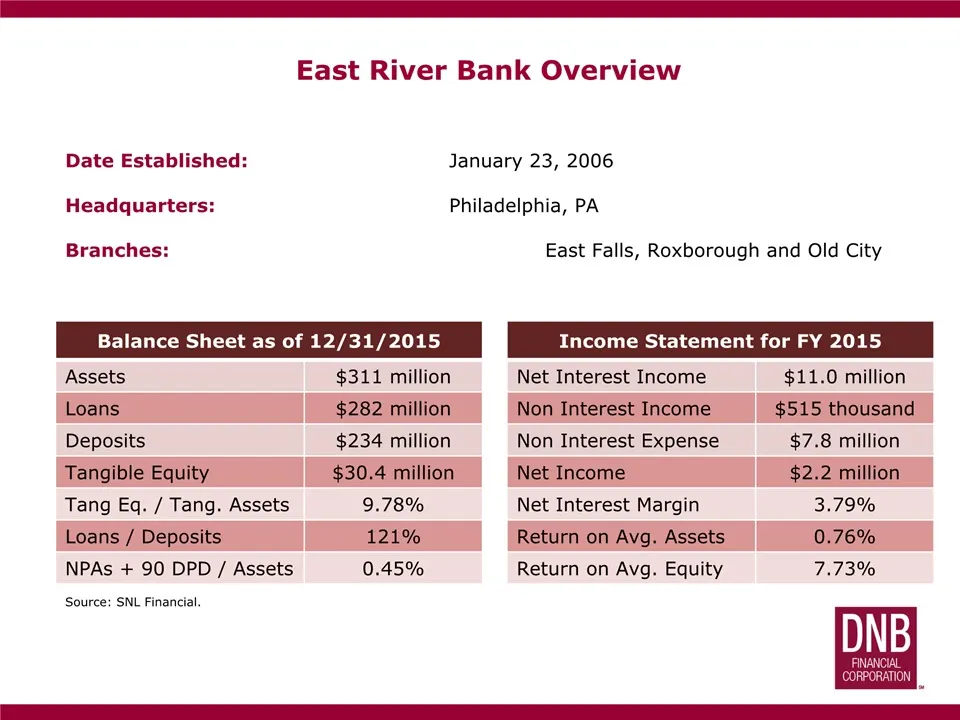
East River Bank Overview Date Established: January 23, 2006Headquarters: Philadelphia, PABranches: East Falls, Roxborough and Old City Balance Sheet as of 12/31/2015 Assets $311 million Loans $282 million Deposits $234 million Tangible Equity $30.4 million Tang Eq. / Tang. Assets 9.78% Loans / Depos
Slide 25: Excellent Asset Growth
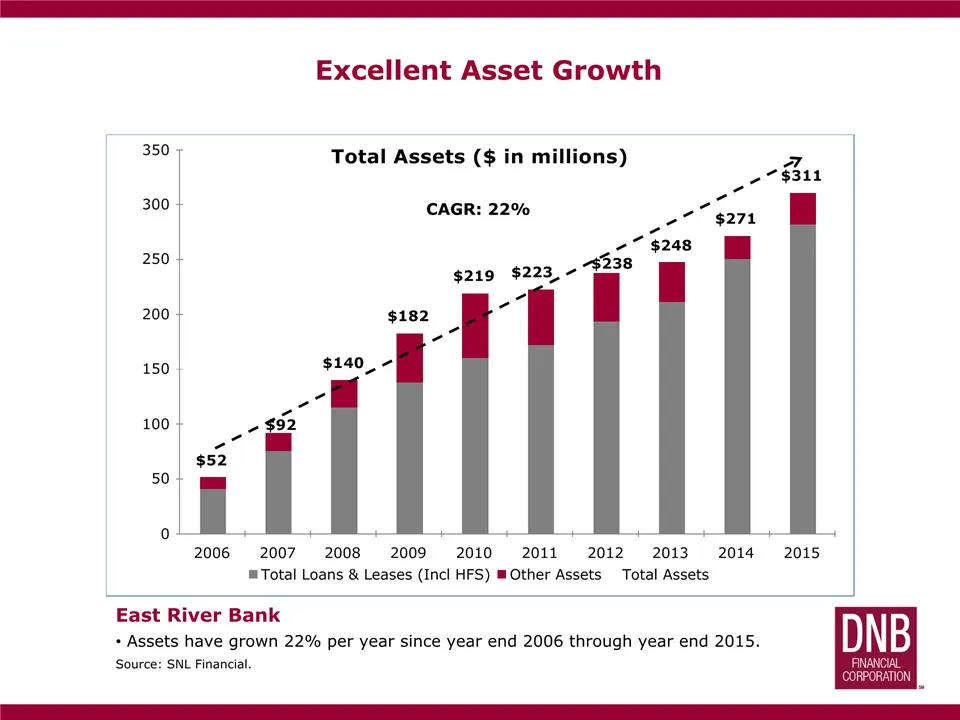
Excellent Asset Growth CAGR: 22% East River Bank Assets have grown 22% per year since year end 2006 through year end 2015.Source: SNL Financial.
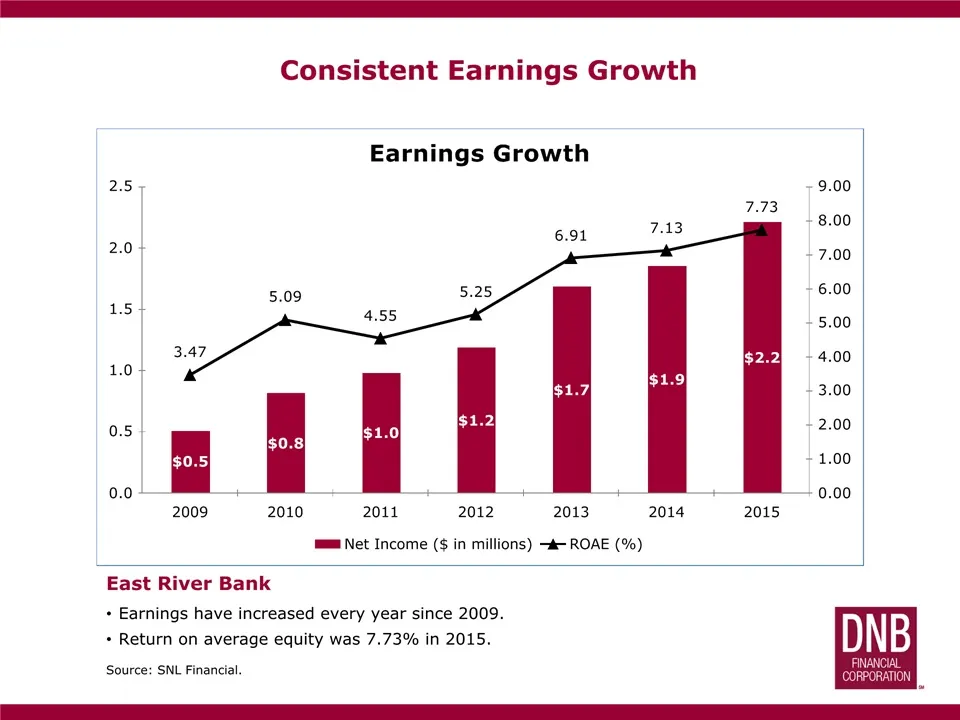
Slide 26: Consistent Earnings Growth
Consistent Earnings Growth East River Bank Earnings have increased every year since 2009.Return on average equity was 7.73% in 2015.Source: SNL Financial.
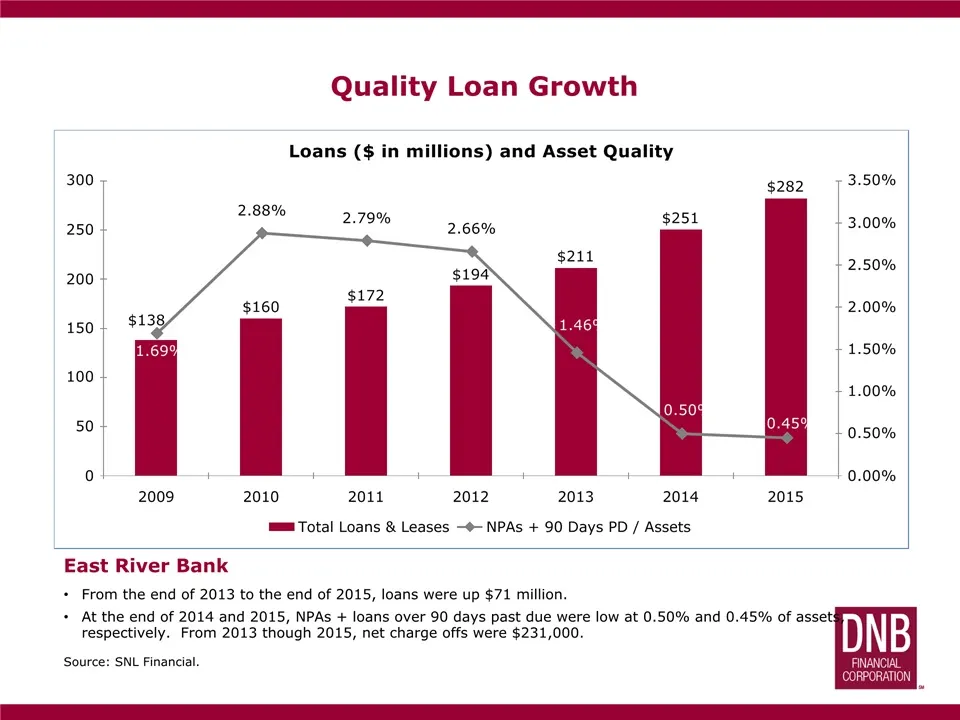
Slide 27: Quality Loan Growth
Quality Loan Growth From the end of 2013 to the end of 2015, loans were up $71 million.At the end of 2014 and 2015, NPAs + loans over 90 days past due were low at 0.50% and 0.45% of assets, respectively. From 2013 though 2015, net charge offs were $231,000.Source: SNL Financial. East River Bank
Slide 28: The Merger
The Merger
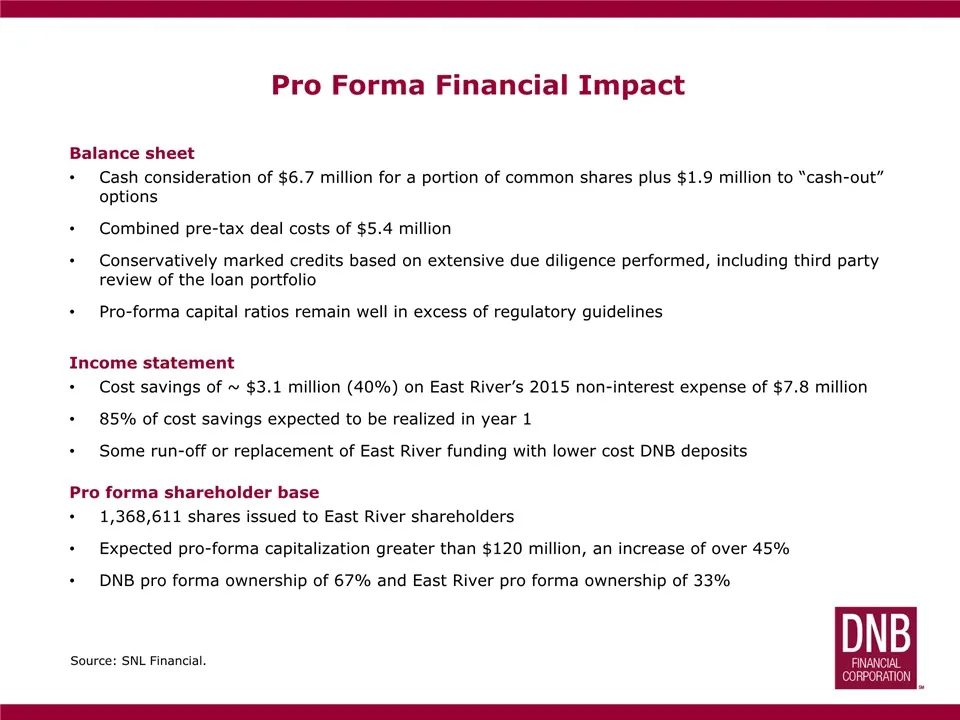
Slide 29: Pro Forma Financial Impact
Pro Forma Financial Impact Balance sheetCash consideration of $6.7 million for a portion of common shares plus $1.9 million to “cash-out” optionsCombined pre-tax deal costs of $5.4 millionConservatively marked credits based on extensive due diligence performed, including third party review of the lo
Slide 30: Earnings and Tangible Book Impact
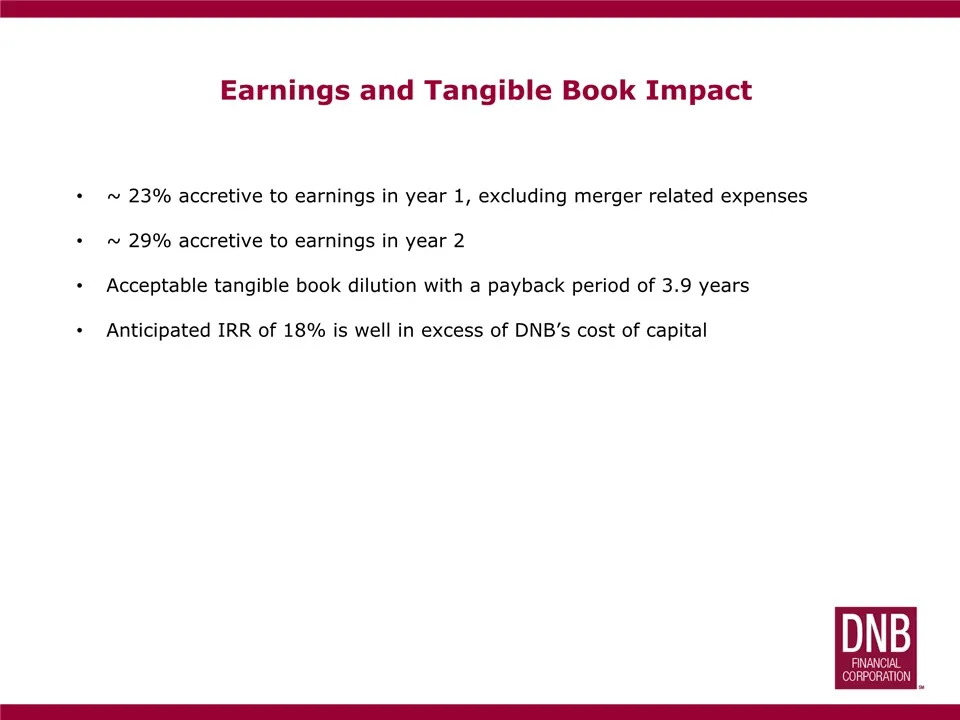
Earnings and Tangible Book Impact ~ 23% accretive to earnings in year 1, excluding merger related expenses~ 29% accretive to earnings in year 2Acceptable tangible book dilution with a payback period of 3.9 yearsAnticipated IRR of 18% is well in excess of DNB’s cost of capital
Slide 31: Contact and Transaction Advisors
Gerald F. Sopp, EVP and CFO(484)-359-3138gsopp@dnbfirst.comhttp://investors.dnbfirst.com/ For more information, Investors may contact: DNB: Ambassador Financial Group, Inc. – Financial Advisor Stradley Ronon Stevens & Young, LLP – Legal CounselEast River: Griffin Financial Group LLC – Financial Advi
Source: SEC EDGAR · 425 filed Apr 27, 2016
More decks from DNB Financial Corporation
 Investor Presentation (August 2018)32 slides · Aug 7, 2018
 Merger or Acquisition (April 2016)23 slides · Apr 5, 2016
 Investor Presentation (September 2015)47 slides · Sep 23, 2015
 Investor Presentation (September 2014)42 slides · Sep 2, 2014
 Investor Presentation (March 2014)59 slides · Mar 5, 2014
 Investor Presentation (August 2013)59 slides · Aug 21, 2013