DNB Financial — Investor Presentation (August 2018)
32 slides from DNB Financial's investor presentation, Aug 7, 2018
Slide 1: DNB Financial Corporation Investor Presentation August 2018
DNB Financial CorporationInvestor PresentationAugust 2018
Slide 2: Disclosures
Disclosures 2 This document contains “forward-looking statements” within the meaning of the Private Securities Litigation Reform Act of 1995. These statements include, but are not limited to, expectations or predictions of future financial or business performance. These forward-looking statements in
Slide 3: Non-GAAP financial measures disclosure
3 This investor presentation contains non-GAAP financial measures calculated using non-GAAP amounts. These measures are tangible book value per common share, return on average tangible equity and tangible equity to tangible assets. Tangible book value per share adjusts the numerator by the amount of
Slide 4: About DNB Financial Corporation
About:DNB Financial Corporation 4
Slide 5: DNB Financial Corporation Profile
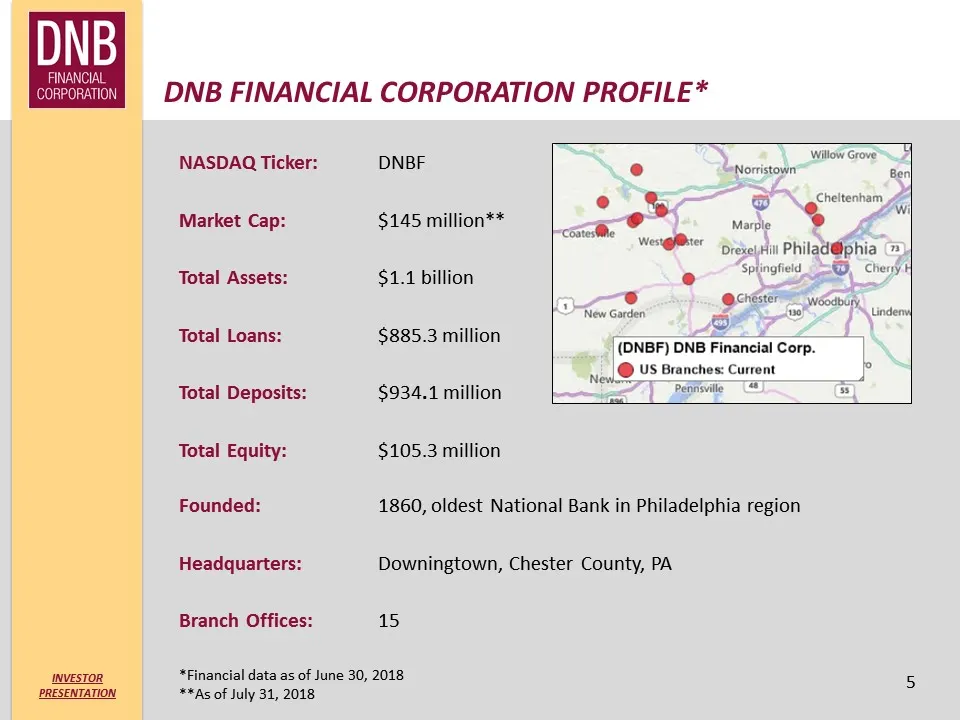
DNB Financial Corporation Profile* 5 NASDAQ Ticker: DNBFMarket Cap: $145 million**Total Assets: $1.1 billionTotal Loans: $885.3 millionTotal Deposits: $934.1 millionTotal Equity: $105.3 million Founded: 1860, oldest National Bank in Philadelphia regionHeadquarters: Downingtown, Chester County, PABra
Slide 6: Investment Thesis
Investment Thesis Affluent southeastern Pennsylvania marketsHeadquartered in fast-growing Chester County with ability to grow organically and via acquisitionEnviable deposit franchiseCore deposits are 78% and noninterest-bearing deposits are 19% of total customer depositsConservative operating and r
Slide 7: Strategic Objectives
STRATEGIC OBJECTIVES Emphasize long-term shareholder value through consistent earnings growth with superior credit qualityGain market share and continue to attract stable core depositsGenerate prudent commercial loan growth Grow and diversify fee-based businessesPursue selective bank & non-bank M&A
Slide 8: East River Bank Acquisition
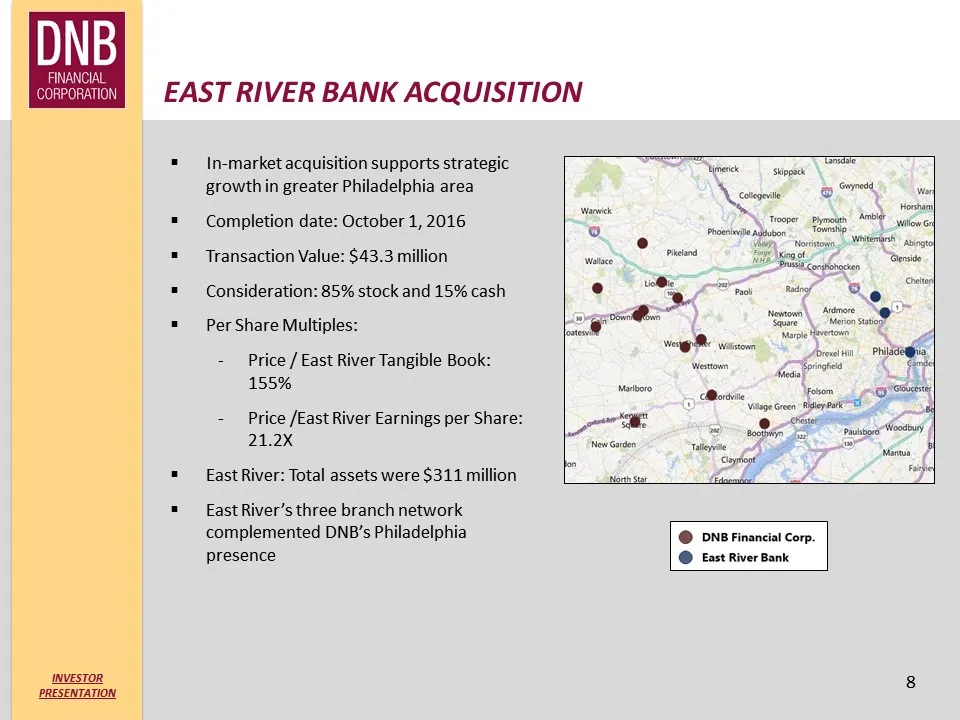
East River Bank Acquisition 8 In-market acquisition supports strategic growth in greater Philadelphia areaCompletion date: October 1, 2016Transaction Value: $43.3 millionConsideration: 85% stock and 15% cashPer Share Multiples:Price / East River Tangible Book: 155%Price /East River Earnings per Shar
Slide 9: Delivering Value for Our Shareholders
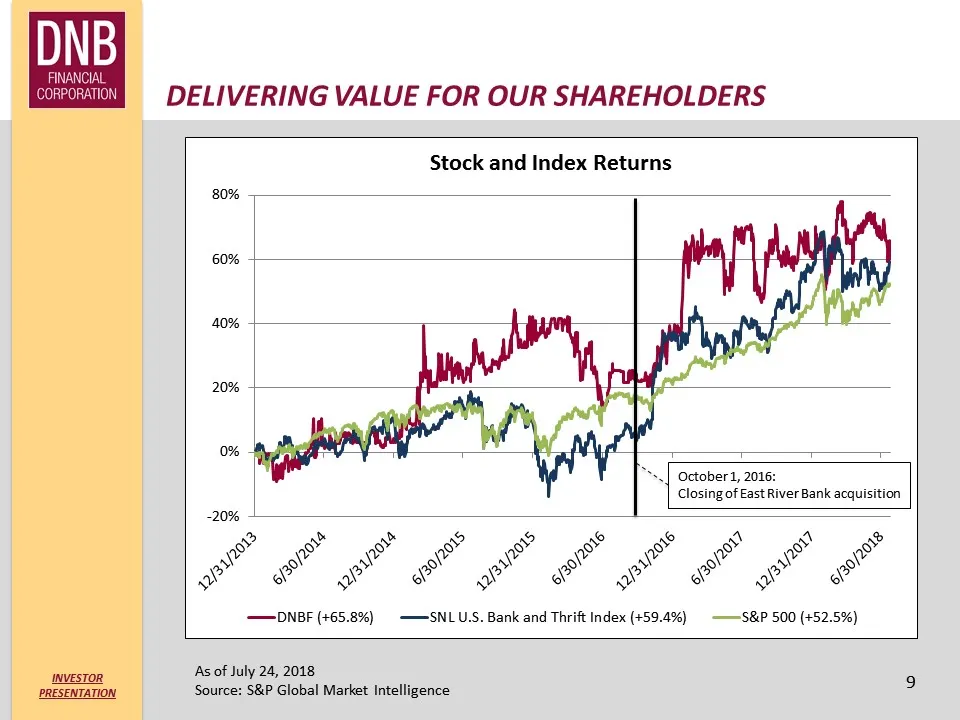
DELIVERING value FOR OUR SHAREHOLDERS 9 As of July 24, 2018Source: S&P Global Market Intelligence October 1, 2016:Closing of East River Bank acquisition
Slide 10: Established Southeastern PA Footprint
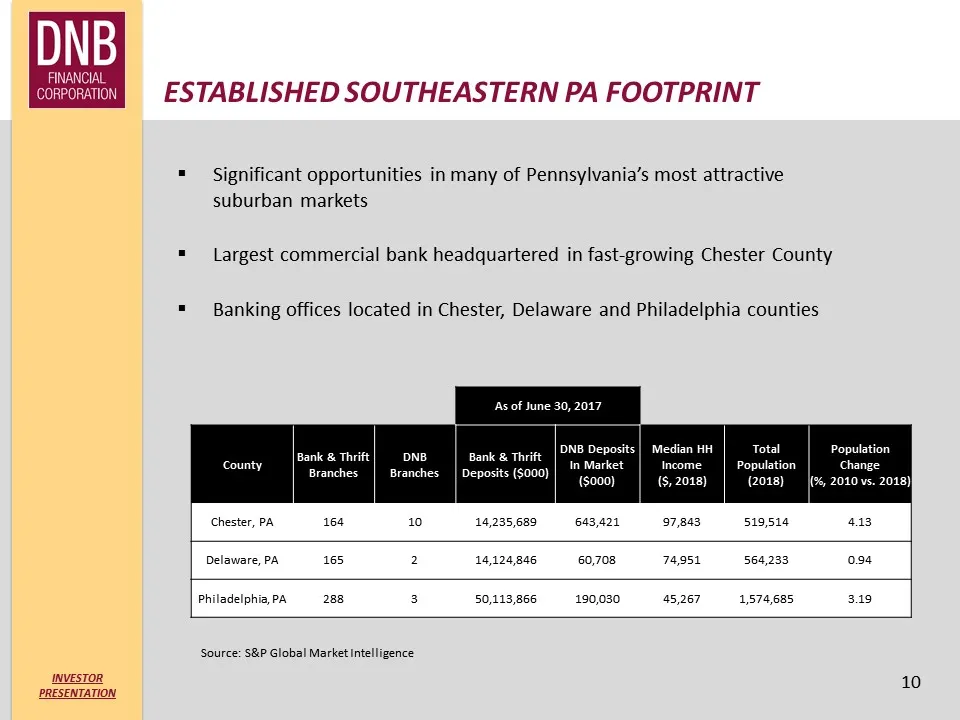
Established SOUTHEASTERN PA Footprint 10 Significant opportunities in many of Pennsylvania’s most attractive suburban marketsLargest commercial bank headquartered in fast-growing Chester CountyBanking offices located in Chester, Delaware and Philadelphia counties As of June 30, 2017 County Bank & Th
Slide 11: Chester County Dynamics
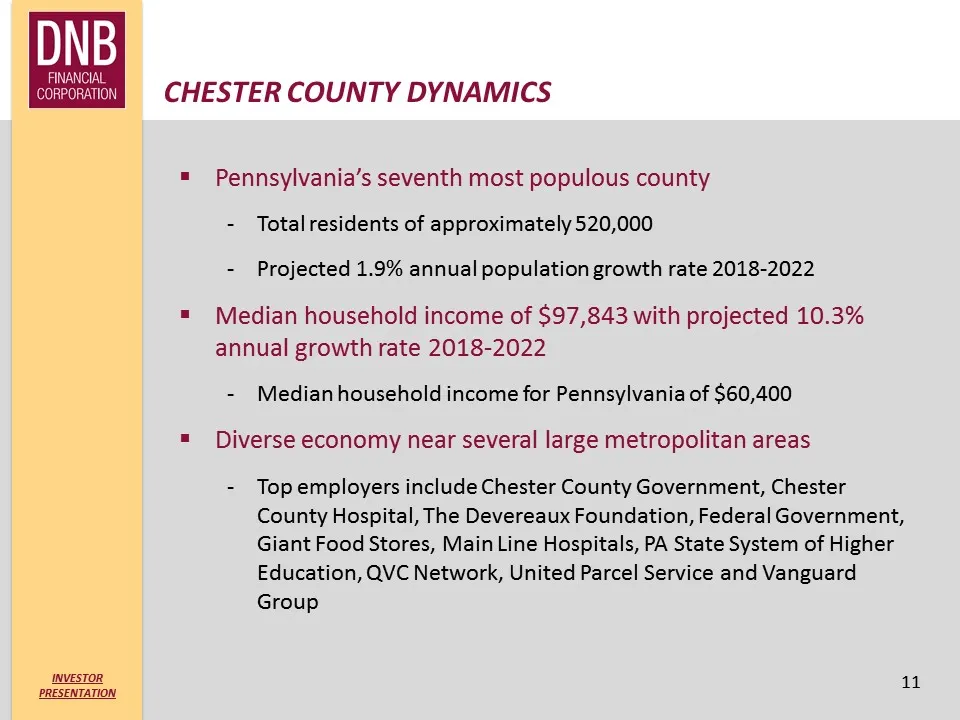
Chester County Dynamics 11 Pennsylvania’s seventh most populous countyTotal residents of approximately 520,000Projected 1.9% annual population growth rate 2018-2022Median household income of $97,843 with projected 10.3% annual growth rate 2018-2022Median household income for Pennsylvania of $60,400D
Slide 12: Delaware & Philadelphia Counties Dynamics
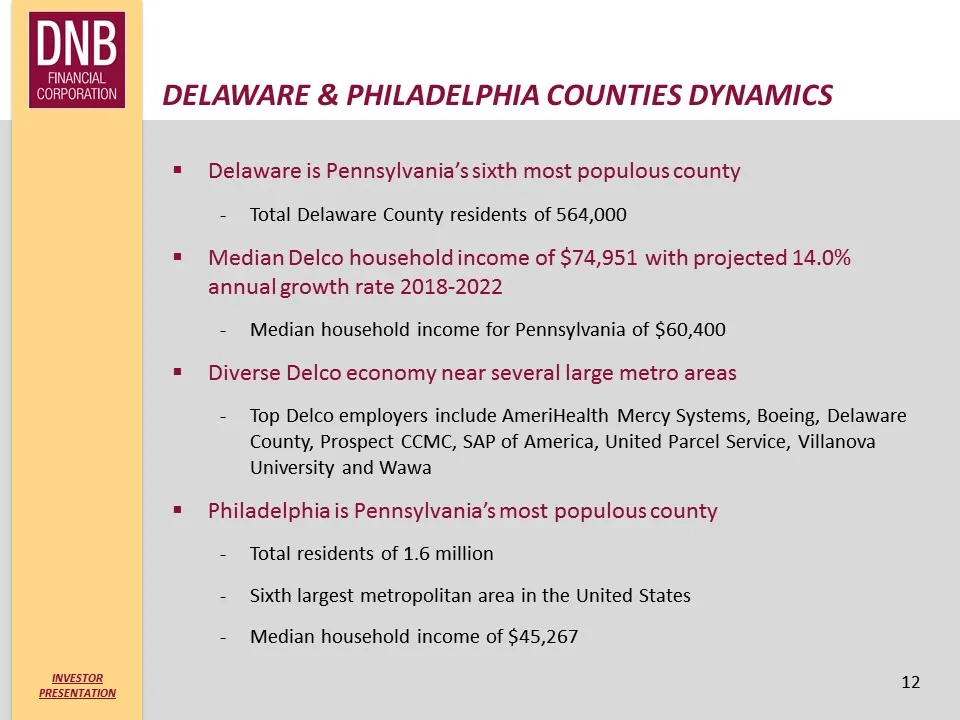
Delaware & Philadelphia Counties Dynamics Delaware is Pennsylvania’s sixth most populous countyTotal Delaware County residents of 564,000Median Delco household income of $74,951 with projected 14.0% annual growth rate 2018-2022Median household income for Pennsylvania of $60,400Diverse Delco economy
Slide 13: Financial Highlights
Financial Highlights 13
Slide 14: Selected Financial Data
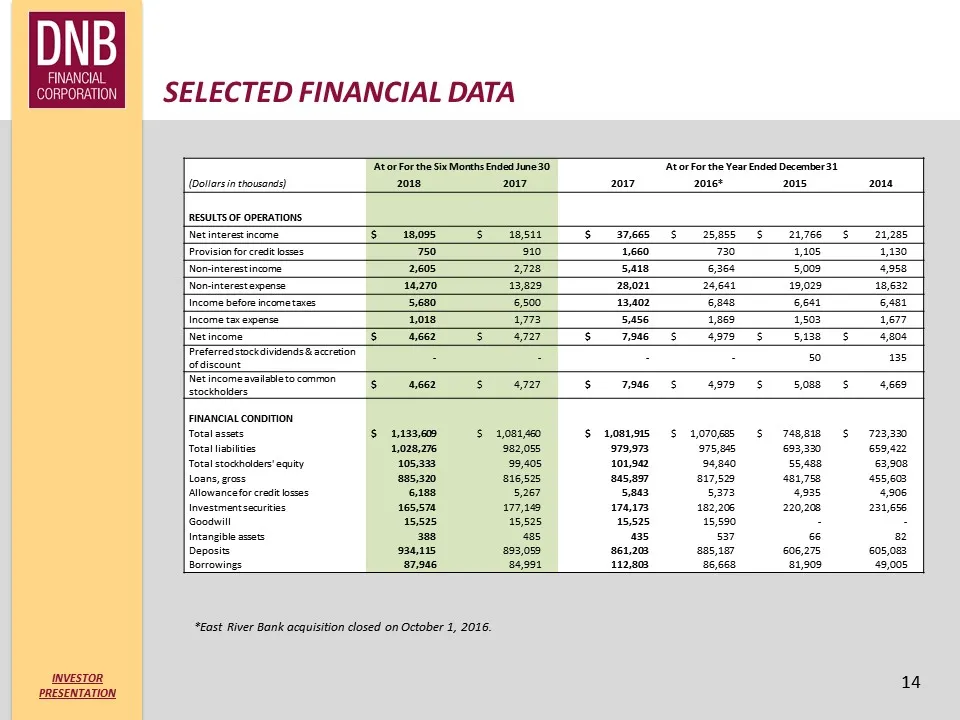
selected financial Data 14 At or For the Six Months Ended June 30 At or For the Year Ended December 31 (Dollars in thousands) 2018 2017 2017 2016* 2015 2014 RESULTS OF OPERATIONS Net interest income $ 18,095 $ 18,511 $ 37,665 $ 25,855 $ 21,766 $ 21,285 Provision for credit losses 750 910 1,660 730 1
Slide 15: Second Quarter 2018 Highlights
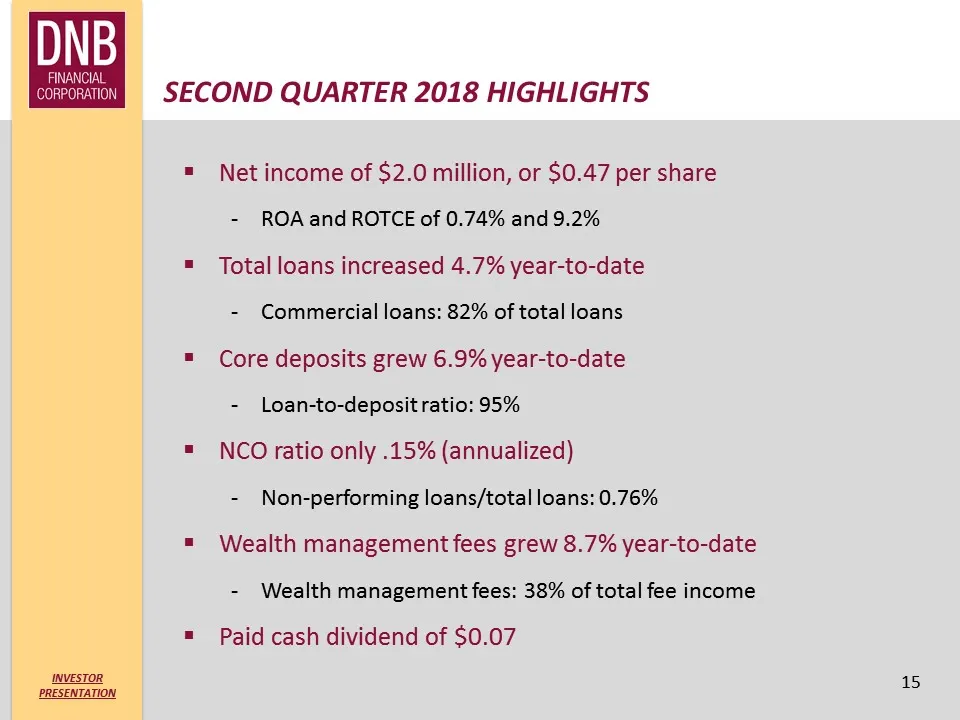
Second Quarter 2018 HIghlights 15 Net income of $2.0 million, or $0.47 per shareROA and ROTCE of 0.74% and 9.2%Total loans increased 4.7% year-to-dateCommercial loans: 82% of total loansCore deposits grew 6.9% year-to-dateLoan-to-deposit ratio: 95%NCO ratio only .15% (annualized) Non-performing loan
Slide 16: Deposit Mix
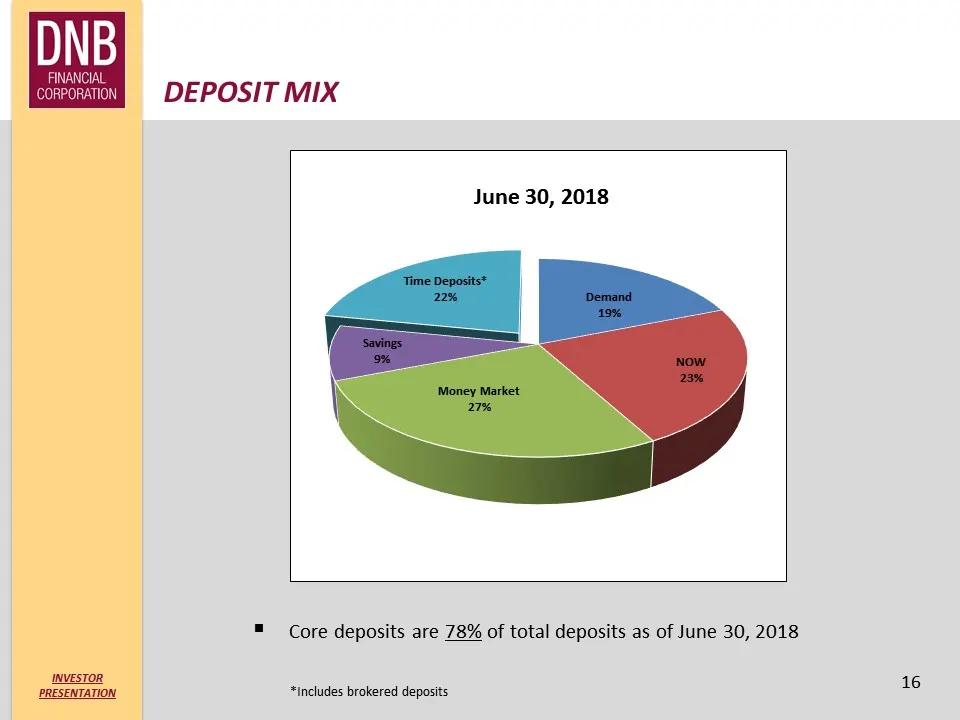
DEPOSIT MIX 16 *Includes brokered deposits Core deposits are 78% of total deposits as of June 30, 2018
Slide 17: Loan Mix
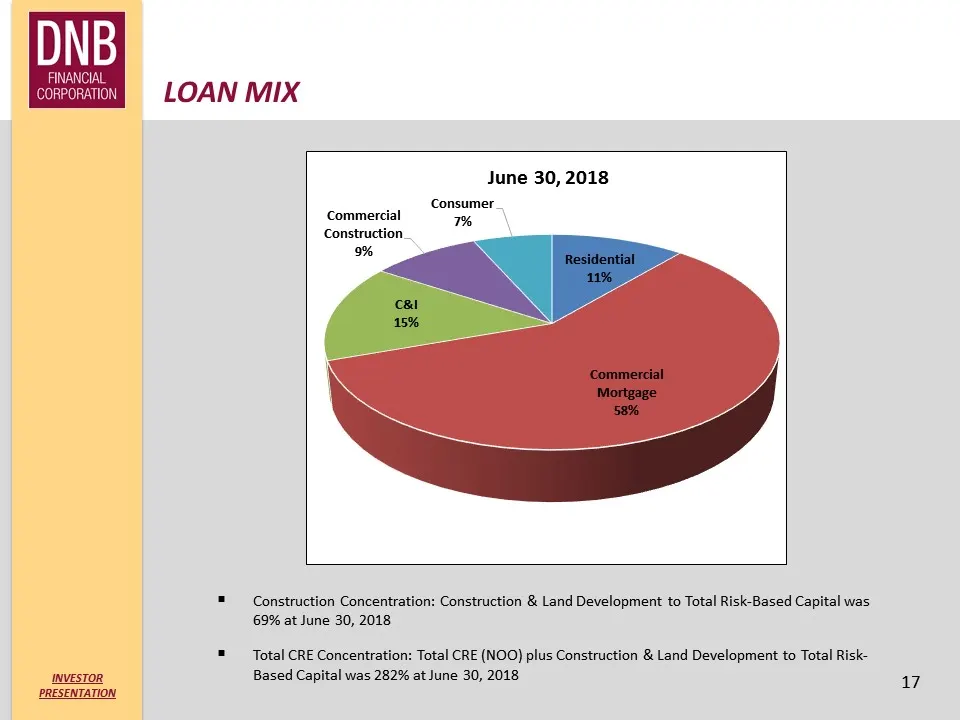
Loan MIX 17 Construction Concentration: Construction & Land Development to Total Risk-Based Capital was 69% at June 30, 2018 Total CRE Concentration: Total CRE (NOO) plus Construction & Land Development to Total Risk-Based Capital was 282% at June 30, 2018
Slide 18: Generating Attractive Returns
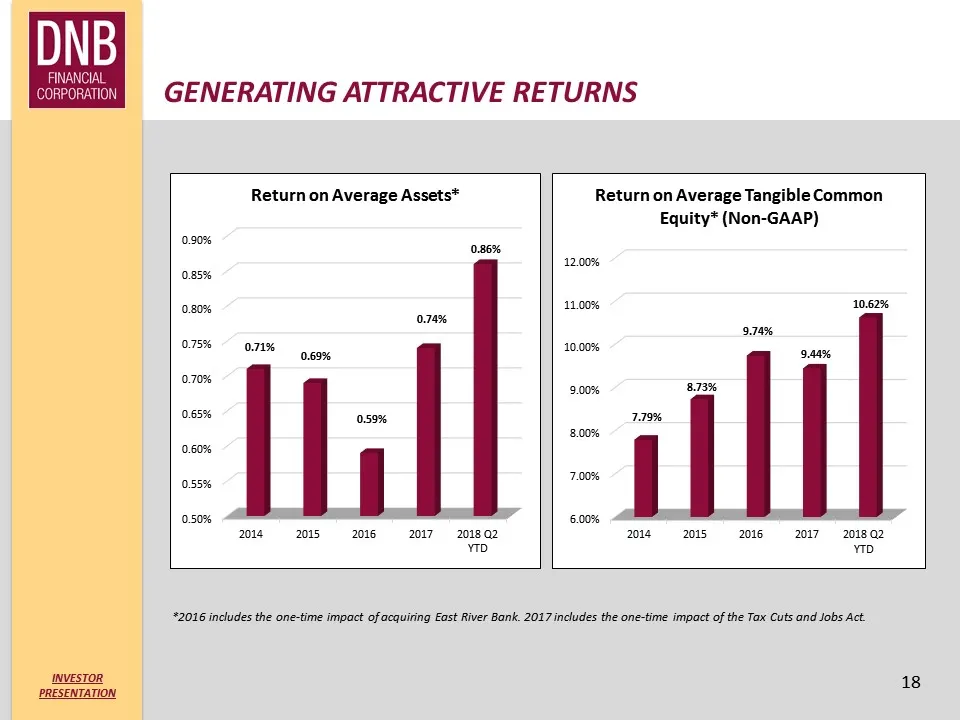
Generating attractive returns 18 *2016 includes the one-time impact of acquiring East River Bank. 2017 includes the one-time impact of the Tax Cuts and Jobs Act.
Slide 19: Performance Ratios
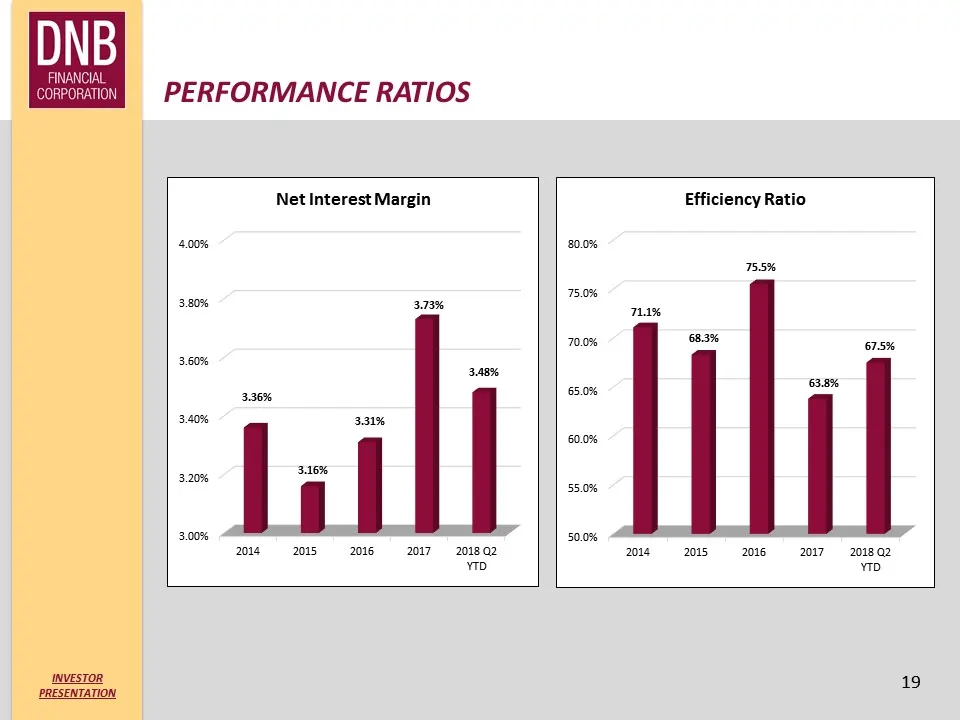
PERFORMANCE RATIOS Net Interest Margin 4.00% 80.0% 735% 75.0% 3.8056 70.0% 3.6056 65.0% 3.4056 3.2056 55.0% 3.00% 50.0% 2s = 201520162017 201802 20 = 2015S 2016. = 2017201802 vo yD 19
Slide 20: Conservative Credit Culture
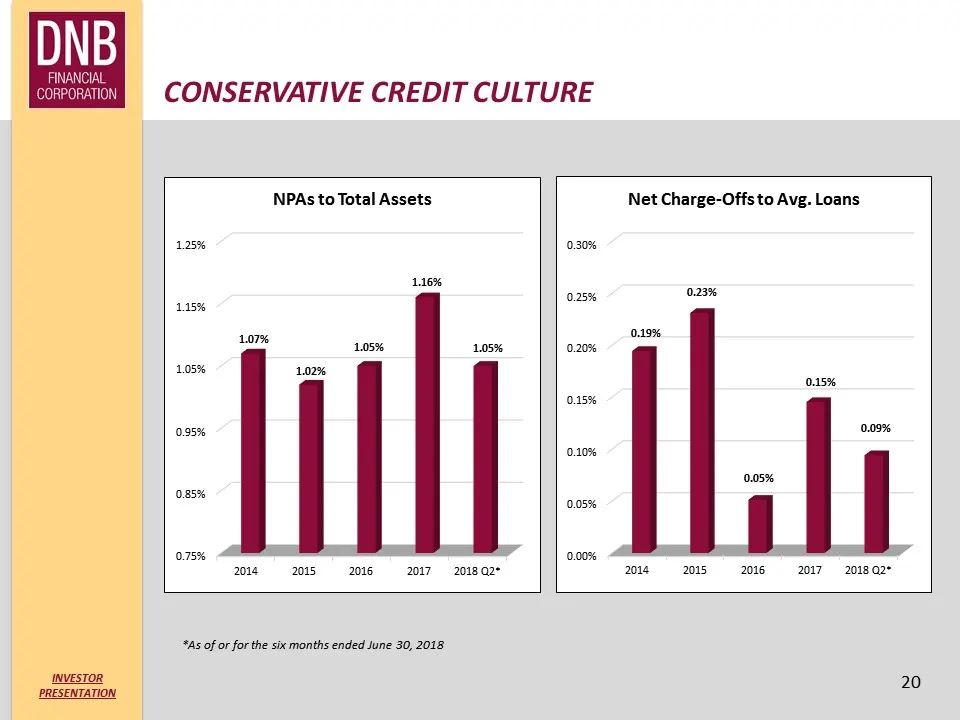
Conservative credit culture 20 *As of or for the six months ended June 30, 2018
Slide 21: Conservative Credit Culture
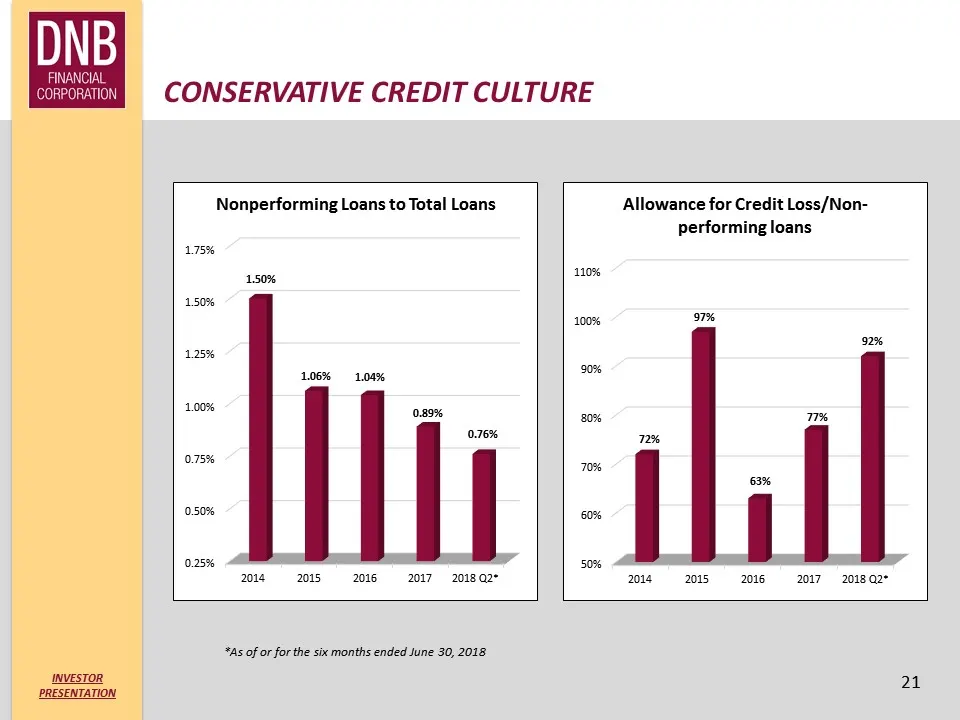
Conservative credit culture 21 *As of or for the six months ended June 30, 2018
Slide 22: Strong Capital Position
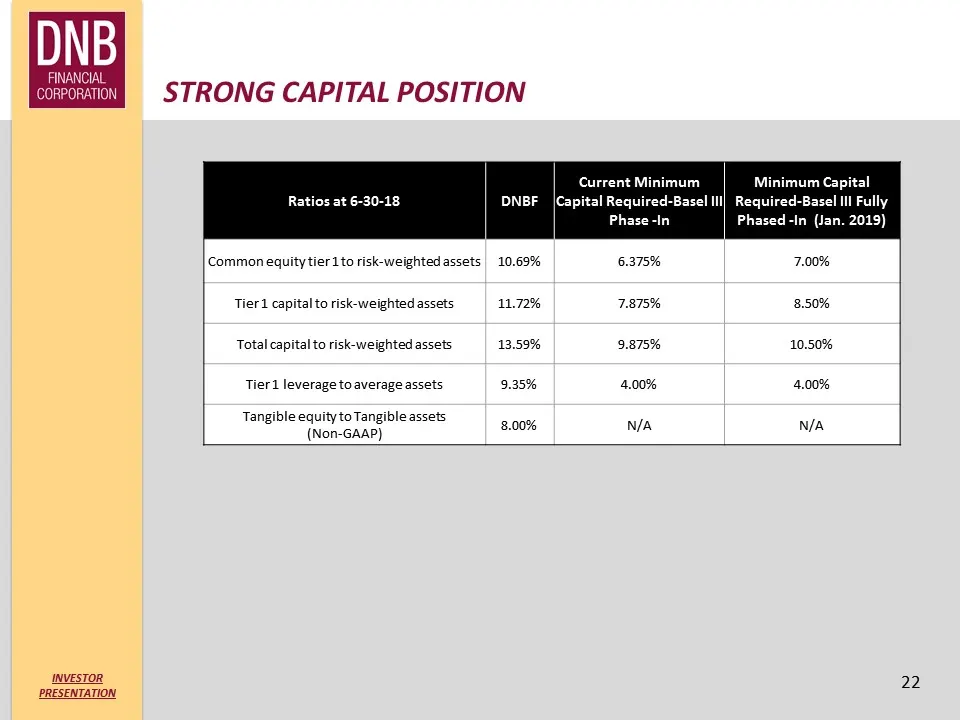
STRONG CAPITAL POSITION 22 Ratios at 6-30-18 DNBF Current Minimum Capital Required-Basel III Phase -In Minimum Capital Required-Basel III Fully Phased -In (Jan. 2019) Common equity tier 1 to risk-weighted assets 10.69% 6.375% 7.00% Tier 1 capital to risk-weighted assets 11.72% 7.875% 8.50% Total cap
Slide 23: Earnings & Per Share Data
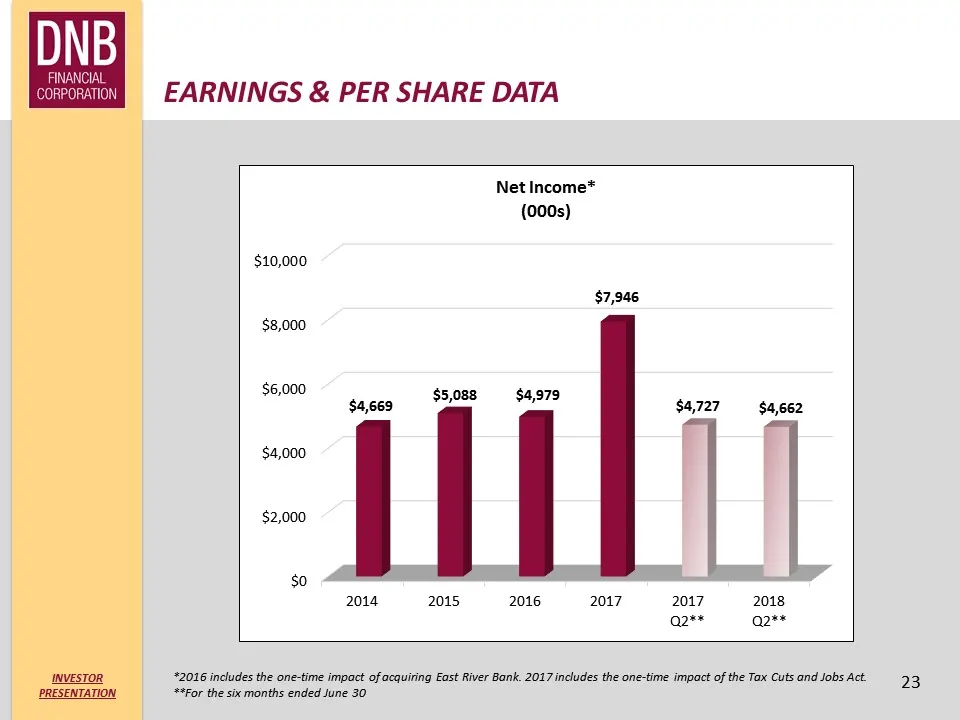
EARNINGS & PER SHARE DATA 23 *2016 includes the one-time impact of acquiring East River Bank. 2017 includes the one-time impact of the Tax Cuts and Jobs Act. **For the six months ended June 30
Slide 24: Earnings & Per Share Data
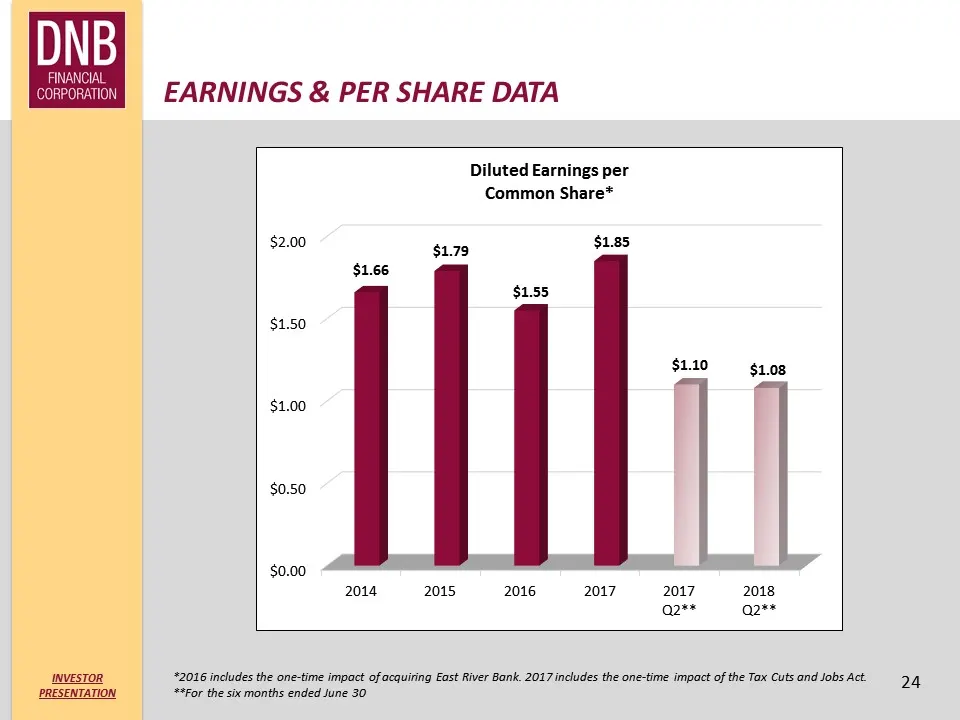
EARNINGS & PER SHARE DATA 24 *2016 includes the one-time impact of acquiring East River Bank. 2017 includes the one-time impact of the Tax Cuts and Jobs Act. **For the six months ended June 30
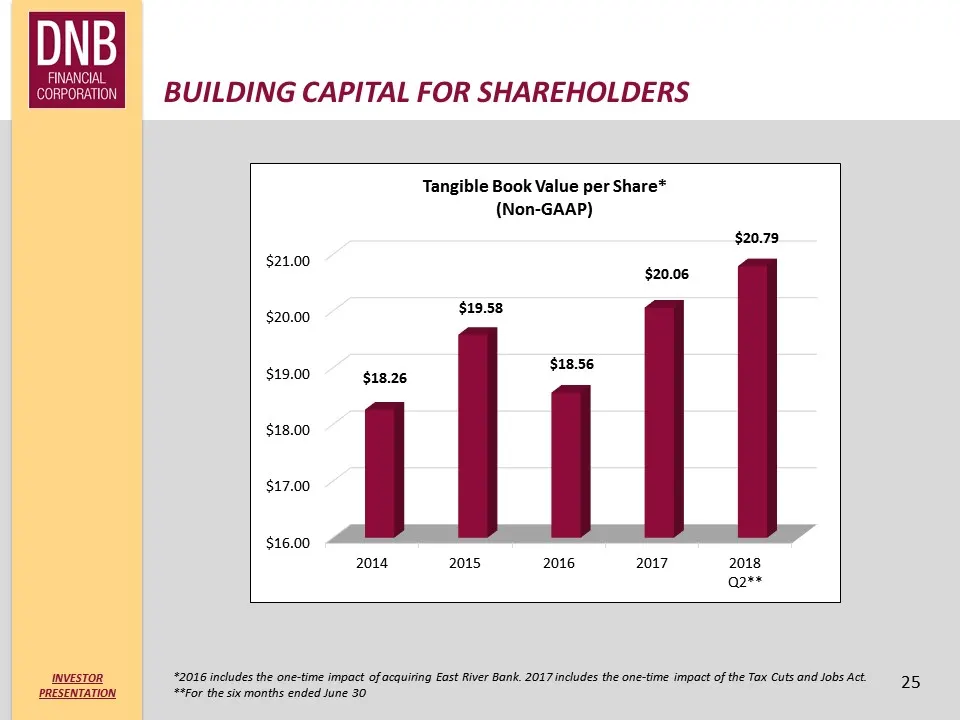
Slide 25: Building Capital for Shareholders
BUILDING CAPITAL FOR SHAREHOLDERS 25 *2016 includes the one-time impact of acquiring East River Bank. 2017 includes the one-time impact of the Tax Cuts and Jobs Act. **For the six months ended June 30
Slide 26: Appendix
appendix 26
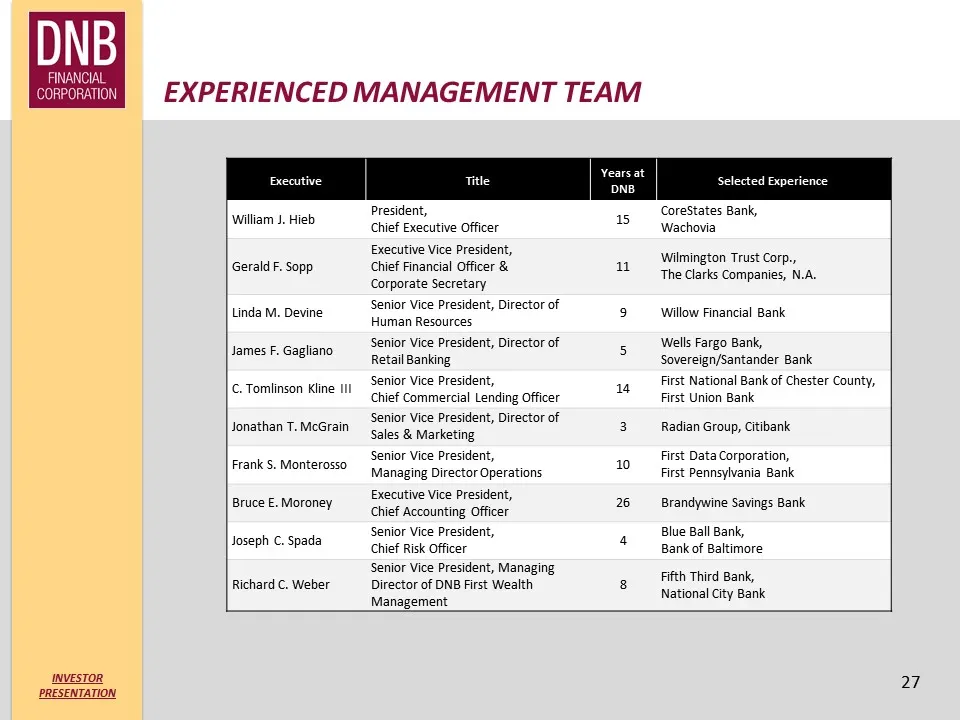
Slide 27: Experienced Management Team
experienced MANAGEMENT Team 27 Executive Title Years at DNB Selected Experience William J. Hieb President, Chief Executive Officer 15 CoreStates Bank,Wachovia Gerald F. Sopp Executive Vice President, Chief Financial Officer & Corporate Secretary 11 Wilmington Trust Corp.,The Clarks Companies, N.A. L
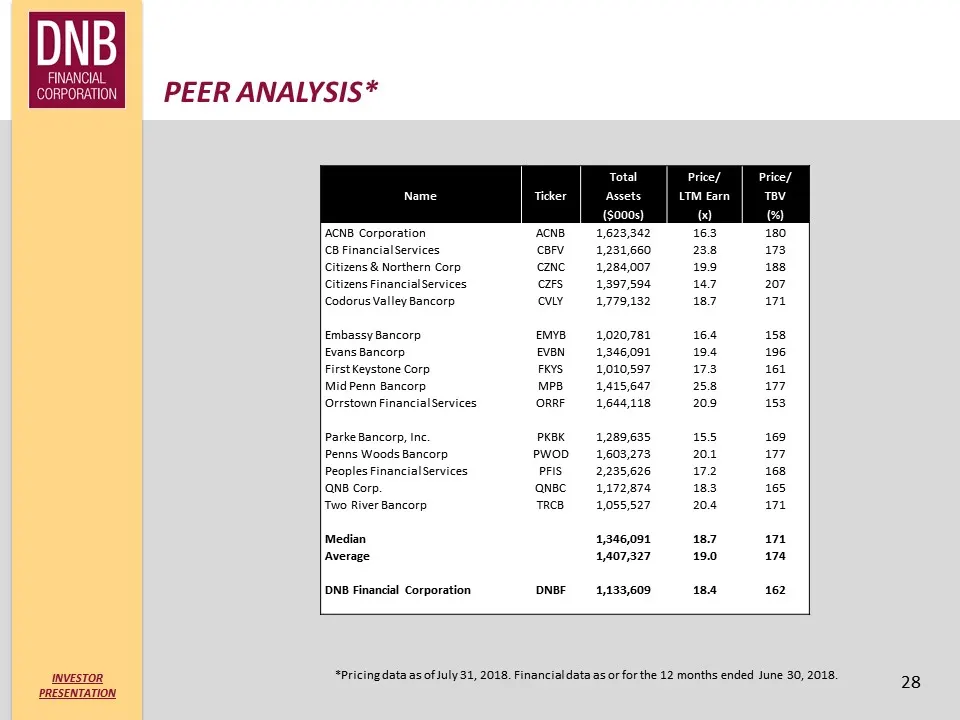
Slide 28: Peer Analysis
Peer Analysis* 28 Total Price/ Price/ Name Ticker Assets LTM Earn TBV ($000s) (x) (%) ACNB Corporation ACNB 1,623,342 16.3 180 CB Financial Services CBFV 1,231,660 23.8 173 Citizens & Northern Corp CZNC 1,284,007 19.9 188 Citizens Financial Services CZFS 1,397,594 14.7 207 Codorus Valley Bancorp CVL
Slide 29: Digital Driven Platform
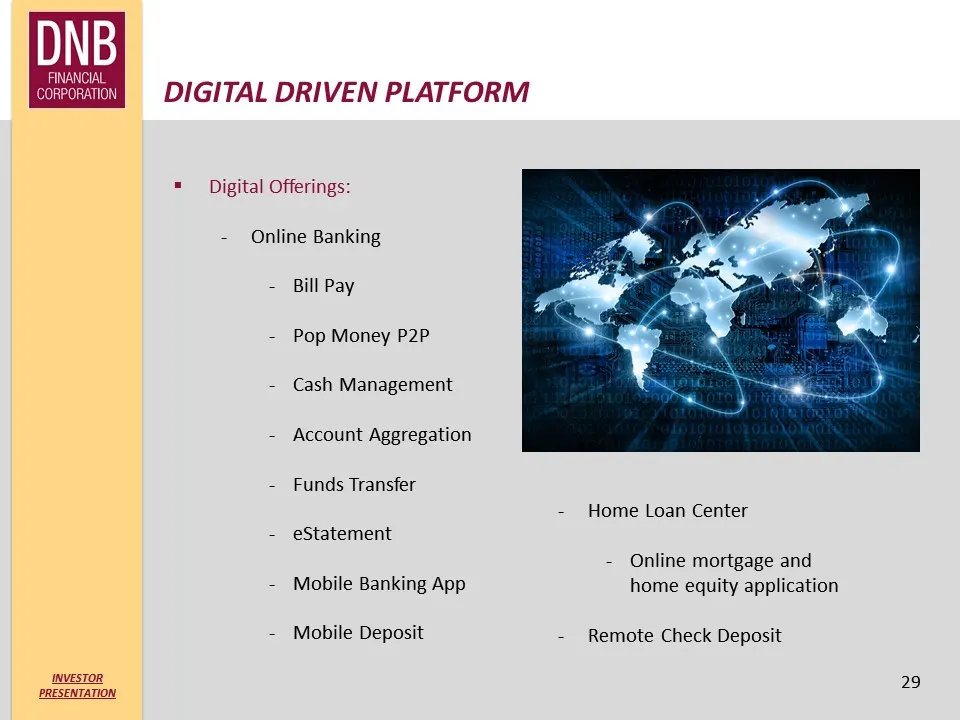
DIGITAL Driven PLATFORM 29 Digital Offerings:Online BankingBill PayPop Money P2PCash ManagementAccount AggregationFunds TransfereStatementMobile Banking AppMobile Deposit Home Loan CenterOnline mortgage and home equity applicationRemote Check Deposit
Slide 30: Non-GAAP Reconciliation
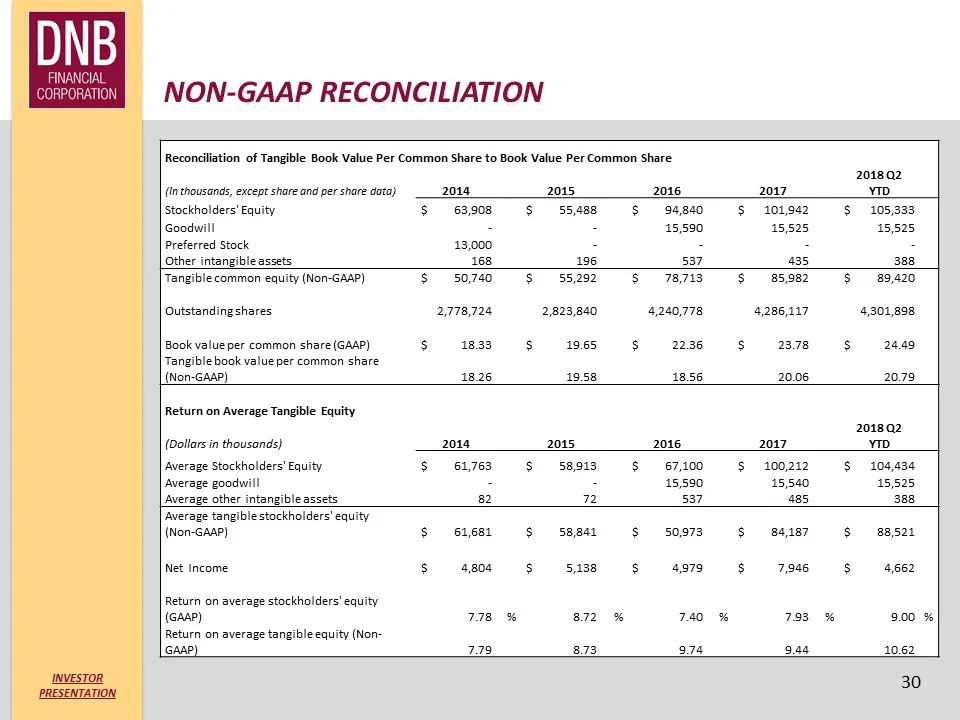
Non-Gaap reconciliation 30 Reconciliation of Tangible Book Value Per Common Share to Book Value Per Common Share (In thousands, except share and per share data) 2014 2015 2016 2017 2018 Q2 YTD Stockholders' Equity $ 63,908 $ 55,488 $ 94,840 $ 101,942 $ 105,333 Goodwill - - 15,590 15,525 15,525 Prefe
Slide 31: Non-GAAP Reconciliation
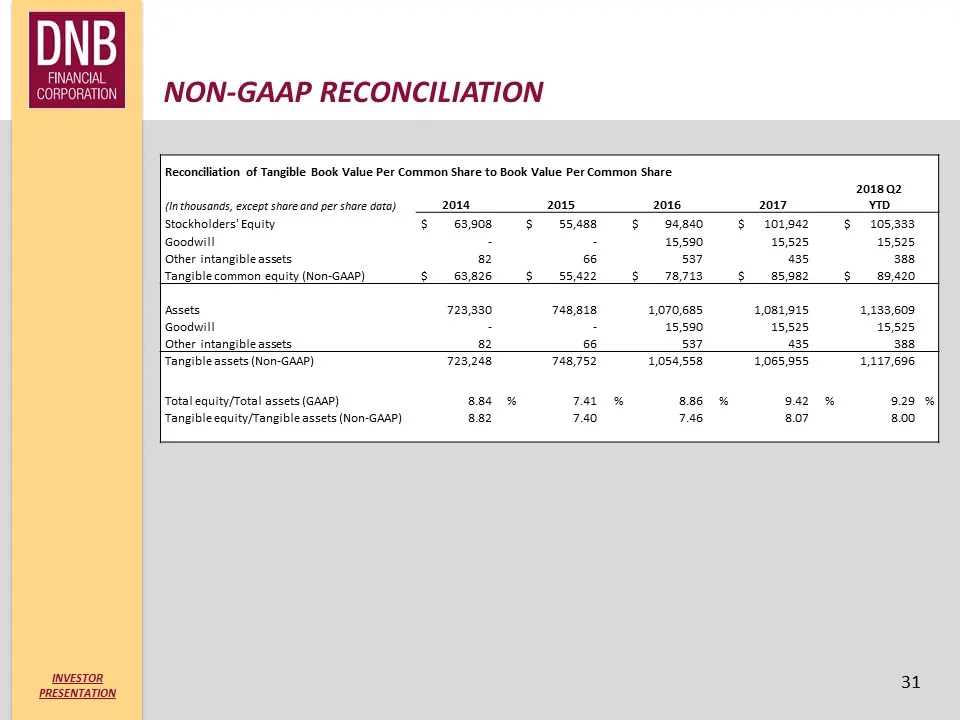
Non-Gaap reconciliation 31 Reconciliation of Tangible Book Value Per Common Share to Book Value Per Common Share (In thousands, except share and per share data) 2014 2015 2016 2017 2018 Q2 YTD Stockholders' Equity $ 63,908 $ 55,488 $ 94,840 $ 101,942 $ 105,333 Goodwill - - 15,590 15,525 15,525 Other
Slide 32: Investor Relations Contact
INVESTOR RELATIONS CONTACT 32 Gerald F. Sopp, EVP and CFO484.359.3138gsopp@dnbfirst.comhttp://investors.dnbfirst.com/ For more information, Investors may contact:
Source: SEC EDGAR · 8-K filed Aug 7, 2018
More decks from DNB Financial Corporation
 Shareholder Meeting (April 2016)31 slides · Apr 27, 2016
 Merger or Acquisition (April 2016)23 slides · Apr 5, 2016
 Investor Presentation (September 2015)47 slides · Sep 23, 2015
 Investor Presentation (September 2014)42 slides · Sep 2, 2014
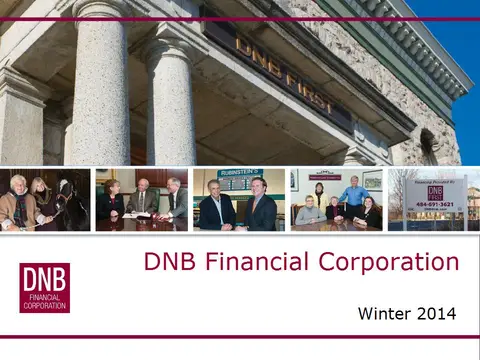 Investor Presentation (March 2014)59 slides · Mar 5, 2014
 Investor Presentation (August 2013)59 slides · Aug 21, 2013