DNB Financial — Investor Presentation (March 2014)
59 slides from DNB Financial's investor presentation, Mar 5, 2014
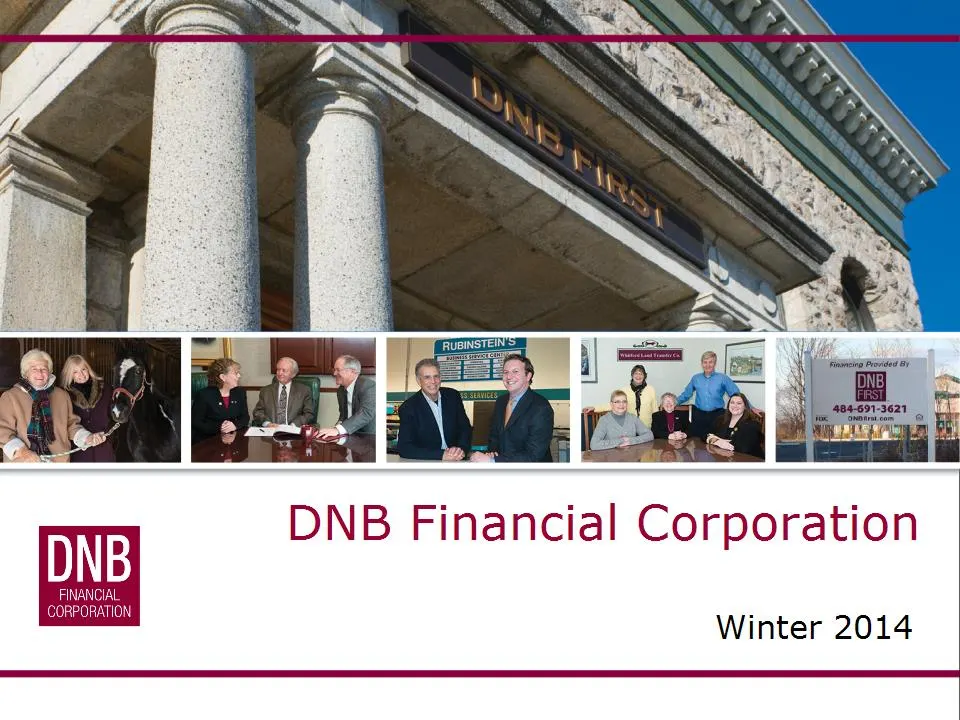
Slide 1: Investor Overview Presentation
Investor Overview Presentation
Slide 2: Forward-looking statements
Forward-looking statements: Certain statements contained in this presentation are forward-looking in nature. These include all statements about DNB's plans, objectives, expectations and other statements that are not historical facts, and usually use words such as "expect," "anticipate," "believe" an
Slide 3: Table of Contents
I. Corporate Overview/Compelling Investment Opportunity (Pages 4-9) II. Strong Market Drives Opportunity (Pages 10-21) III. Consistent Performance, Stable Growth & Financial Trends (Pages 22-38) IV. The Differentiators: Operationally Unique (Pages 39-43) V. Experienced Management and Board Leadershi
Slide 4: Corporate Overview
CORPORATE OVERVIEW Founded: 1860, The oldest National Bank in the greater Philadelphia Region Headquarters: Downingtown, Chester County, Pennsylvania NASDAQ Ticker: DNBF Total Assets: $661 million Deposits: $559 million Total Equity: $59 million Branch Offices: 13 Share Price: $20.75 Market Cap: $57
Slide 5: Compelling Investment Opportunity
COMPELLING INVESTMENT OPPORTUNITY Snapshot December 31, 2013 • High quality footprint in affluent Chester and Delaware Counties, Pennsylvania • Book value per share has grown from $16.08 in 4Q 2012 to $16.55 in 4Q 2013 • High level of low cost core deposits - Cost of Deposits - .29% • Increasing mom
Slide 6: Compelling Investment Opportunity
COMPELLING INVESTMENT OPPORTUNITY • Serving growing, diversified and affluent markets in Chester and Delaware Counties, Pennsylvania • Well capitalized, highly liquid, with clean, conservative balance sheet • Well positioned to grow to $1 billion-plus in assets • Low-cost core deposits funds lending
Slide 7: Historical Stock Price and Price to Earnings Ratios Compared to Peers
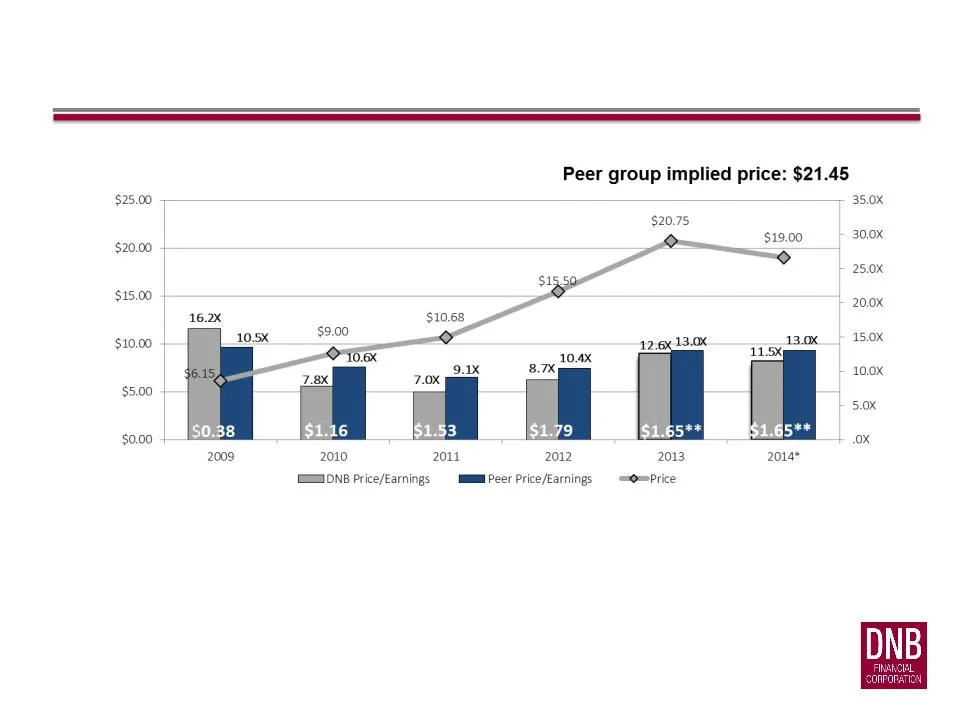
HISTORICAL STOCK PRICE AND PRICE TO EARNINGS RATIOS COMPARED TO PEERS
Slide 8: Historical Stock Price and Price to Tangible Book Ratios Compared to Peers
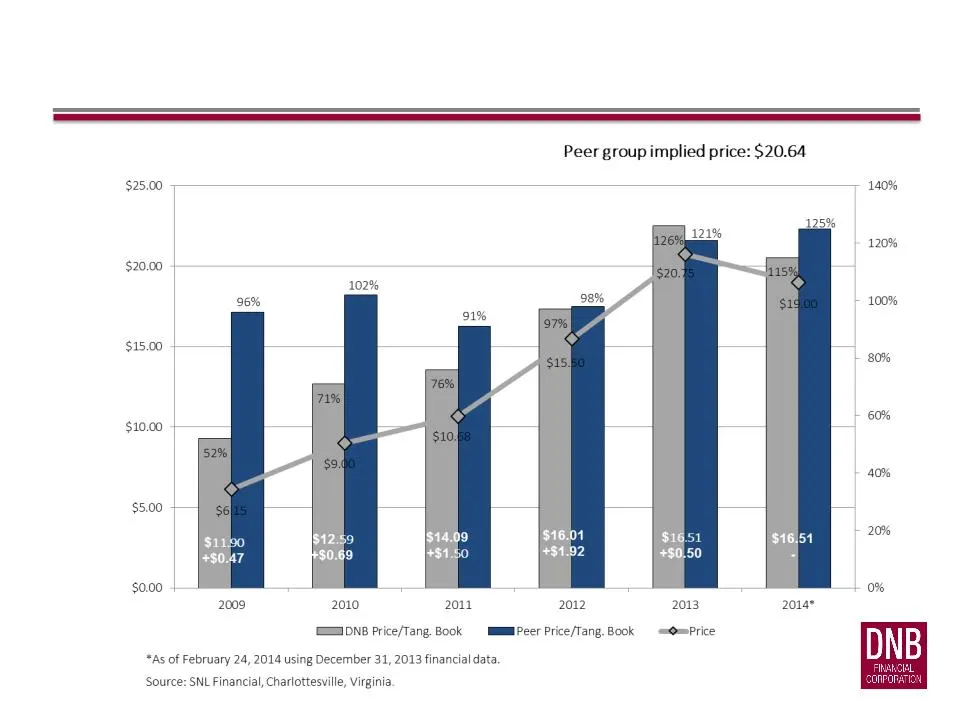
HISTORICAL STOCK PRICE AND PRICE TO TANG. BOOK RATIOS COMPARED TO PEERS
Slide 9: Key Initiatives & Milestones
• Successful balance sheet restructure in early 2010 - ahead of the curve • Purchased Boothwyn, PA branch in June 2012 • Opened Mortgage Banking Unit January 2014 • One of the 19 banks nationwide to be named to KBW Honor Roll for 3 successive years • Increased dividend in first quarter 2013 KEY INIT

Slide 10: Strong Market Drives Opportunity
Strong Market Drives Opportunity
Slide 11: Established Presence in Attractive Southeastern Pennsylvania Market
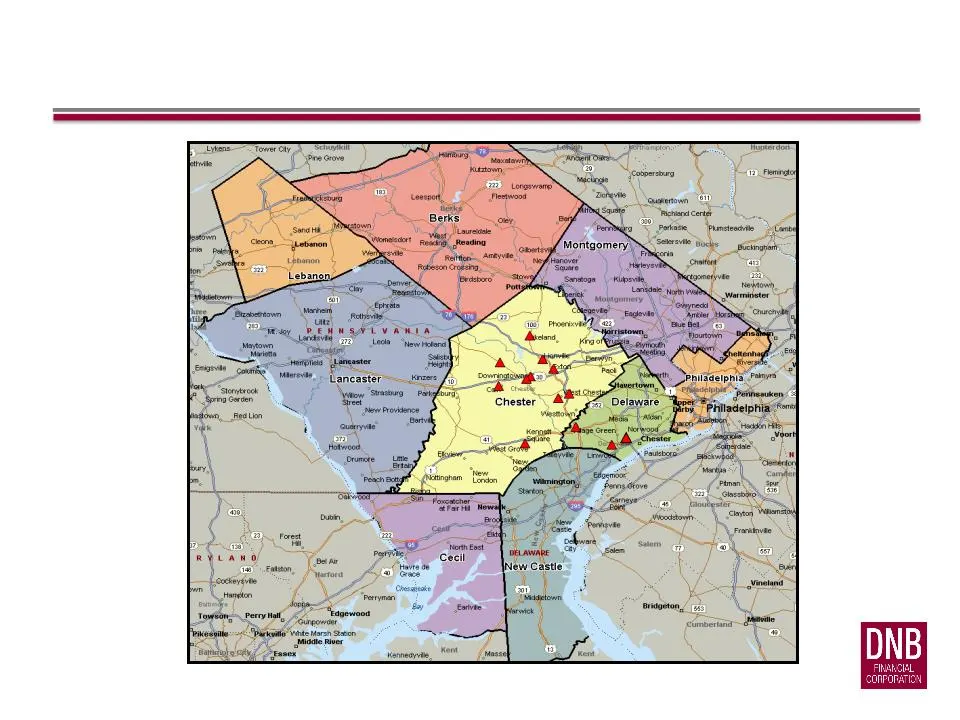
ESTABLISHED PRESENCE IN ATTRACTIVE SOUTHEASTERN PENNSYLVANIA MARKET
Slide 12: Banking Market Overview
County # of Branches Total Deposits in Market ($000) *Total Population 2012 (Actual) *Population Change 2011- 2012 (%) *Projected Population Change 2012- 2017 (%) *Median HH Income 2012 ($) *Projected HH Income Change 2012- 2017 (%) Chester 187 10,919,200 506,575 0.74% 5.33% 86,184 13.27% Delaware 1
Slide 13: Market Overview and Demographics: Chester County
MARKET OVERVIEW AND DEMOGRAPHICS Largest Market: Chester County, PA • Fast Growing: Population 506,575 in 2012, representing an increase of 73,074 from the 2000 Census (2013 data not available) • Best Educated in PA: Of the population 25 years or older, 93% are high school graduates, 48% have a bach
Slide 14: Growing Banking Presence: Delaware County, PA
Growing Banking Presence: Delaware County, PA • Population 561,098 in 2012, representing an increase of 7,689 from the 2000 Census (2013 data not available) • Of the population 25 years or older, 92% are high school graduates, 35% have a bachelor’s degree or higher, and 15% have a graduate or profes
Slide 15: Strategy to Serve Our Markets and Grow
• Continue to attract low cost core deposits • Grow fee revenue as a percentage of total revenues by investing in new business lines, building full client relationships and maximizing significant untapped cross-sell potential • Build relationship banking in retail and commercial while providing a co
Slide 16: DNB vs Competitors
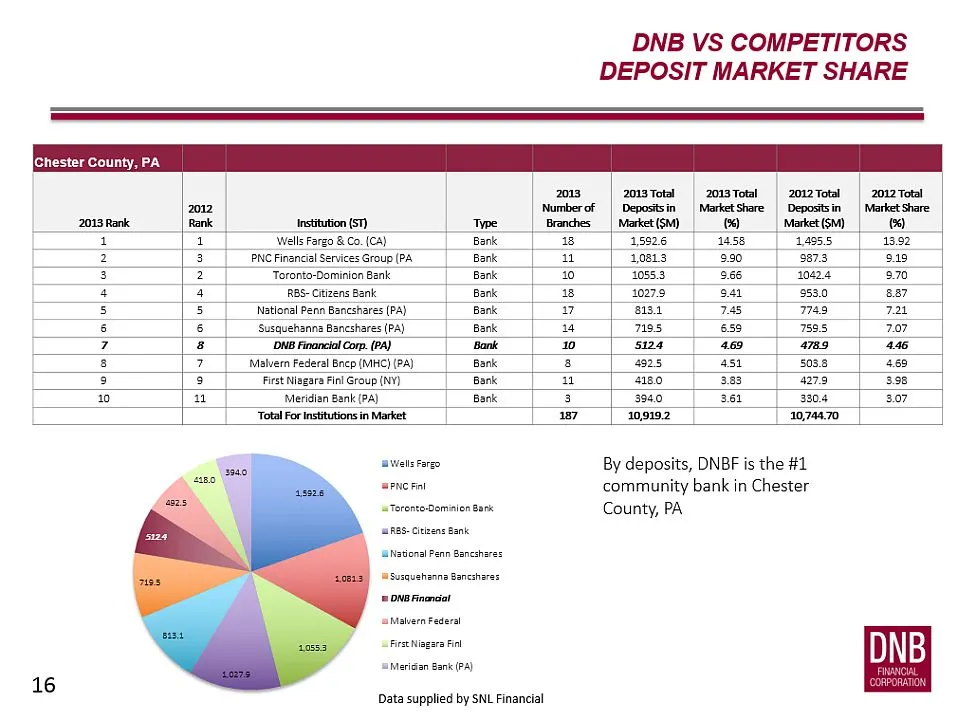
DNB VS COMPETITORS DEPOSIT MARKET SHARE Chester County, PA | Twe (Bank L [Bank Toronto-Dominion Bank [Bank RBS- Citizens Bank Bank National Penn Bancshares PA) Bark_ Susquehanna Bancshares (Pa) | _—Bank ‘DN Fioancial Cop. (PA) Bank ‘Malvern Federal Bnep (MHC) (PA) Bank Fit NigaraFiniGroup(Nv) | ark
Slide 17: Balanced Deposit Mix: Strong Core Deposit Growth
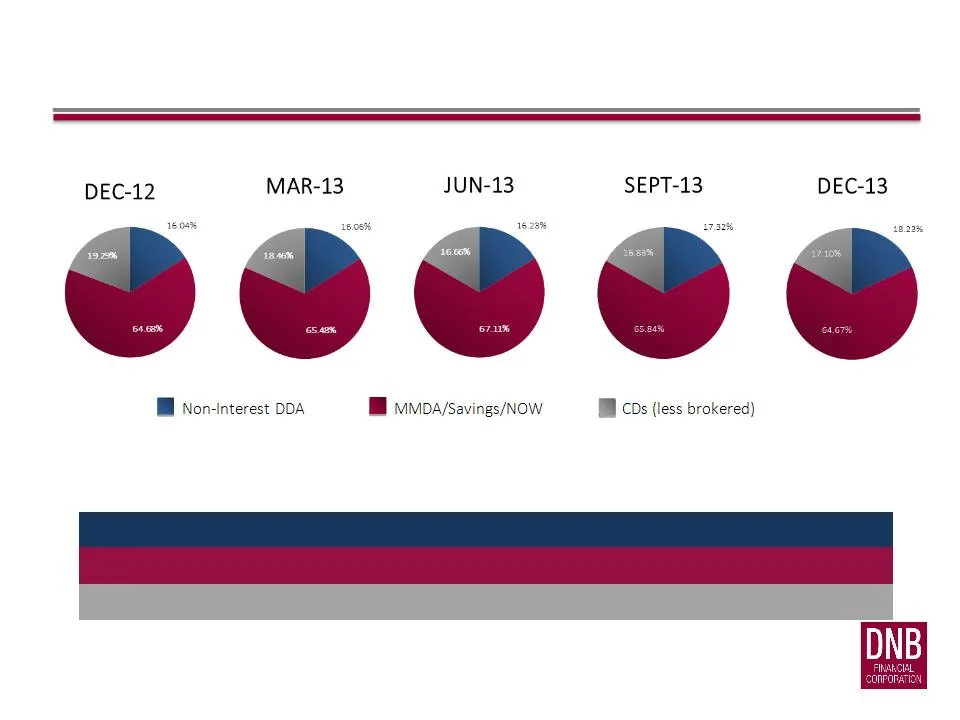
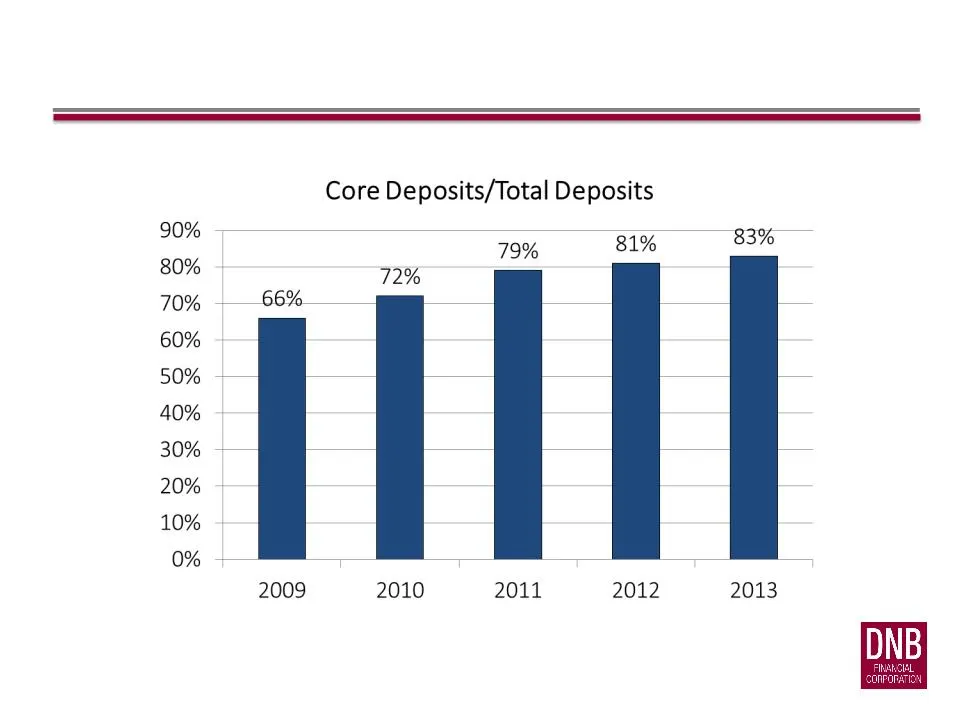
Dec-12 Mar-13 Jun-13 13-Sep 13-Dec Non Interest DDA 16.04% 16.06% 16.23% 17.32% 18.23% MMDA/Savings/NOW 64.68% 65.48% 67.11% 65.84% 64.67% CDs (less brokered) 19.29% 18.46% 16.66% 16.83% 17.10% BALANCED DEPOSIT MIX: STRONG CORE DEPOSIT GROWTH
Slide 18: High Level of Low Cost Core Deposits
HIGH LEVEL OF LOW COST CORE DEPOSITS
Slide 19: Detailed Loan Portfolio Composition
Loan Type $ Balance Percent Commercial RE OO 82,657 19.90% Commercial RE NOO 84,537 20.35% Residential 1-4 62,893 15.14% Commercial & Industrial 53,207 12.81% Residential 5+ 28,759 6.92% SBA/USDA Guaranteed 35,340 8.51% Construction 22,483 5.41% Home Equity LOC 21,685 5.22% Municipal/Govt/Non-Profit
Slide 20: Balanced Loan Portfolio
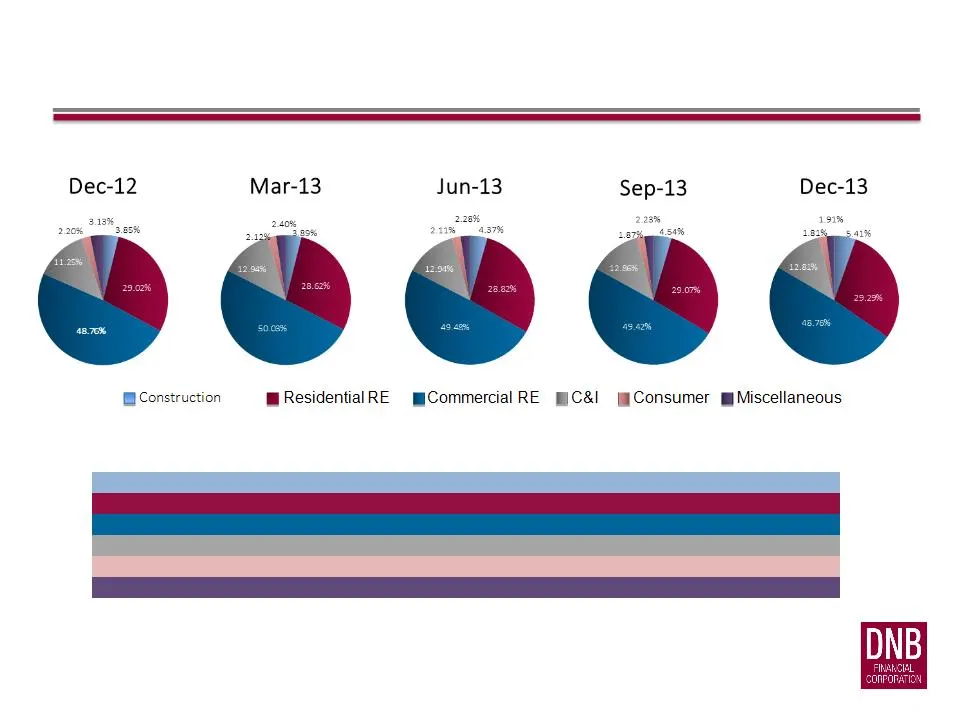
Dec-12 Mar-13 Jun-13 Sept-13 Dec-13 Construction 3.85% 3.89% 4.37% 4.54% 5.41% Residential RE 29.02% 28.62% 28.82% 29.07% 29.29% Commercial RE 48.76% 50.03% 49.48% 49.42% 48.76% C&I 13.04% 12.94% 12.94% 12.86% 12.81% Consumer 2.20% 2.12% 2.11% 1.87% 1.81% Miscellaneous 3.13% 2.40% 2.28% 2.24% 1.92%
Slide 21: Total Loans
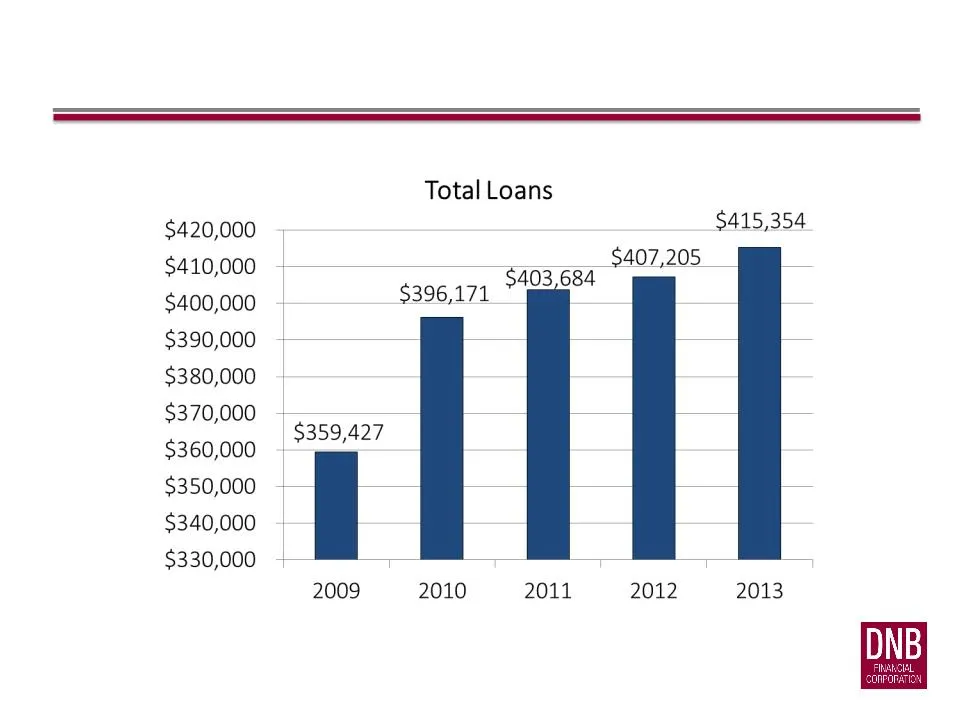
Total Loans $420,000 $415,354 | _ $407,205 im $410,000 503,684 $400,000 $396,171 $390,000 $380,000 $370,000 - $360,000 22/427 $350,000 $340,000 $330,000 — 2009 2010 2011 2012 2013

Slide 22: DNB's Financial Strength, Consistent Performance, Stable Growth and Financial Trends
DNB’s Financial Strength, Consistent Performance, Stable Growth and Financial Trends
Slide 23: Executive Summary
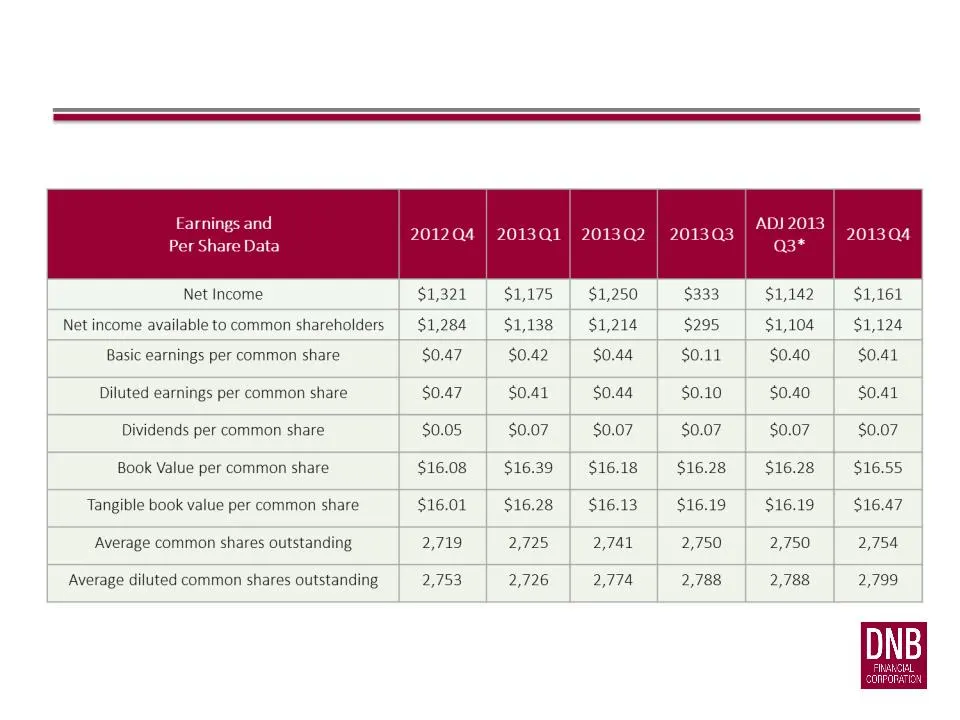
EXECUTIVE SUMMARY *Adjusted net income available to common shareholders is a non-gaap measure. Due to significant disparity of the provision expense for the 3 rd quarter 2013 ($1,600,000) compared to the other quarters presented ($375,000 in the 2 nd and 4 th quarters of 2013, and $180,000 in the 4
Slide 24: Earnings & Per Share Data
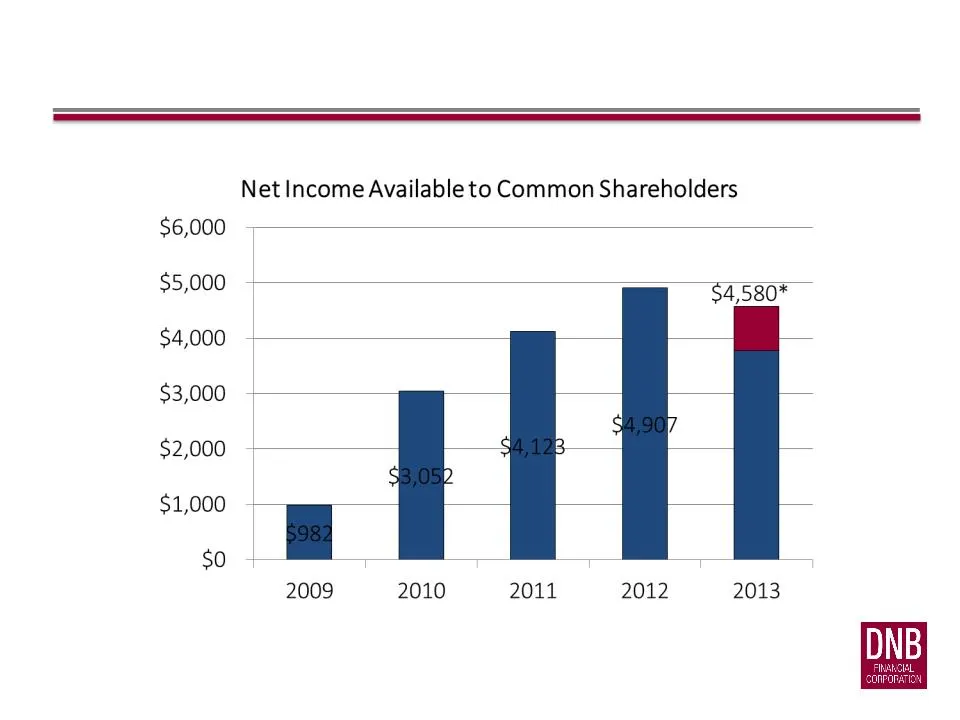
EARNINGS & PER SHARE DATA *Adjusted net income available to common shareholders is a non-gaap measure. Due to significant disparity of the provision expense for the 3 rd quarter 2013 ($1,600,000) compared to the other quarters presented ($375,000 in the 2 nd and 4 th quarters of 2013, and $180,000 i
Slide 25: Earnings & Per Share Data
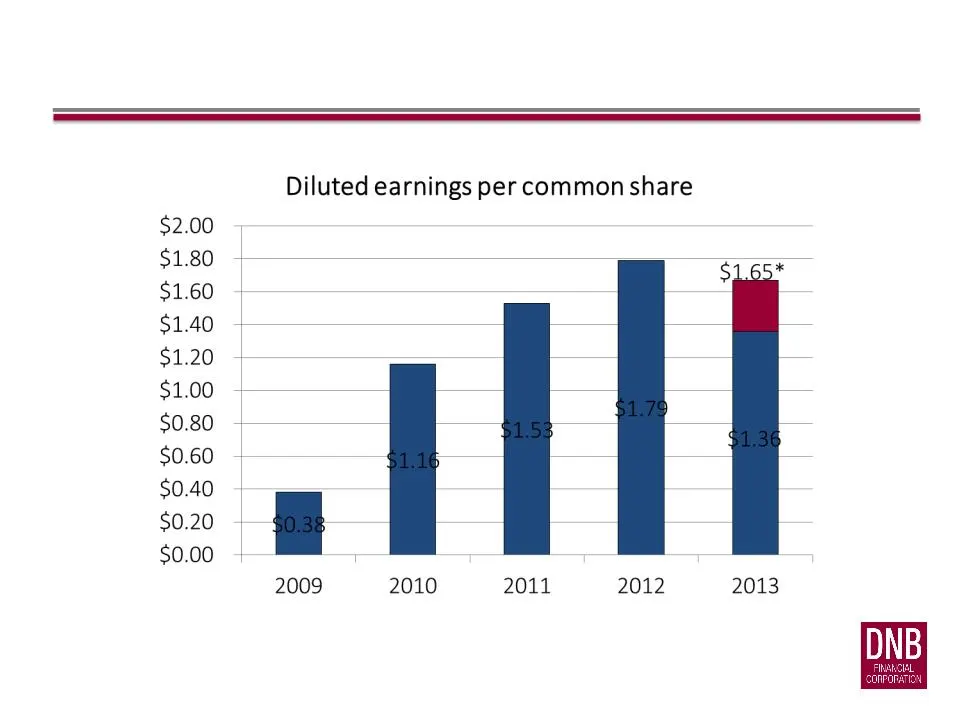
EARNINGS & PER SHARE DATA *Adjusted net income available to common shareholders is a non-gaap measure. Due to significant disparity of the provision expense for the 3 rd quarter 2013 ($1,600,000) compared to the other quarters presented ($375,000 in the 2 nd and 4 th quarters of 2013, and $180,000 i
Slide 26: Book Value per Common Share
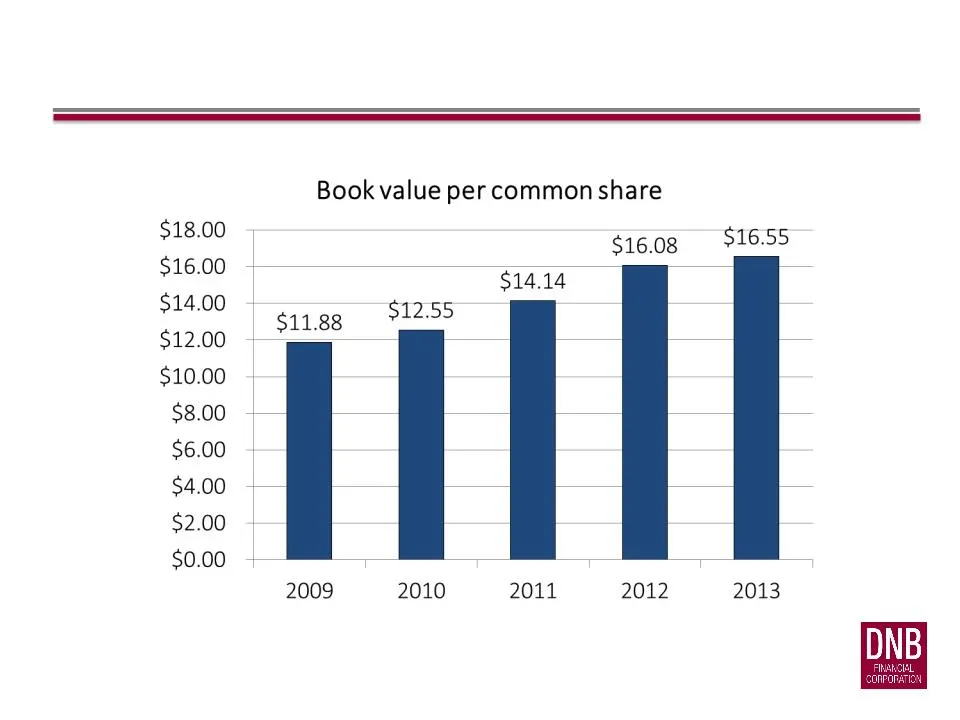
Book value per common share $16.08 $16.55 $14.14 i gies 92255 2009 2010 2011 2012 2013
Slide 27: Executive Summary: Performance Ratios
Performance Ratios 2012 Q4 2013 Q1 2013 Q2 2013 Q3 ADJ 2013 Q3* 2013 Q4 Return on average assets 0.83% 0.74% 0.76% .20% .69% .70% Return on average equity 9.26% 8.32% 8.60% 2.28% 7.82% 7.86% Return on average tangible equity 9.31% 8.36% 8.65% 2.29% 7.85% 7.89% Net interest margin 3.55% 3.32% 3.35% 3
Slide 28: Performance Ratios
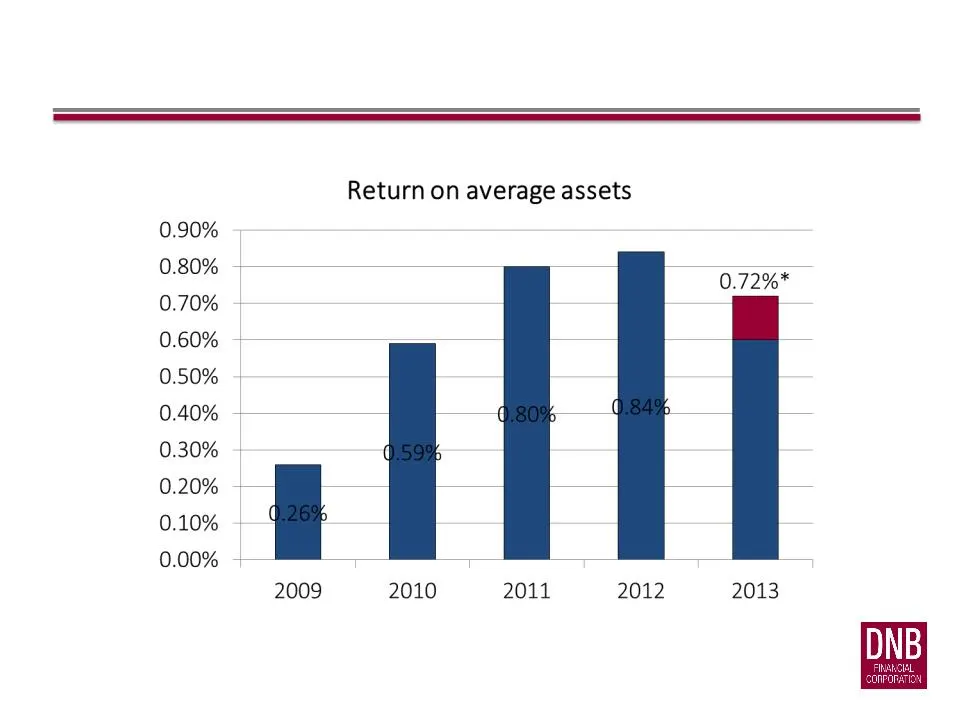
PERFORMANCE RATIOS *Adjusted net income available to common shareholders is a non-gaap measure. Due to significant disparity of the provision expense for the 3 rd quarter 2013 ($1,600,000) compared to the other quarters presented ($375,000 in the 2 nd and 4 th quarters of 2013, and $180,000 in the 4
Slide 29: Performance Ratios
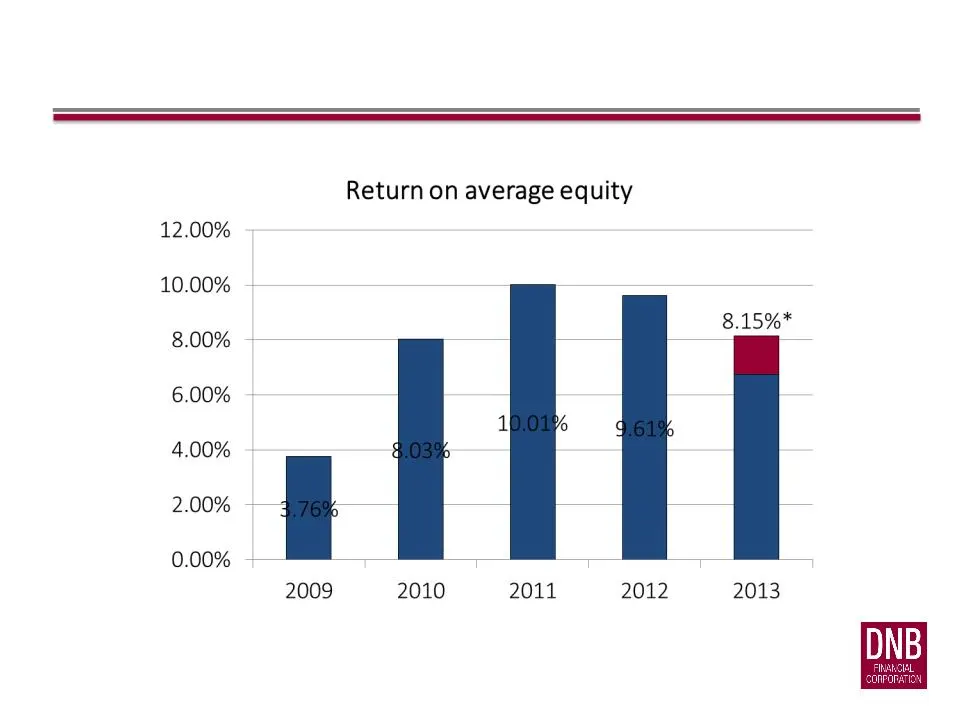
PERFORMANCE RATIOS *Adjusted net income available to common shareholders is a non-gaap measure. Due to significant disparity of the provision expense for the 3 rd quarter 2013 ($1,600,000) compared to the other quarters presented ($375,000 in the 2 nd and 4 th quarters of 2013, and $180,000 in the 4
Slide 30: Net Interest Margin-TE
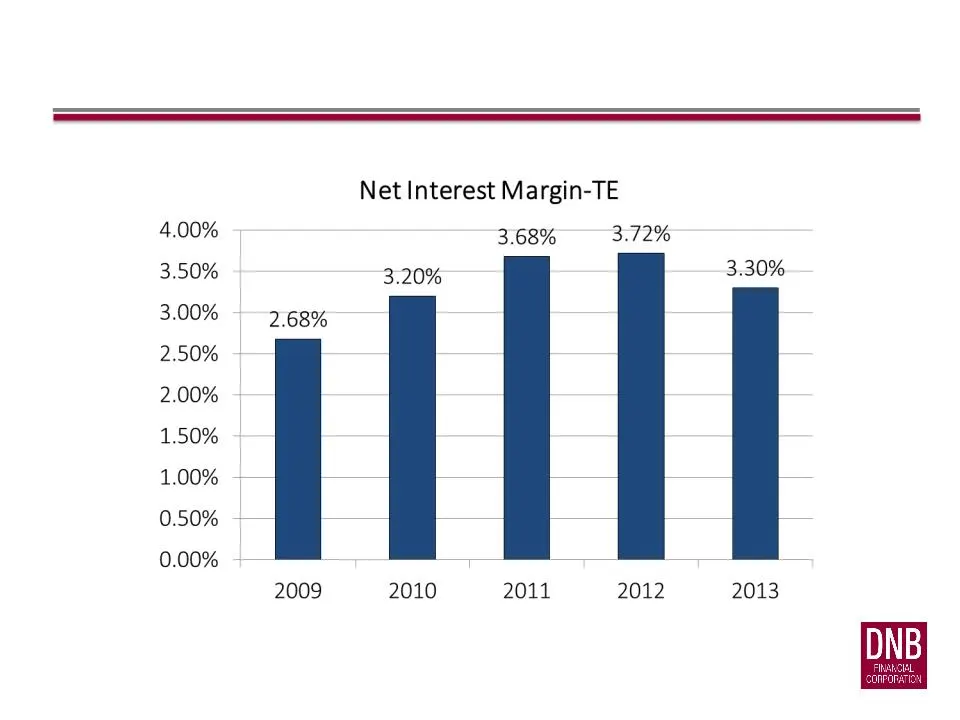
4.00% 3.50% 3.00% 2.50% 2.00% 1.50% 1.00% 0.50% 0.00% Net Interest Margin-TE 3.68% 3.72% 3.20% aaa 2.60% 2009 2010 2011 2012 2013
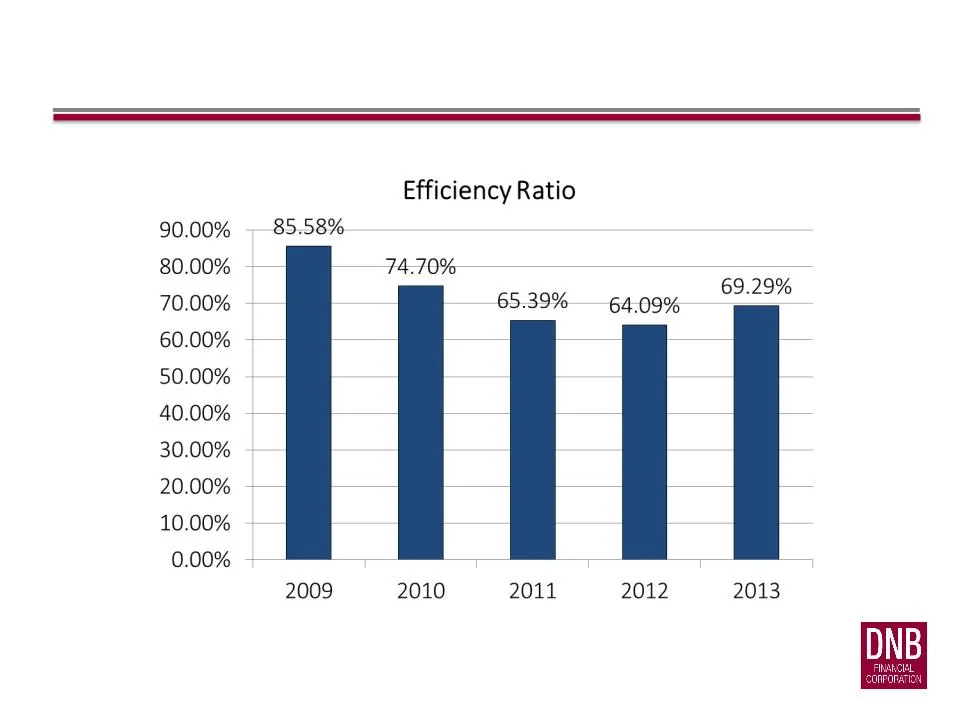
Slide 31: Efficiency Ratio
Efficiency Ratio 90.00% 85.58% 80.00% 74.70% =e) 70.00% 65.39% 64.09% . 60.00% - 50.00% 40.00% | 30.00% 20.00% — 4 1 ; 10.00% 0.00% - 5: 2009 2010 2011 2012 2013
Slide 32: Executive Summary: Asset Quality Ratios
Asset Quality Ratios 2012 Q4 2013 Q1 2013 Q2 2013 Q3 2013 Q4 Net Charge-offs to average loans -0.10% -0.11% 0.82% 4.03% 0.06% Non-performing loans/Total loans 2.63% 4.05% 2.60% 1.40% 1.38% Allowance for credit loss/Total loans 1.72% 1.77% 1.72% 1.08% 1.11% Allowance for credit loss/Non-performing lo
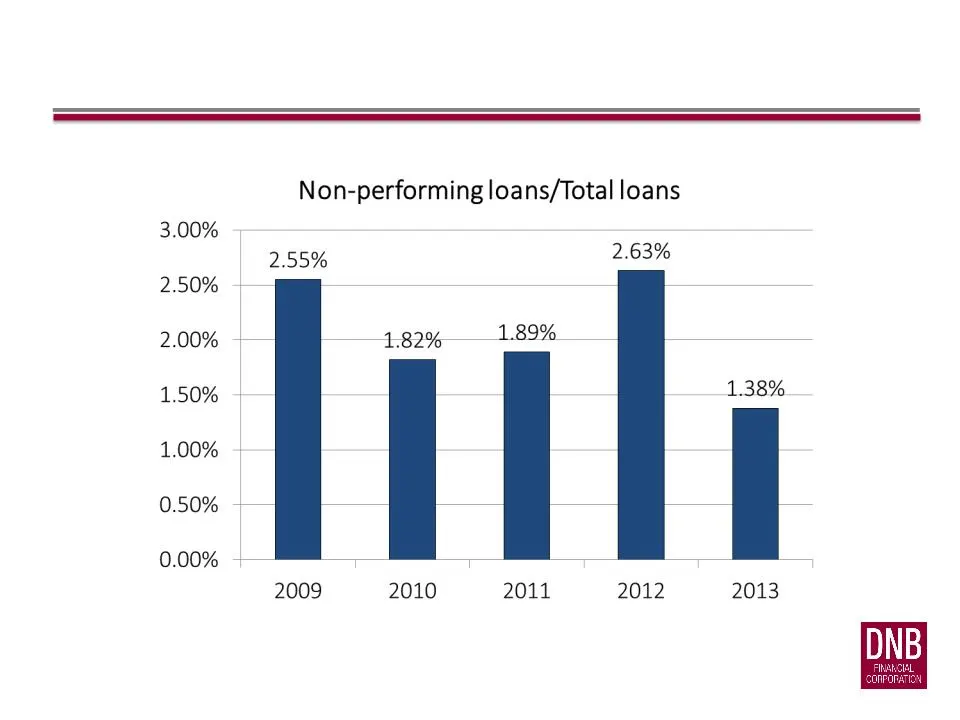
Slide 33: Non-performing Loans/Total Loans
Non-performing loans/Total loans 3.00% 5 2.55% 2.63% 2.50% 2.00% 1.82% 189% | 1.50% 1.38% 1.00% 0.50% | 0.00% ; 2009 2010 2011 2012 2013
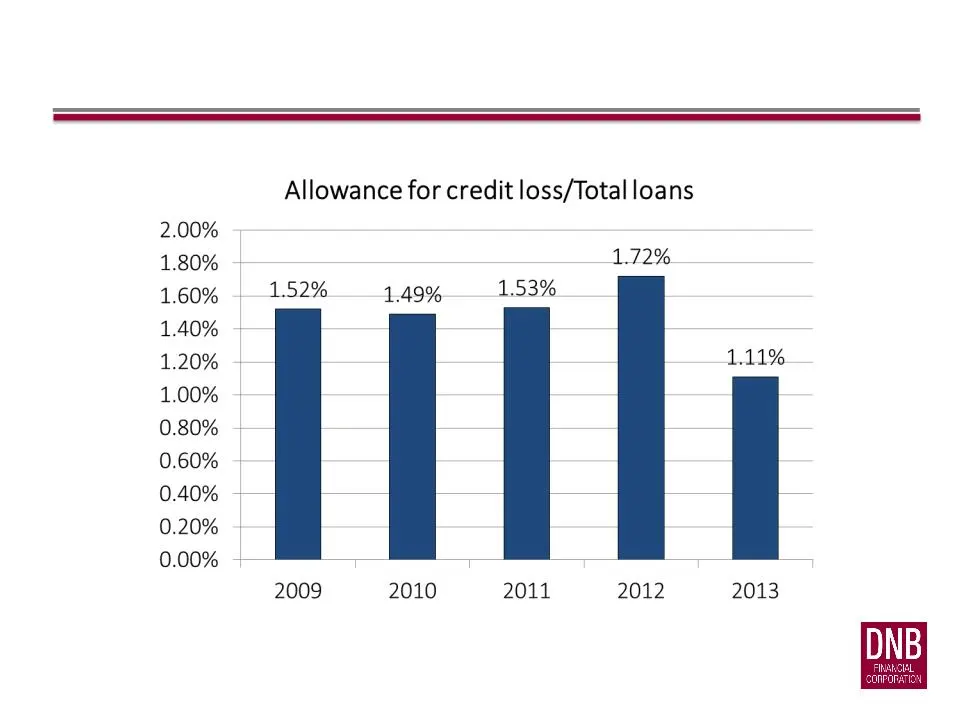
Slide 34: Allowance for Credit Loss/Total Loans
Allowance for credit loss/Total loans 2.00% 1.80% 1.72% 1.60% 152% __ 4.49% 1.53% 1.40% 1.20% 1.11% 1.00% 0.80% 0.60% 0.40% -- q ' 0.20% 0.00% 1 2009 2010 2011 2012 2013
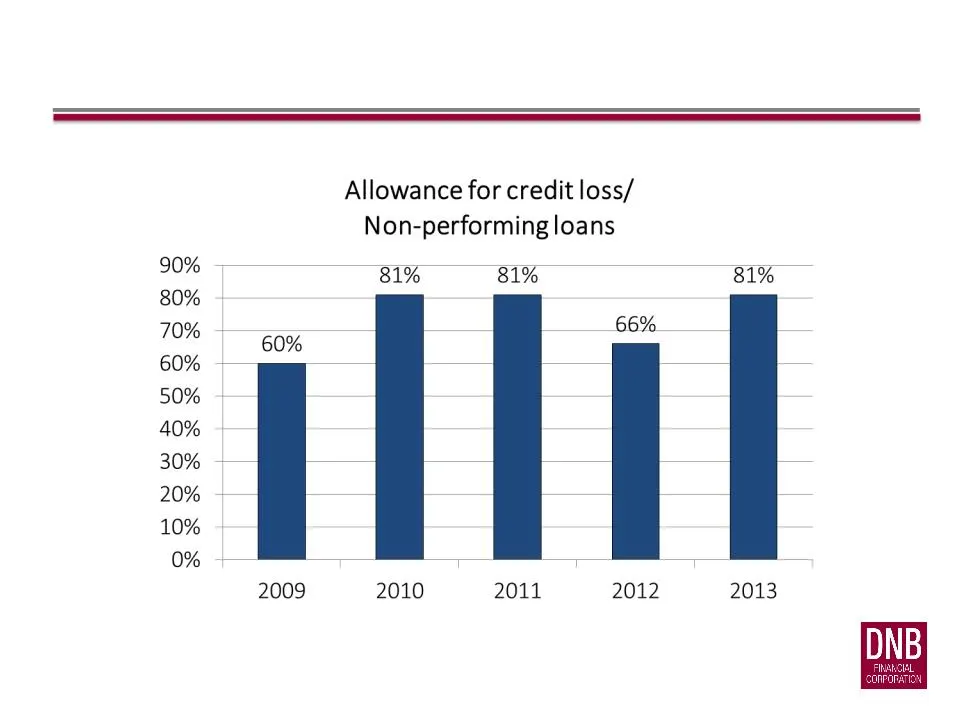
Slide 35: Allowance for Credit Loss/Non-performing Loans
Allowance for credit loss/ Non-performing loans 90% 81% 81% 80% 70% aa u 66% 60% ] 50% 40% 30% 4 ; 20% - 7 i 10% 0% T T T 2009 2010 2011 2012 2013
Slide 36: Executive Summary: Capital Ratios
Capital Ratios 2012 Q4 2013 Q1 2013 Q2 2013 Q3 2013 Q4 Total equity/Total assets 8.87% 8.98% 8.60% 8.89% 8.86% Tangible equity/Tangible assets 8.83% 8.94% 8.58% 8.87% 8.84% Tangible common equity/Tangible assets 6.80% 6.92% 6.63% 6.87% 6.87% Tier 1 leverage ratio 10.50% 10.48% 10.42% 10.39% 10.61% T
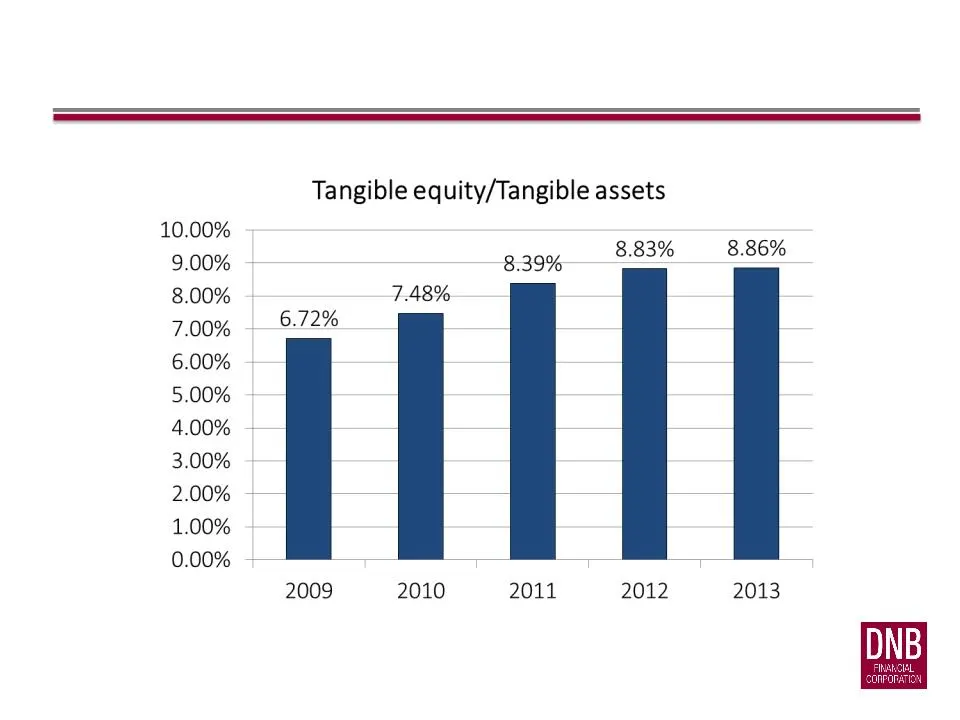
Slide 37: Tangible Equity/Tangible Assets
Tangible equity/Tangible assets 10.00% ee 9.00% 8.39% 8:83% __ 8.86% 8.00% 7A8% 7.00% 6.72% 6.00% 5.00% 4.00% il 7 3.00% 2.00% Til 1.00% 0.00% - 2009 2010 2011 2012 2013
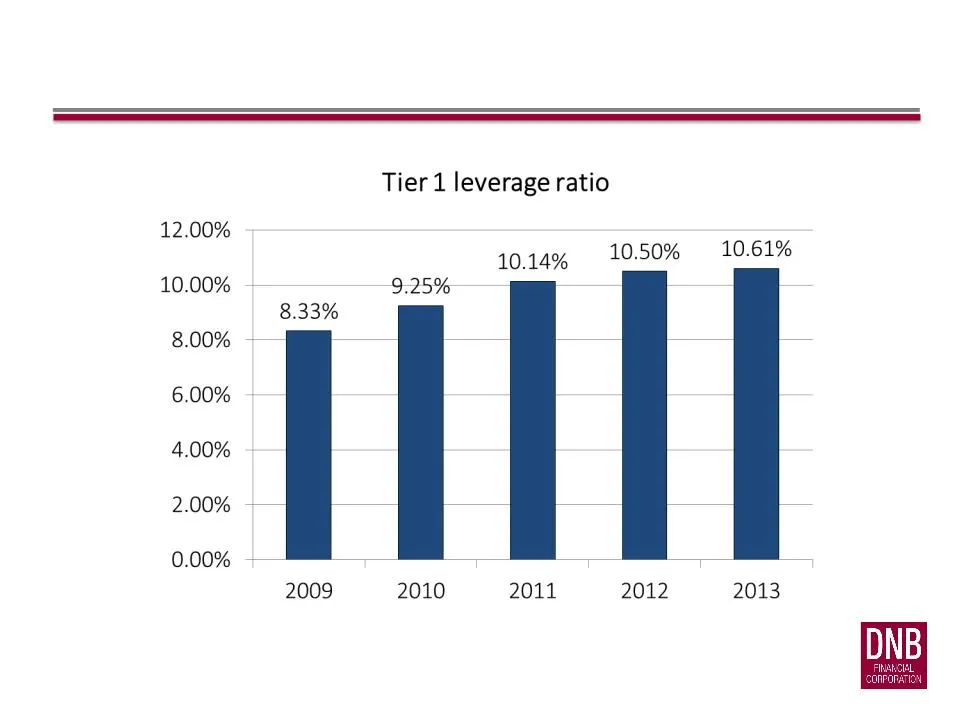
Slide 38: Tier 1 Leverage Ratio
Tier 1 leverage ratio 12.00% 10.14% 10.50% 10.61% 10.00% 9.25% 8.33% 8.00% a 6.00% 4.00% 2.00% - 4 0.00% - T T 2009 2010 2011 2012 2013

Slide 39: The Differentiators: Operationally Unique
The Differentiators: Operationally Unique
Slide 40: Enterprise Risk Management
ENTERPRISE RISK MANAGEMENT • Led by William Hieb, President & Chief Risk and Credit Officer • Integration across financial, operational, strategic and compliance • Committee-driven decision-making process • Management • Board of Directors • Internal Control Redundancies • Accountability
Slide 41: Enterprise Risk Management
ENTERPRISE RISK MANAGEMENT • Corporate goal of building and maintaining a fortress balance sheet • Strong asset quality • Strong levels of liquidity with contingency planning • Superior ALCO process
Slide 42: Proactive Investment Portfolio Management
PROACTIVE INVESTMENT PORTFOLIO MANAGEMENT • Three tiered/segmented investment portfolio o Liquidity o Intermediate o Income • Manage liquidity and cash flows better • Maneuverability - Asset mix shifts • Opportunistic • Facilitates strong earnings • Consistent with ERM

Slide 43: Experienced Management and Board Leadership
Experienced Management and Board Leadership
Slide 44: Experienced Management Team
EXPERIENCED MANAGEMENT TEAM William S. Latoff - Chairman & Chief Executive Officer 42 years experience in finance, public accounting, real estate and automotive industries. Director since 1998, Chairman of the Board since 2003 and CEO since 2004. Chairman of the Executive and Board Loan Committees.
Slide 45: Experienced Management Team
EXPERIENCED MANAGEMENT TEAM Vince Liuzzi - Executive Vice President, Chief Banking Officer 30 years banking and financial services experience with emphasis on retail banking, consumer lending, geographic and territory executive leadership, community relations and development. Joined DNB first in 201
Slide 46: Experienced Management Team
EXPERIENCED MANAGEMENT TEAM Bruce E. Moroney - Executive Vice President & Chief Accounting Officer 36 years of experience in banking with a concentration in accounting, finance and treasury management. Joined DNB in 1992 and is directly responsible for SEC and regulatory reporting and budgeting. Pri
Slide 47: Experienced Management Team
EXPERIENCED MANAGEMENT TEAM Frank S. Monterosso - Senior Vice President of Operations 24 years of experience in operations management with a concentration in electronic commerce, payment solutions and banking. Joined DNB in 2008 and is directly responsible for IT and deposit operations. Prior experi

Slide 48: Invest in DNB Financial
Invest in DNB Financial
Slide 49: 2013 DNBF Stock Performance
Security or Index 2013 Return DNBF* 33.87% NASDAQ Bank Index* 39.33% KBW Bank Index* 34.71% 2013 DNBF STOCK PERFORMANCE Closing price on Dec 31, 2012: $15.50 Closing price on Dec 27, 2013: $20.75 * Source: Bloomberg
Slide 50: Investor Relations Contact
INVESTOR RELATIONS CONTACT Gerald F. Sopp 484.359.3138 gsopp@dnbfirst.com http://investors.dnbfirst.com/ For more information, Investors may contact:

Slide 51: Thank You
THANK YOU
Slide 52: Investment Analysis for DNB Financial Corporation
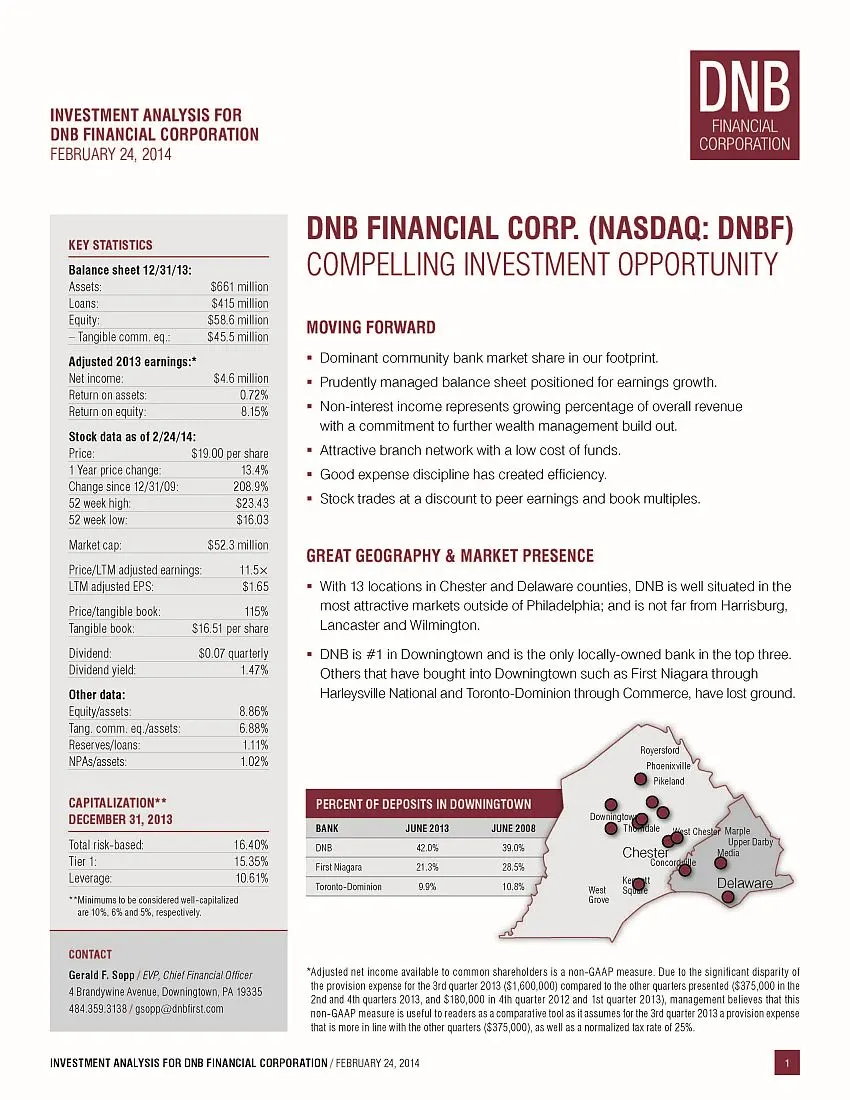
Investment analysis for dnb financial corporation february 24, 2014 investment analysis for dnb financial corporation / february 24, 2014 1 dnb financial corp. (nasdaq: dnbf) compelling investment opportunity moving forward dominant community bank market share in our footprint. Prudently managed bal
Slide 53: DNB Stock Is Trading Lower Than Peers
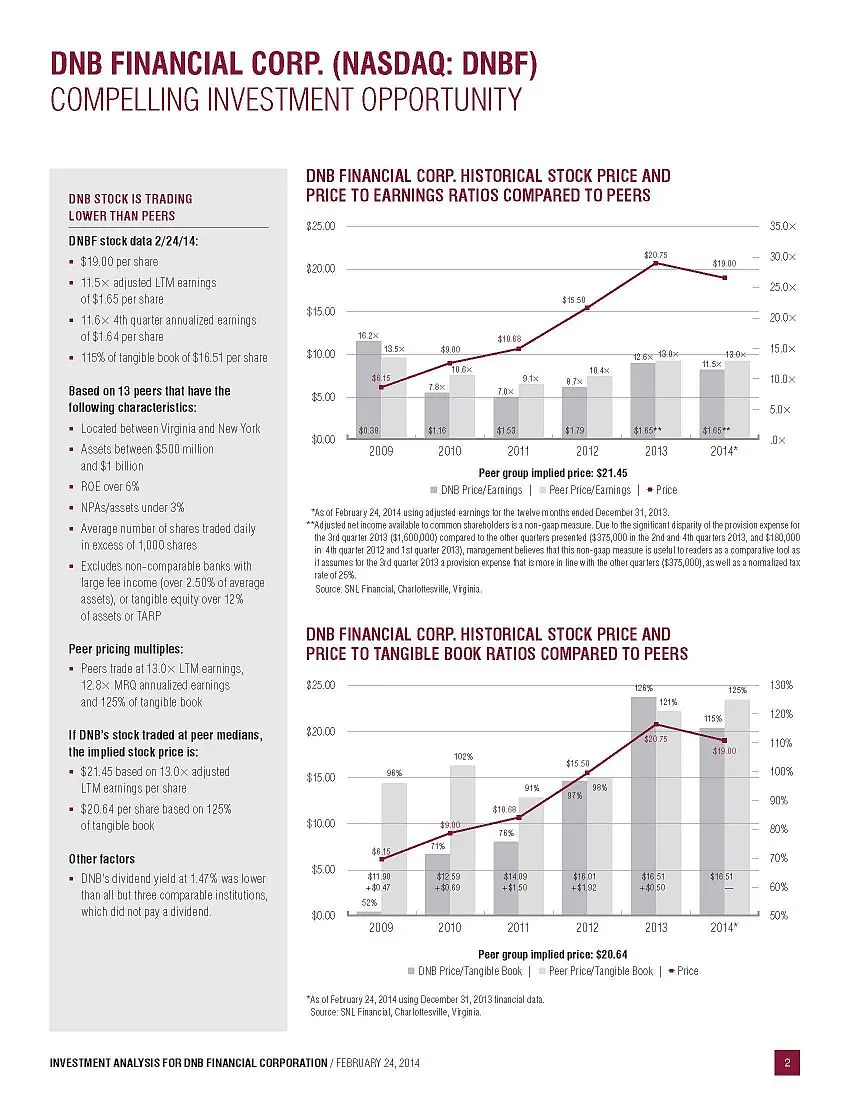
DNB FINANCIAL CORP. (NASDAQ: DNBF) COMPELLING INVESTMENT OPPORTUNITY DNB STOCK IS TRADING LOWER THAN PEERS DNBF stock data 2/24/14: $19.00 per share 11.5× adjusted LTM earnings of $1.65 per share 11.6× 4th quarter annualized earnings of $1.64 per share 115% of tangible book of $16.51 per share Based
Slide 54: DNB Financial Corp. Income Statement – Last 5 Quarters
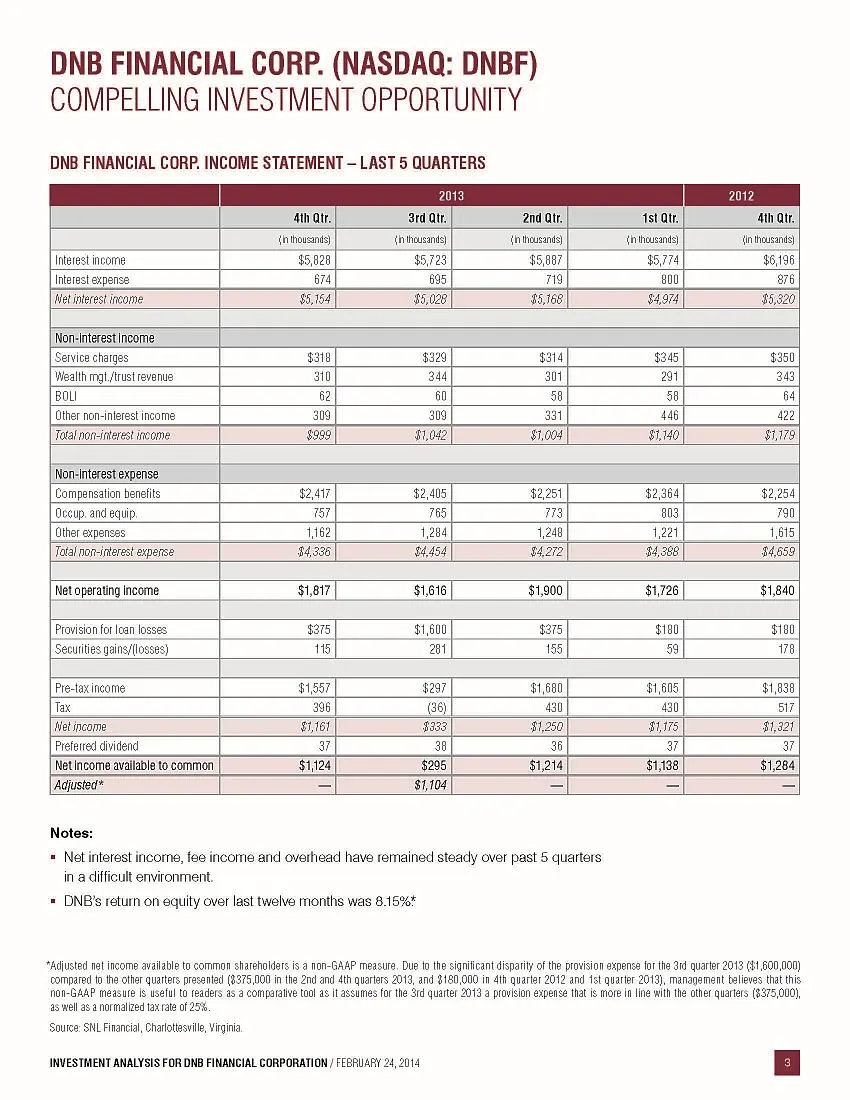
DNB FINANCIAL CORP. (NASDAQ: DNBF) COMPELLING INVESTMENT OPPORTUNITY DNB FINANCIAL CORP. INCOME STATEMENT – LAST 5 QUARTERS 2013 2012 4th Qtr. 3rd Qtr. 2nd Qtr. 1st Qtr. 4th Qtr. (in thousands) (in thousands) (in thousands) (in thousands) (in thousands) Interest income $5,828 $5,723 $5,887 $5,774 $6
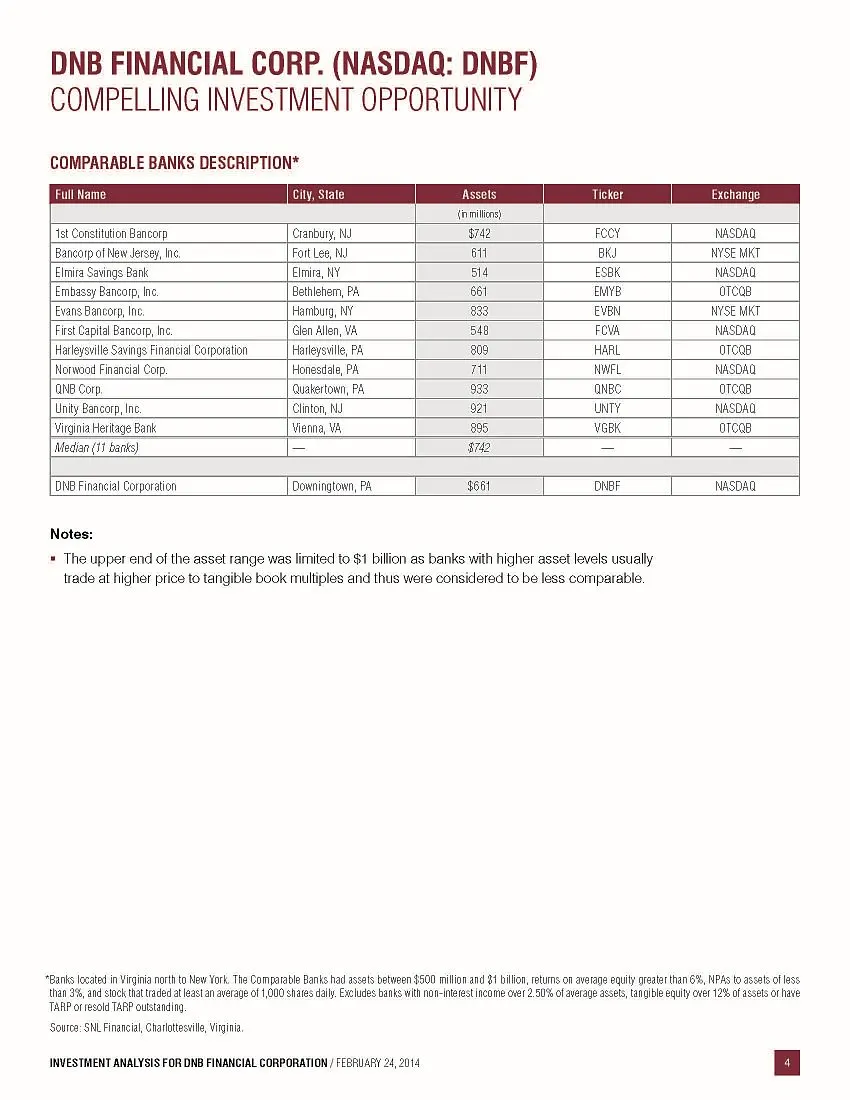
Slide 55: Comparable Banks Description
DNB FINANCIAL CORP. (NASDAQ: DNBF) COMPELLING INVESTMENT OPPORTUNITY COMPARABLE BANKS DESCRIPTION* Full Name City, State Assets Ticker Exchange (in millions) 1st Constitution Bancorp Cranbury, NJ $742 FCCY NASDAQ Bancorp of New Jersey, Inc. Fort Lee, NJ 611 BKJ NYSE MKT Elmira Savings Bank Elmira, N
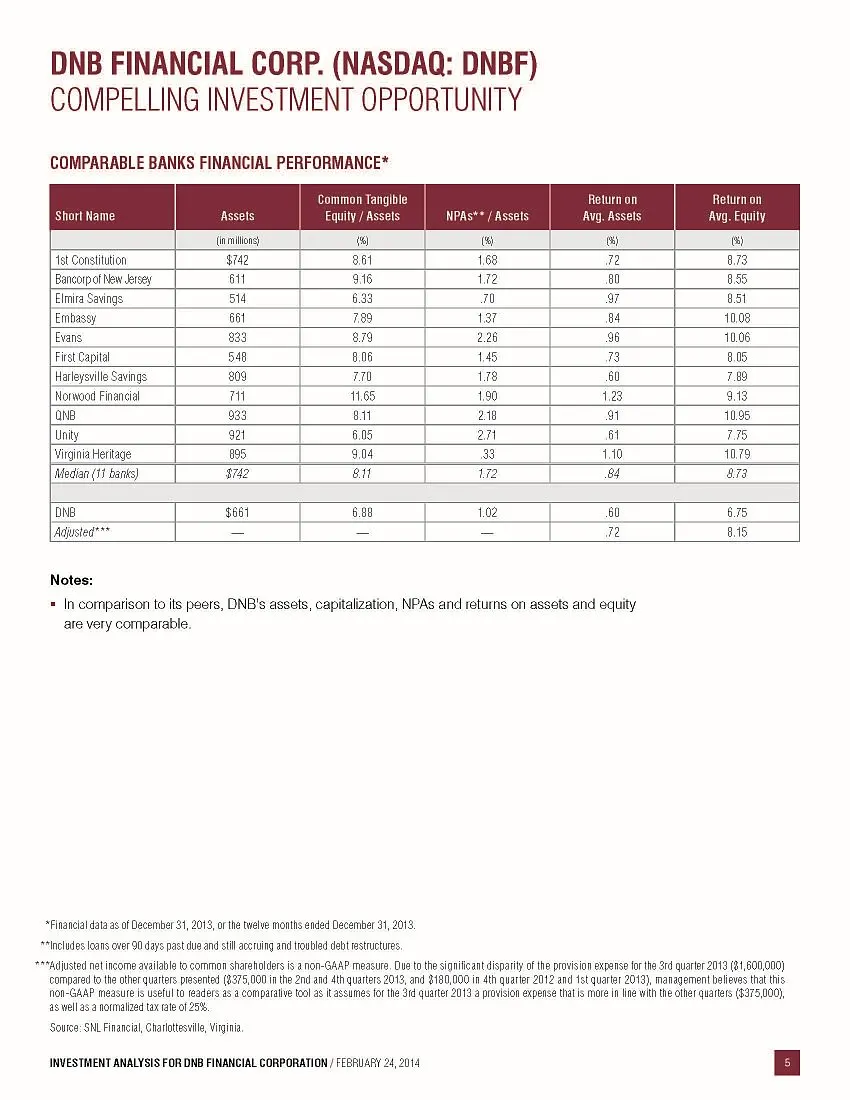
Slide 56: Comparable Banks Financial Performance
DNB FINANCIAL CORP. (NASDAQ: DNBF)COMPELLING INVESTMENT OPPORTUNITY COMPARABLE BANKS FINANCIAL PERFORMANCE* Short Name Assets Common Tangible Equity / Assets NPAs** / Assets Return on Avg. Assets Return on Avg. Equity (in millions) (%) (%) (%) (%) 1st Constitution $742 8.61 1.68 .72 8.73 Bancorp of
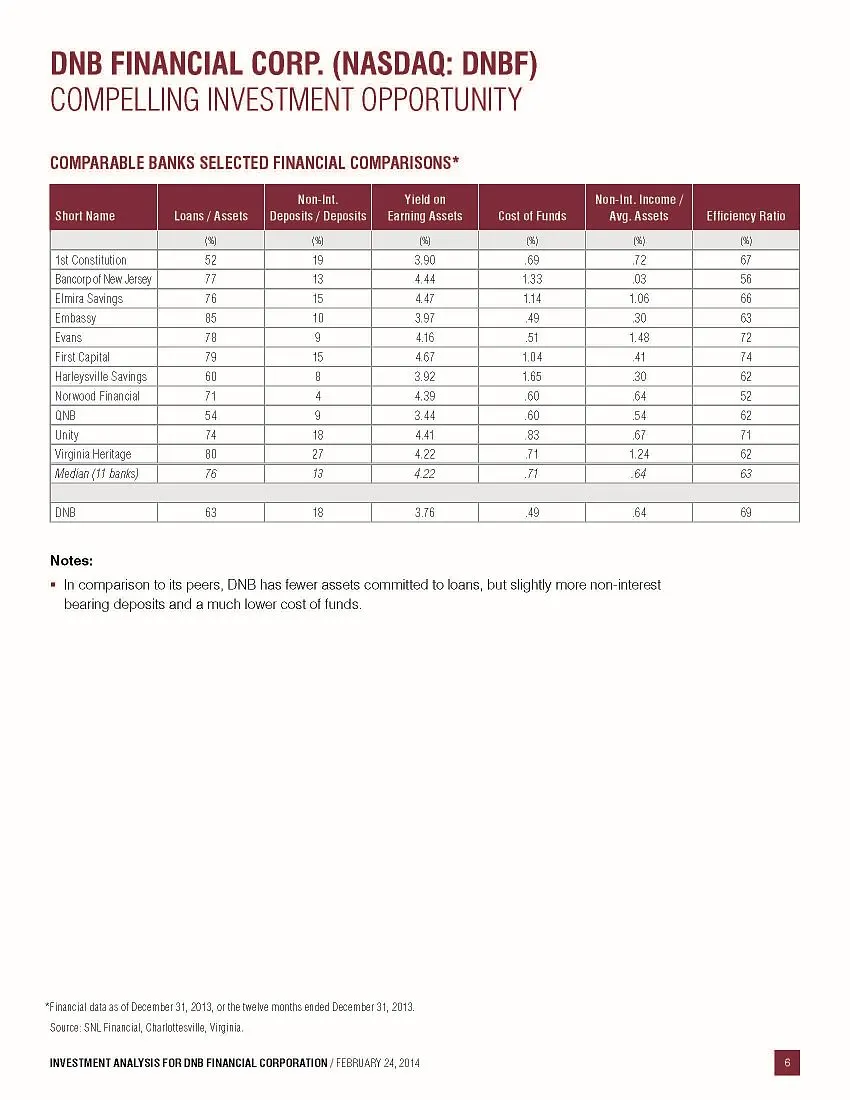
Slide 57: Comparable Banks Selected Financial Comparisons
DNB FINANCIAL CORP. (NASDAQ: DNBF) COMPELLING INVESTMENT OPPORTUNITY COMPARABLE BANKS SELECTED FINANCIAL COMPARISONS* Short Name Loans / Assets Non-Int. Deposits / Deposits Yield on Earning Assets Cost of Funds Non-Int. Income / Avg. Assets Efficiency Ratio (%) (%) (%) (%) (%) (%) 1st Constitution 5
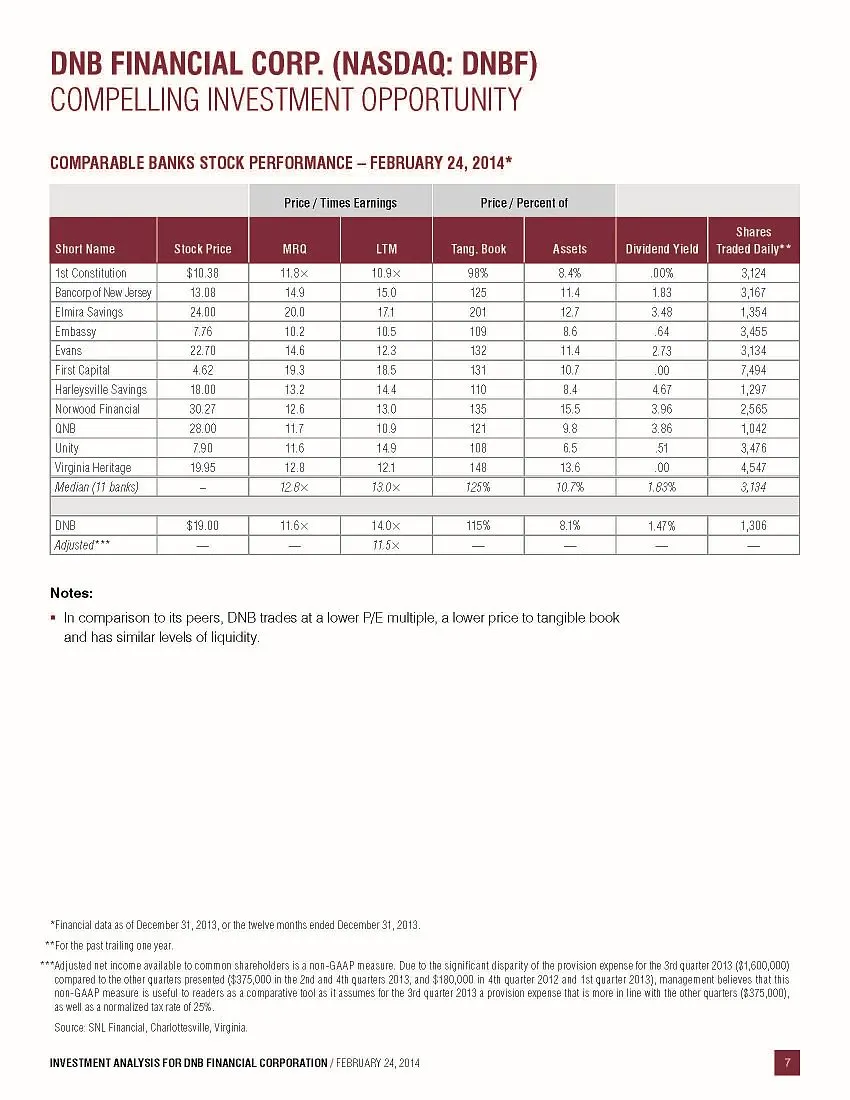
Slide 58: Comparable Banks Stock Performance
DNB FINANCIAL CORP. (NASDAQ: DNBF) COMPELLING INVESTMENT OPPORTUNITY COMPARABLE BANKS STOCK PERFORMANCE – FEBRUARY 24, 2014* Price / Times Earnings Price / Percent of Short Name Stock Price MRQ LTM Tang. Book Assets Dividend Yield Shares Traded Daily** 1st Constitution $10.38 11.8× 10.9× 98% 8.4% .0
Slide 59: Contact
CONTACT Gerald F. Sopp EVP, Chief Financial Officer 4 Brandywine Avenue Downingtown, PA 19335 484.359.3138 gsopp@dnbfirst.comFORWARD-LOOKING STATEMENTS: Certain statements contained in this presentation are forward-looking in nature. These include all statements about DNB’s plans, objectives, expect
Source: SEC EDGAR · 8-K filed Mar 5, 2014
More decks from DNB Financial Corporation
 Investor Presentation (August 2018)32 slides · Aug 7, 2018
 Shareholder Meeting (April 2016)31 slides · Apr 27, 2016
 Merger or Acquisition (April 2016)23 slides · Apr 5, 2016
 Investor Presentation (September 2015)47 slides · Sep 23, 2015
 Investor Presentation (September 2014)42 slides · Sep 2, 2014
 Investor Presentation (August 2013)59 slides · Aug 21, 2013