DNB Financial — Investor Presentation (September 2015)
47 slides from DNB Financial's investor presentation, Sep 23, 2015
Slide 1: DNB Financial Corporation Investor Overview Presentation Fall 2015
DNB Financial CorporationNASDAQ Capital Market: DNBFInvestor Overview PresentationFall 2015 FIRST to support our customers and communities
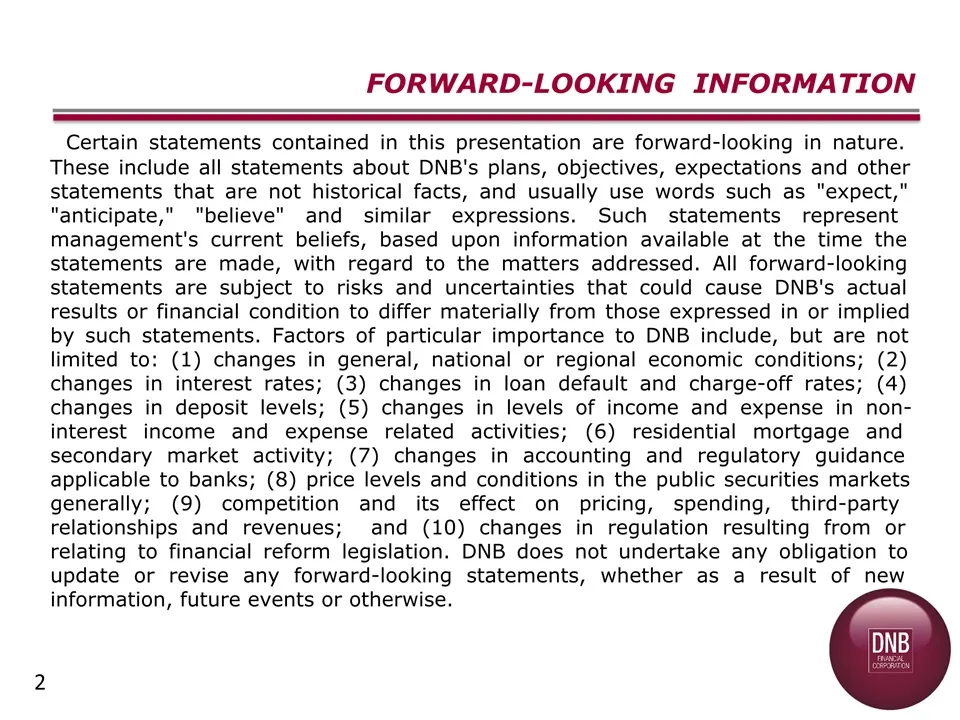
Slide 2: Forward-Looking Information
2 FORWARD-LOOKING INFORMATION Certain statements contained in this presentation are forward-looking in nature. These include all statements about DNB's plans, objectives, expectations and other statements that are not historical facts, and usually use words such as "expect," "anticipate," "believe"
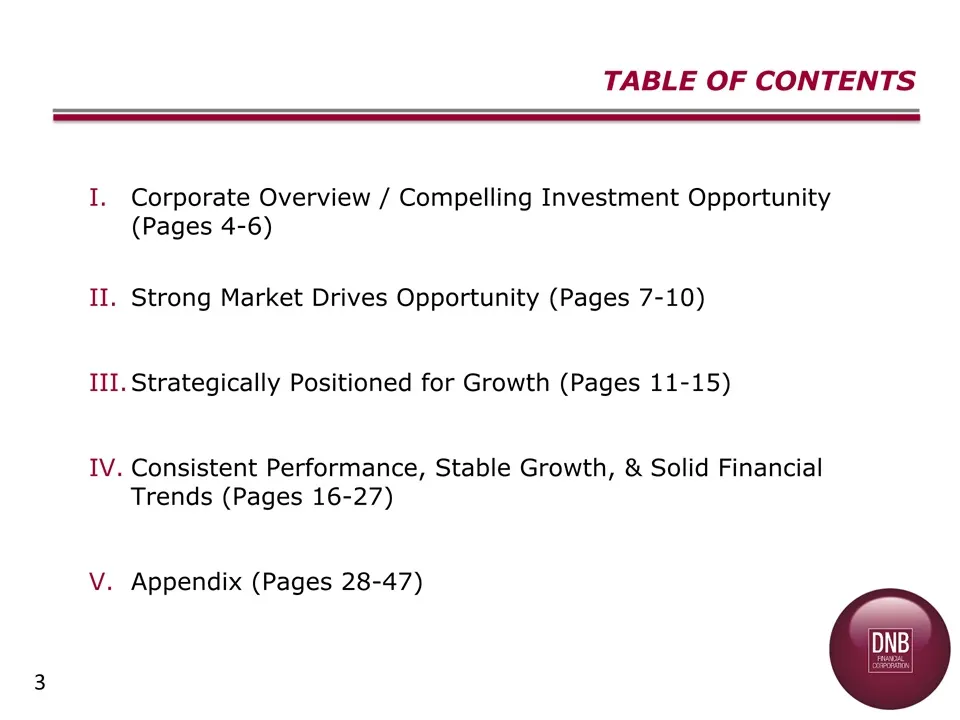
Slide 3: Table of Contents
3 Corporate Overview / Compelling Investment Opportunity (Pages 4-6)Strong Market Drives Opportunity (Pages 7-10)Strategically Positioned for Growth (Pages 11-15)Consistent Performance, Stable Growth, & Solid Financial Trends (Pages 16-27)Appendix (Pages 28-47) TABLE OF CONTENTS
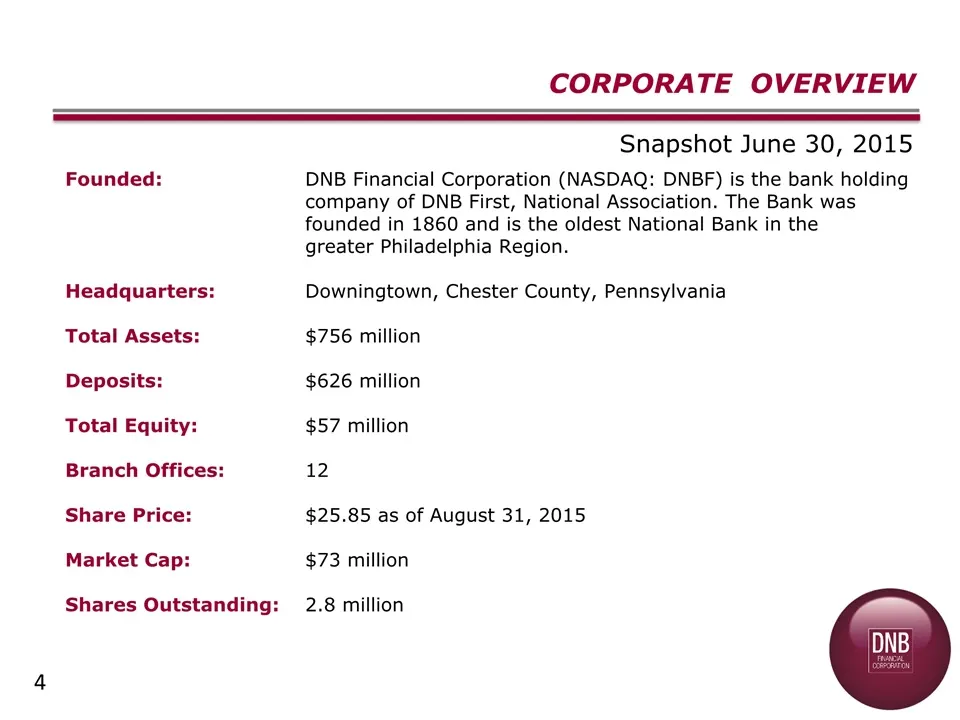
Slide 4: Corporate Overview
4 CORPORATE OVERVIEW Founded: DNB Financial Corporation (NASDAQ: DNBF) is the bank holding company of DNB First, National Association. The Bank was founded in 1860 and is the oldest National Bank in the greater Philadelphia Region.Headquarters: Downingtown, Chester County, PennsylvaniaTotal Assets:
Slide 5: Compelling Investment Opportunity
5 High quality footprint in affluent Chester and Delaware Counties, PAConsistent EarningsAttractive Core Deposit profileSuperior asset quality / Quality loan growthWell-capitalized, highly liquid, with clean, conservative balance sheetStrategically positioned to grow to $1 billion-plus in assetsAppr
Slide 6: Delivering for Our Shareholders: Beating the Indices
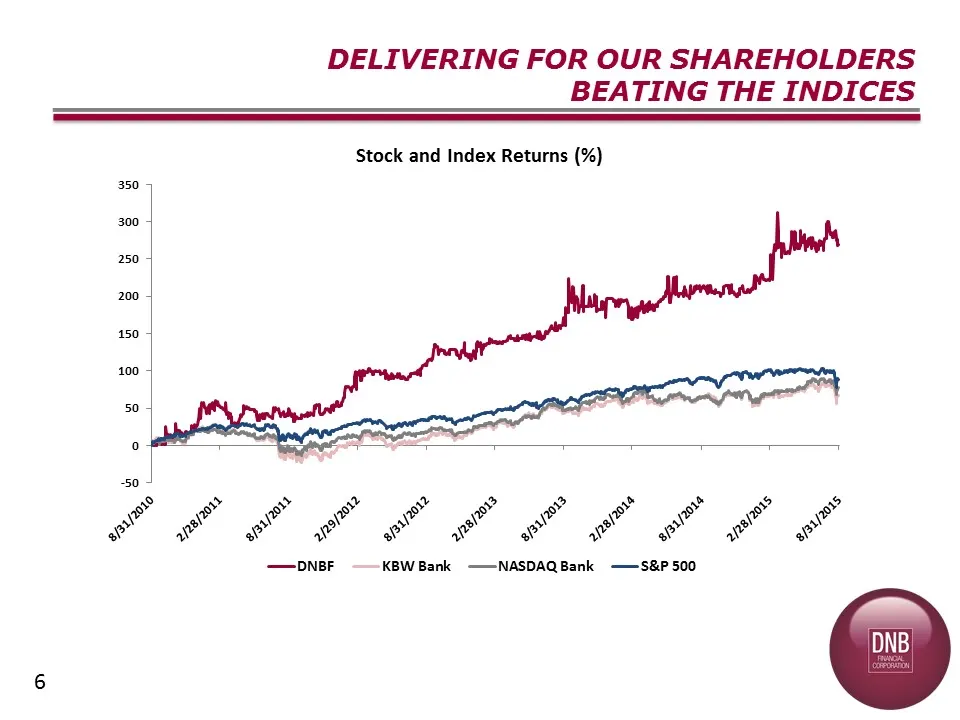
6 DELIVERING FOR OUR SHAREHOLDERS BEATING THE INDICES
Slide 7: Strong Market Drives Opportunity
Strong Market Drives Opportunity 7
Slide 8: Established Presence in Attractive Southeastern Pennsylvania Market
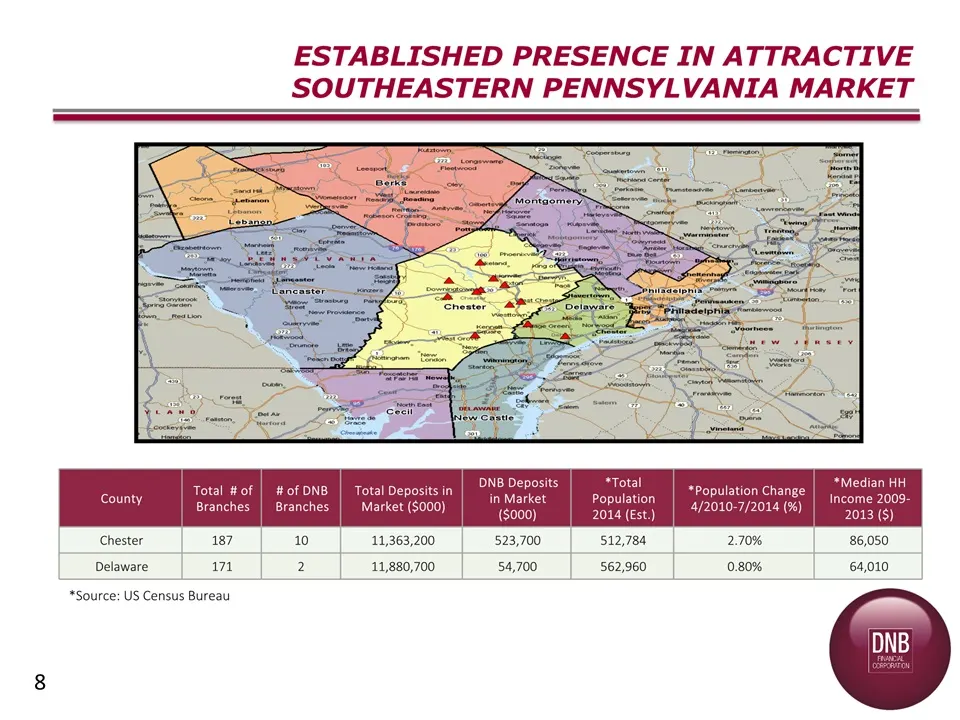
8 ESTABLISHED PRESENCE IN ATTRACTIVE SOUTHEASTERN PENNSYLVANIA MARKET County Total # of Branches # of DNB Branches Total Deposits in Market ($000) DNB Deposits in Market ($000) *Total Population 2014 (Est.) *Population Change 4/2010-7/2014 (%) *Median HH Income 2009-2013 ($) Chester 187 10 11,363,20
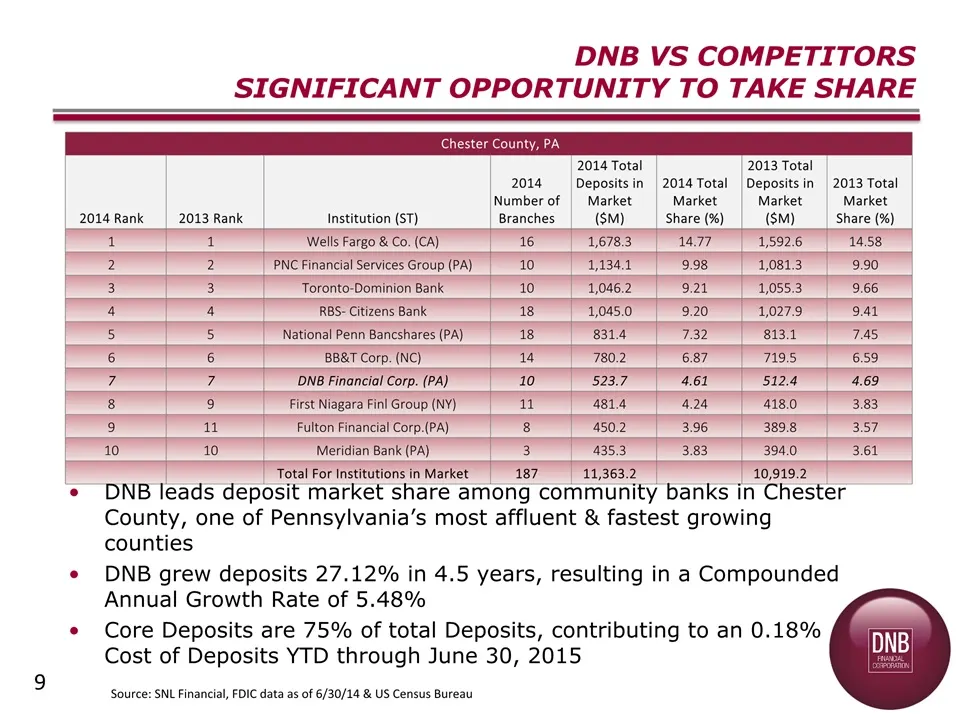
Slide 9: Chester County deposit market share
Source: SNL Financial, FDIC data as of 6/30/14 & US Census Bureau Chester County, PA 2014 Rank 2013 Rank Institution (ST) 2014 Number of Branches 2014 Total Deposits in Market ($M) 2014 Total Market Share (%) 2013 Total Deposits in Market ($M) 2013 Total Market Share (%) 1 1 Wells Fargo & Co. (CA) 1
Slide 10: Market Overview and Demographics: Growing Presence in Delaware County
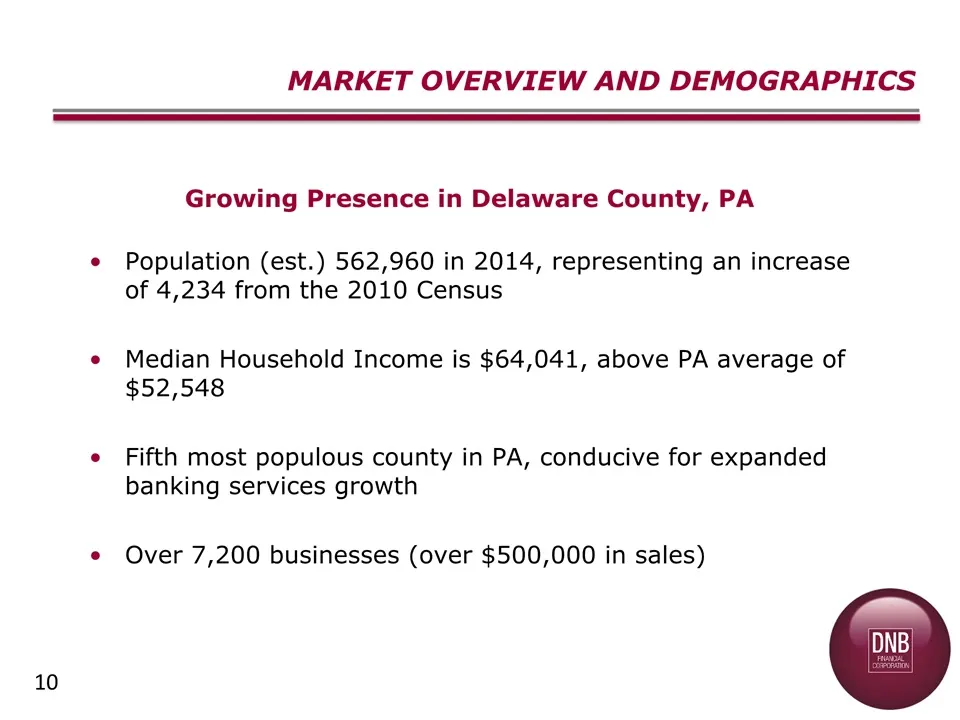
10 Population (est.) 562,960 in 2014, representing an increase of 4,234 from the 2010 Census Median Household Income is $64,041, above PA average of $52,548Fifth most populous county in PA, conducive for expanded banking services growthOver 7,200 businesses (over $500,000 in sales) MARKET OVERVIEW A
Slide 11: Strategically Positioned for Growth
Strategically Positioned for Growth 11
Slide 12: Strategic Objectives
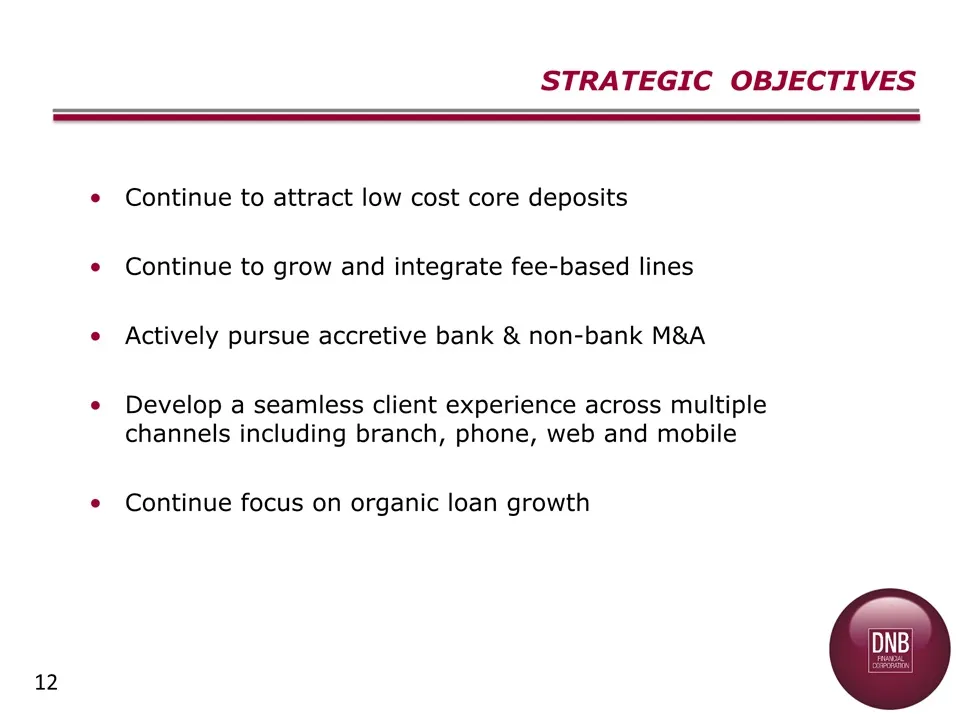
12 Continue to attract low cost core depositsContinue to grow and integrate fee-based linesActively pursue accretive bank & non-bank M&ADevelop a seamless client experience across multiple channels including branch, phone, web and mobileContinue focus on organic loan growth STRATEGIC OBJECTIVES
Slide 13: Balance Sheet Growth
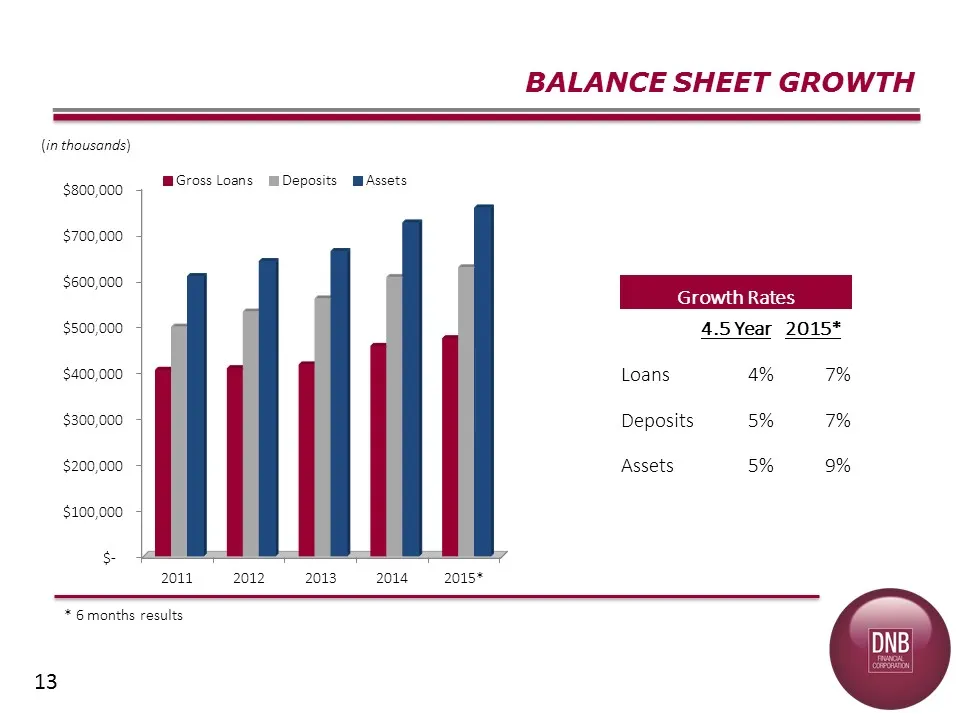
13 BALANCE SHEET GROWTH (in thousands) Growth Rates 4.5 Year 2015* Loans 4% 7% Deposits 5% 7% Assets 5% 9% * 6 months results
Slide 14: Deposit Mix: Steady Core Deposit Growth
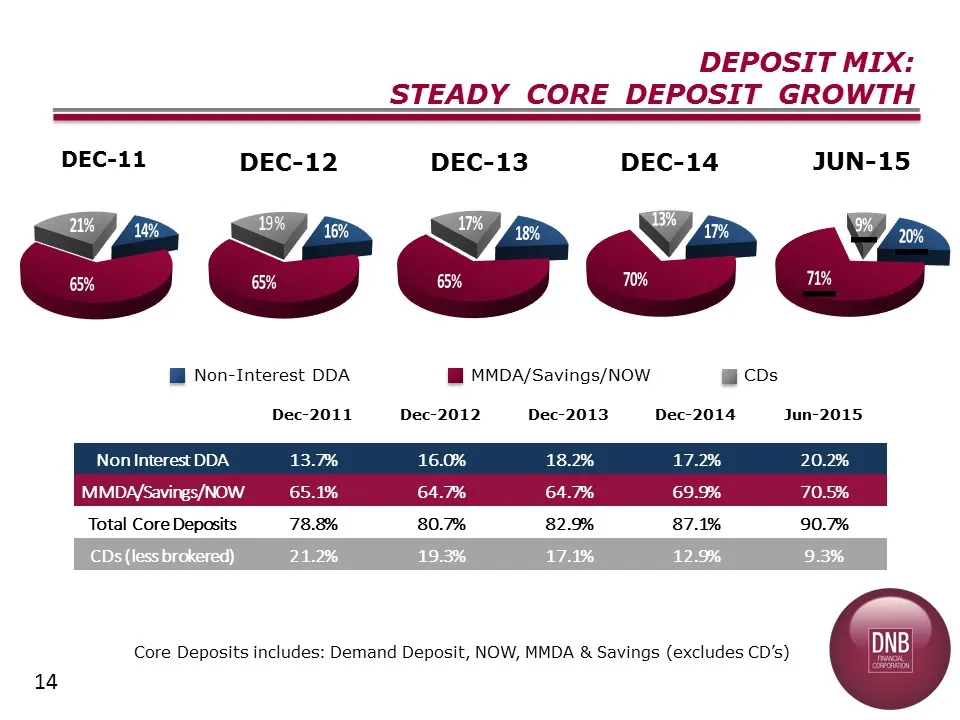
14 DEPOSIT MIX:STEADY CORE DEPOSIT GROWTH Non-Interest DDA MMDA/Savings/NOW CDs Dec-2011 Dec-2012 Dec-2013 Dec-2014 Jun-2015 Non Interest DDA 13.7% 16.0% 18.2% 17.2% 20.2% MMDA/Savings/NOW 65.1% 64.7% 64.7% 69.9% 70.5% Total Core Deposits 78.8% 80.7% 82.9% 87.1% 90.7% CDs (less brokered) 21.2% 19.3%
Slide 15: Loan Portfolio Mix
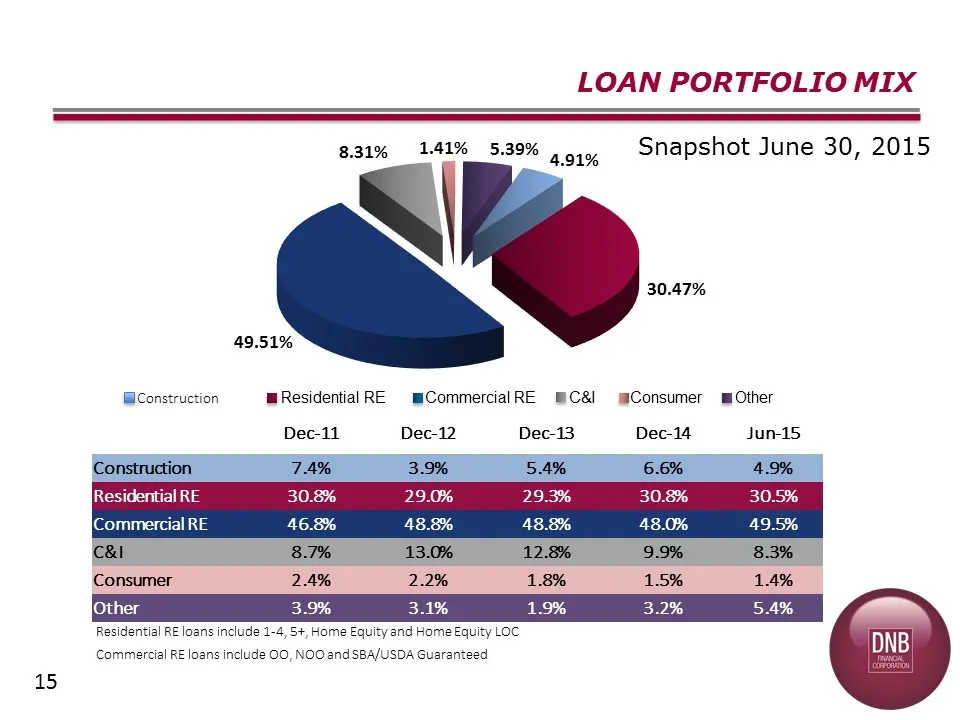
15 LOAN PORTFOLIO MIX Construction Residential RE Commercial RE C&I Consumer Other Dec-11 Dec-12 Dec-13 Dec-14 Jun-15 Construction 7.4% 3.9% 5.4% 6.6% 4.9% Residential RE 30.8% 29.0% 29.3% 30.8% 30.5% Commercial RE 46.8% 48.8% 48.8% 48.0% 49.5% C&I 8.7% 13.0% 12.8% 9.9% 8.3% Consumer 2.4% 2.2% 1.8%
Slide 16: DNB's Consistent Performance, Stable Growth and Financial Trends
DNB’s Consistent Performance, Stable Growth and Financial Trends 16
Slide 17: Financial Performance: Performance Ratios
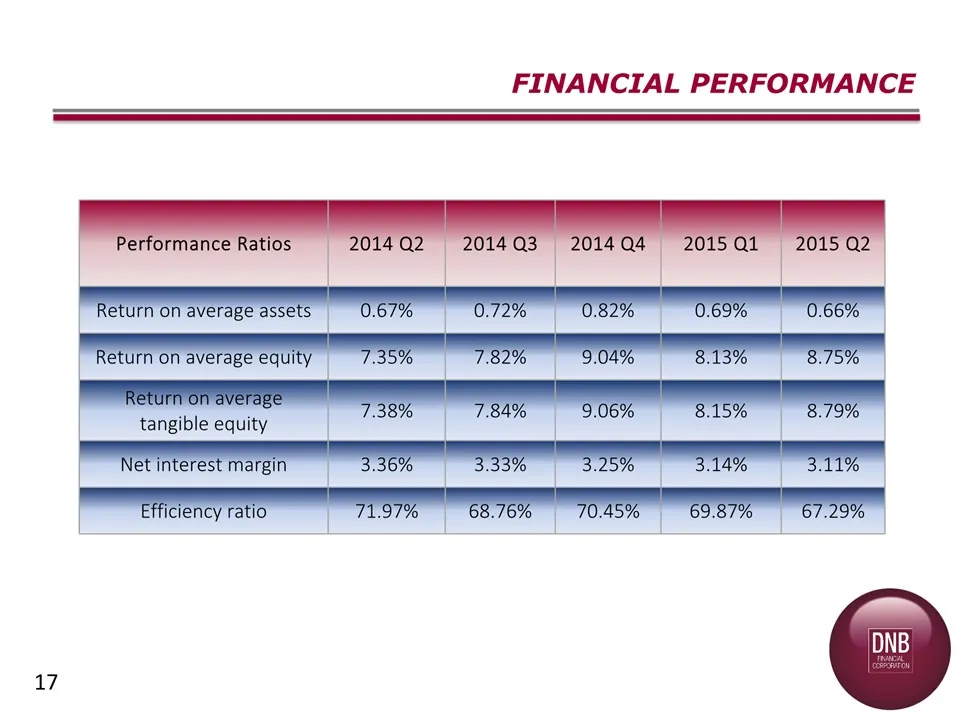
Performance Ratios 2014 Q2 2014 Q3 2014 Q4 2015 Q1 2015 Q2 Return on average assets 0.67% 0.72% 0.82% 0.69% 0.66% Return on average equity 7.35% 7.82% 9.04% 8.13% 8.75% Return on average tangible equity 7.38% 7.84% 9.06% 8.15% 8.79% Net interest margin 3.36% 3.33% 3.25% 3.14% 3.11% Efficiency ratio
Slide 18: Performance Ratios
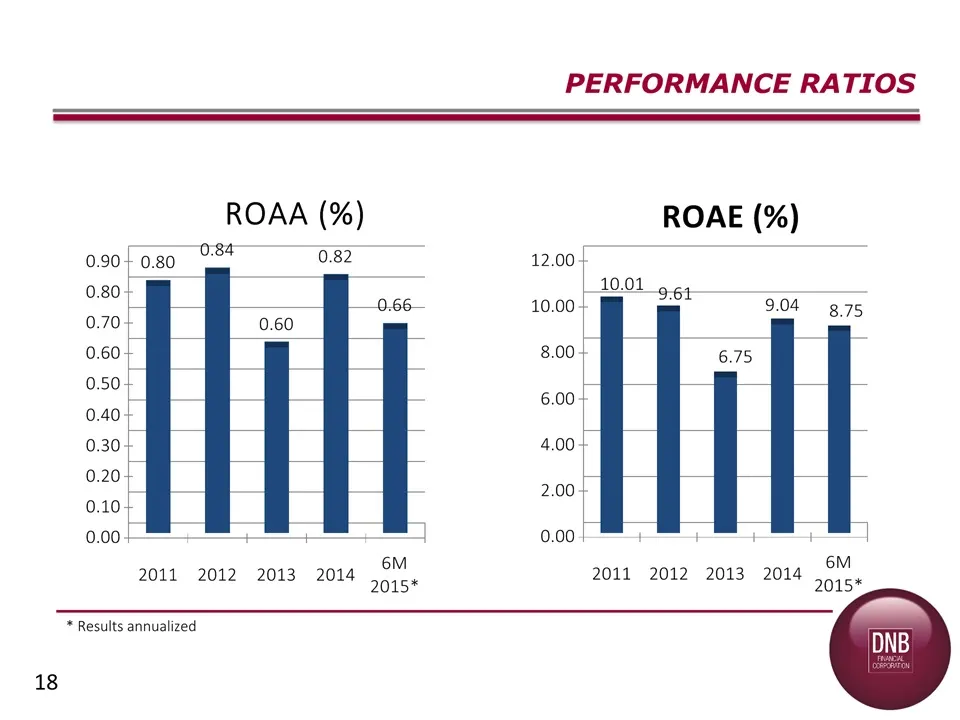
18 PERFORMANCE RATIOS * Results annualized
Slide 19: Performance Ratios: Efficiency Ratio
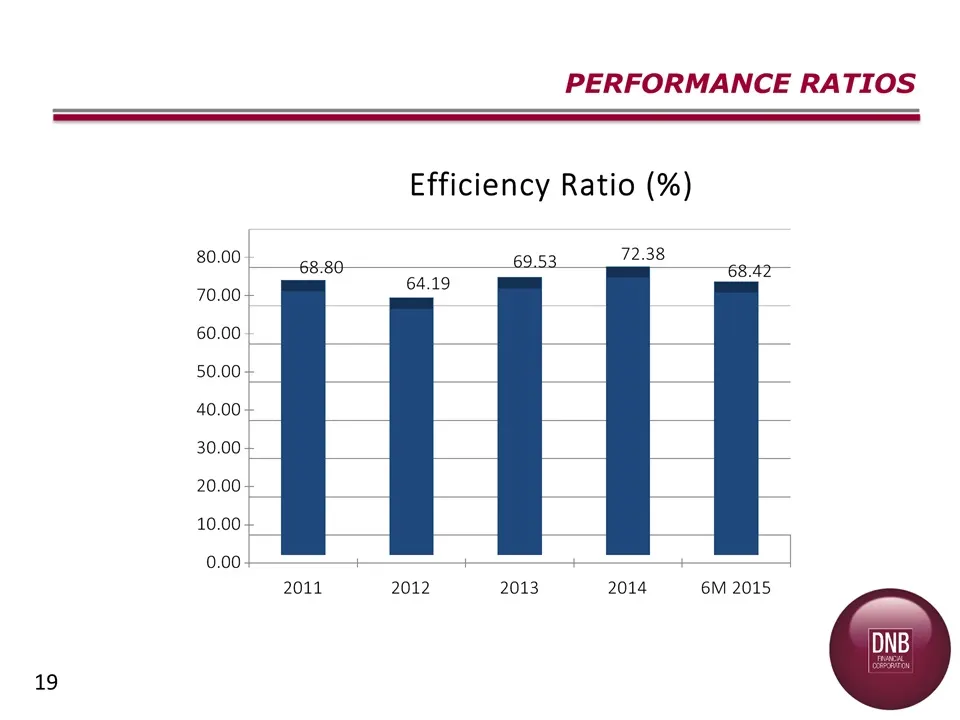
PERFORMANCE RATIOS Efficiency Ratio (%) 80.00 | ae 72.38 z0.00/ : 64.19 ans 60.00 | 50.00 40.00, 30.00. 20.00. 10.00. 0.00: ' ' ' ' 2011 2012 2013 2014 6M 2015
Slide 20: Asset Quality Ratios
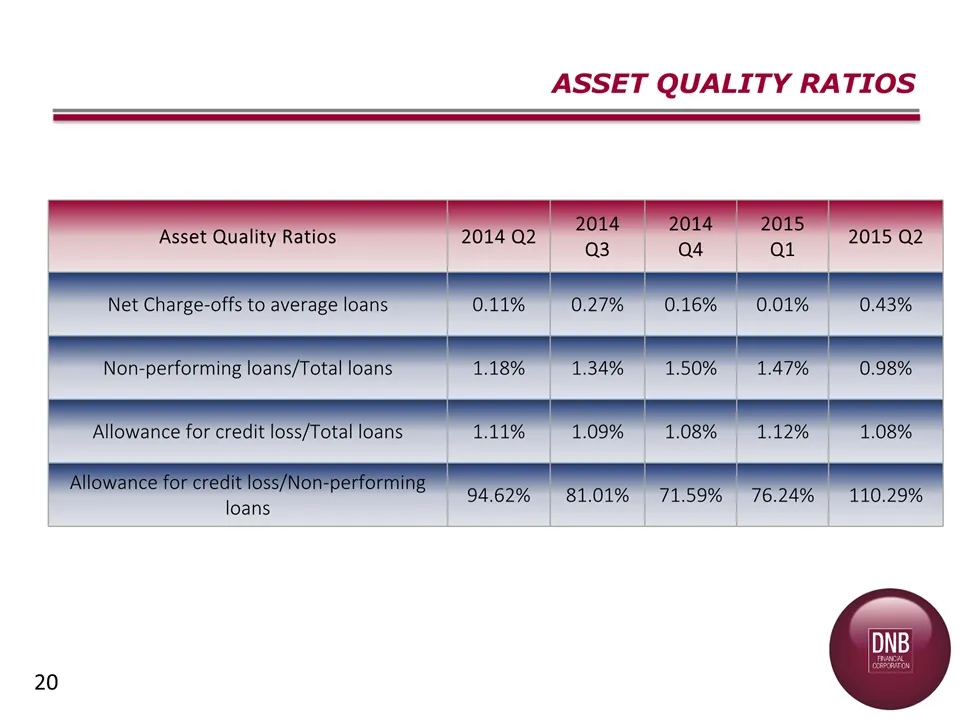
Asset Quality Ratios 2014 Q2 2014 Q3 2014 Q4 2015 Q1 2015 Q2 Net Charge-offs to average loans 0.11% 0.27% 0.16% 0.01% 0.43% Non-performing loans/Total loans 1.18% 1.34% 1.50% 1.47% 0.98% Allowance for credit loss/Total loans 1.11% 1.09% 1.08% 1.12% 1.08% Allowance for credit loss/Non-performing loan
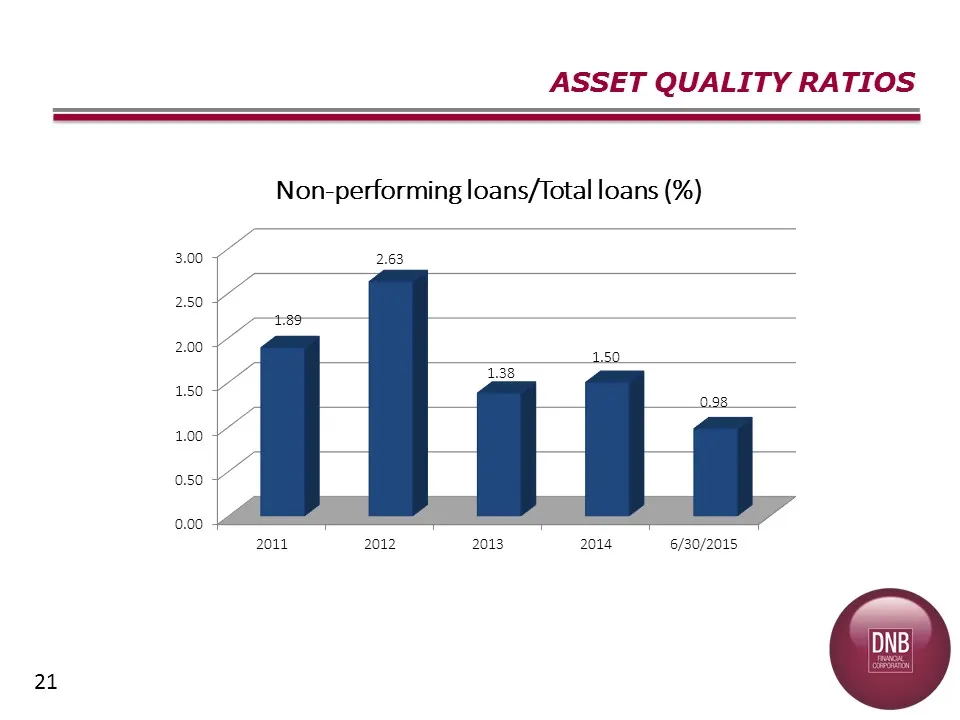
Slide 21: Asset Quality Ratios: Non-performing Loans
ASSET QUALITY RATIOS 21, Non-performing loans/Total loans (%) 3.00 2.50 2.00 1.50 1.00 0.50 0.00 2011 2012 2013 2014 6/30/2015
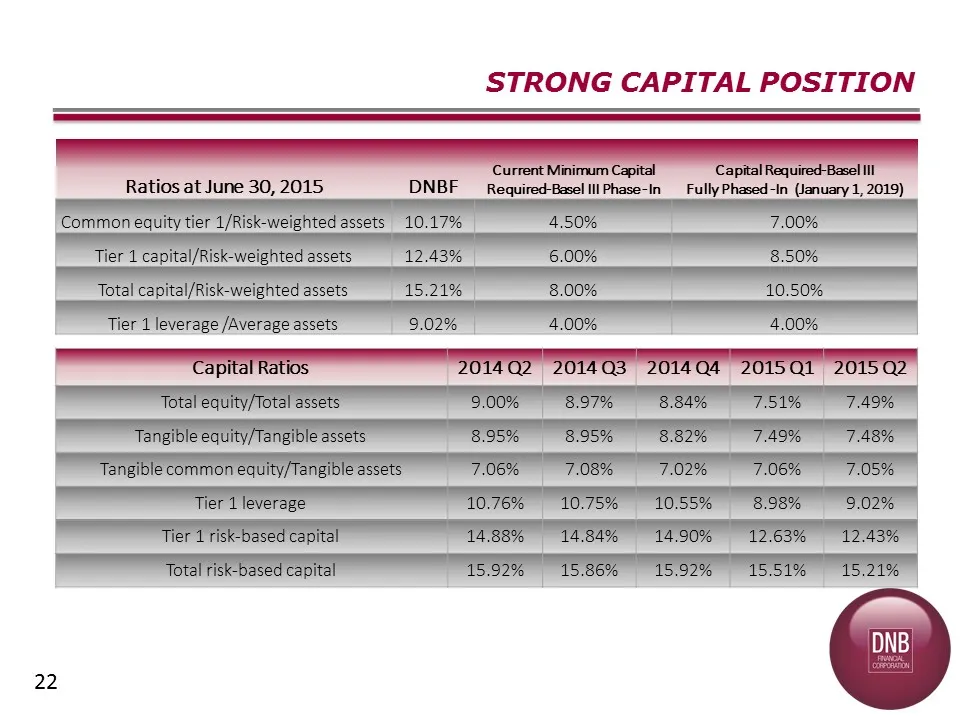
Slide 22: Strong Capital Position
Capital Ratios 2014 Q2 2014 Q3 2014 Q4 2015 Q1 2015 Q2 Total equity/Total assets 9.00% 8.97% 8.84% 7.51% 7.49% Tangible equity/Tangible assets 8.95% 8.95% 8.82% 7.49% 7.48% Tangible common equity/Tangible assets 7.06% 7.08% 7.02% 7.06% 7.05% Tier 1 leverage 10.76% 10.75% 10.55% 8.98% 9.02% Tier 1 ri
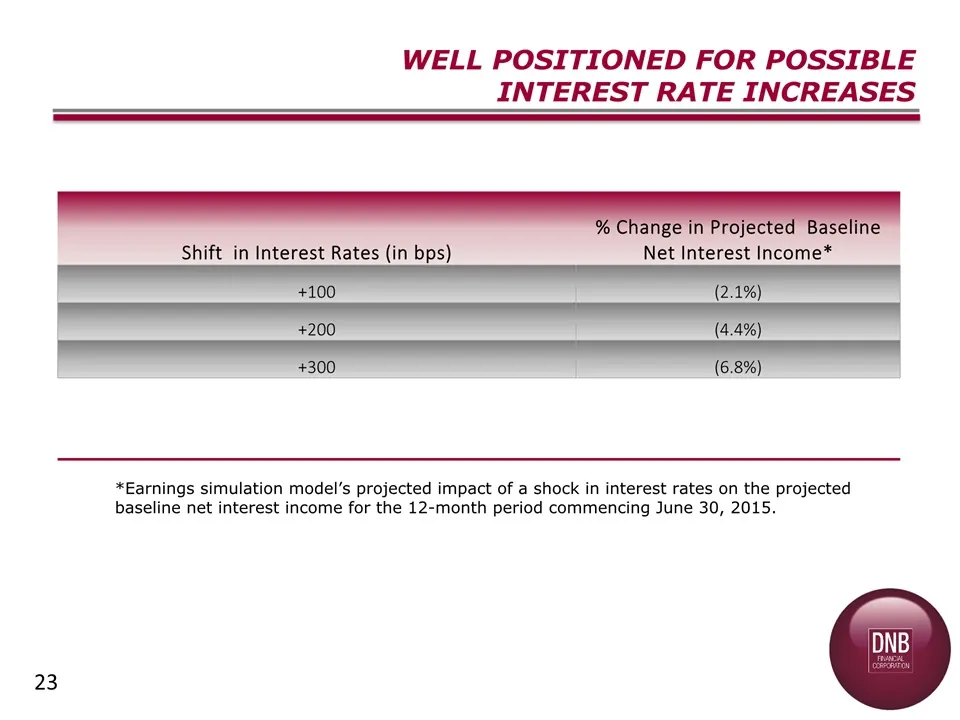
Slide 23: Well Positioned for Possible Interest Rate Increases
23 WELL POSITIONED FOR POSSIBLE INTEREST RATE INCREASES Shift in Interest Rates (in bps) % Change in Projected Baseline Net Interest Income* +100 (2.1%) +200 (4.4%) +300 (6.8%) *Earnings simulation model’s projected impact of a shock in interest rates on the projected baseline net interest income fo
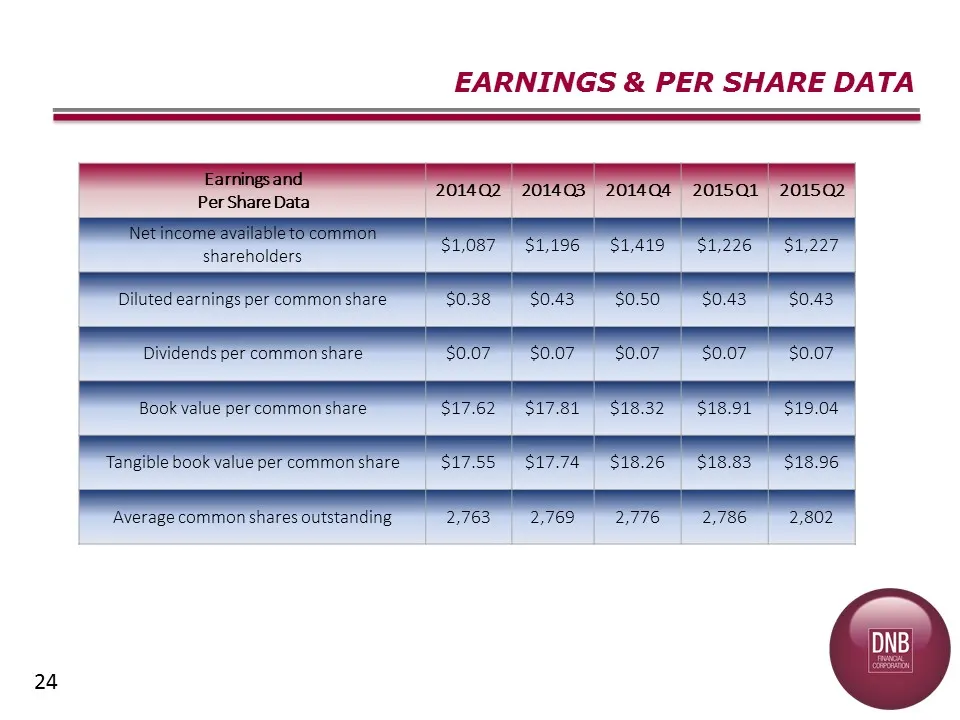
Slide 24: Earnings & Per Share Data
Earnings and Per Share Data 2014 Q2 2014 Q3 2014 Q4 2015 Q1 2015 Q2 Net income available to common shareholders $1,087 $1,196 $1,419 $1,226 $1,227 Diluted earnings per common share $0.38 $0.43 $0.50 $0.43 $0.43 Dividends per common share $0.07 $0.07 $0.07 $0.07 $0.07 Book value per common share $17.
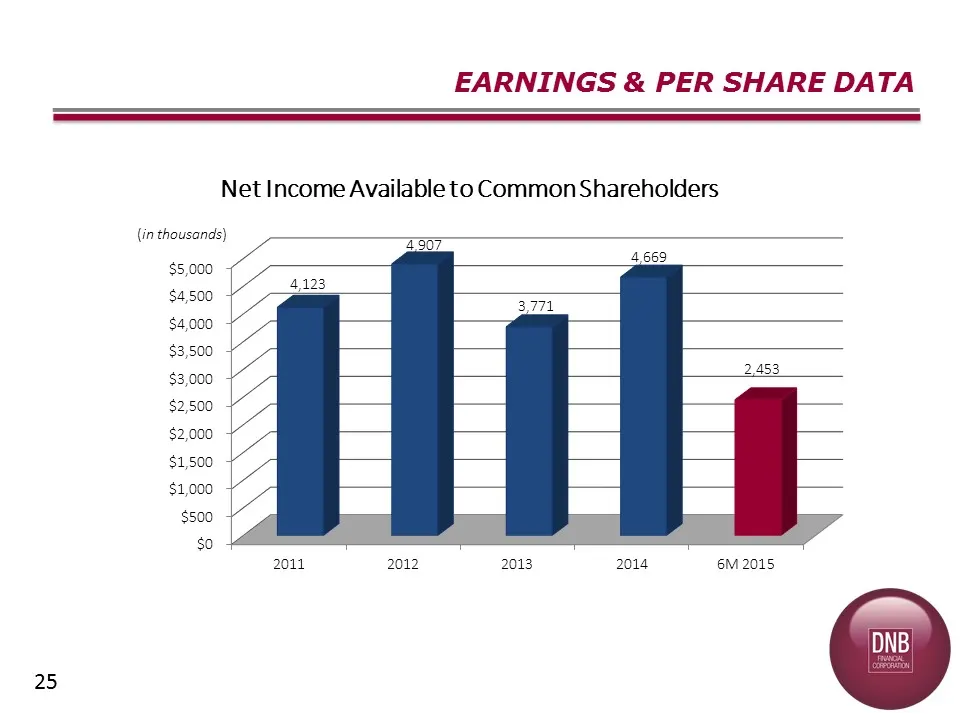
Slide 25: Earnings & Per Share Data: Net Income
EARNINGS & PER SHARE DATA 25 (in thousands) $5,000 $4,500 $4,000 $3,500 $3,000 $2,500 $2,000 $1,500 $1,000 $500 $0 Net Income Available to Common Shareholders 2307 2011 2012 2013 2014 6M 2015
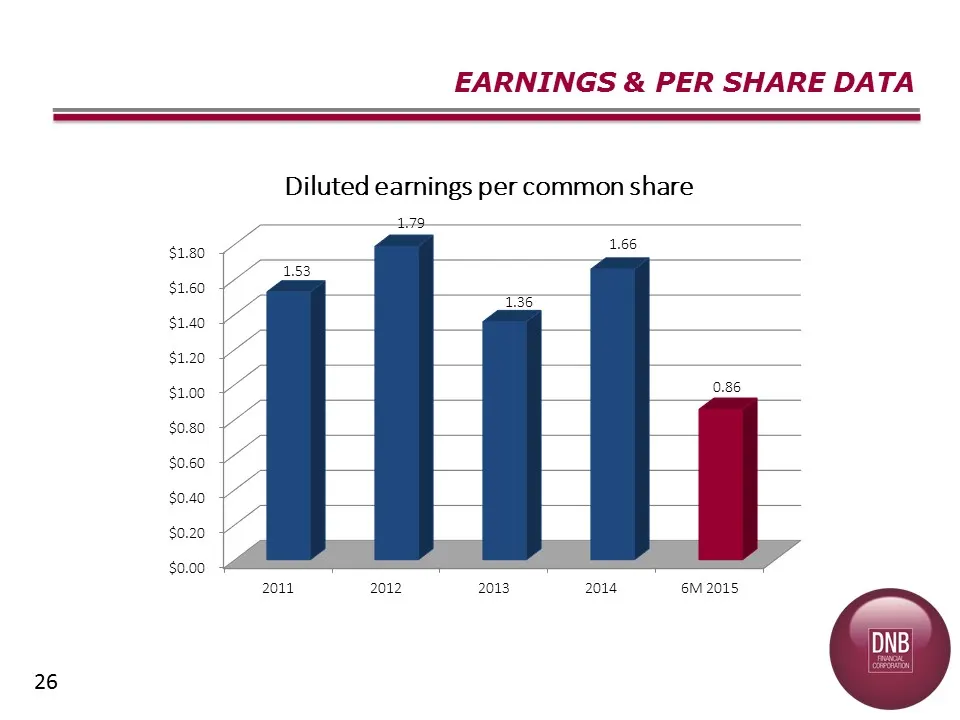
Slide 26: Earnings & Per Share Data: Diluted EPS
26 $1.80 $1.60 $1.40 $1.20 $1.00 $0.80 $0.60 $0.40 $0.20 $0.00 EARNINGS & PER SHARE DATA Diluted earnings per common share 1.79 2011 2012 2013 2014 6M 2015
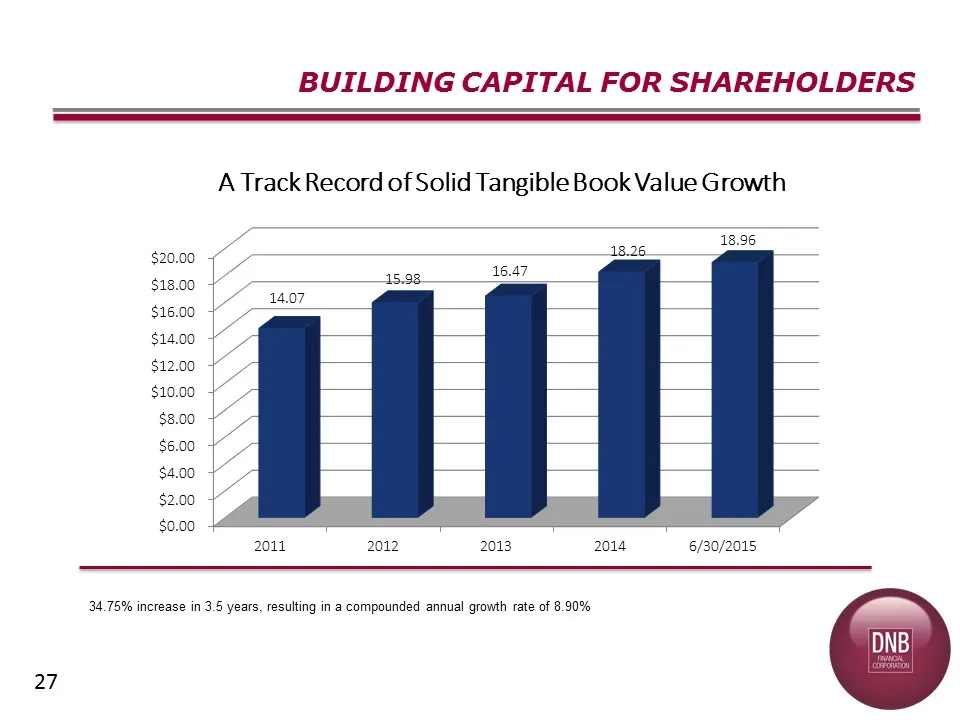
Slide 27: Building Capital for Shareholders
27 BUILDING CAPITAL FOR SHAREHOLDERS 34.75% increase in 3.5 years, resulting in a compounded annual growth rate of 8.90%
Slide 28: Appendix
Appendix
Slide 29: Appendix Contents
29 Selected Financial Data (Pages 30-32)Fee Income (Pages 33-36)Experienced Management and Board Leadership (Pages 37-43) Invest in DNB Financial (Pages 44-47) APPENDIX
Slide 30: Selected Financial Data
Selected Financial Data 30
Slide 31: Selected Financial Data - Quarterly
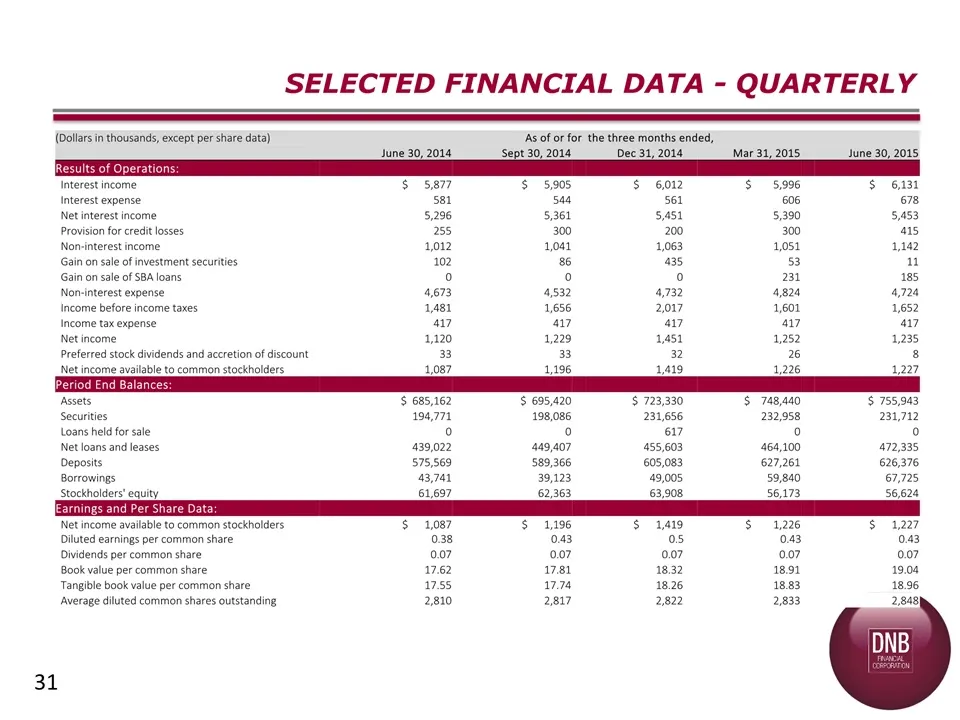
31 SELECTED FINANCIAL DATA - QUARTERLY (Dollars in thousands, except per share data) As of or for the three months ended, June 30, 2014 Sept 30, 2014 Dec 31, 2014 Mar 31, 2015 June 30, 2015 Results of Operations: Interest income $ 5,877 $ 5,905 $ 6,012 $ 5,996 $ 6,131 Interest expense 581 544 561 60
Slide 32: Selected Financial Data - Quarterly (Ratios)
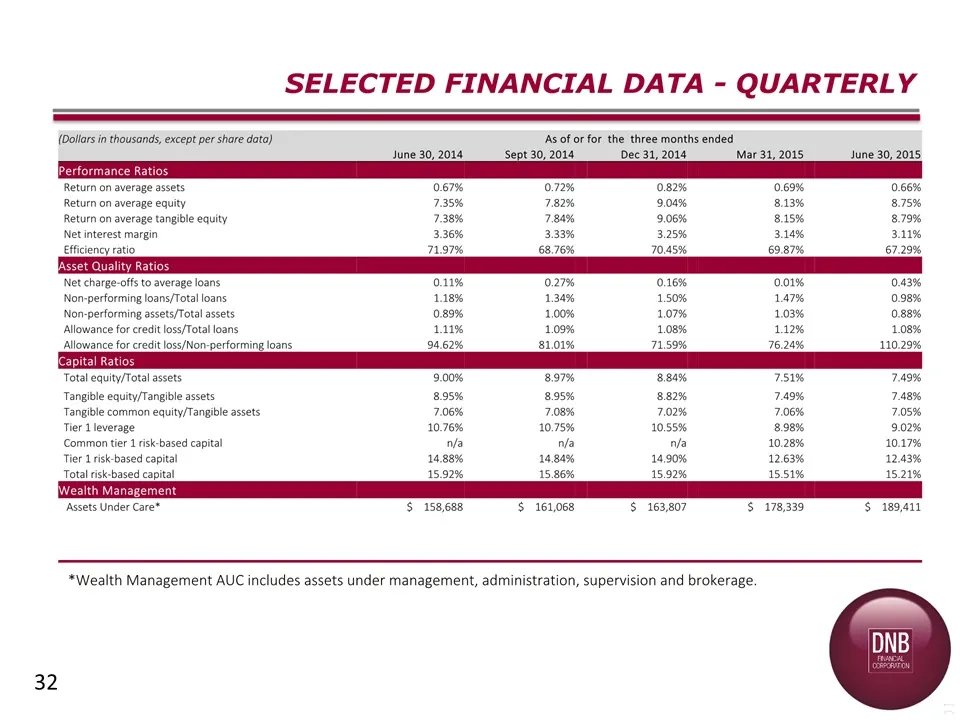
32 SELECTED FINANCIAL DATA - QUARTERLY (Dollars in thousands, except per share data) As of or for the three months ended June 30, 2014 Sept 30, 2014 Dec 31, 2014 Mar 31, 2015 June 30, 2015 Performance Ratios Return on average assets 0.67% 0.72% 0.82% 0.69% 0.66% Return on average equity 7.35% 7.82%
Slide 33: Fee Income
Fee Income 33
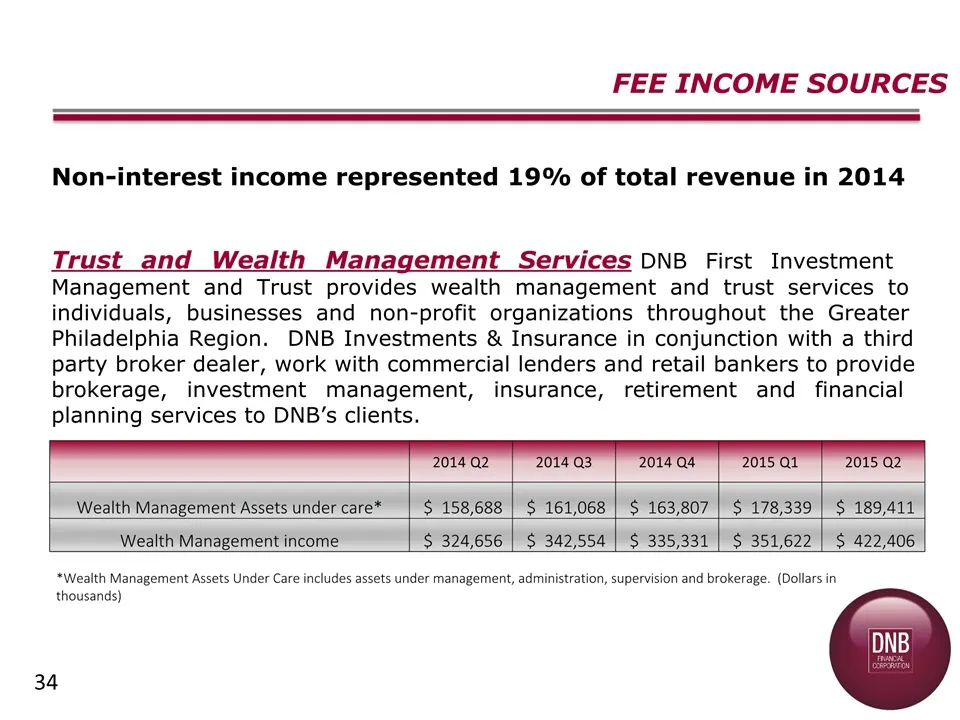
Slide 34: Fee Income Sources: Trust and Wealth Management
34 Fee Income Sources Non-interest income represented 19% of total revenue in 2014Trust and Wealth Management Services DNB First Investment Management and Trust provides wealth management and trust services to individuals, businesses and non-profit organizations throughout the Greater Philadelphia R
Slide 35: Fee Income Sources: Mortgage Banking and SBA Loans
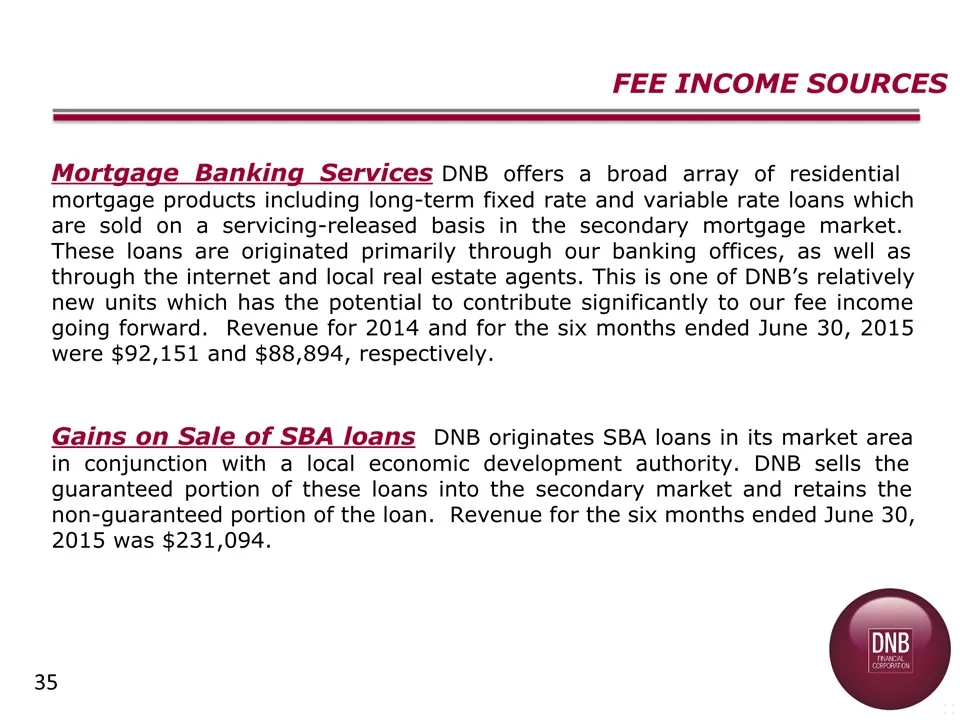
35 Fee Income Sources Mortgage Banking Services DNB offers a broad array of residential mortgage products including long-term fixed rate and variable rate loans which are sold on a servicing-released basis in the secondary mortgage market. These loans are originated primarily through our banking off
Slide 36: Fee Income Sources: Other Fee Income Areas
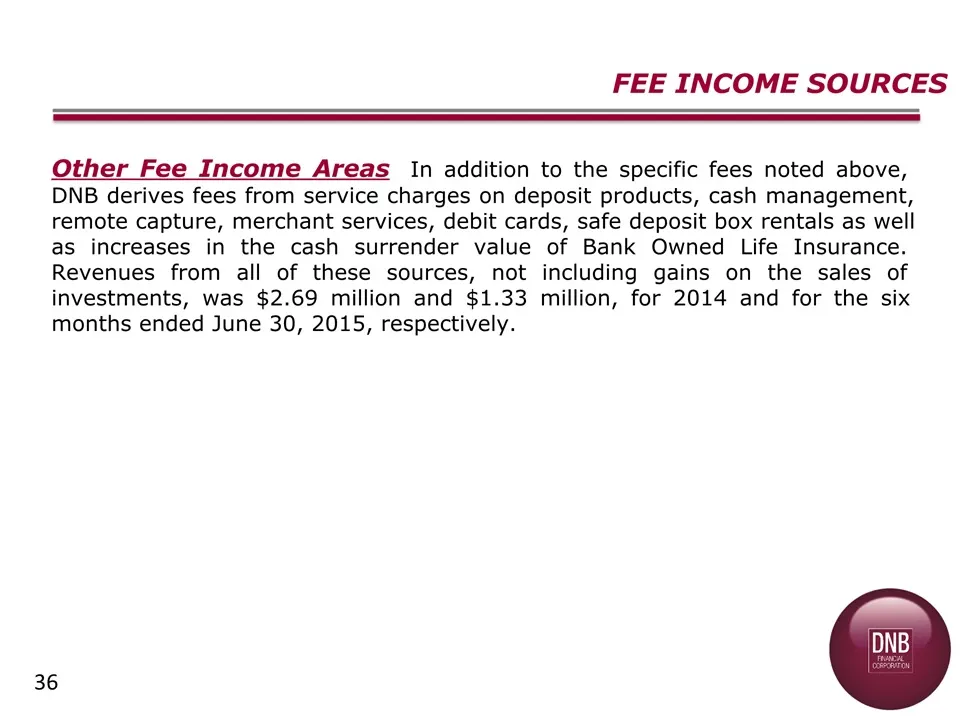
36 Fee Income Sources Other Fee Income Areas In addition to the specific fees noted above, DNB derives fees from service charges on deposit products, cash management, remote capture, merchant services, debit cards, safe deposit box rentals as well as increases in the cash surrender value of Bank Own
Slide 37: Experienced Management and Board Leadership
Experienced Management and Board Leadership 37
Slide 38: Management Team and Directors
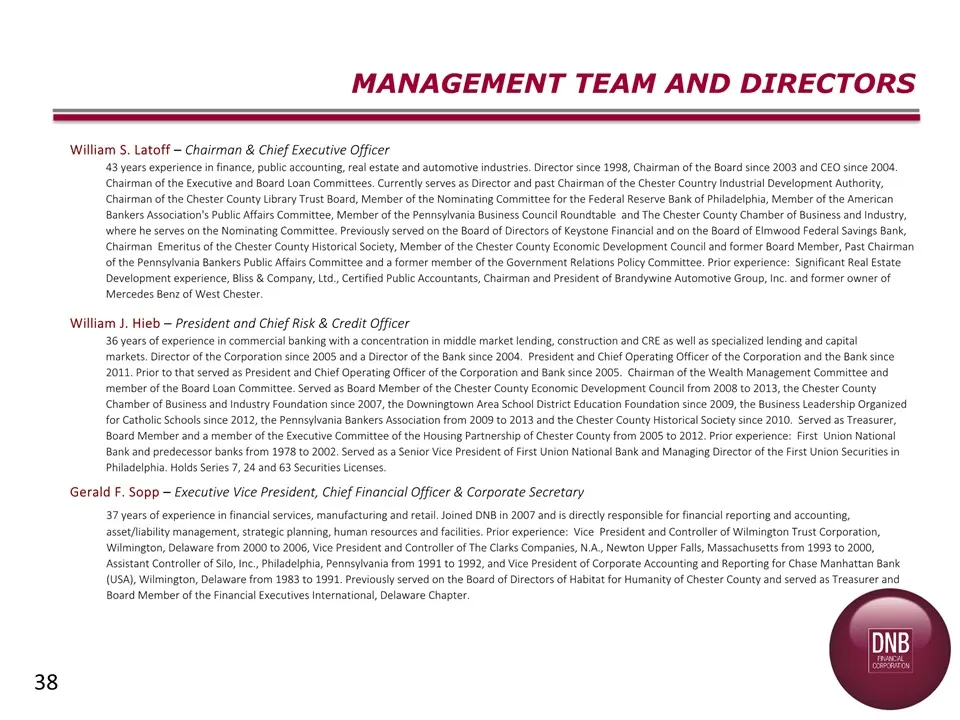
38 MANAGEMENT TEAM AND DIRECTORS William S. Latoff – Chairman & Chief Executive Officer43 years experience in finance, public accounting, real estate and automotive industries. Director since 1998, Chairman of the Board since 2003 and CEO since 2004. Chairman of the Executive and Board Loan Committe
Slide 39: Management Team and Directors
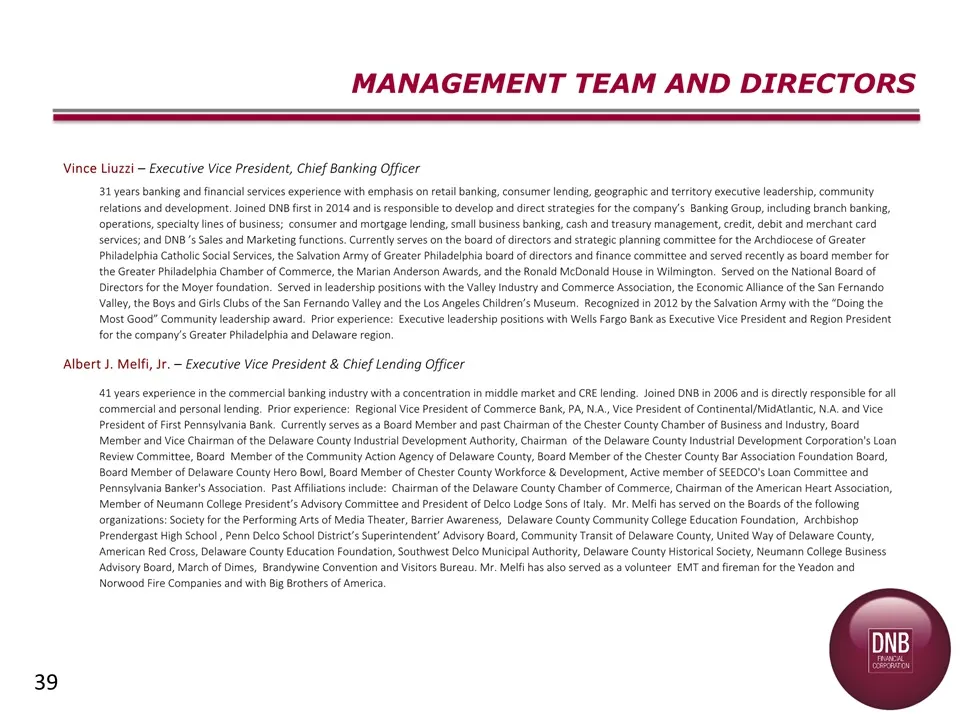
39 MANAGEMENT TEAM AND DIRECTORS Vince Liuzzi – Executive Vice President, Chief Banking Officer 31 years banking and financial services experience with emphasis on retail banking, consumer lending, geographic and territory executive leadership, community relations and development. Joined DNB first i
Slide 40: Management Team and Directors
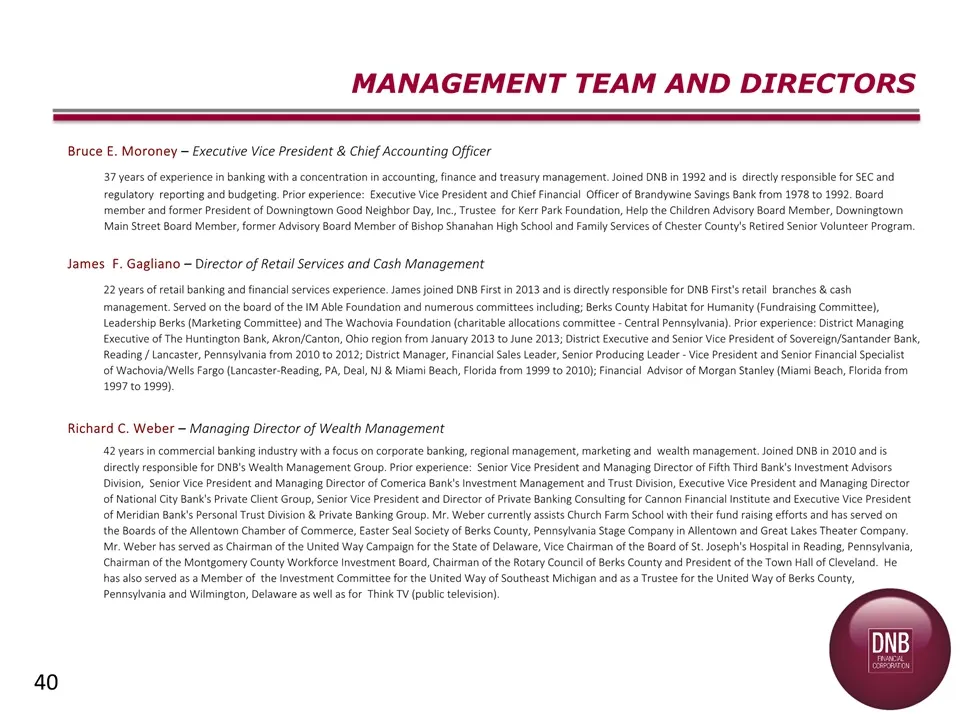
40 MANAGEMENT TEAM AND DIRECTORS Bruce E. Moroney – Executive Vice President & Chief Accounting Officer 37 years of experience in banking with a concentration in accounting, finance and treasury management. Joined DNB in 1992 and is directly responsible for SEC and regulatory reporting and budgeting
Slide 41: Management Team and Directors
41 MANAGEMENT TEAM AND DIRECTORS Frank S. Monterosso – Senior Vice President of Operations 25 years of experience in operations management with a concentration in electronic commerce, payment solutions and banking. Joined DNB in 2008 and is directly responsible for IT and deposit operations. Prior e
Slide 42: Management Team and Directors
42 MANAGEMENT TEAM AND DIRECTORS James R. Biery –Director Director since January 2014 and he currently serves on the Benefits & Compensation, Audit, and Nominating & Corporate Governance Committees. Mr. Biery is the former President and CEO of the Pennsylvania Bankers Association (PBA), a position h
Slide 43: Management Team and Directors
43 MANAGEMENT TEAM AND DIRECTORS Mildred C. Joyner –Director Director since 2004 and currently is a member of the Wealth Management, Nominating & Corporate Governance and Audit Committees. Ms. Joyner has been the President of MCJ Consultants since January 2011 and was an Emeritus Director and Profes
Slide 44: Invest in DNB Financial
Invest in DNB Financial 44
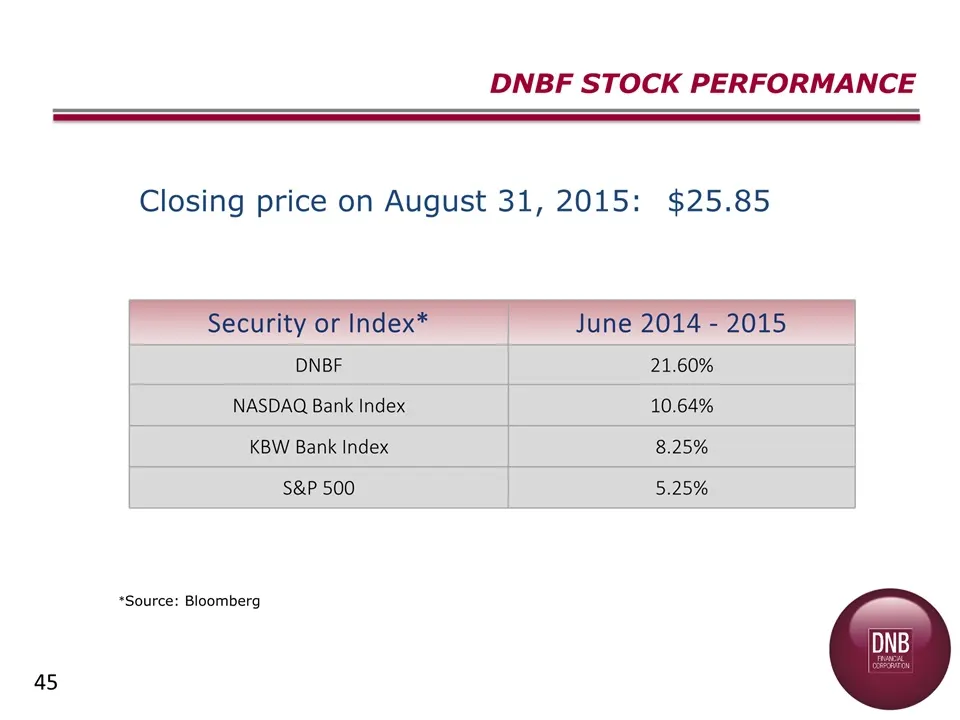
Slide 45: DNBF Stock Performance
Security or Index* June 2014 - 2015 DNBF 21.60% NASDAQ Bank Index 10.64% KBW Bank Index 8.25% S&P 500 5.25% Closing price on August 31, 2015: $25.85 *Source: Bloomberg 45 DNBF STOCK PERFORMANCE
Slide 46: Investor Relations Contact
46 Gerald F. Sopp, EVP and CFO484.359.3138gsopp@dnbfirst.comhttp://investors.dnbfirst.com/ INVESTOR RELATIONS CONTACT For more information, Investors may contact:
Slide 47: Thank You
THANK YOU 47
Source: SEC EDGAR · 8-K filed Sep 23, 2015
More decks from DNB Financial Corporation
 Investor Presentation (August 2018)32 slides · Aug 7, 2018
 Shareholder Meeting (April 2016)31 slides · Apr 27, 2016
 Merger or Acquisition (April 2016)23 slides · Apr 5, 2016
 Investor Presentation (September 2014)42 slides · Sep 2, 2014
 Investor Presentation (March 2014)59 slides · Mar 5, 2014
 Investor Presentation (August 2013)59 slides · Aug 21, 2013