DNB Financial — Investor Presentation (September 2014)
42 slides from DNB Financial's investor presentation, Sep 2, 2014

Slide 1: DNB Financial Corporation Investor Overview Presentation
DNB Financial Corporation Investor Overview Presentation Summer 2014
Slide 2: Forward-looking statements & additional information
Forward-looking statements: Certain statements contained in this presentation are forward-looking in nature. These include all statements about DNB's plans, objectives, expectations and other statements that are not historical facts, and usually use words such as "expect," "anticipate," "believe" an
Slide 3: Table of Contents
I. Corporate Overview/Compelling Investment Opportunity (Pages 4-7) II. Strong Market Drives Opportunity (Pages 8-19) III. Consistent Performance, Stable Growth & Financial Trends (Pages 20-31) IV. Experienced Management and Board Leadership (Pages 32-38) V. Invest in DNBF (Pages 39-42) TABLE OF CON
Slide 4: Corporate Overview
CORPORATE OVERVIEW Founded: 1860, The oldest National Bank in the greater Philadelphia Region Headquarters: Downingtown, Chester County, Pennsylvania NASDAQ Ticker: DNBF Total Assets: $685 million Deposits: $576 million Total Equity: $62 million Branch Offices: 13 Share Price: $21.25 ($22.00 as of A
Slide 5: Compelling Investment Opportunity
COMPELLING INVESTMENT OPPORTUNITY Snapshot June 30, 2014 • High quality footprint, serving growing, diversified and affluent markets in Chester and Delaware Counties, Pennsylvania • Book value per share has grown from $16.18 in 2Q 2013 to $17.62 in 2Q • High level of low cost core deposits: Cost of
Slide 6: Compelling Investment Opportunity
COMPELLING INVESTMENT OPPORTUNITY • Well capitalized, highly liquid, with clean, conservative balance sheet • Well positioned to grow to $1 billion-plus in assets • Strong Market Demographics • Favorable loan and low cost deposit trends • Proven management team generating results since 2007 • Histor
Slide 7: Key Initiatives & Milestones
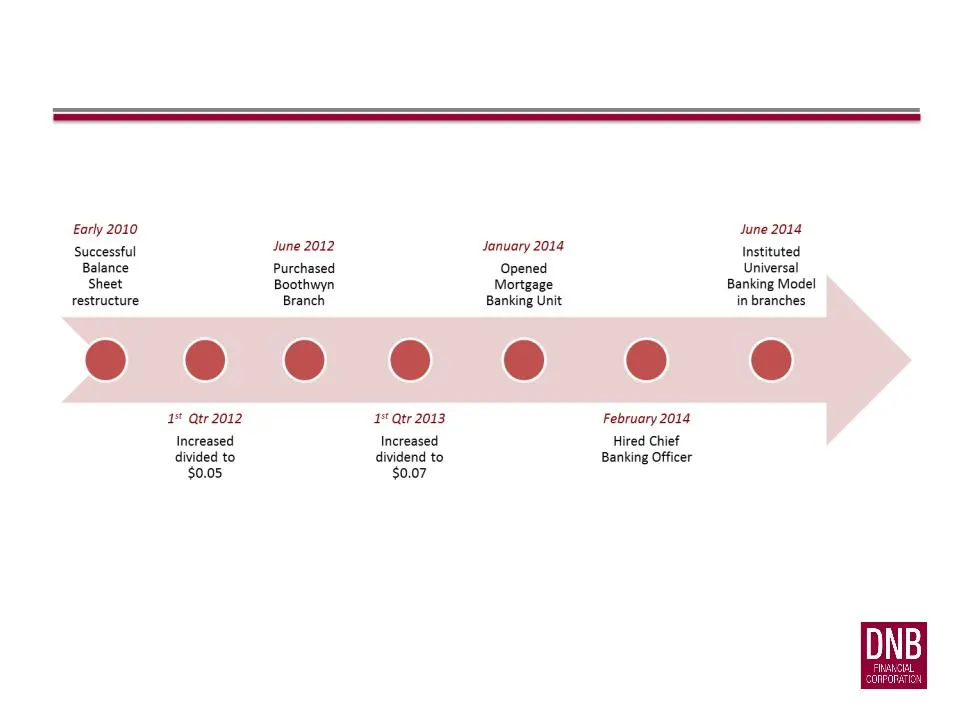
KEY INITIATIVES & MILESTONES

Slide 8: Strong Market Drives Opportunity
Strong Market Drives Opportunity
Slide 9: Established Presence in Attractive Southeastern Pennsylvania Market
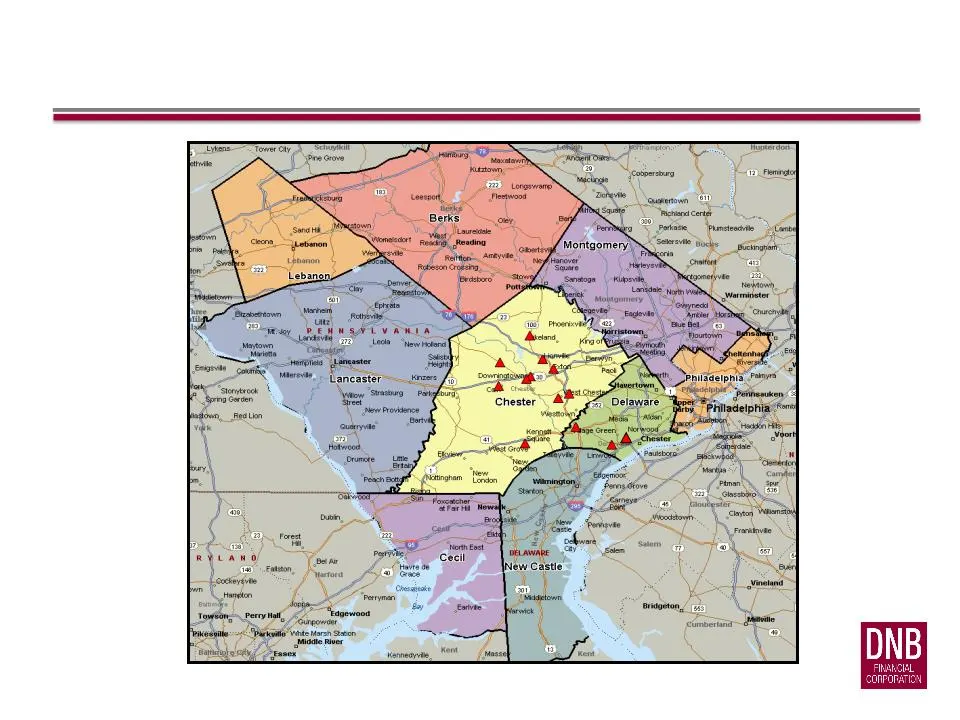
ESTABLISHED PRESENCE IN ATTRACTIVE SOUTHEASTERN PENNSYLVANIA MARKET
Slide 10: Banking Market Overview
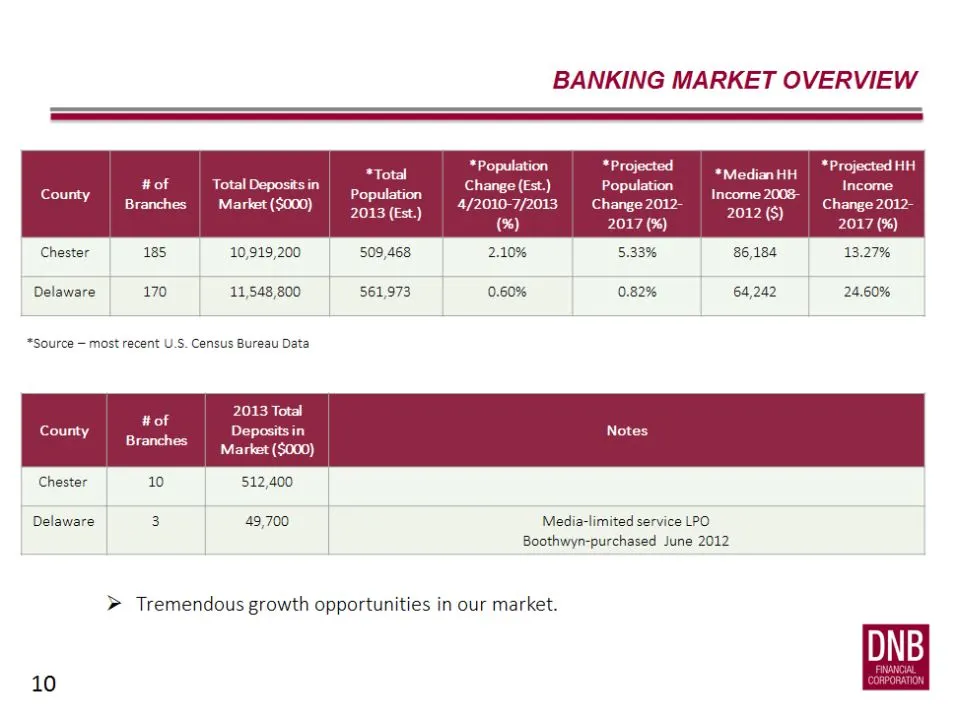
BANKING MARKET OVERVIEW *Population *Projected *Projected HH *Total *Median HH #of | Total Deposits in Change (Est.) Population Income Gy) | pe || Se Sen 4/2010-7/2013 | Change 2012- ears an Change 2012- : (%) 2017 (%) ~ 2017 (%) Chester 185 10,919,200 509,468 2.10% 5.33% 86,184 13.27% Delaware 170
Slide 11: Market Overview and Demographics
MARKET OVERVIEW AND DEMOGRAPHICS Largest Market: Chester County, PA • Fast Growing: Population (est.) 509,468 in 2013, representing an increase of 10,582 from the 2010 Census (2014 data not available) • Most Affluent County in PA: Median Household Income is $86,184, significantly above U.S. average
Slide 12: Growing Banking Presence: Delaware County, PA
Growing Banking Presence: Delaware County, PA • Population (est.) 561,098 in 2013, representing an increase of 2,994 from the 2010 Census (2014 data not available) • Median Household Income is $64,242, above U.S. average of $51,371 • Fifth most populous county in the state of PA, conducive for expan
Slide 13: Strategy to Serve Our Markets and Grow
• Continue to attract low cost core deposits • Grow fee revenue as a percentage of total revenues by investing in new business lines, building full client relationships and maximizing significant untapped cross-sell potential • Build relationship banking in retail and commercial while providing a co
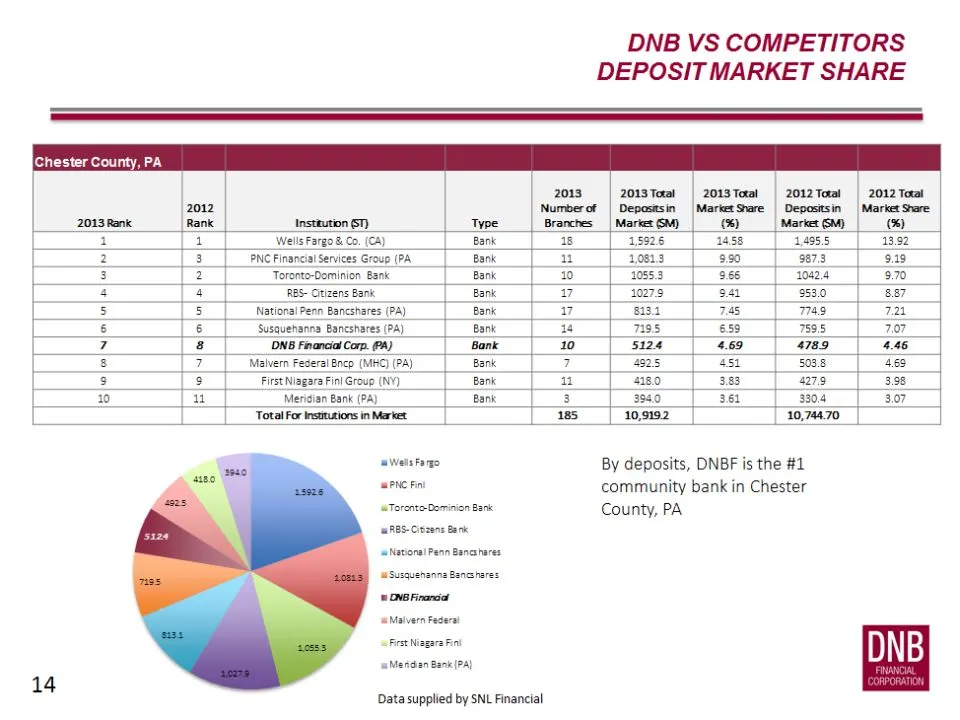
Slide 14: DNB vs Competitors
DNB VS COMPETITORS DEPOSIT MARKET SHARE Chester County, PA 2013 | 2013 Taal 2013 Total «=—«-2012 Txal | 2012 Total 2012 Numberof | Depositsin Market Share Depositsin | Market Snare: 2013 Rank Rank 0 Type Branches | Market SM) cy Market 6M) Cy 1 1 Wells Fargo & Co. (CA) Bank 38 15926 1658 1.4955 1392
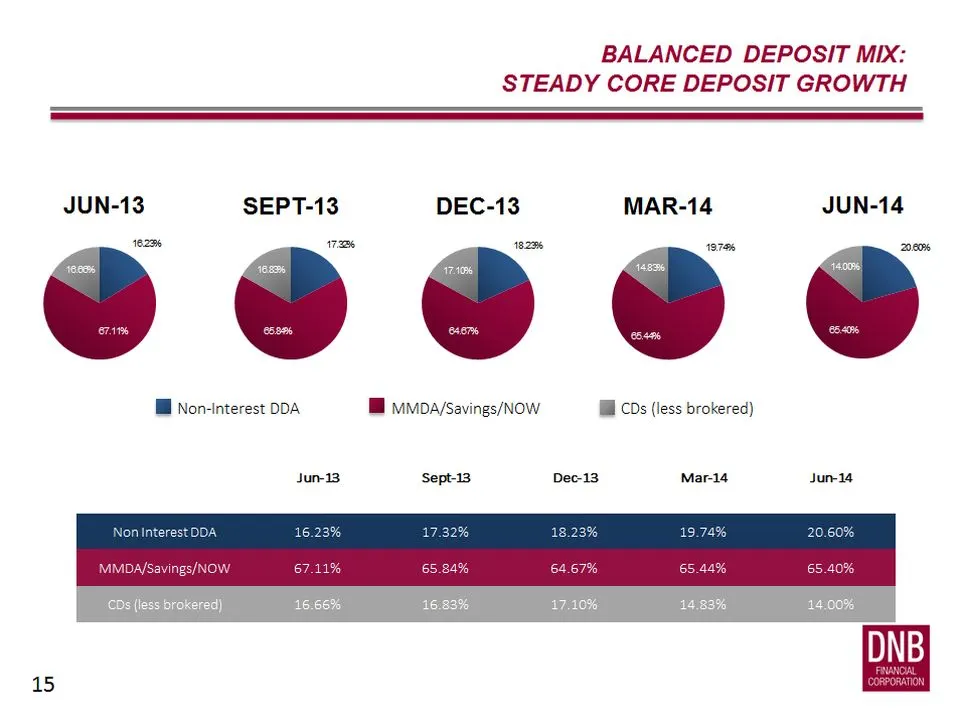
Slide 15: Balanced Deposit Mix: Steady Core Deposit Growth
BALANCED DEPOSIT MIX: STEADY CORE DEPOSIT GROWTH JUN-13 SEPT-13 DEC-13 MAR-14 JUN-14 16236 1% 326 13796 Hl Non-interest DDA 1 mpa/Sevings/NOW i CDs (less brokered) Jun-13 Sept-13 Dec-13 Mar-14 Jun Ds (less brokered) 15
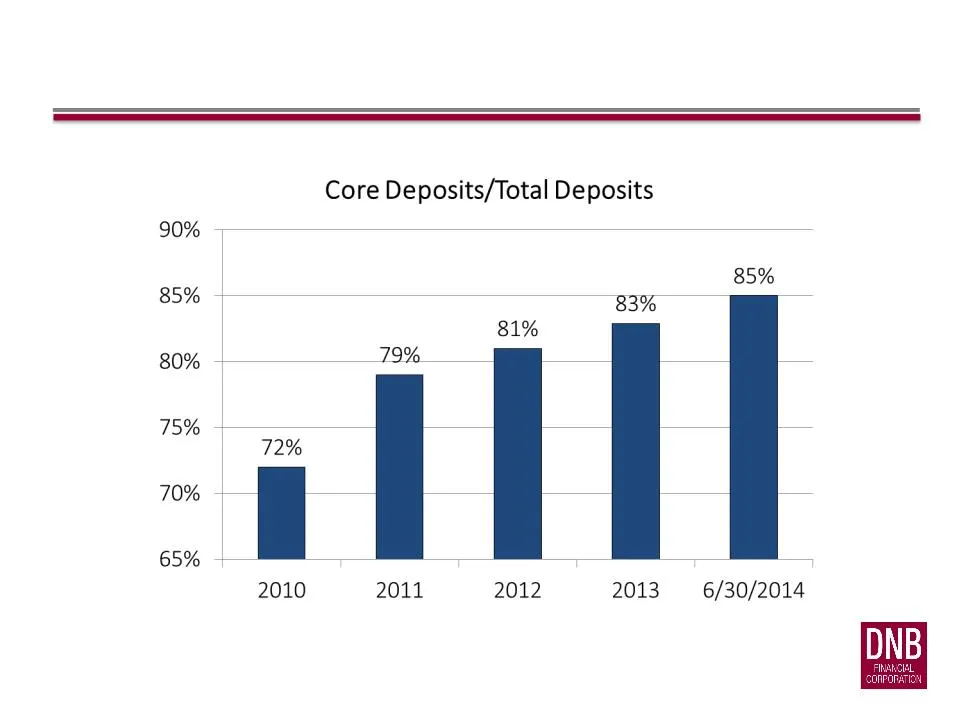
Slide 16: High Level of Low Cost Core Deposits
HIGH LEVEL OF LOW COST CORE DEPOSITS Core Deposits includes: Demand Deposit, NOW , MMDA & Savings (excludes CD’s)
Slide 17: Detailed Loan Portfolio Composition
Loan Type $ Balance Percent Commercial RE OO 87,740 19.99% Commercial RE NOO 90,025 20.51% Residential 1-4 67,265 15.32% Commercial & Industrial 55,987 12.75% Residential 5+ 33,213 7.57% SBA/USDA Guaranteed 32,281 7.35% Construction 24,051 5.48% Home Equity LOC 25,614 5.83% Municipal/Govt/Non-Profit
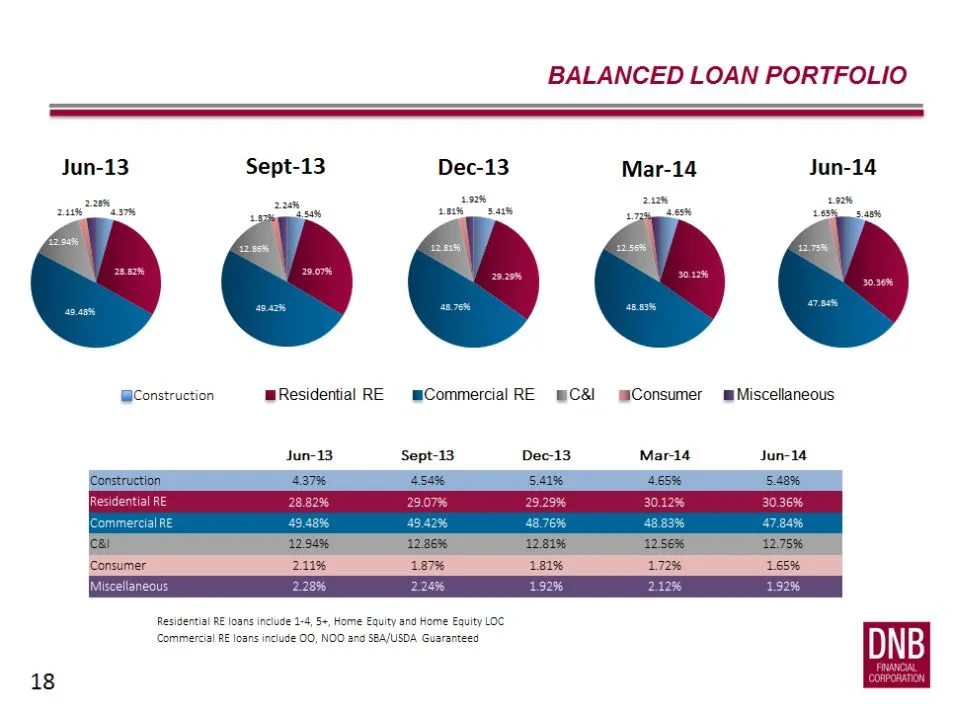
Slide 18: Balanced Loan Portfolio
BALANCED LOAN PORTFOLIO Jun-13 Sept-13 Dec-13 Mar-14 Jun-14 2a aay gee a san pees arie WConstruction Residential RE mCommercial RE mC&l Consumer Miscellaneous Jun-13, Sept-13 Dec-13 Mar-14 Jun-14 Residential RE loans include 1-4, 5+, Home Equity and Home Equity LOC ‘Commercial RE loans include 00, N
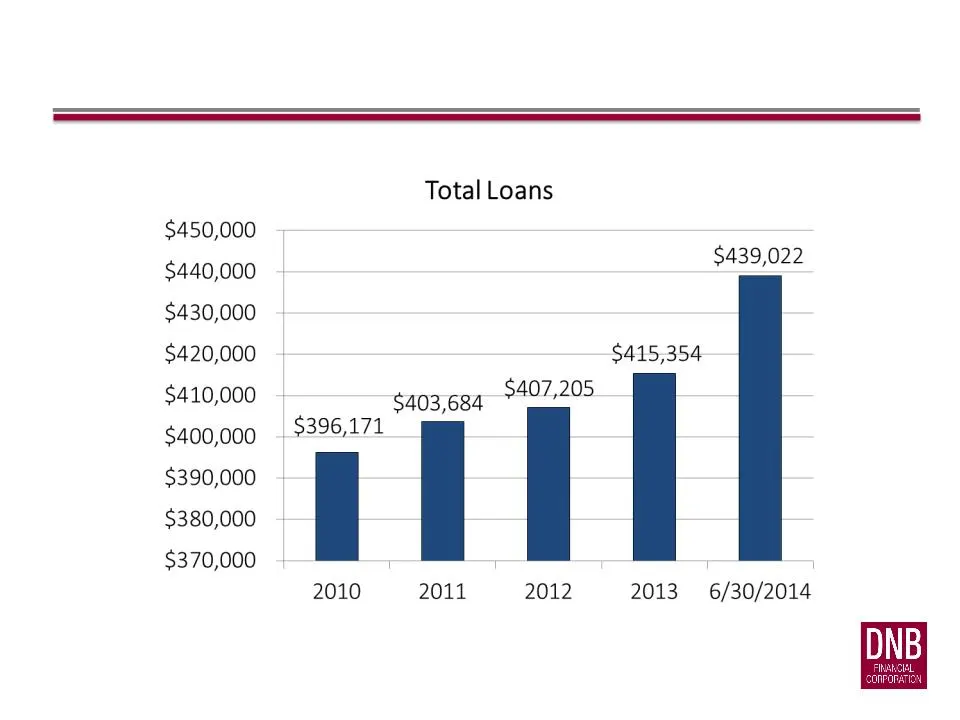
Slide 19: Total Loans 2010-2014
$450,000 $440,000 $430,000 $420,000 $410,000 $400,000 $390,000 $380,000 $370,000 $396,171 2010 Total Loans $403,684 2011 $407,205 2012 $415,354 2013 $439,022 6/30/2014

Slide 20: DNB's Financial Strength, Consistent Performance, Stable Growth and Financial Trends
DNB’s Financial Strength, Consistent Performance, Stable Growth and Financial Trends
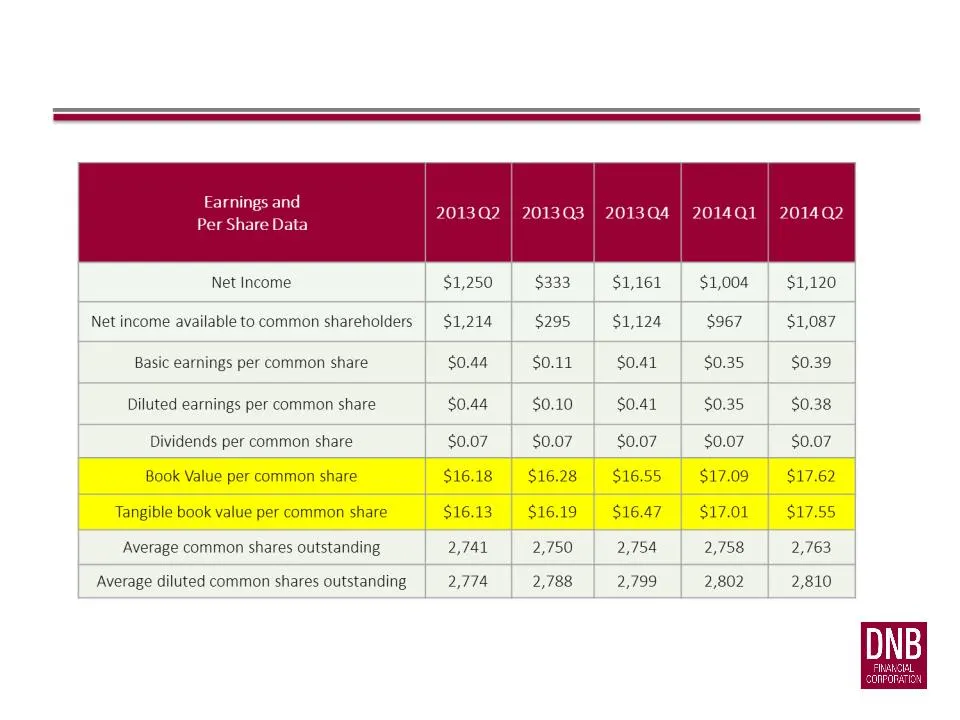
Slide 21: Earnings and Per Share Data
Earnings and Per Share Data 2013Q2 | 201303 | 20134 | 2014Q1 | 201402 Net Income $1,250 | $333 | $1,161 | $1,004 | $1,120 Net income available to common shareholders | $1,214 $295 $1,124 $967 $1,087 Basic earnings per common share $0.44 | $0.11 $0.41 $0.35 $0.39 Diluted earnings per common share $0.
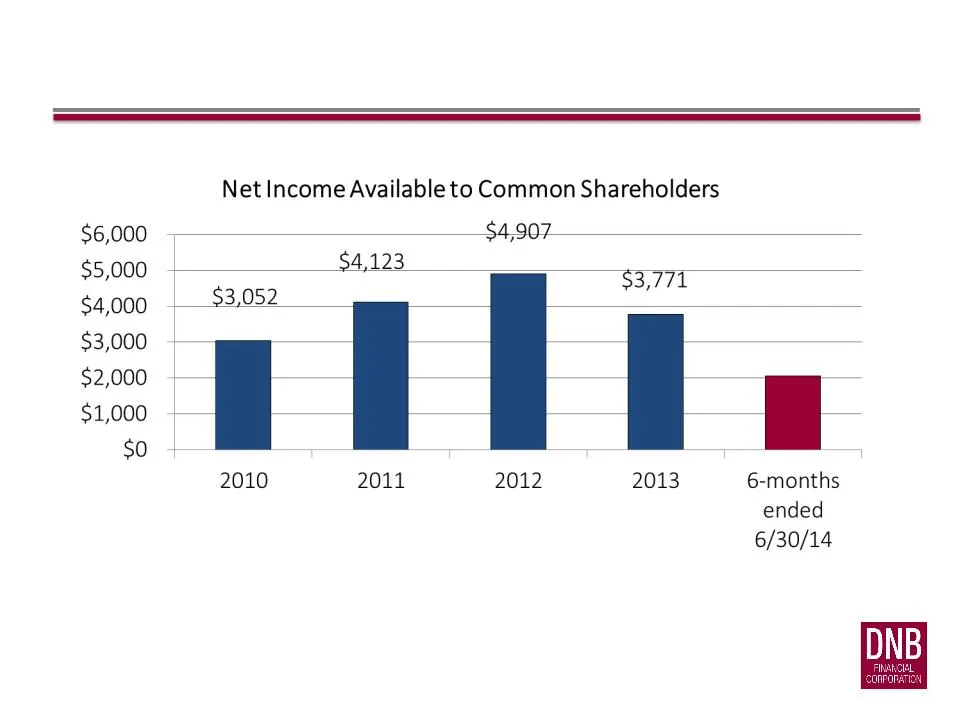
Slide 22: Earnings & Per Share Data
EARNINGS & PER SHARE DATA $2,054
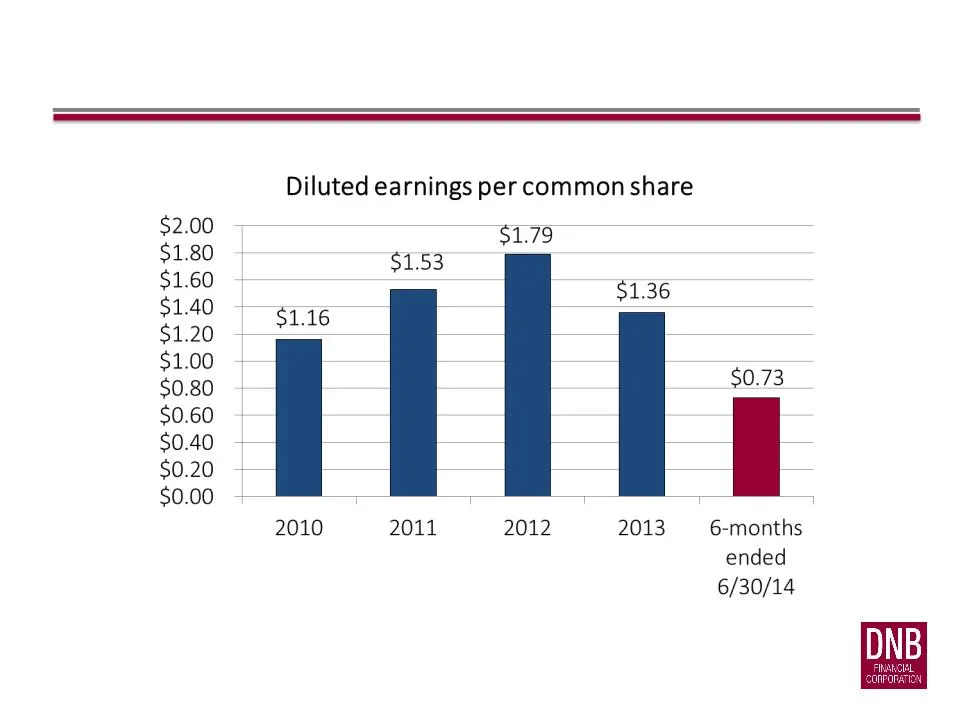
Slide 23: Diluted earnings per common share
Diluted earnings per common share $2.00 $1.79 $1.80 $153 $1.60 $1.36 $1.40 = 1.16 $1.20 $ $1.00 $0.80 $0.73 $0.60 $0.40 -— $0.20 -— $0.00 T T 2010 2011 2012 2013 6-months ended 6/30/14
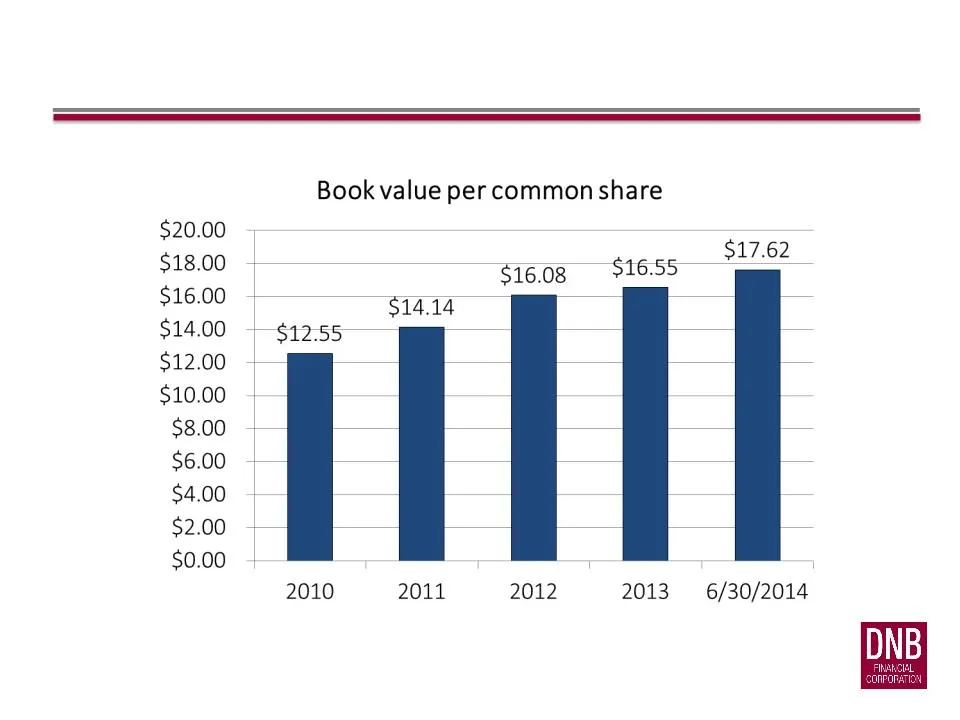
Slide 24: Book value per common share
Book value per common share $17.62 $16.08 — >46.95 $14.14 $12.55 | 2010 2011 2012 2013 6/30/2014
Slide 25: Executive Summary: Performance Ratios
Performance Ratios 2013 Q2 2013 Q3 2013 Q4 2014 Q1 2014 Q2 Return on average assets 0.76% 0.20% 0.70% 0.62% 0.67% Return on average equity 8.60% 2.28% 7.86% 6.78% 7.35% Return on average tangible equity 8.65% 2.29% 7.89% 6.81% 7.38% Net interest margin 3.35% 3.21% 3.31% 3.36% 3.36% Efficiency ratio
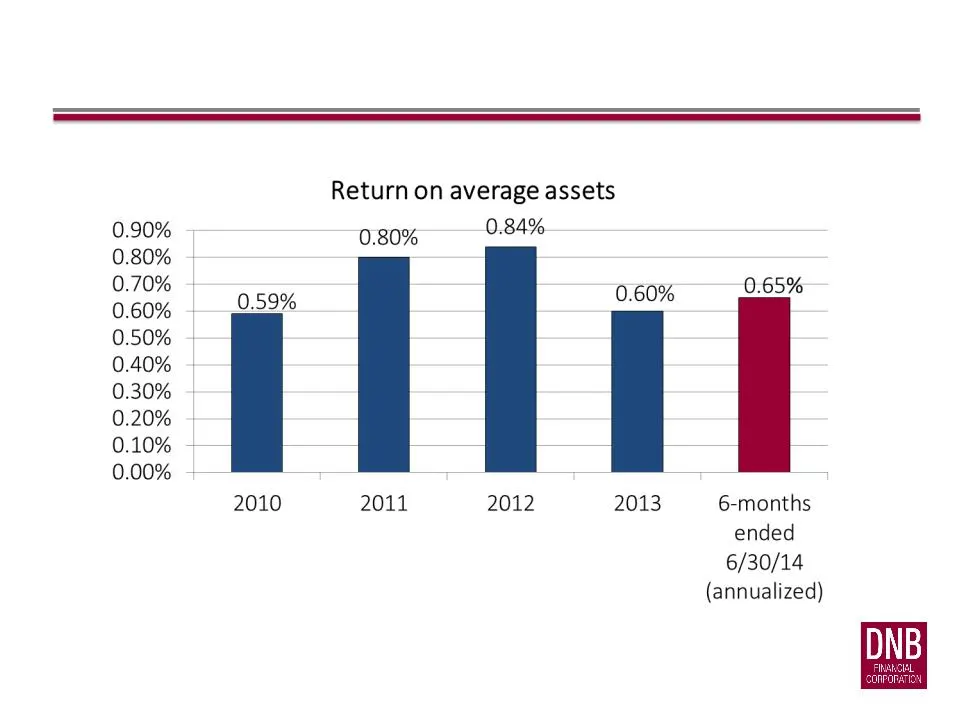
Slide 26: Return on average assets
0.90% 0.80% 0.70% 0.60% 0.50% 0.40% 0.30% 0.20% 0.10% 0.00% 0.59% 2010 Return on average assets 0.80% 2011 0.84% 2012 0.60% 0.65% 2013 6-months ended 6/30/14 (annualized)
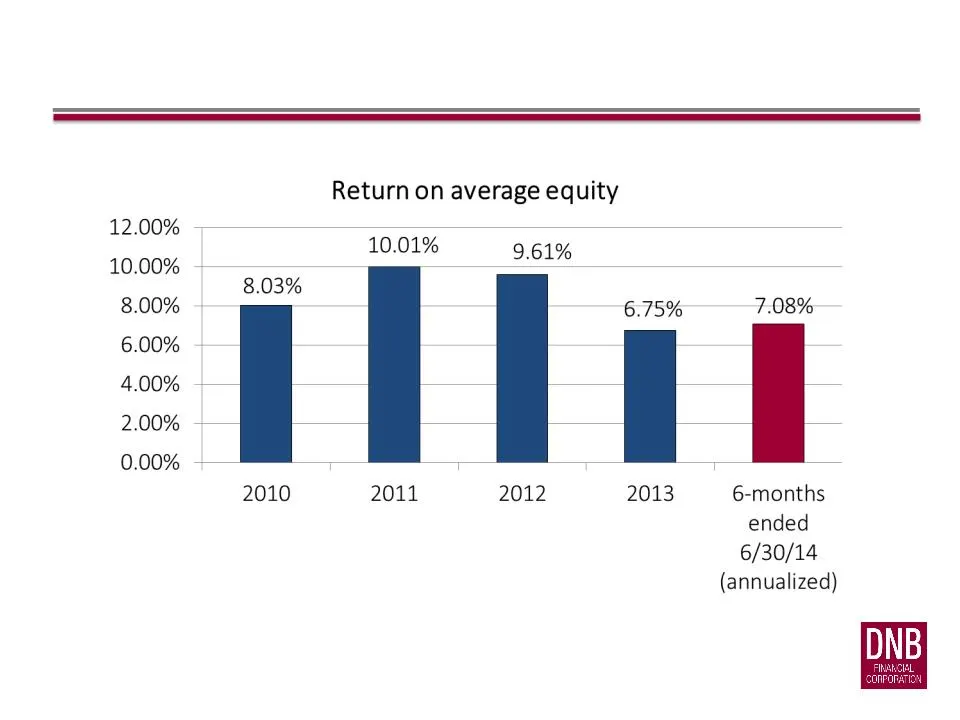
Slide 27: Return on average equity
Return on average equity 12.00% - 10.00% 10.01% 9.61% .00% 8.03% 8.00% 6.75% 7.08% 6.00% 4.00% i 2 - 2.00% 0.00% - L : _— 2010 2011 2012 2013 6-months ended 6/30/14 (annualized)
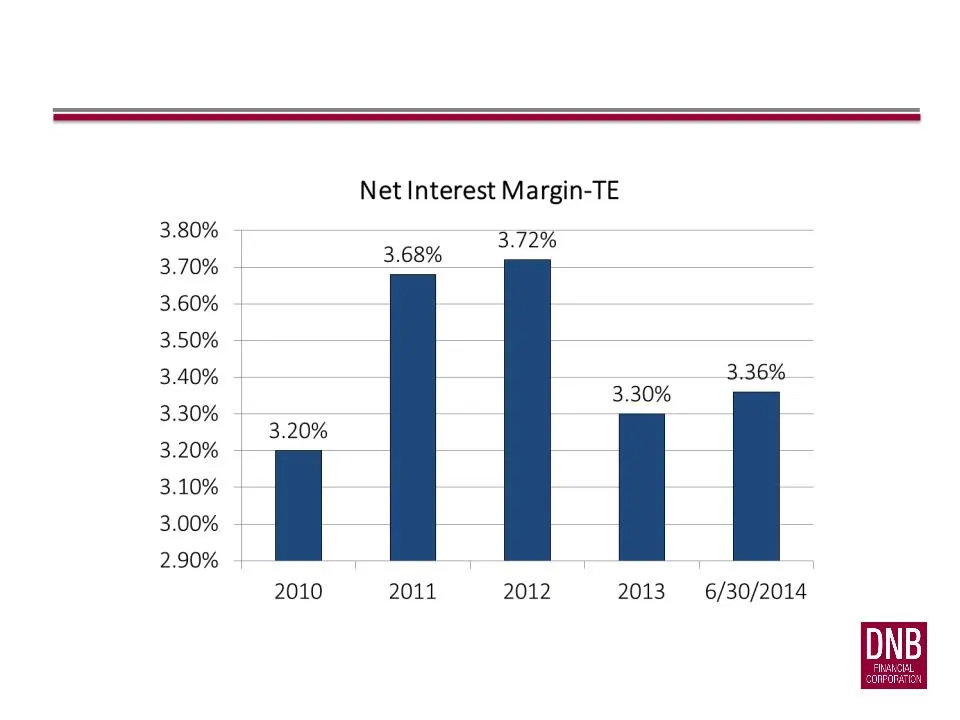
Slide 28: Net Interest Margin-TE
Net Interest Margin-TE 3.80% 9 37096 3.68% 222% 3.60% 3.50% 3.40% 3.36% 3.30% 3.30% 3.20% 3.20% - 3.10% 3.00% -— i 2.90% 1 1 T 1 2010 2011 2012 2013. 6/30/2014
Slide 29: Executive Summary: Asset Quality Ratios
Asset Quality Ratios 2013 Q2 2013 Q3 2013 Q4 2014 Q1 2014 Q2 Net Charge-offs to average loans 0.20% 1.02% 0.01% 0.06% 0.03% Non-performing loans/Total loans 2.60% 1.40% 1.38% 1.26% 1.18% Allowance for credit loss/Total loans 1.72% 1.08% 1.11% 1.10% 1.11% Allowance for credit loss/Non- performing loa
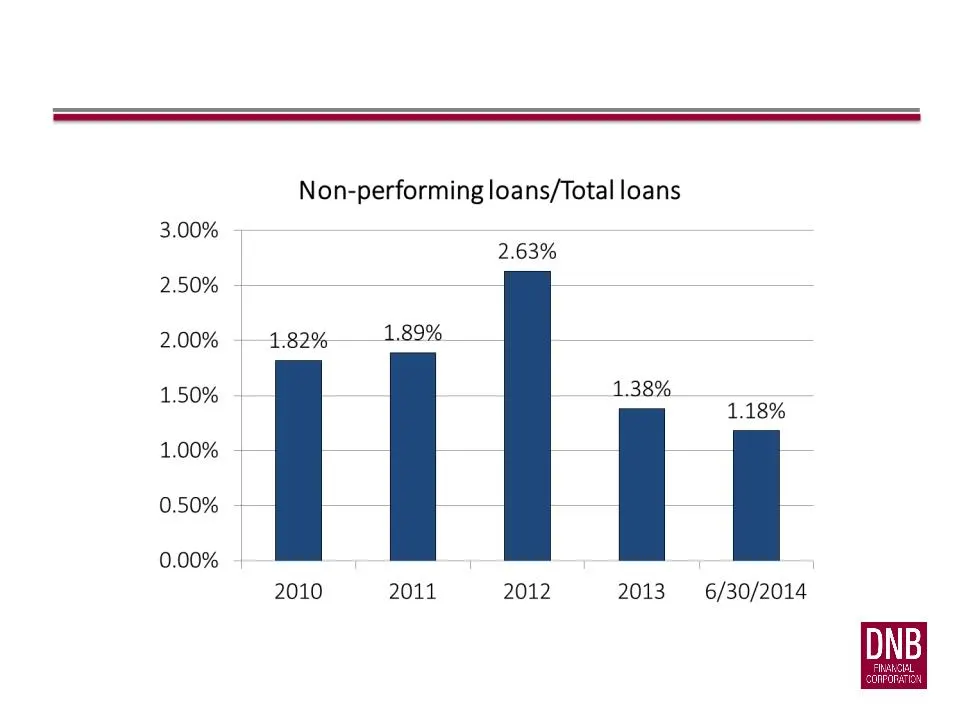
Slide 30: Non-performing loans/Total loans
3.00% 2.50% 2.00% 1.50% 1.00% Non-performing loans/Total loans 2.63% 1.82% 1.89% 0.50% - 0.00% 1.38% li 1.18% 2010 2011 2012 2013 ‘6/30/2014
Slide 31: Executive Summary: Capital Ratios
Capital Ratios 2013 Q2 2013 Q3 2013 Q4 2014 Q1 2014 Q2 Total equity/Total assets 8.60% 8.89% 8.86% 8.83% 9.00% Tangible equity/Tangible assets 8.58% 8.87% 8.84% 8.78% 8.95% Tangible common equity/Tangible assets 6.63% 6.87% 6.87% 6.88% 7.06% Tier 1 leverage ratio 10.42% 10.39% 10.61% 10.72% 10.76% T

Slide 32: Experienced Management and Board Leadership
Experienced Management and Board Leadership
Slide 33: Management Team and Directors
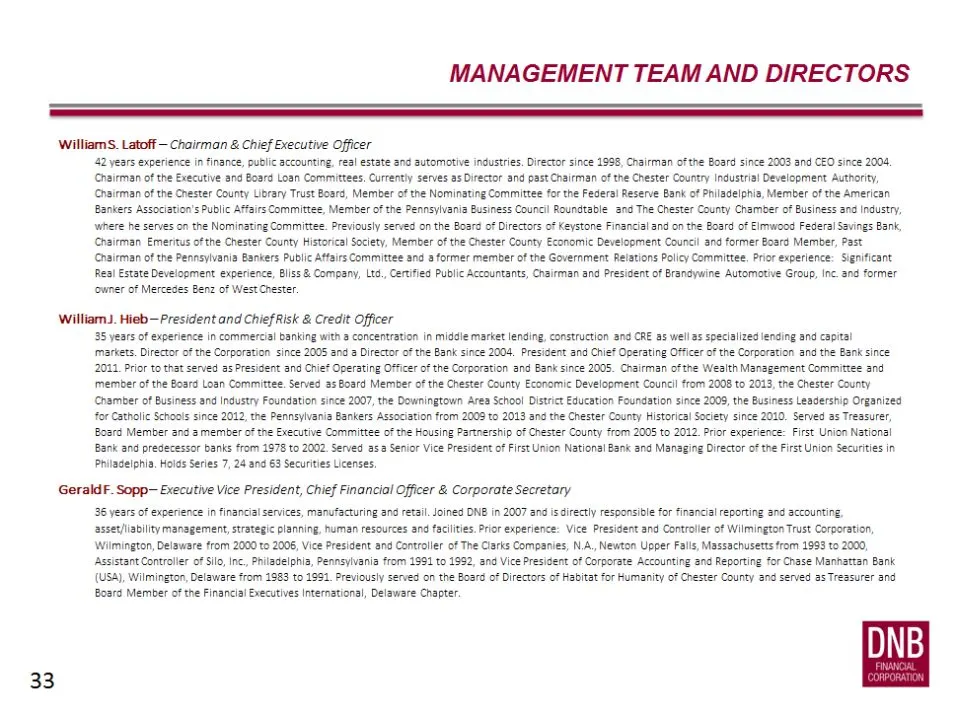
MANAGEMENT TEAM AND DIRECTORS 33 Williams. Latoff — Chairman & Chief Executive Officer 42 years experience in finance, public accounting, realestate and automotive industries. Director since 1998, Chairman ofthe Board since 2003 and CEO since 2004 (Chairman of the Executive and Board Loan Committees
Slide 34: Management Team and Directors
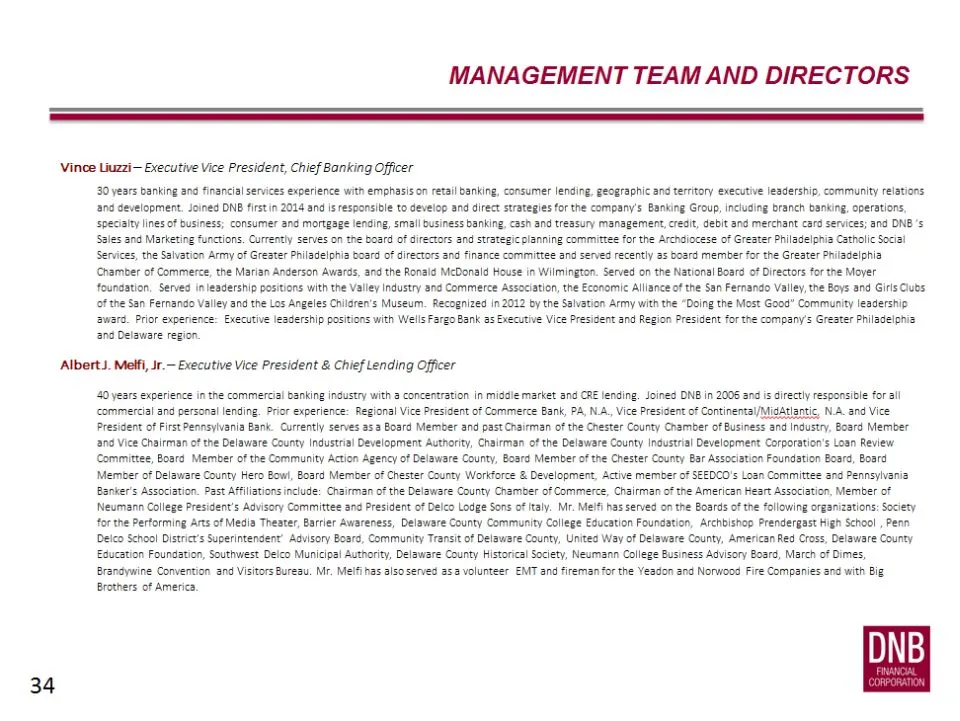
MANAGEMENT TEAM AND DIRECTORS Vinee Liuzzi— Executive Vice President, Chief Banking Officer 30 years banking and financial services experience with emphasison retail banking, consumer lending, geographic and territory executive leadership, community relations {and development. Joined DNB firstin 201
Slide 35: Management Team and Directors
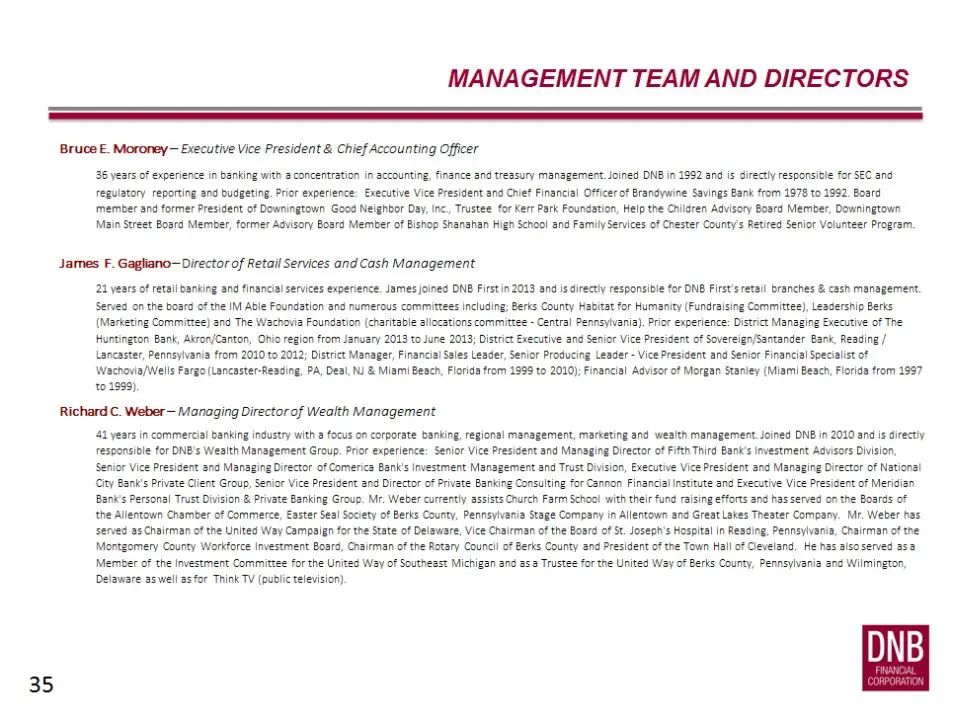
MANAGEMENT TEAM AND DIRECTORS Bruce E. Moroney — Executive Vice President & Chief Accounting Officer 136 yezrs of experience in banking with 3 in , finance and treasury Joined DNB in 1992 and is directly responsible for SEC and regulatory reporting and budgeting. Prior experience: Executive Vice Pre
Slide 36: Management Team and Directors
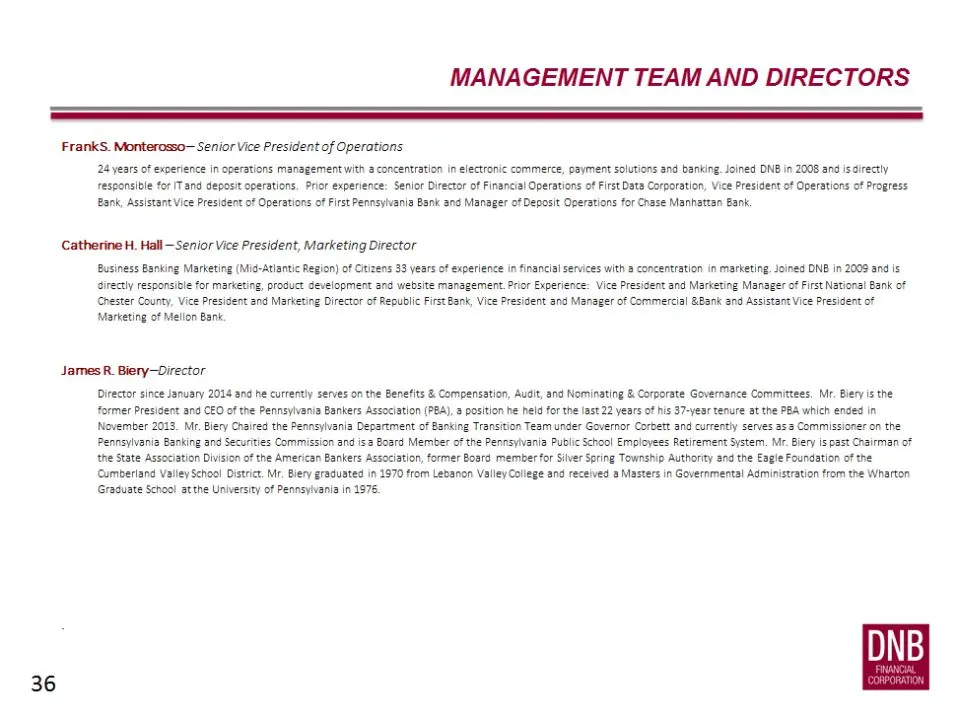
MANAGEMENT TEAM AND DIRECTORS 36 FrankS. Monterasso— Senior Vice President of Operations ‘24years of experience in operations management with @concentration in electronic commerce, payment Solutions and banking. Joined ONE in 2008 and is directly responsible for ITand deposit operations. Prior exper
Slide 37: Management Team and Directors
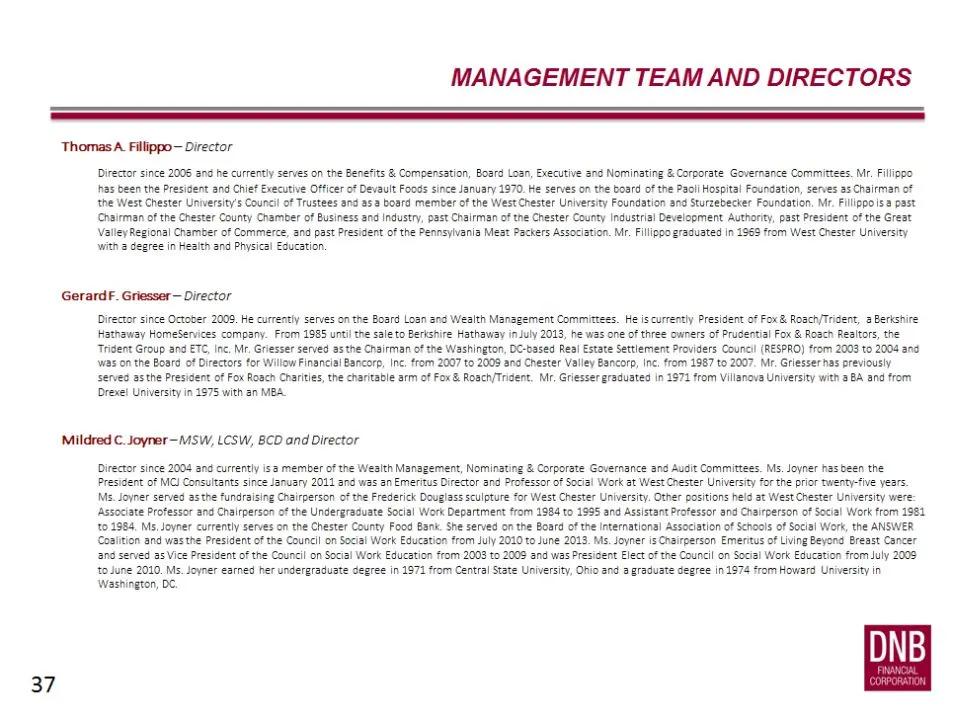
37 MANAGEMENT TEAM AND DIRECTORS ‘Thomas. Fillippo— Director Director since 2005 and he currentiy serves on the Benefits & Compensation, Board Loan, Executive snd Nominating & Corporate Governance Committees. Mr. Filippo has been the President and Chief Executive Otticer of Devault Foods since Janua
Slide 38: Management Team and Directors
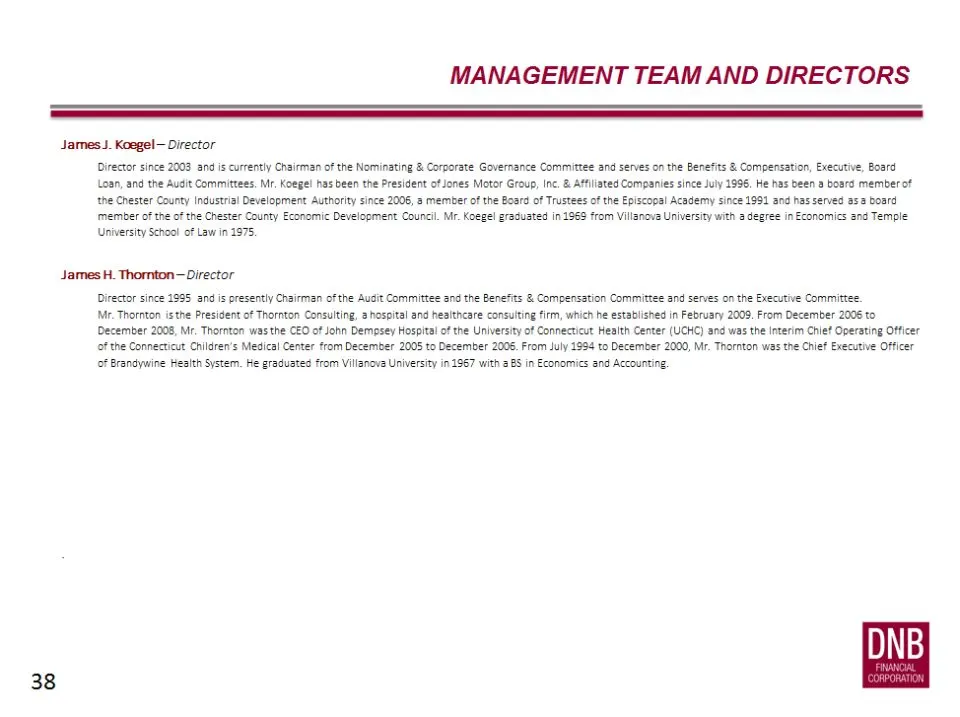
MANAGEMENT TEAM AND DIRECTORS 38 James J. Koegel— Director Director since 2008 and is curenty Chairman ofthe Nominating 8 Corgorate Governance Committee and serves on the Benefits & Compensation, Executive, Board Loan, and the Audit Committees, Mr. Koege! hasbeen the President of ones Motor Group, I

Slide 39: Invest in DNB Financial
Invest in DNB Financial
Slide 40: DNBF Stock Performance
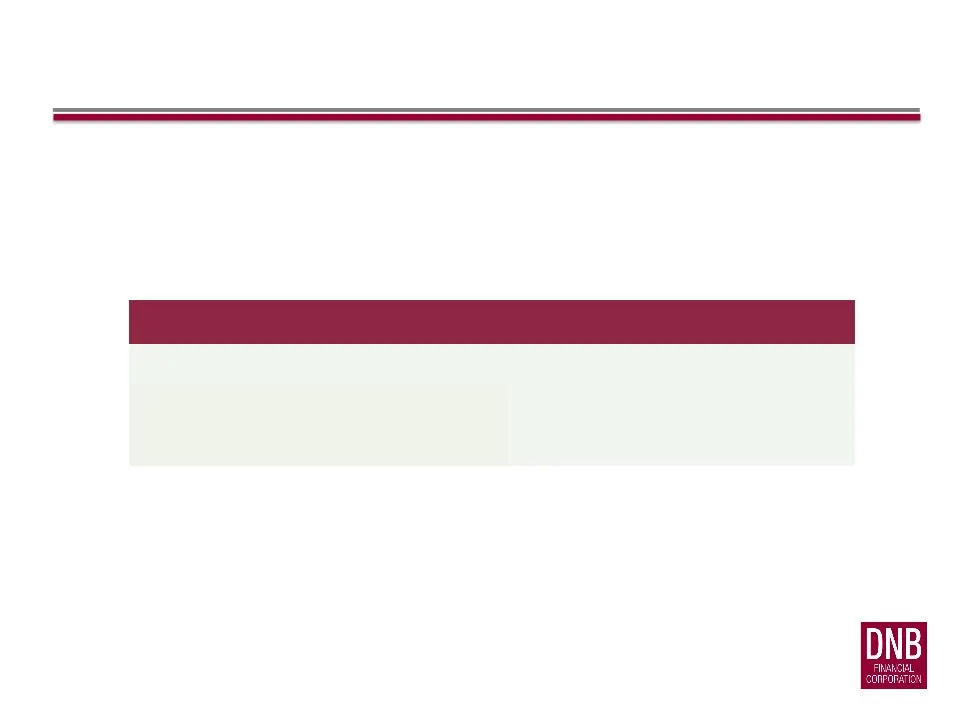
Security or Index 2013 Return DNBF* 33.87% NASDAQ Bank Index* 39.33% KBW Bank Index* 34.71% DNBF STOCK PERFORMANCE Closing price on Dec 27, 2013: $20.75 Closing price on August 25, 2014: $22.00 * Source: Bloomberg
Slide 41: Investor Relations Contact
INVESTOR RELATIONS CONTACT Gerald F. Sopp 484.359.3138 gsopp@dnbfirst.com http://investors.dnbfirst.com/ For more information, Investors may contact:

Slide 42: Thank You
THANK YOU
Source: SEC EDGAR · 8-K filed Sep 2, 2014
More decks from DNB Financial Corporation
 Investor Presentation (August 2018)32 slides · Aug 7, 2018
 Shareholder Meeting (April 2016)31 slides · Apr 27, 2016
 Merger or Acquisition (April 2016)23 slides · Apr 5, 2016
 Investor Presentation (September 2015)47 slides · Sep 23, 2015
 Investor Presentation (March 2014)59 slides · Mar 5, 2014
 Investor Presentation (August 2013)59 slides · Aug 21, 2013