PremierWest Bancorp — Sandler O'Neill Conference 2008
47 slides from PremierWest Bancorp's conference presentation, Sep 19, 2008
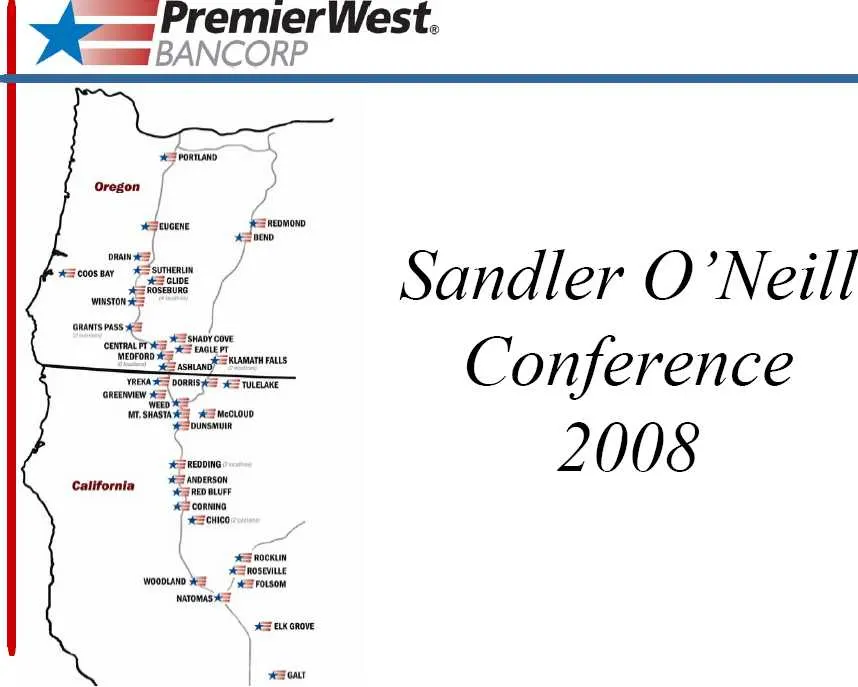
Slide 1: Sandler O'Neill Conference 2008
eee, nar ines, sam BANCORP Sandler O'Neill Conference 2008
Slide 2: Forward Looking Statement Disclosure
Forward Looking Statement Disclosure This presentation may inchide “forward-looking statements” about PremierWest. Forward-looking statements generally include financial projections; descriptions of plans or objectives of management for future operations, products or services; forecasts of future ec
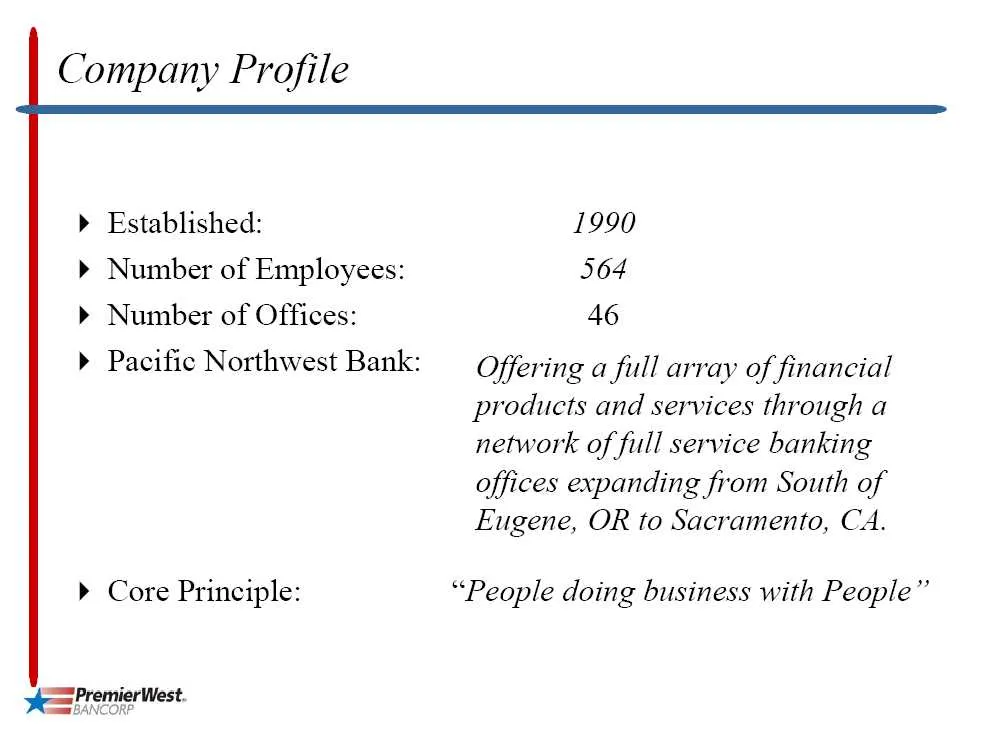
Slide 3: Company Profile
Company Profile > Established: » Number of Employees: >» Number of Offices: > Pacific Northwest Bank: > Core Principle: eS PremierWest. 1990 564 46 Offering a full array of financial products and services through a network of full service banking offices expanding from South of Eugene, OR to Sacrame
Slide 4: $1.5 Billion Financial Services Company
$ 1.5 Billion Financial Services Company PremierWest Bank Premier Finance Company PremierWest Investment Services, Inc. ee PremierWest
Slide 5: Capitalization
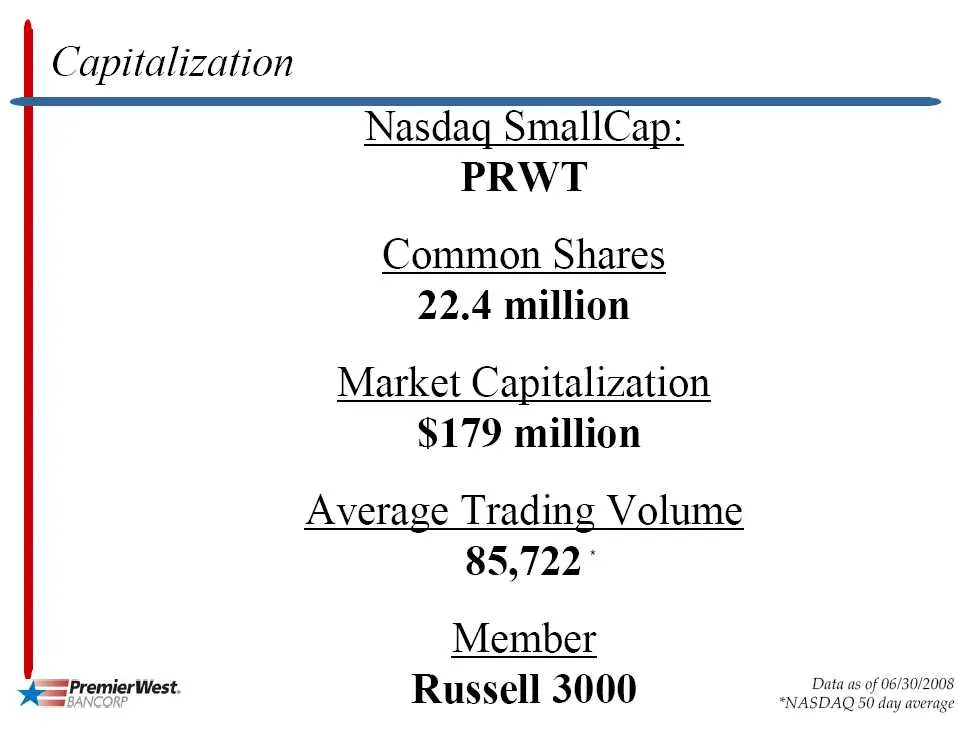
Capitalization Nasdaq SmallCap: PRWT Common Shares 22.4 million Market Capitalization $179 million Average Trading Volume 85,722" Member rahe Russell 3000 +NASONG SS ary eee
Slide 6: PremierWest History - 1998 to 2008
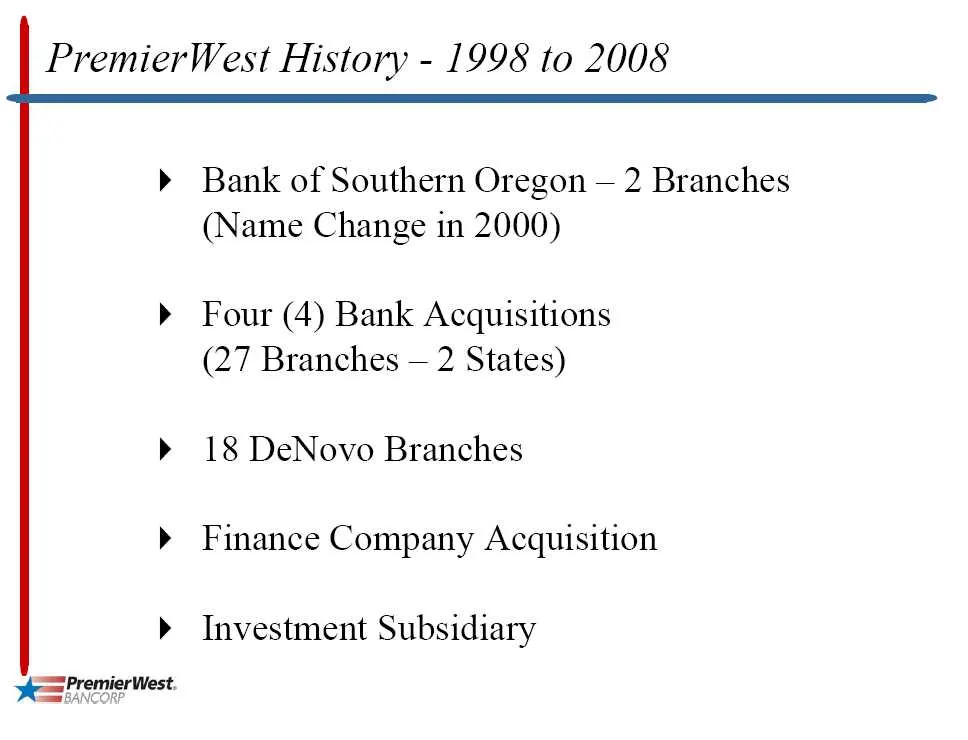
PremierWest History - 1998 to 2008 » Bank of Southern Oregon — 2 Branches (Name Change in 2000) » Four (4) Bank Acquisitions (27 Branches — 2 States) » 18 DeNovo Branches » Finance Company Acquisition >» Investment Subsidiary ee PremierWest.
Slide 7: Top Growth MSAs on the West Coast
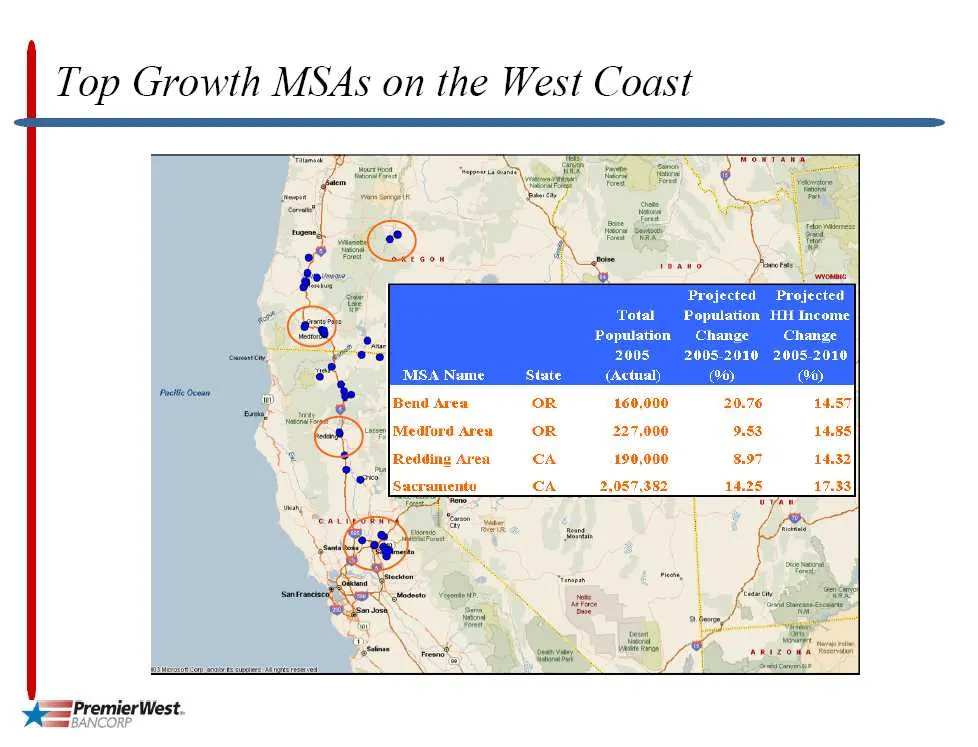
Top Growth MSAs on the West Coast Projected ‘fotal Population HH Income Population Change 2005 -2005.2010 2005-2010 MSA Name State (Actual) (4) a) 160,000 227,000 190,000 2,087,382 ye PremierWest BANC
Slide 8: Region
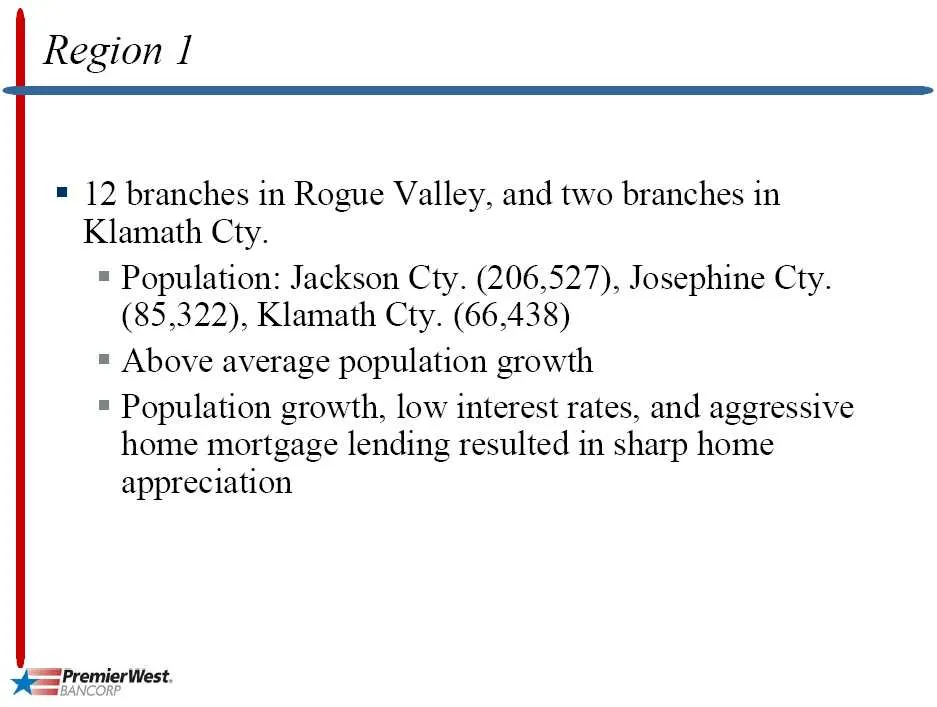
Region 1 = 12 branches in Rogue Valley, and two branches in Klamath Cty. = Population: Jackson Cty. (206,527), Josephine Cty. (85,322), Klamath Cty. (66,438) = Above average population growth = Population growth, low interest rates, and aggressive home mortgage lending resulted in sharp home appreci
Slide 9: Region
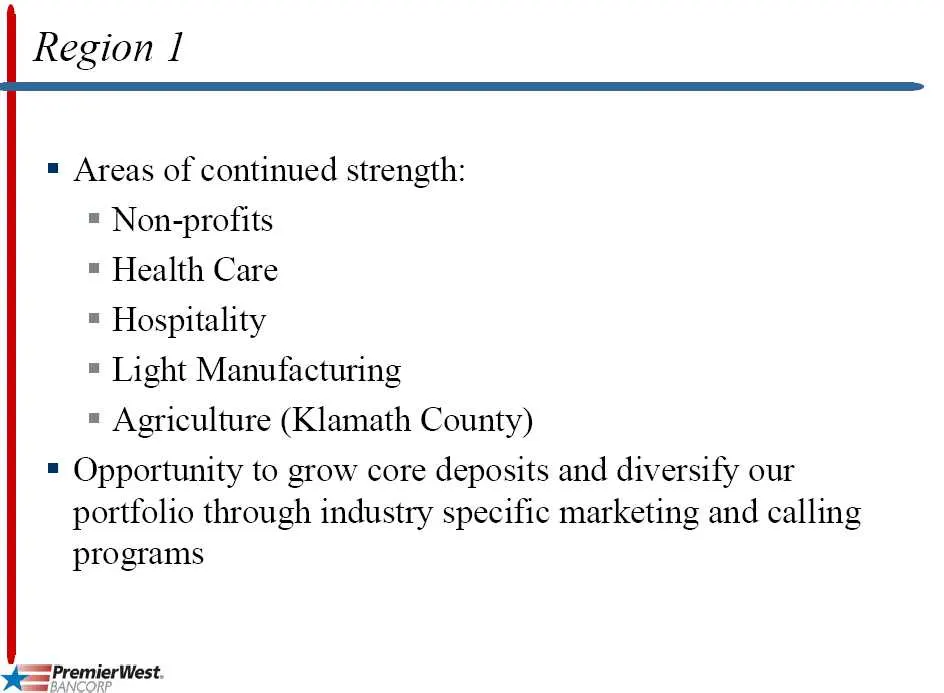
Region 1 = Areas of continued strength: = Non-profits = Health Care = Hospitality = Light Manufacturing = Agriculture (Klamath County) = Opportunity to grow core deposits and diversify our portfolio through industry specific marketing and calling programs ya Premier West.
Slide 10: Rogue Valley: Housing Data
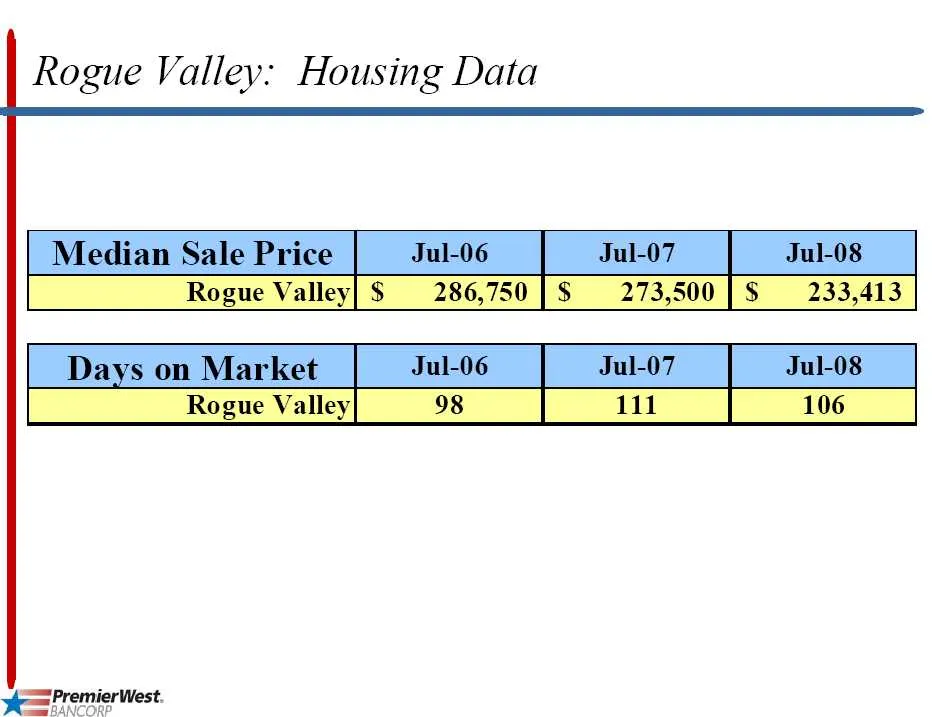
Rogue Valley: Housing Data mm BANCORP
Slide 11: Region
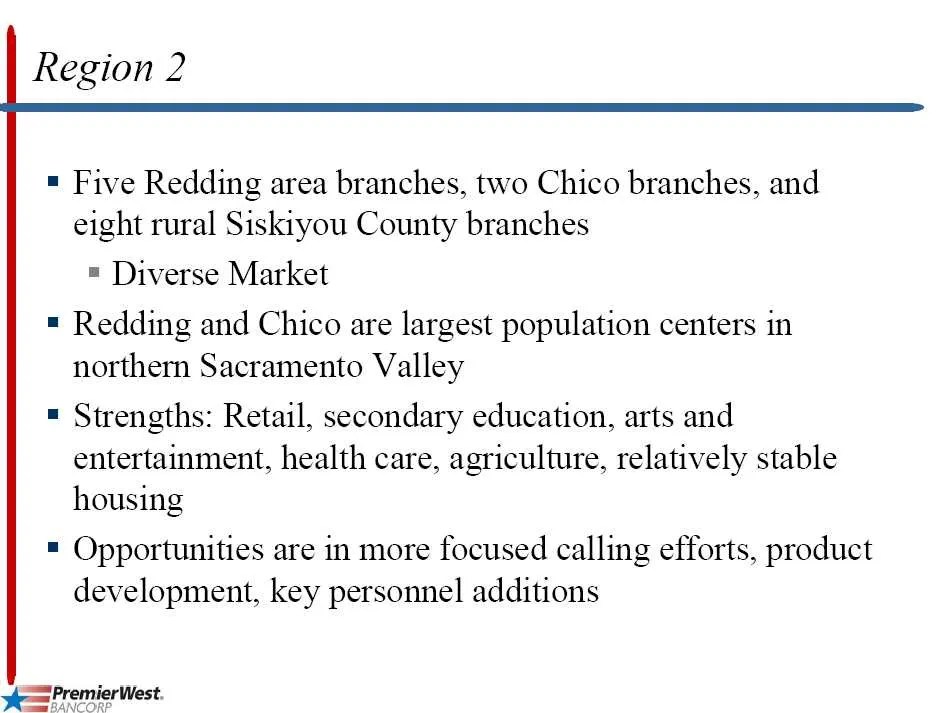
Region 2 = Five Redding area branches, two Chico branches, and eight rural Siskiyou County branches = Diverse Market = Redding and Chico are largest population centers in northern Sacramento Valley = Strengths: Retail, secondary education, arts and entertainment, health care, agriculture, relatively
Slide 12: Chico/Redding: Housing Data
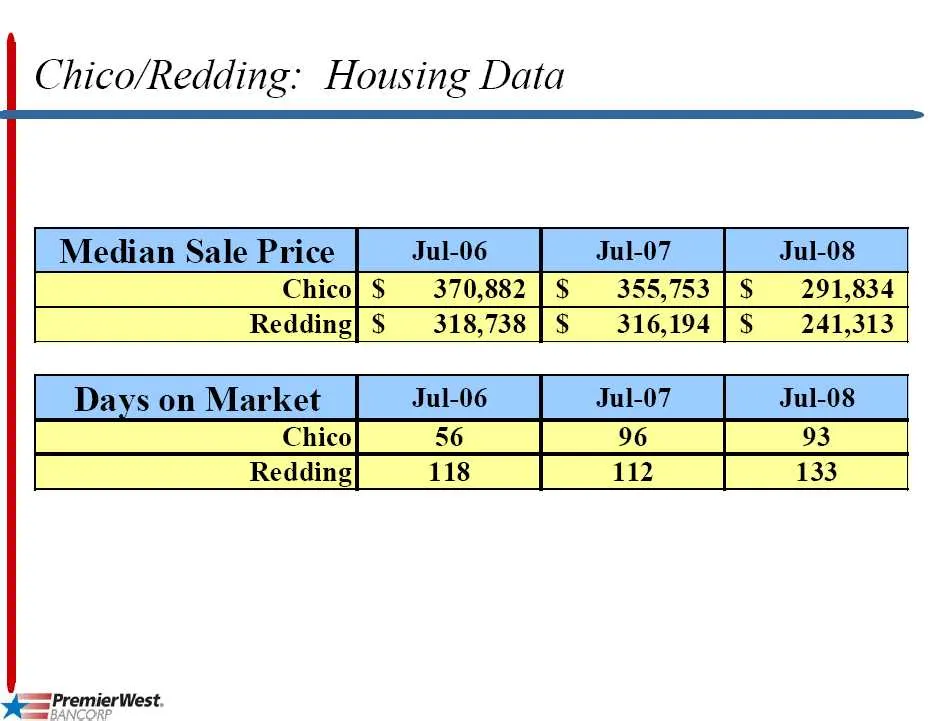
Chico/Redding: Housing Data
Slide 13: Region
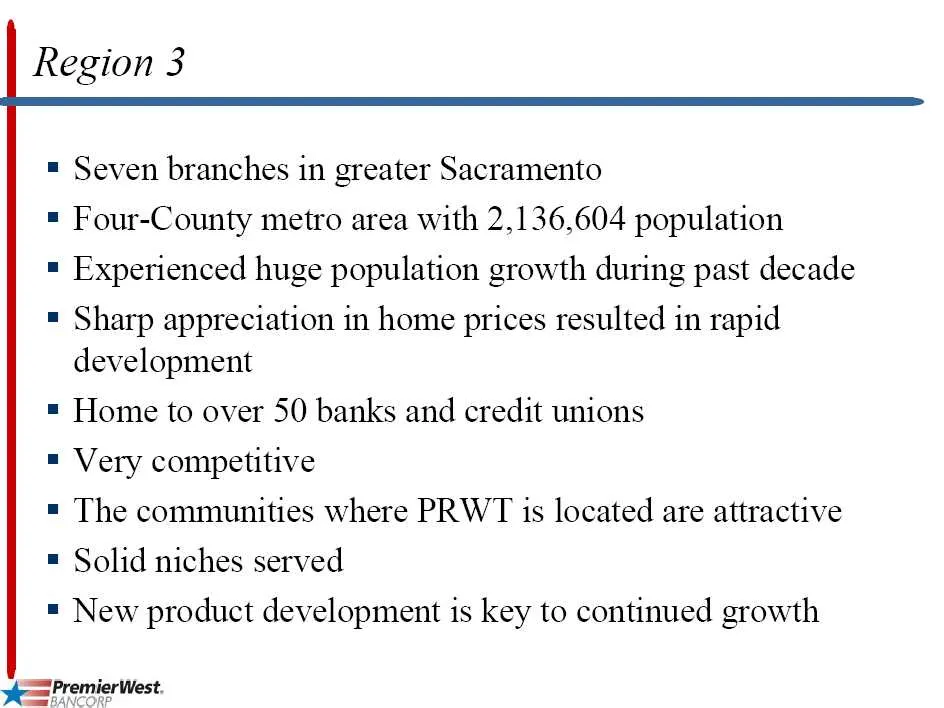
Region 3 = Seven branches in greater Sacramento = Four-County metro area with 2,136,604 population = Experienced huge population growth during past decade = Sharp appreciation in home prices resulted in rapid development = Home to over 50 banks and credit unions = Very competitive = The communities
Slide 14: Sacramento County: Housing Data
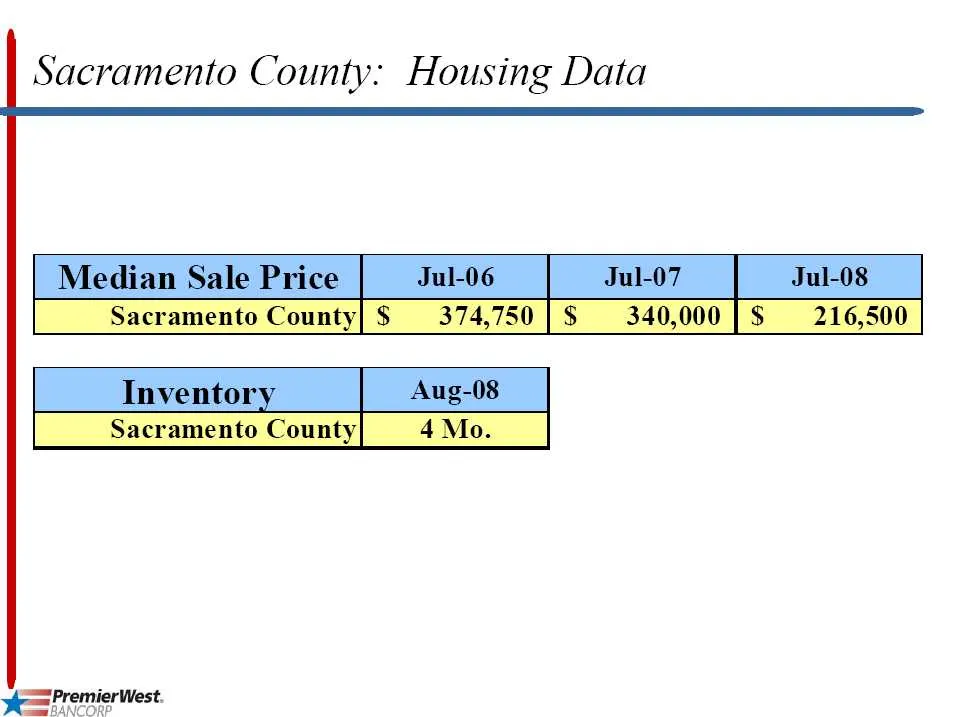
Sacramento County: Housing Data mm BANCORP
Slide 15: Region
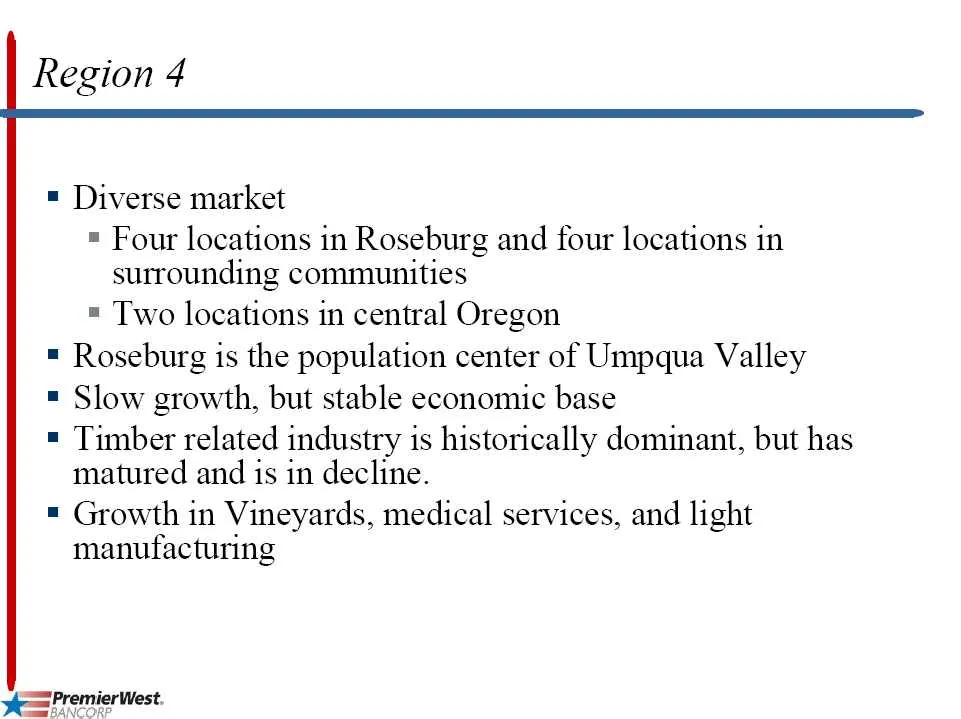
Region 4 = Diverse market = Four locations in Roseburg and four locations in surrounding communities = Two locations in central Oregon = Roseburg is the population center of Umpqua Valley = Slow growth, but stable economic base = Timber related industry is historically dominant, but has matured and
Slide 16: Region
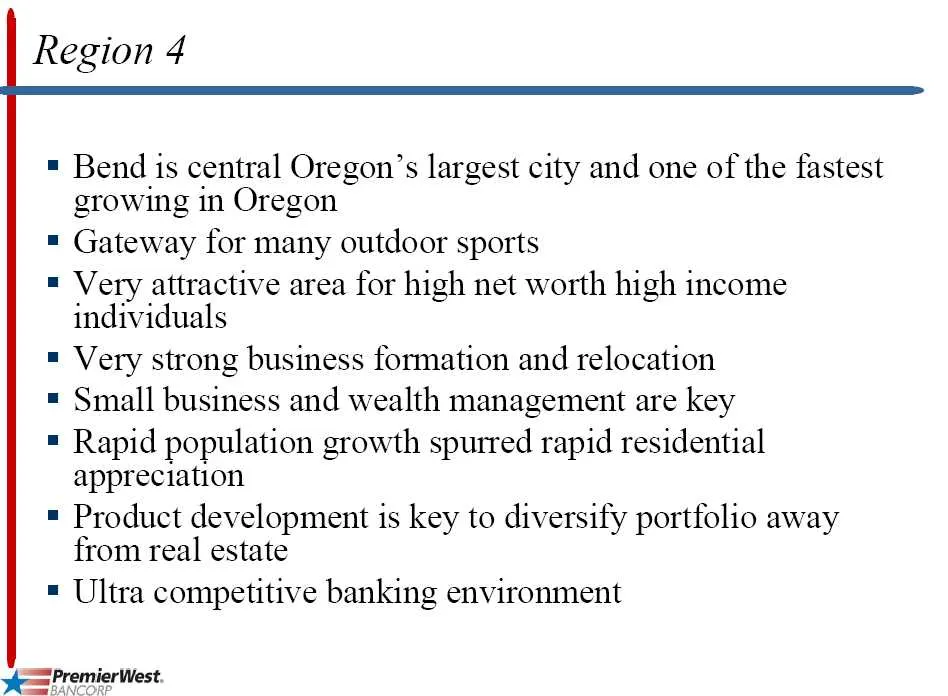
Region 4 * Bend is central Oregon’s largest city and one of the fastest growing in Oregon = Gateway for many outdoor sports = Very attractive area for high net worth high income individuals = Very strong business formation and relocation = Small business and wealth management are key * Rapid populat
Slide 17: Douglas County: Housing Data
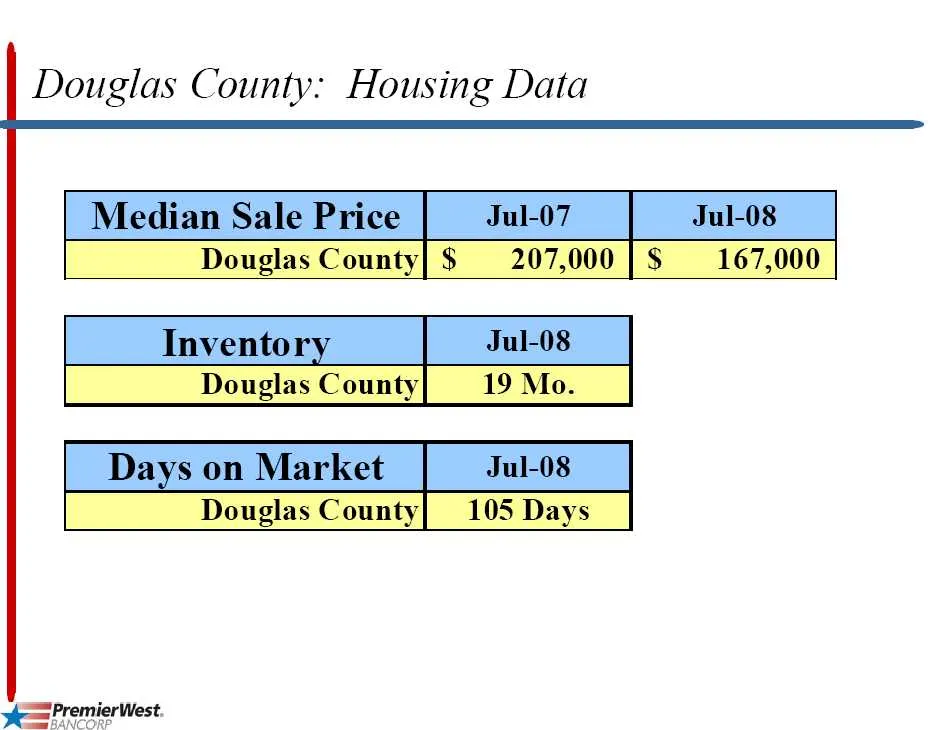
Douglas County: Housing Data
Slide 18: Bend/Redmond: Housing Data
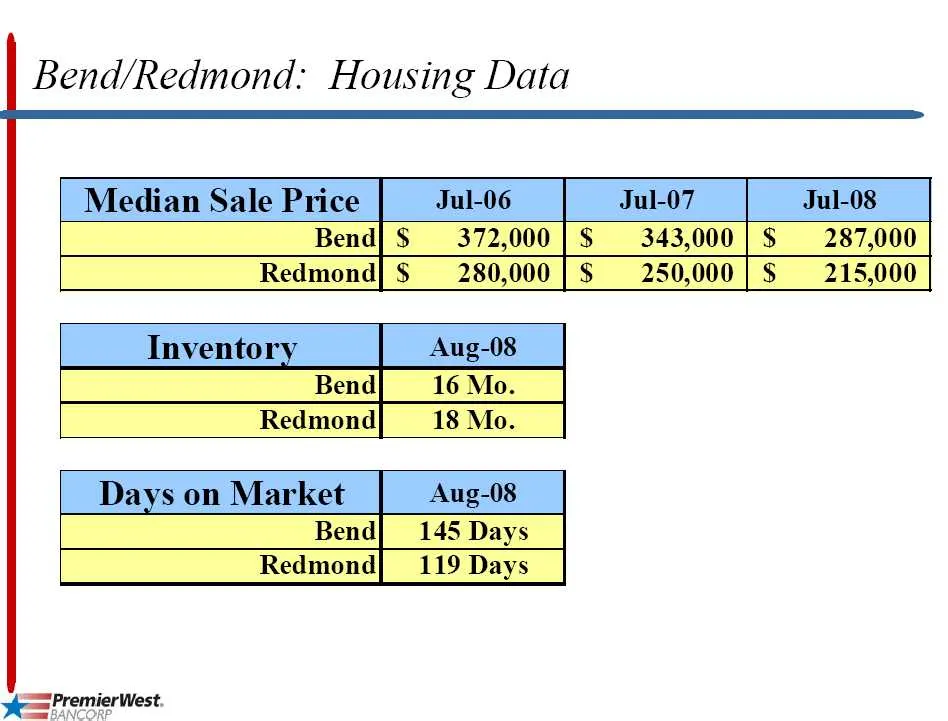
Bend/Redmond: Housing Data
Slide 19: Bend/Redmond: Housing Data
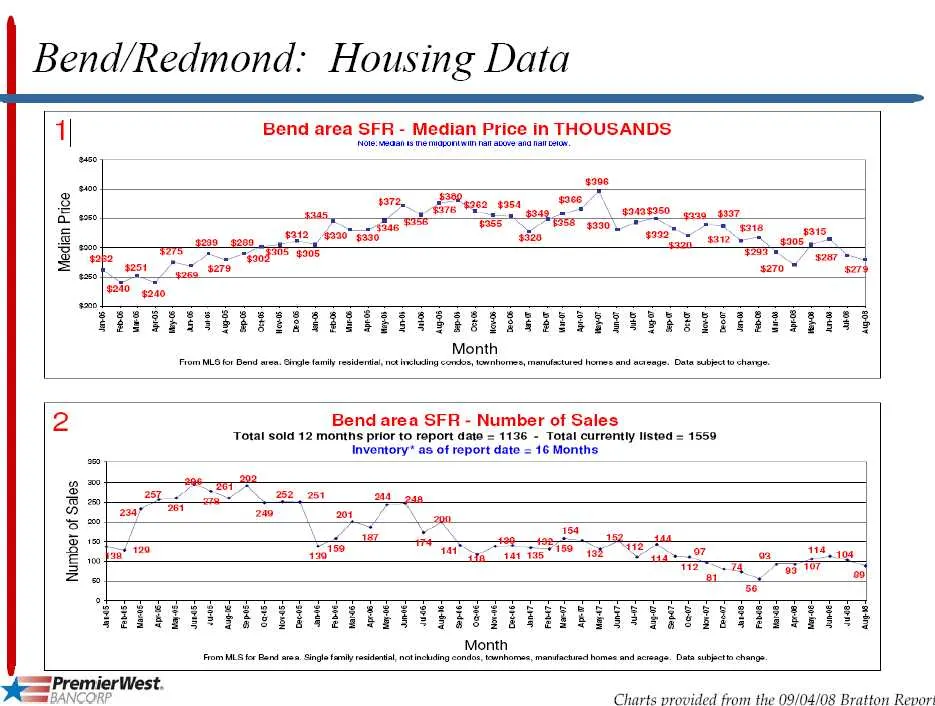
Bend/Redmond: Housing Data Tl Bend area SFR - Median Price in THOUSANDS 8 E exo FA § ane eee ee eeaeeaeeg Pee eee eee eee eageeeeeeaeeiaiis PPPLEEISREEL LRP ELS EPR EL EREP EPL ER PELE REDE EEE Month ea Te a 2 Bend area SFR - Number of Sales ‘Total sola 12 monins prior to roport dato = 1136 - Total
Slide 20: Bend/Redmond: Housing Data
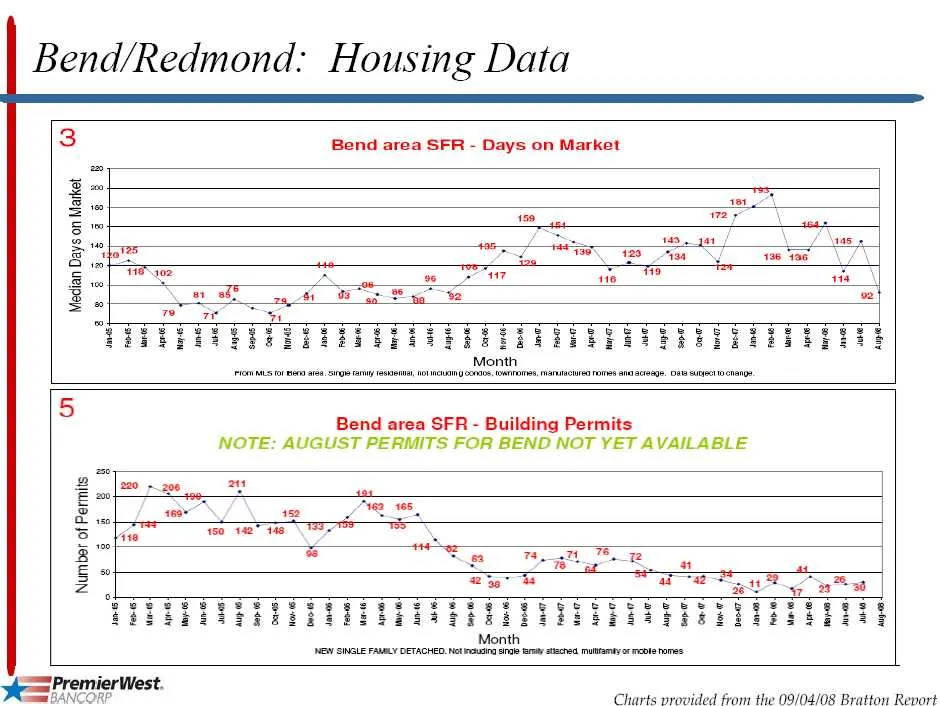
Bend/Redmond: Housing Data 1c) Bend area SFR - Days on Market 2° = my B foe e eae 22 a a zs a ae Wee @ wo mat ea PEEESEL EES EATER LEER ETE PLR EE ELSE ER EEREEE EE ESE Month. Bend area SFR - Building Permits NOTE: AUGUST PERMITS FOR BEND NOT YET AVAILABLE Pl ee) Zo er mn = 18 a Oe, Ss) ee Th TEEy r
Slide 21: Bend/Redmond: Housing Data
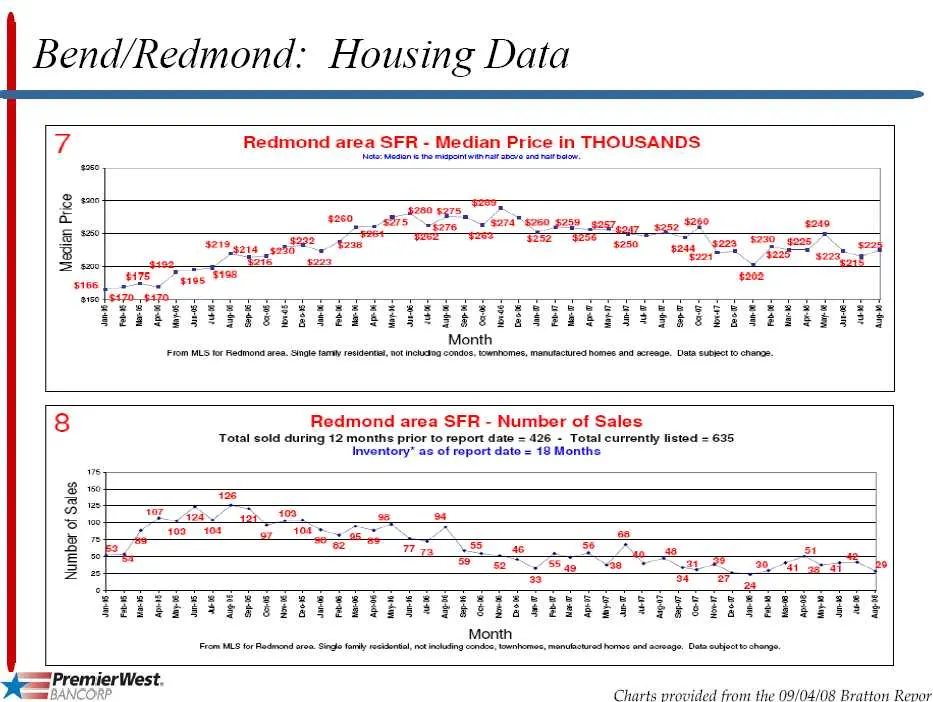
Bend/Redmond: Housing Data Redmond area SFR - Median Price in THOUSANDS g- = = 4a $873 wgong ~w S274" 8250 5259 _g057, am $240 iia 39514 gi, tae i a I = B at fa Aad ™ sate = S108 rerry Tiiiti PPP PTT itGiibiiii 2258588 PESERG AGL TIP SHS RAT ETE EEIE Month ‘From MLS lor Rend arc. ingle far feident n
Slide 22: Bend/Redmond: Housing Data
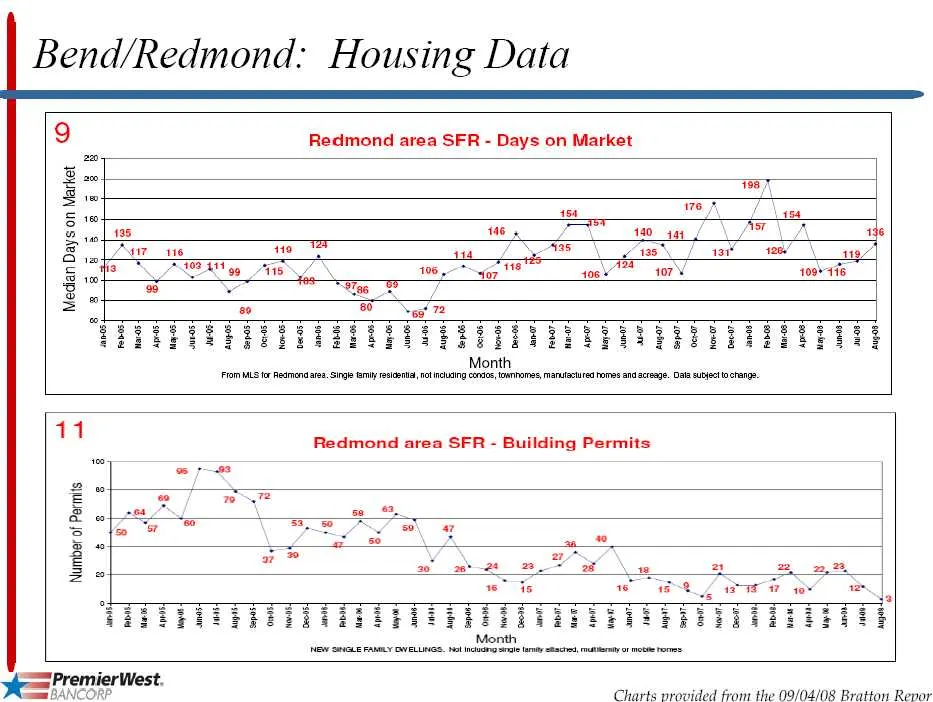
Bend/Redmond: Housing Data Oo Redmond area SFR - Days on Market oa :. 78 © 160. 454 sd 154 Se las ye aa ATA ite 2 Aw ae ire ri as ae [sat eZ Saat NSA ANZ Ser sos tor wort 3 wo 9 E = ay Ae PSeEET gP232 2 iad aa baad: batate Month Frome Reends. i enya tne ero mines manecworones nae. safe coe Redmond a
Slide 23: Loan Growth
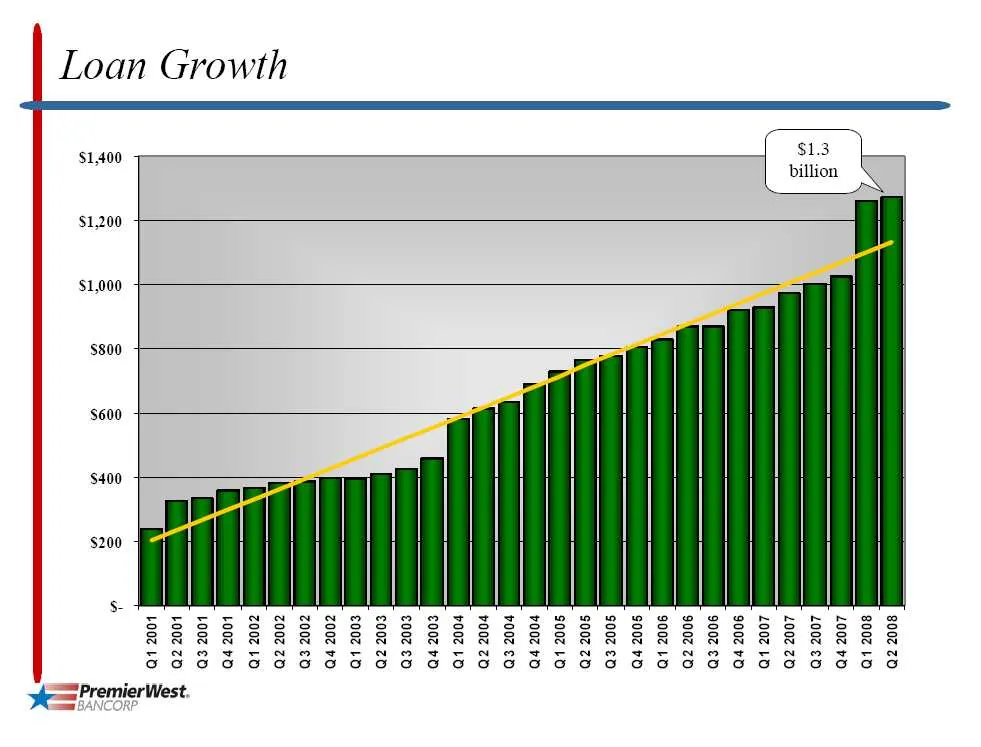
Loan Growth billion 002 20 8002 10 4002 4002 £0 4002 20 4002 10 9002 yO 900z £0 900z 0 9002 FO $002 O so0z £0 $o0z 70 $002 10 voor yD vo0z £0 vooz 20 y00z LO £002 6D £002 £0 £002 20 £002 10 z00z yO. zooz £0 zo0z zo z00z FO booz vO booz €D booz zo booz LO $1400 $1,200 $1,000 $800 $600 $400 J 0
Slide 24: Loan Diversification
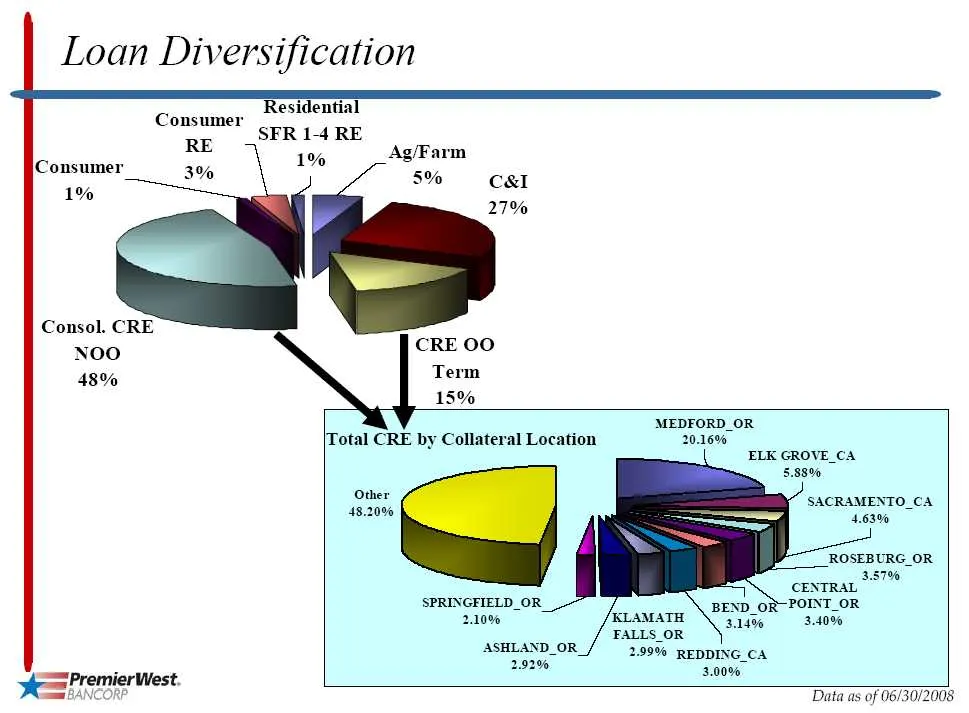
Loan Diversification Residential Consumer SFR 1-4 RE RE 1% Ag/Farm (Consumer 3% a bite 5% C&I 1% 27% Consol. CRE NOO CRE 00 48% Term 15% MEDFORD_OR [Total CRE by Collateral Location 20.16% ELK GROVE_CA 5.88% SACRAMENTO_CA ROSEBURG_OR SPRINGFIELD_OR 2.10% : FALLS OR ASHLAND_OR 29986 READIN EA — 2.92%
Slide 25: Loan Portfolio
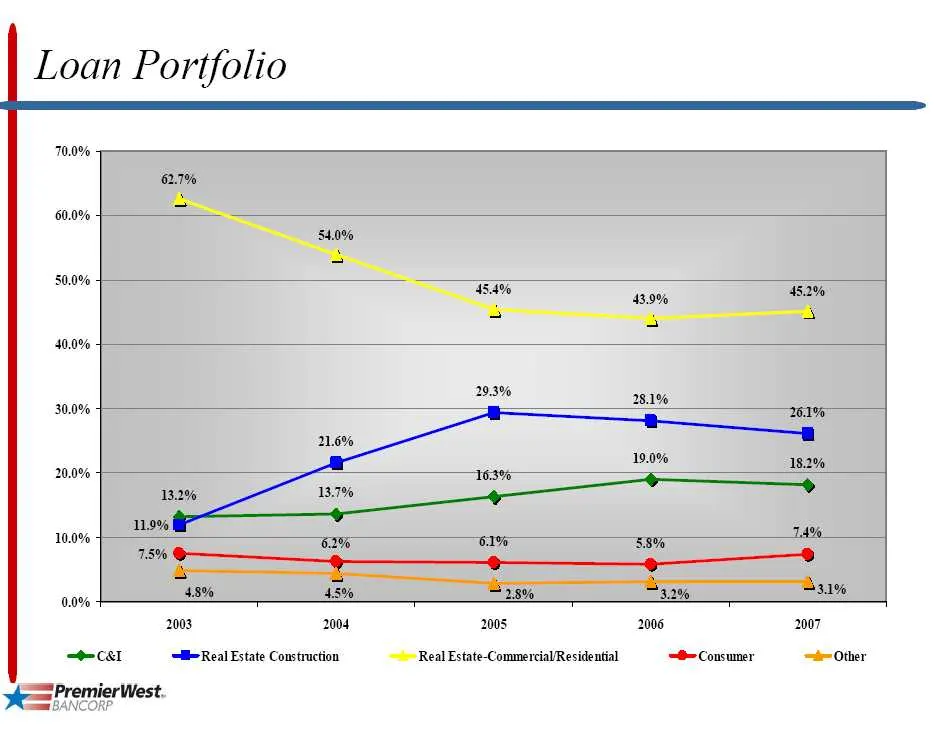
Loan Portfolio 2004 2005 2006 2007 cal @ Real Estate Construction ~~ Real Estate-Commercia/Residential Consumer t= Other ye PremierWest
Slide 26: Commercial Real Estate
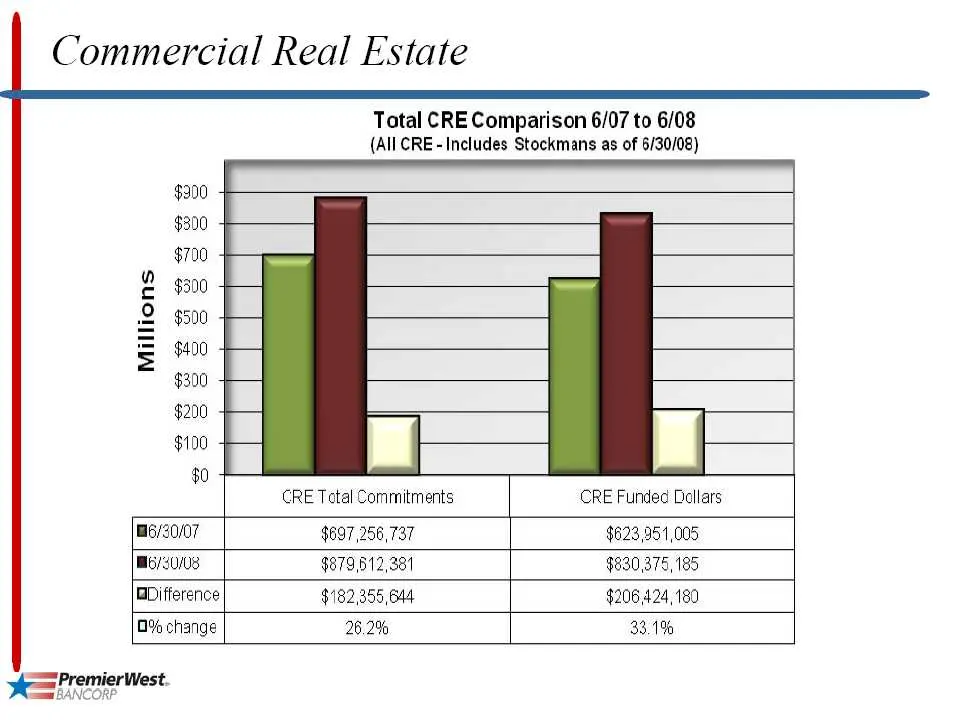
Commercial Real Estate Total CRE Comparison 6/07 to 6/08 (All CRE - Includes Stockmans as of 6/30/08) $300 $300 $700 $300 $500 $400 $300 $200 $100 $0 UH) c ° CRE Tatal Commitments CRE Funded Dollars 6/20/07 $697,258,737 $623,951,005 6/20/08 $879,512,381 $830,375, 185 Difference $182,355,644 $206,424
Slide 27: Term NOO and Term OO CRE
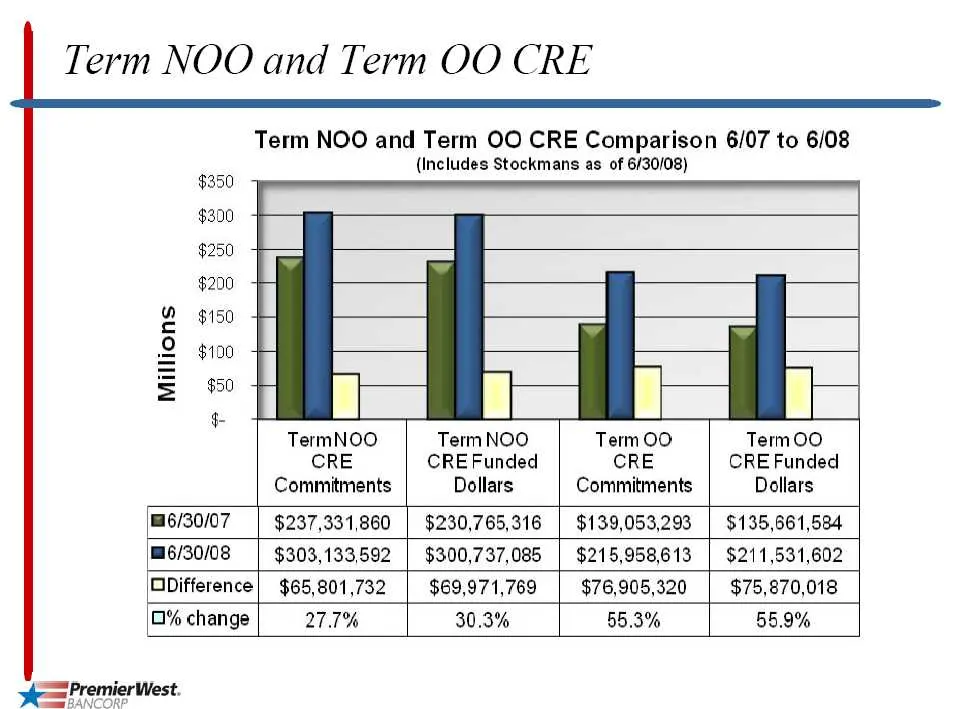
Term NOO and Term OO CRE Term NOO and Term OO CRE Comparison 6/07 to 6/08 (Includes Stockmans as of 6/30/08) a) < 2 = ! TermNOO TermNOO Term 00 TermOO CRE CRE Funded CRE CRE Funded Commitments Dollars Commitments Dollars 6/30/07 $237,331,860 | $230,765,316 | $139,053,293 | $135,661,584 6/30/08 $303,
Slide 28: Construction Portfolio
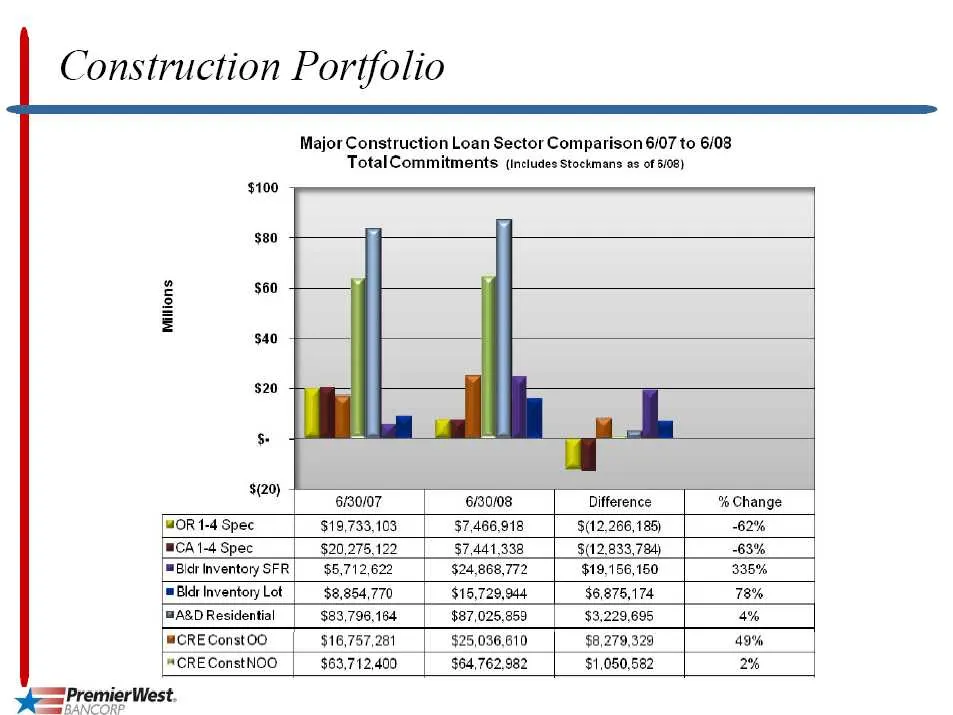
Construction Portfolio Major Construction Loan Sector Comparison 6/07 to 6/08 TotalCommitments (includes Stockmans as of 5/08) $100 $80 2 $60 & = 340 4 $20 & $(20) 6/30/07 6/30/08 Difference % Change WOR 1-4 Spec $19,733,103 $7,406,918 $(12,266,185) 62% BCA 1-4 Spec $20,275,122 37,441,338 $(12,833,7
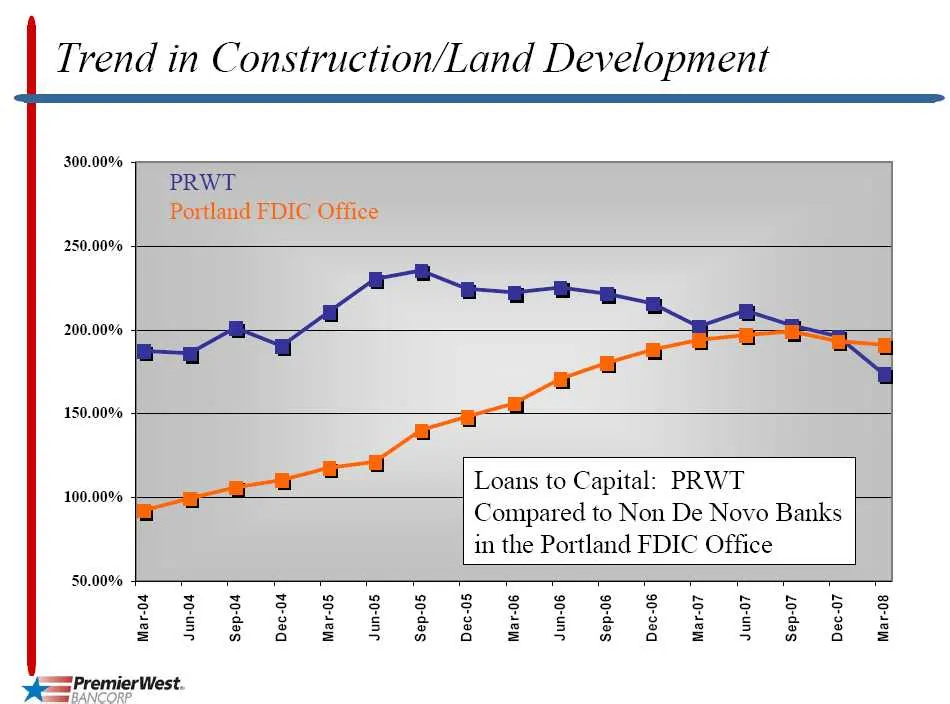
Slide 29: Trend in Construction/Land Development
Trend in Construction/Land Development 300.00% 250.00% 200.00% 150.00% 100.00% 50.00% PRWT Portland FDIC Office Loans to Capital: PRWT Compared to Non De Novo Banks in the Portland FDIC Office sees $ 8 8 8 8 &€ ese 8 5 SS Be 8 s & & @ € 2 @ &£ § 2 @ © & Be & = 3 a a = 5 ao a = 3 a a = 5 a a = y= Pre
Slide 30: Loan growth with Stockmans Bank and Valley Bank acquisitions
se] » a wn x So = : = \ S z Stockmans Bank Acquisition id Valley Bank Acquisition 7] 9002 20 8002 LO 2002 ¥O 2002 £0 2002 20 2002 LO 9002 FO 9002 £0 9002 ZO 9002 LO $002 ¥O s00z £0 $002 20 $002 to 002 ¥O y00z £0 y00z ZO 002 LO £002 6 £002 £0 £002 20 £002 LO 2002 vO z00z £0 z00z 20 z00z LO 4002 OD bo
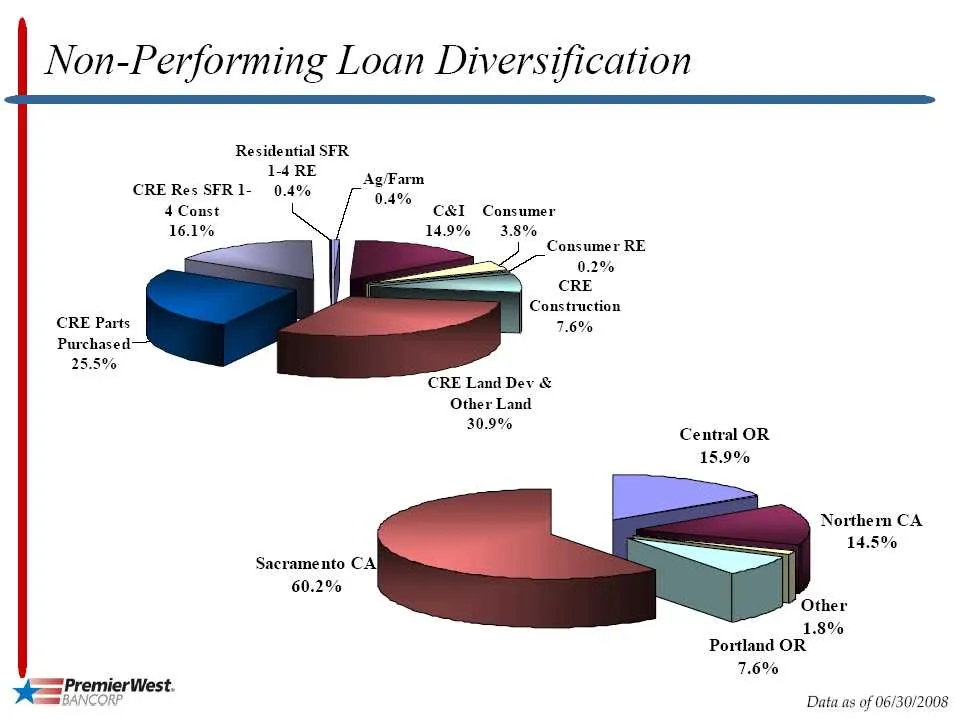
Slide 31: Non-Performing Loan Diversification
Non-Performing Loan Diversification Residential SFR 14RE Ag/Farm CRE Res SFR1- 0.4% 0.4% 4 Const C&I Consumer 16.1% 14.9% 3.8% Consumer RE 0.2% CRE Construction 7.6% CRE Land Dev & Other Land 30.9% Central OR 15.9% Sacramento CAj 60.2% PremierWest. CORP Northern CA’ 14.5% Other Portland OR 7.6% 1.8%
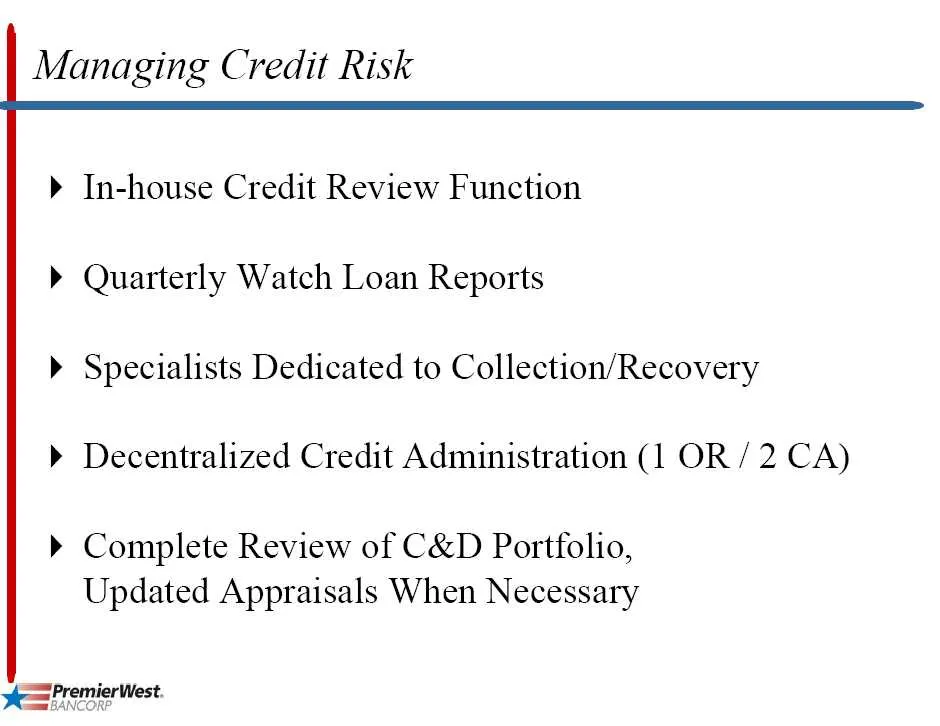
Slide 32: Managing Credit Risk
Managing Credit Risk » In-house Credit Review Function > Quarterly Watch Loan Reports » Specialists Dedicated to Collection/Recovery > Decentralized Credit Administration (1 OR / 2 CA) » Complete Review of C&D Portfolio, Updated Appraisals When Necessary y= PremierWest.
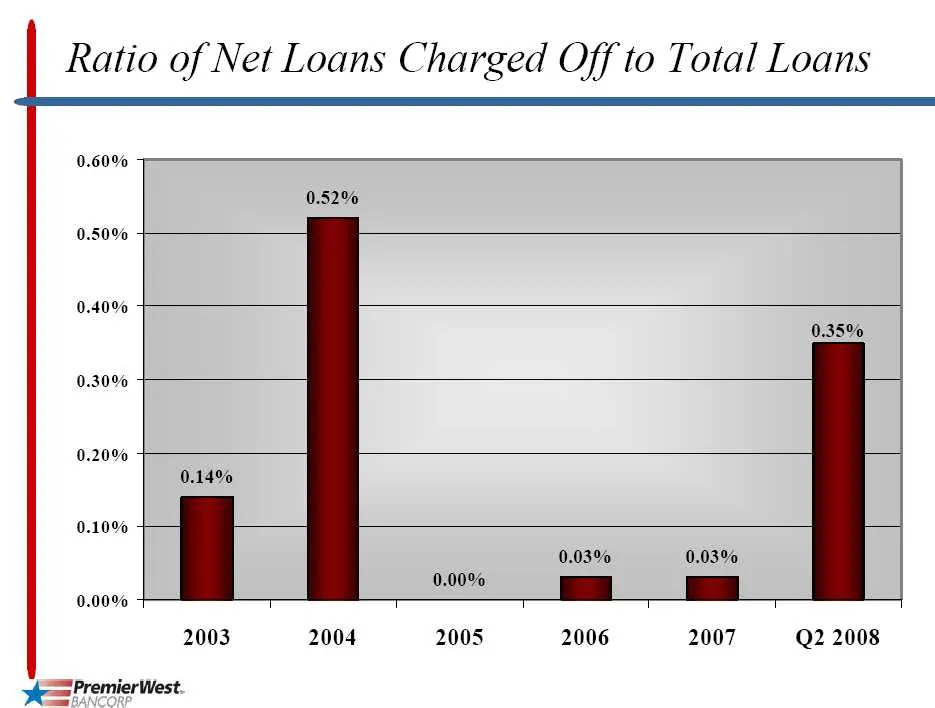
Slide 33: Ratio of Net Loans Charged Off to Total Loans
Ratio of Net Loans Charged Off to Total Loans 0.03% 0.03% 0.00% 0.009% ee | 2003 2004 2005 2006 2007 Q2 2008 y= PremierWest.
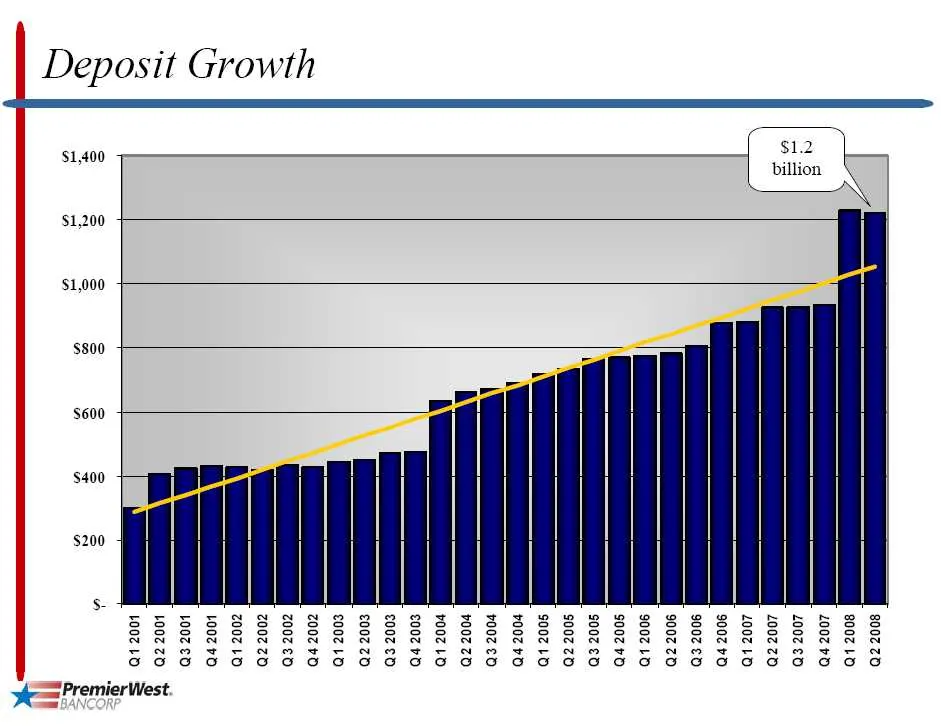
Slide 34: Deposit Growth
th Deposit Grow $1.2 billion $1,400 $1,200 $1,000 $800 $600 $400 8002 20 002 LO 2002 FD 2002 £0 200220 2002 10 900z vO 300z £0 900z 20 9002 LD s00z vO ooze s00z 20 00z 1D 002 FD 00z £0 00z 20 00 LO £002 FD £002 £0 £00220 £002 LO zo0z bO zooz ed z00z 20 z00z 10 boozy booze0 bo0zz0 bo0z Lo * PremierWe
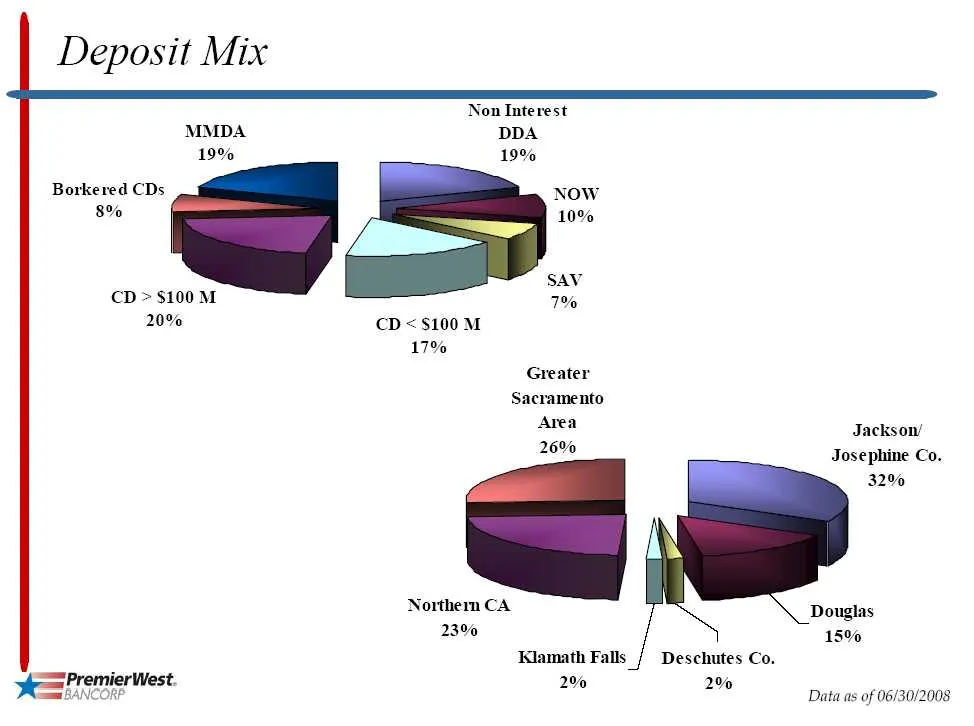
Slide 35: Deposit Mix
Deposit Mix Non Interest MMDA DDA 19% 19% Borkered CDs NOW 8% 10% sav CD > $100 M 1% 20% cD <$100M 17% Greater Sacramento area Jackson/ 26% Josephine Co. 32% Northern CA Douglas 230% 15% Klamath Falls / Deschutes Co. = % err 200 Be Data as of 06/30/2008
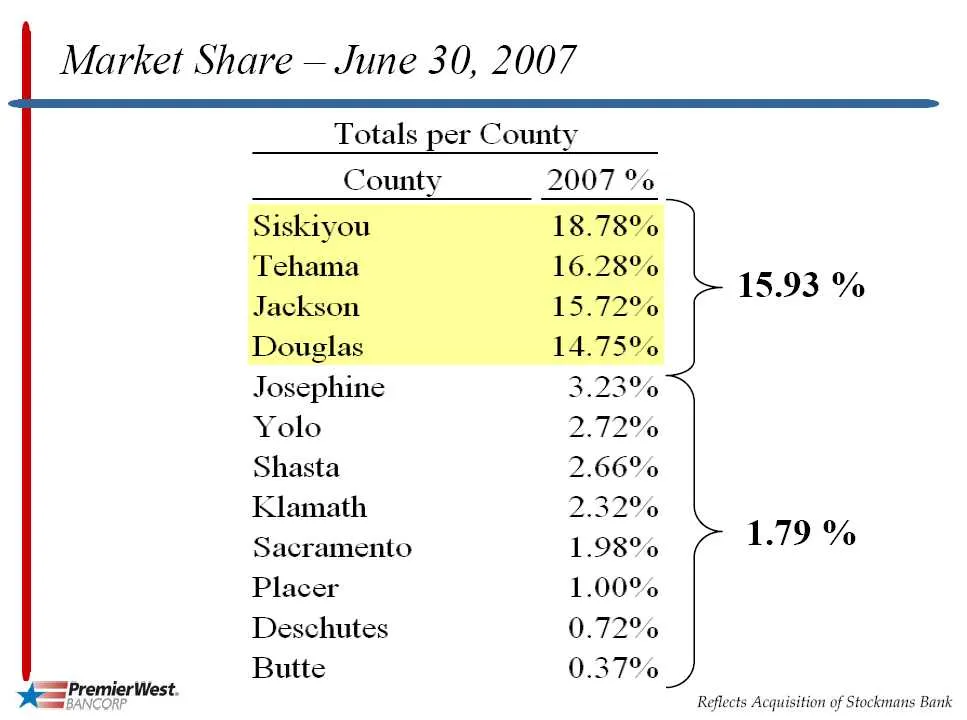
Slide 36: Market Share — June 30, 2007
Market Share — June 30, 2007 Totals per County County 2007 %o 12 7e0 > > 15.93 % Josephine 3.23% Yolo 2.72% Shasta 2.66% Namath 2.32% Sacramento 1.98% > 1.79 % Placer 1.00% Deschutes 0.72% Butte 0.37% _) = PremierWest. Sree ” Reflects Acquisition of Stockmans Bank
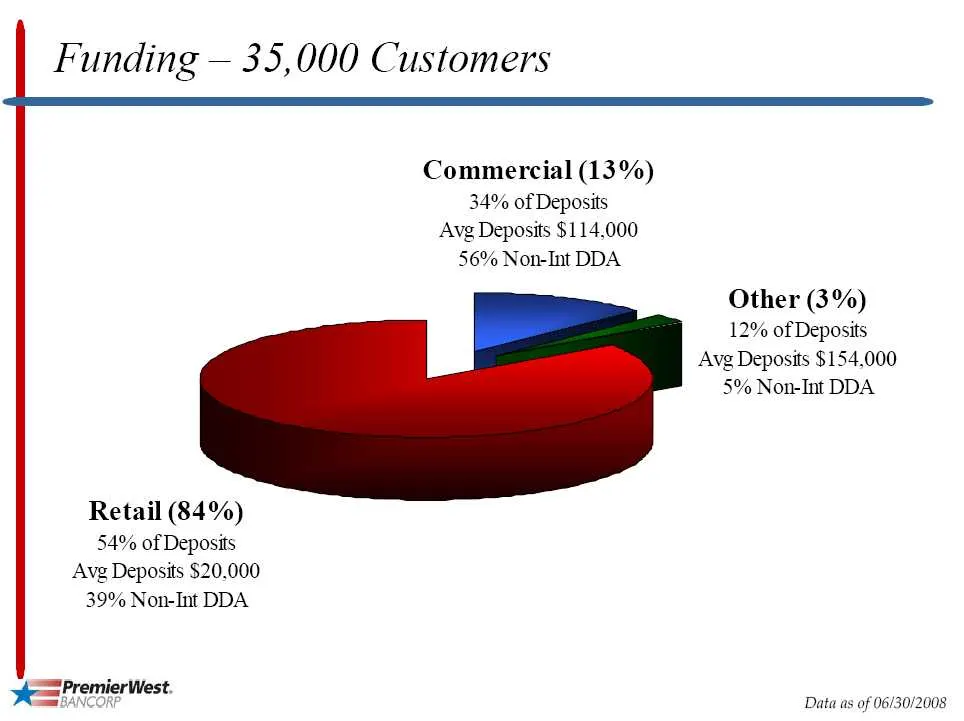
Slide 37: Funding — 35,000 Customers
Funding — 35,000 Customers Commercial (13%) 34% of Deposits Avg Deposits $114,000 56% Non-Int DDA Other (3%) 12% of Deposits Avg Deposits $154,000 5% Non-Int DDA Retail (84%) 54% of Deposits Avg Deposits $20.000 39% Non-Int DDA ierWest. Data as of 06/30/2008
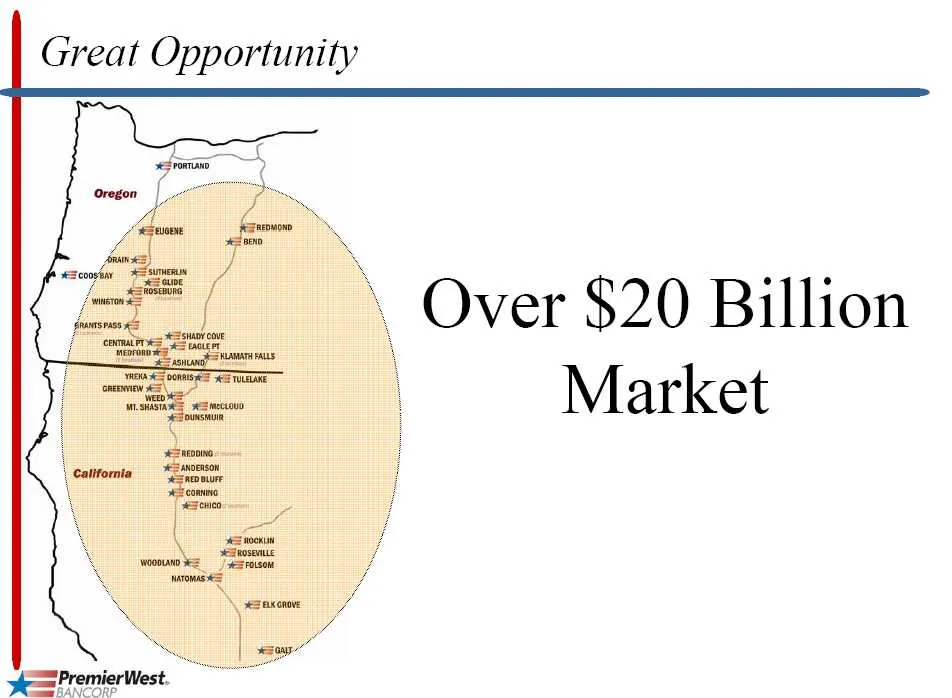
Slide 38: Great Opportunity
Great Opportunity © Over $20 Billion | Market
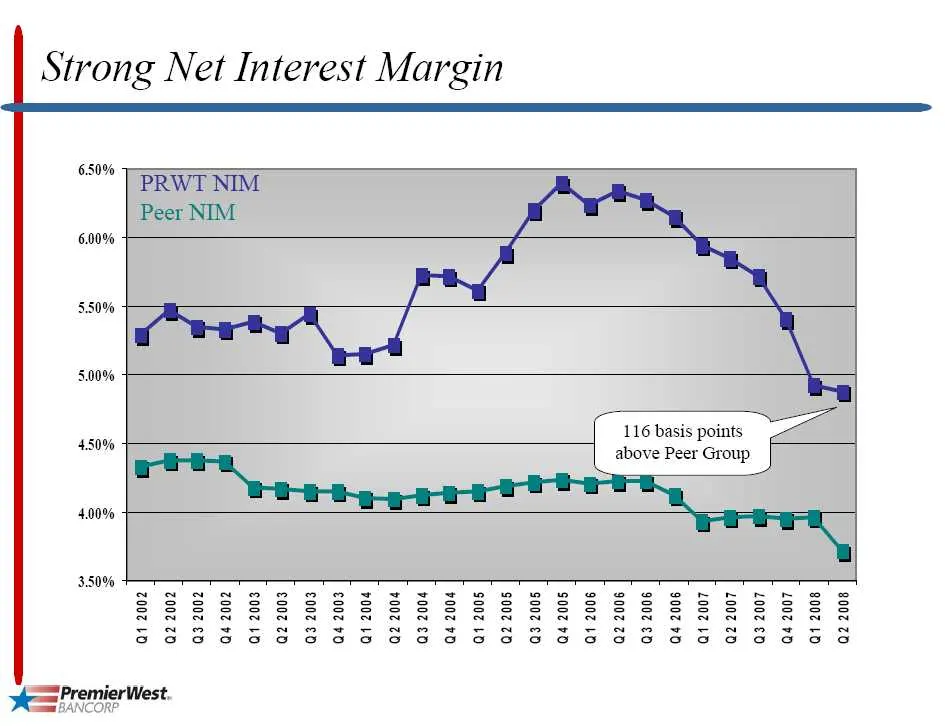
Slide 39: Strong Net Interest Margin
Strong Net Interest Margin = on | 116 basis points 450% above Peer Group 4.00% 3.50% SSS6G5S5 SEES EESESESESES sGaag yes PremierWest,
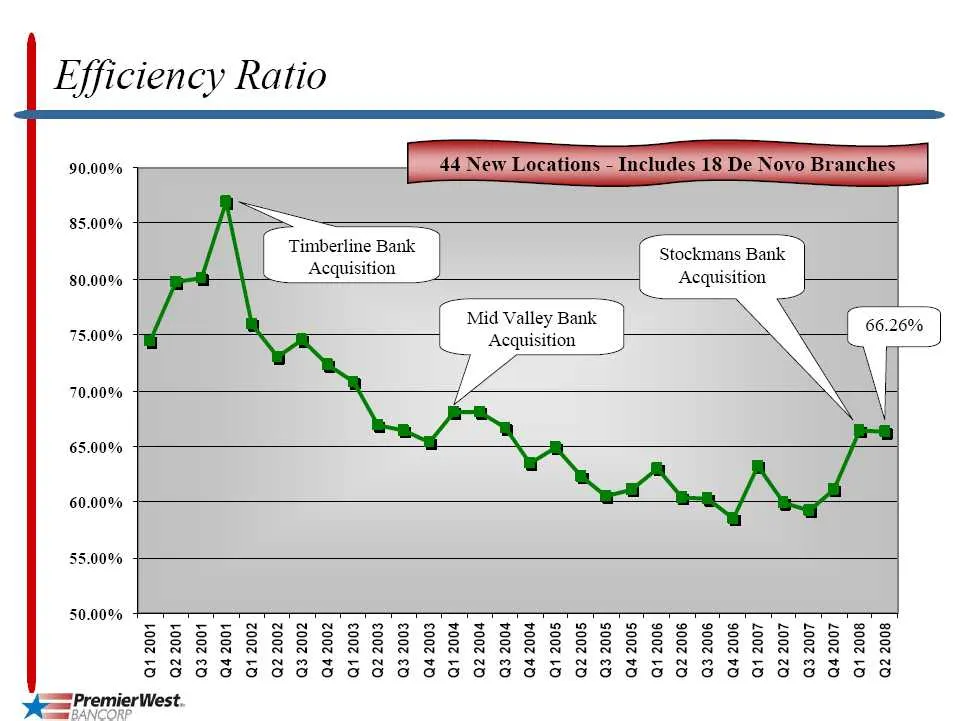
Slide 40: Efficiency Ratio
fficiency Ratio E, = nk Stockmans Ban Acquisition ie ‘qt ank | Timberline B: Acquisition Valley Bank Mid s a Acquisition 90.00% 4 80.00% 70.00% 60.00% 9002 2D 2002 1D 4002 O 2002 £0 4002 20 2002 10 9002 »D. 9002 £0 9002 0 9002 10 g00z ¥D $002 £0 $002 2D $002 10 002 O v00z £0 v00z 20 7002 1D £002 »D.
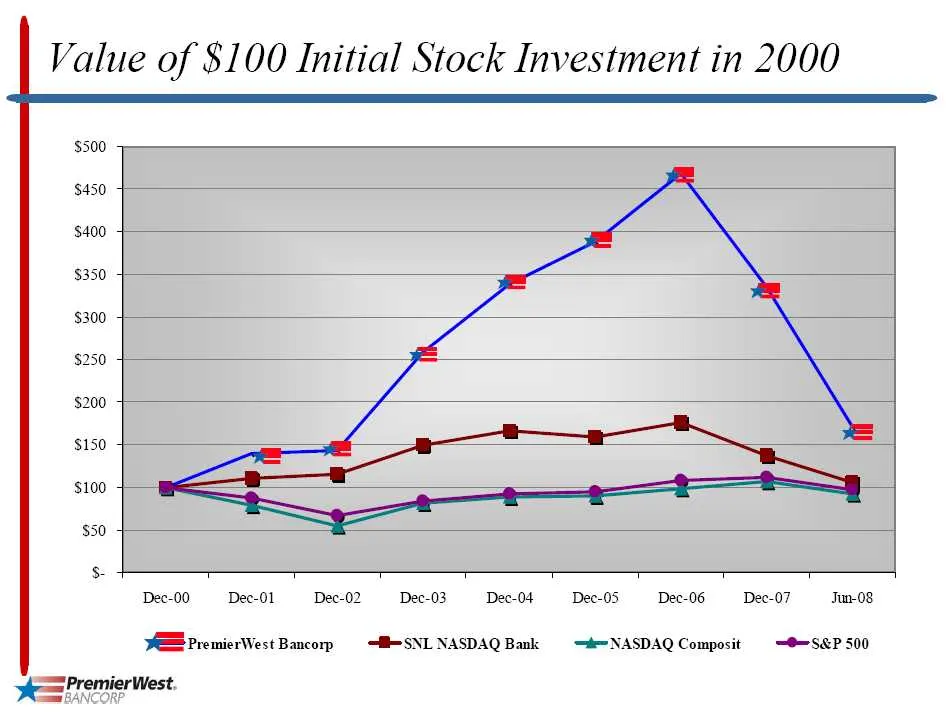
Slide 41: Value of $100 Initial Stock Investment in 2000
Value of $100 Initial Stock Investment in 2000 Dec-00 — Dee-01 Dec-02 — Dec-03 Dec-04 — Dec-05 Dec-06 Dec-07 Tun-08 EZ PremierWest Bancorp —HeSNLNASDAQBank = —#=NASDAQ Composit —®=S&P 500 yee PremierWest,
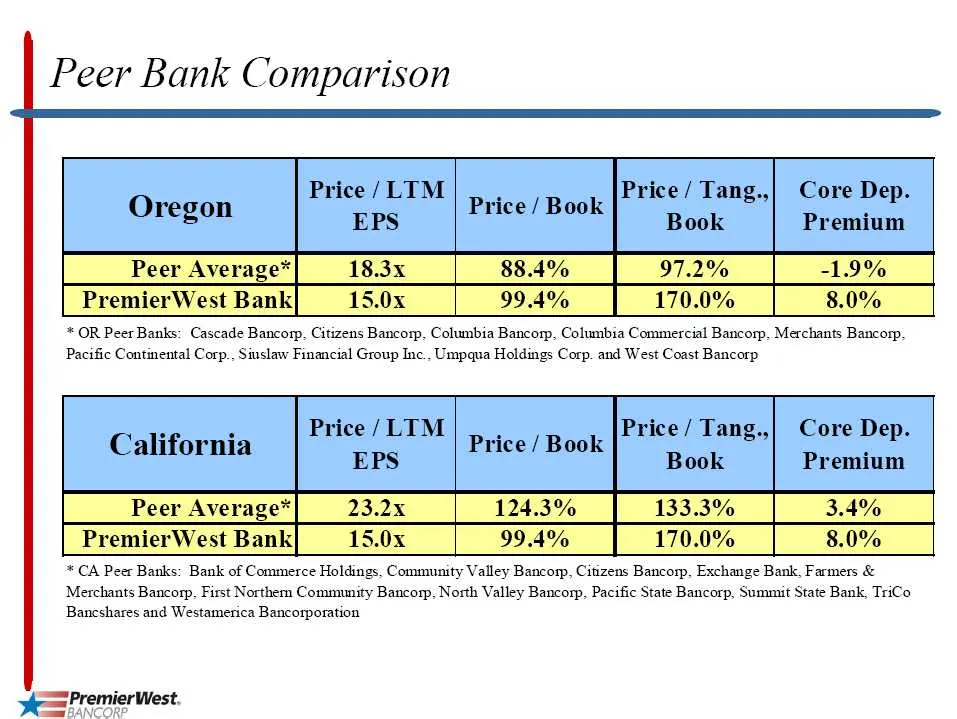
Slide 42: Peer Bank Comparison
Peer Bank Comparison Price / Tang., Book Core Dep. Premium * OR PeerBanks: Cascade Bancorp, Citizens Bancorp, Columbia Bancorp, Columbia Commercial Bancorp, Merchants Bancorp, Pacific Continental Corp.. Siuslaw Financial Group Inc., Umpqua Holdings Corp. and West Coast Bancorp Price / LIM Price / Ta
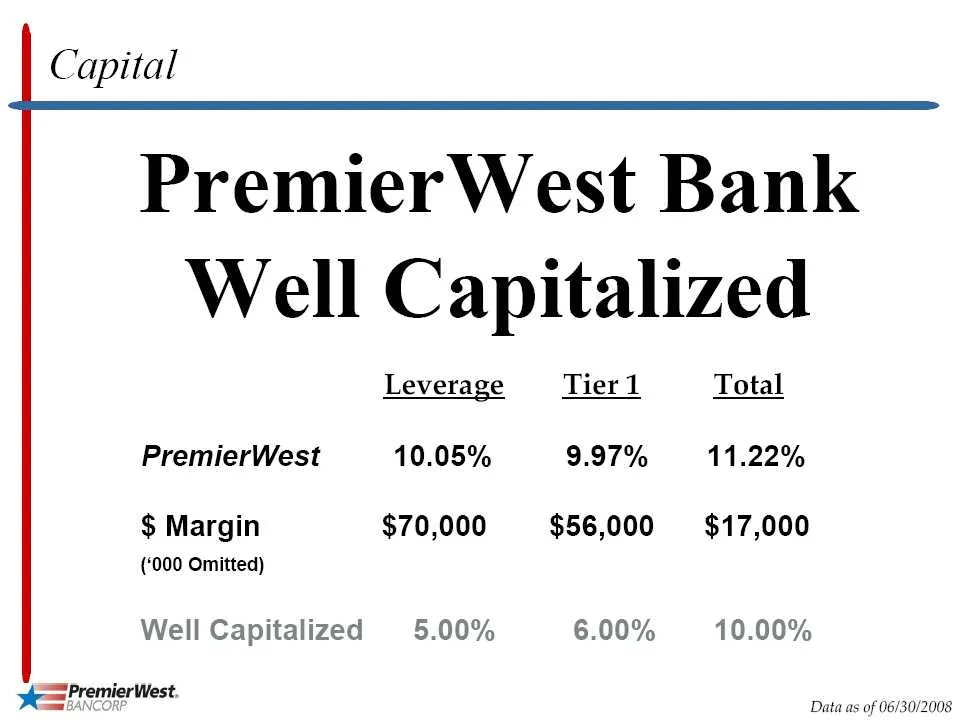
Slide 43: Capital
Capital PremierWest Bank Well Capitalized Leverage Tier 1 Total PremierWest 10.05% 9.97% 11.22% $ Margin $70,000 $56,000 $17,000 (‘000 Omitted) Well Capitalized 5.00% 6.00% 10.00% he PremierWest. mes BANC Data as of 06/30/2008
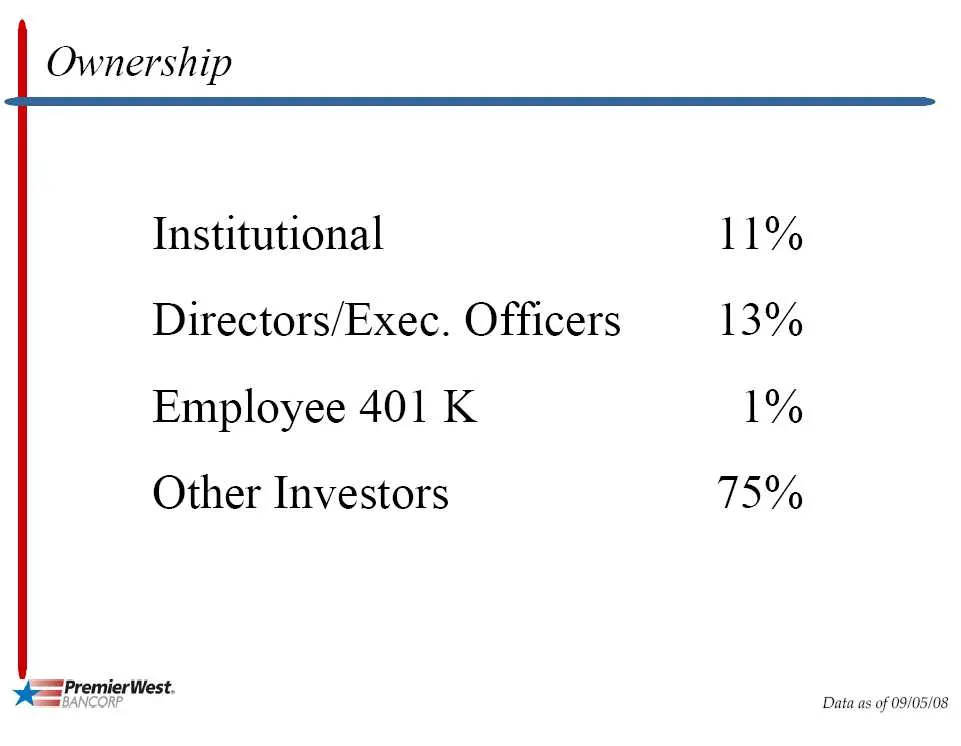
Slide 44: Ownership
Ownership Institutional 11% Directors/Exec. Officers 13% Employee 401 K 1% Other Investors 75% ye PremierWest, - Ses BANCORF Data as of 09/05/08
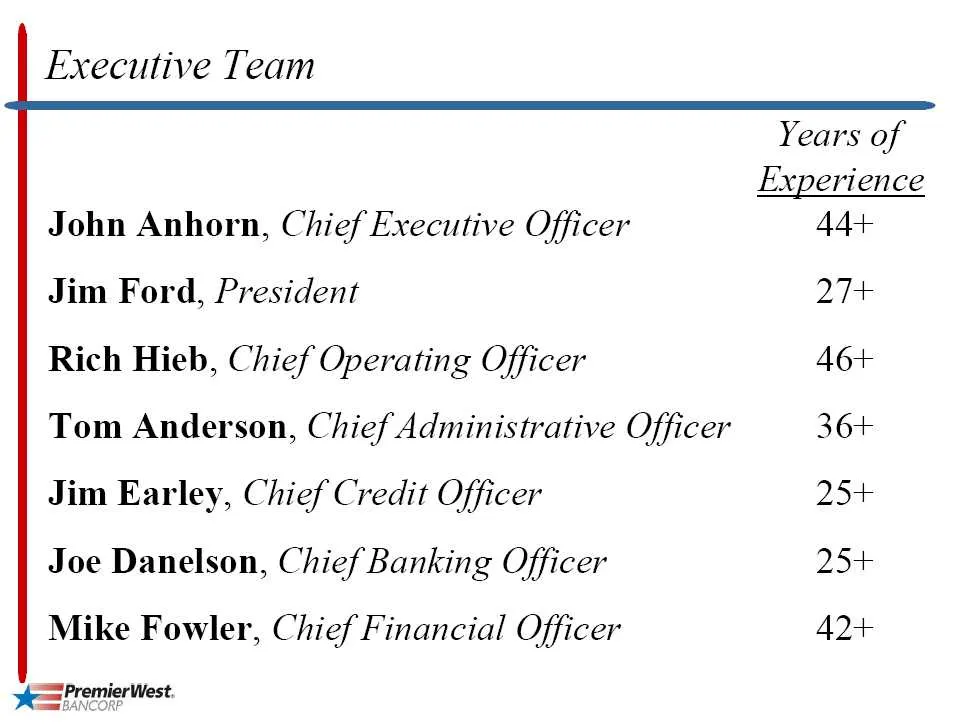
Slide 45: Executive Team
Executive Team Years of Experience John Anhorn, Chief Executive Officer 44+ Jim Ford, President 27+ Rich Hieb, Chief Operating Officer 46+ Tom Anderson, Chief Administrative Officer 36+ Jim Earley, Chief Credit Officer 25+ Joe Danelson, Chief Banking Officer 25+ Mike Fowler, Chief Financial Officer
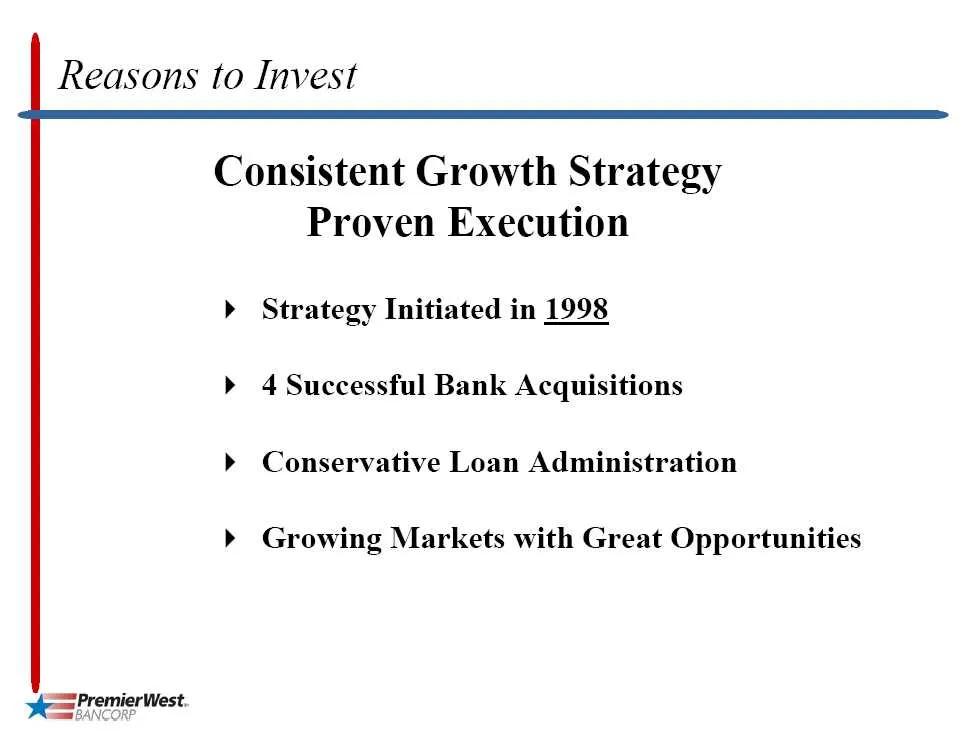
Slide 46: Reasons to Invest
Reasons to Invest Consistent Growth Strategy Proven Execution » Strategy Initiated in 1998 >» 4 Successful Bank Acquisitions > Conservative Loan Administration >» Growing Markets with Great Opportunities yes PremierWest,
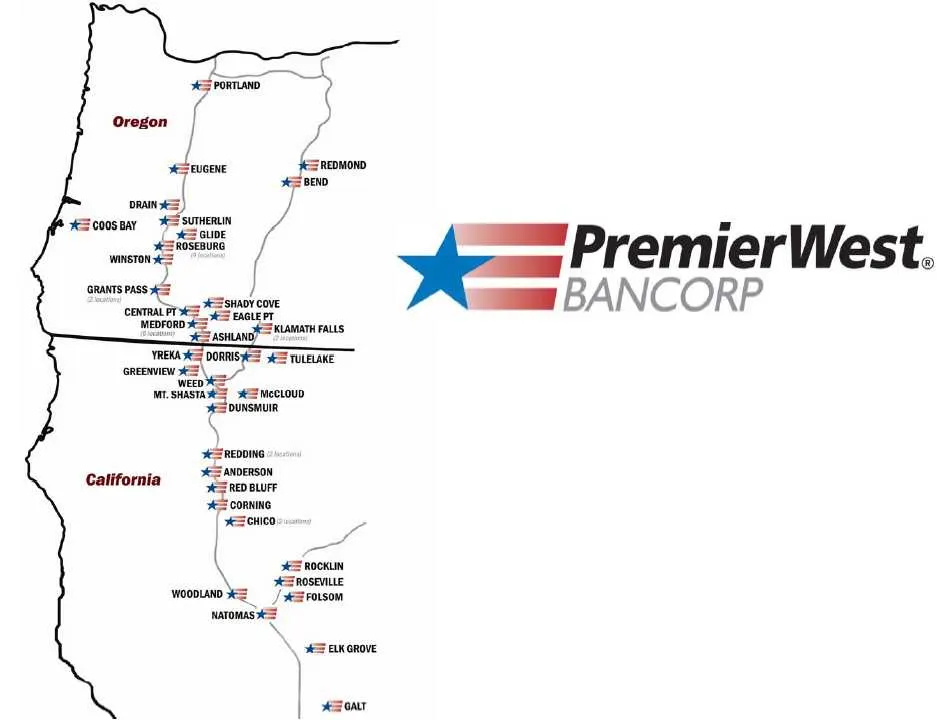
Slide 47: PremierWest Bancorp
==" PremierWest. sums BANCORP Mr SHASTA SZ MecLOUD eS puns ) ES REDOING SANDERSON bossa BLUFF se oornne cna , California
Source: SEC EDGAR · 8-K filed Sep 19, 2008
More decks from PremierWest Bancorp
 Shareholder Meeting (May 2011)27 slides · May 26, 2011
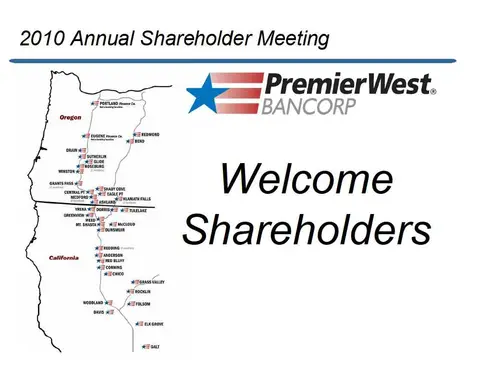 Shareholder Meeting (May 2010)29 slides · May 28, 2010
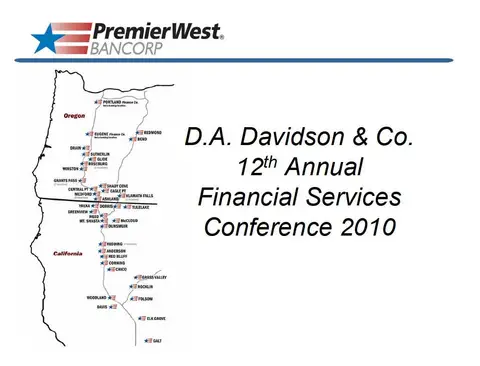 D.A. Davidson & Co. Annual Financial Services Conference 201027 slides · May 12, 2010
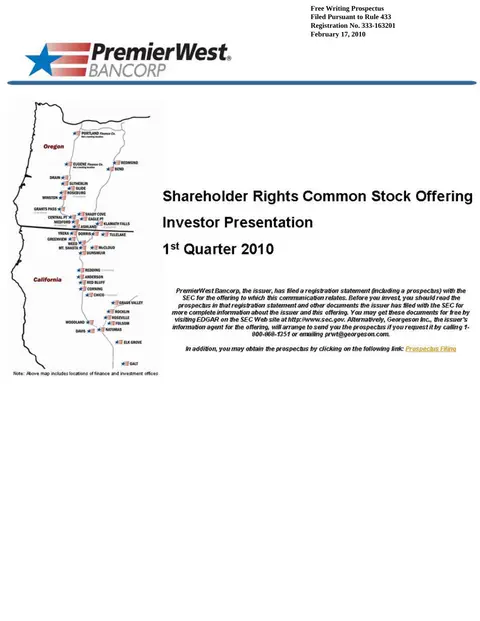 IPO Roadshow (February 2010)28 slides · Feb 18, 2010
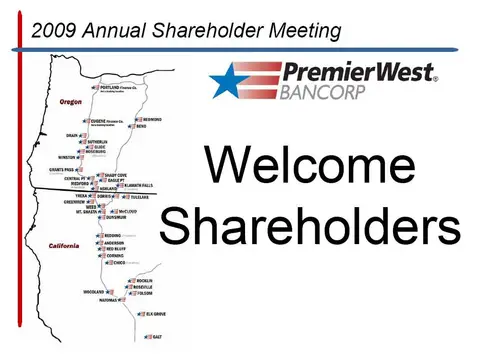 Shareholder Meeting (June 2009)27 slides · Jun 24, 2009
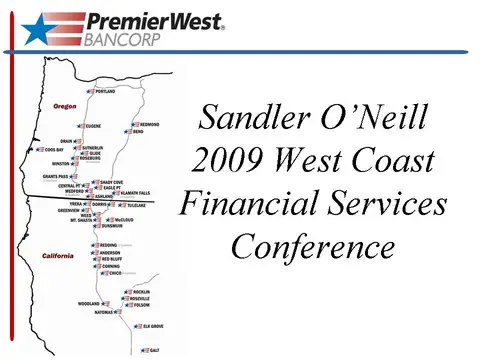 Sandler O'Neill 2009 West Coast Financial Services Conference16 slides · Feb 26, 2009