PremierWest Bancorp — Merger or Acquisition (February 2009)
10 slides from PremierWest Bancorp's merger presentation, Feb 19, 2009

Slide 1: Acquisition of Two Branches from Wells Fargo & Company
*S mmm BANCORP PremierWest. é ~ Acquisition of Two Branches from Wells Fargo & Company
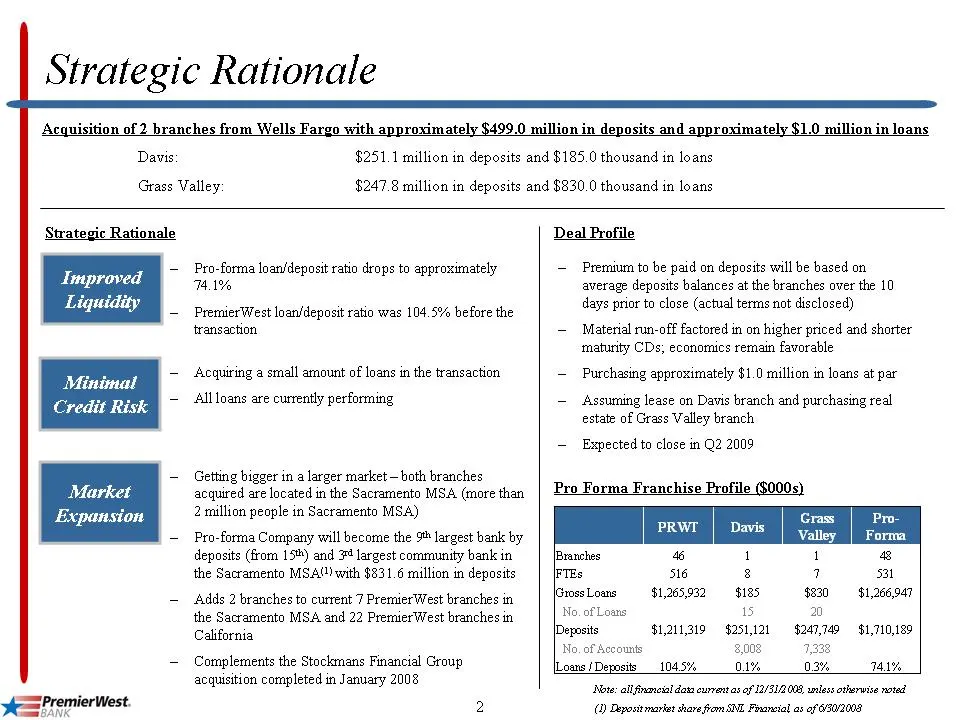
Slide 2: Strategic Rationale
Strategic Rationale Davis Grass Valley: $251.1 million in deposits and $185.0 thousand in loans $247.8 million in deposits and $830.0 thousand in loans Strategic Rationale Improved Liquidity Minimal Credit Risk Market Expansion es PremierWest Pro-forma loan/deposit ratio drops to approximately TAL%
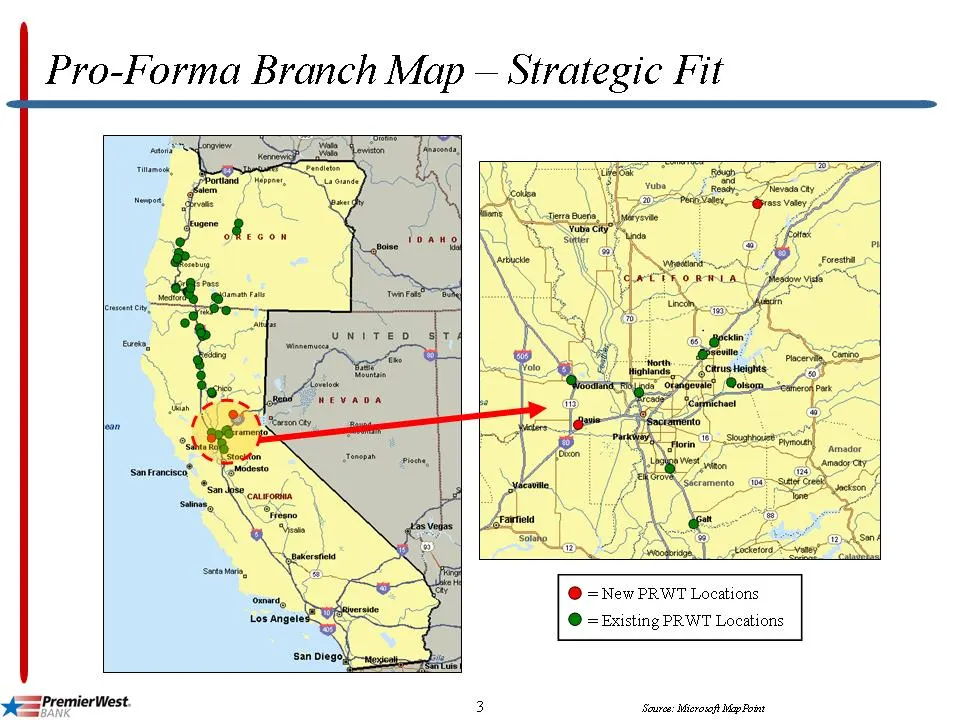
Slide 3: Pro-Forma Branch Map — Strategic Fit
Pro-Forma Branch Map — Strategic Fit Ac PremierWest UNITED bane Shei, CERO RwLA @ =New PRWT Locations @ =Existing PRWT Locations Source: Microsoft May Point
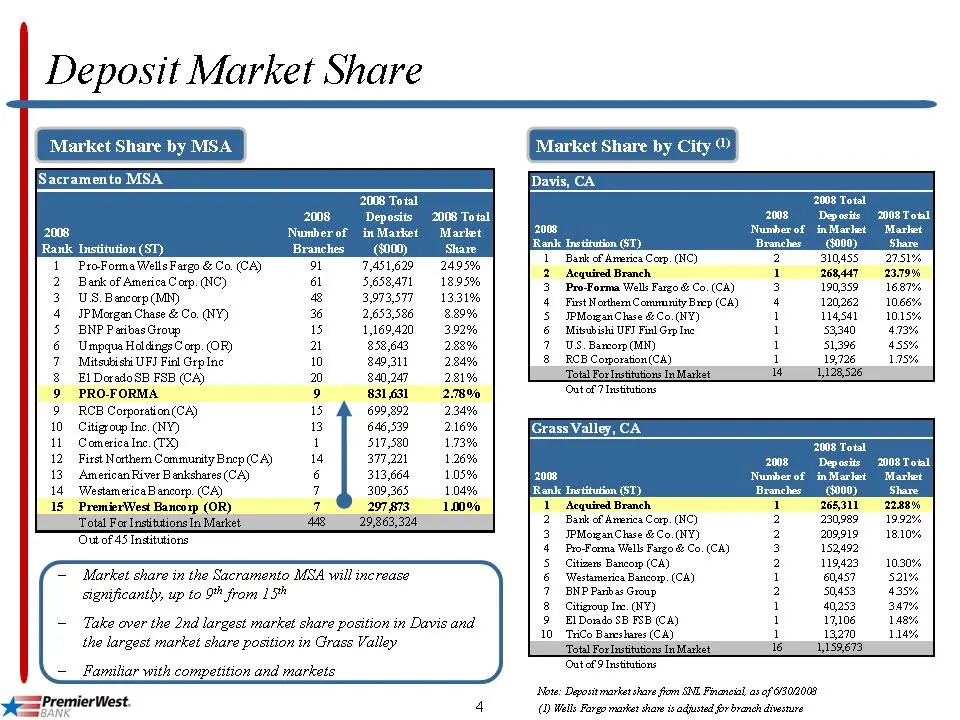
Slide 4: Sacramento MSA
Sacramento MSA 2008 Rank Institution (ST) ProForma Wells Fargo & Co. (CA) Bank of America Corp. (NC) US, Bancorp (MN) IP Morgen Chase & Co. (VY) BNP Paribas Group ‘Unpayua Hal dings C orp. (OR) Mitsubishi UFI Find Grp Ine El Dorado SB FSB (CA) PRO-FORMA RCE Corporation(CA) 10. Citigroup Ine. (NY) 11
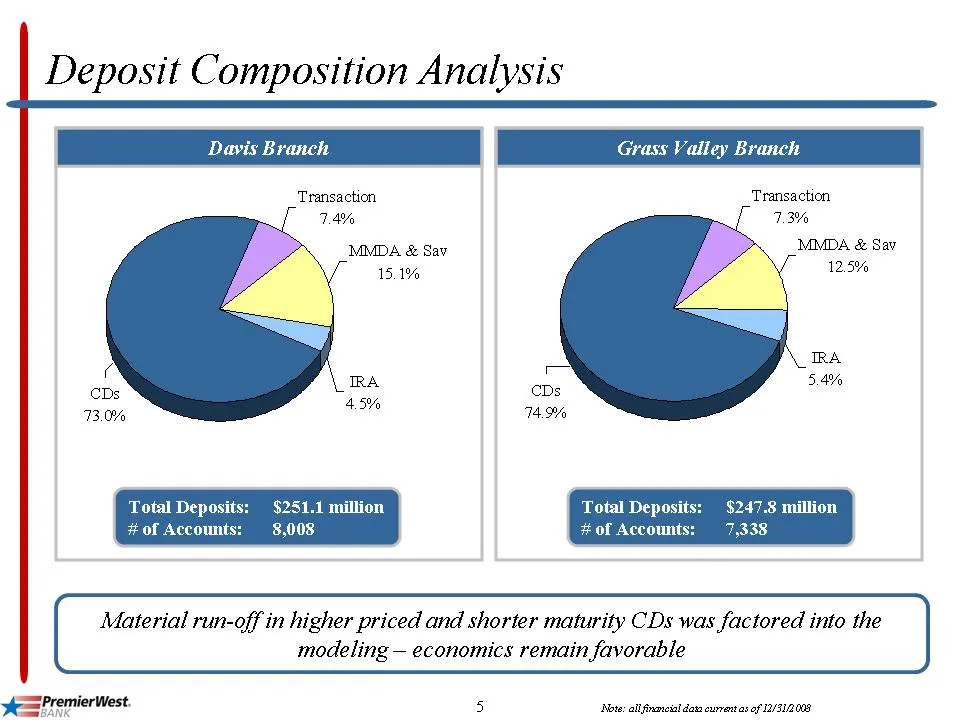
Slide 5: Deposit Composition Analysis
Deposit Composition Analysis Davis Branch Transaction 14% MMDA & Sav 15.1% 45% BM | Grass Valley Branch Transaction 1% MMDA & Sav 12.5% 5.4% Material run-off in higher priced and shorter maturity CDs was factored into the modeling — economics remain favorable yes PremierWest. 5 ‘Note: allfnaneial da
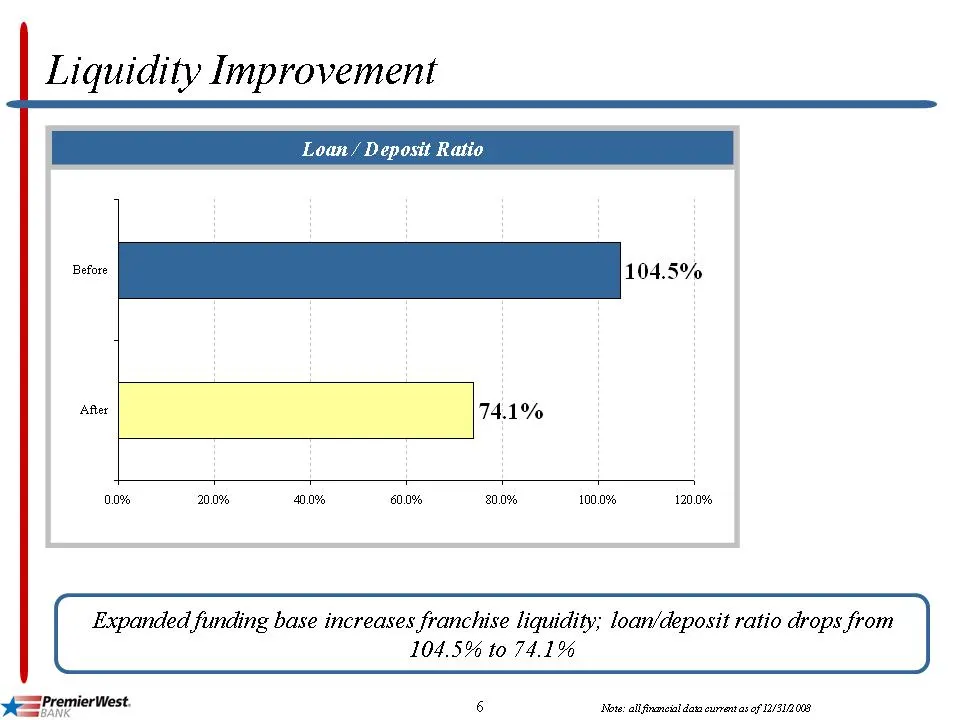
Slide 6: Liquidity Improvement
Liquidity Improvement 7 — —— 7 | Loan / Deposit Rati Before 104.5% After TAY 0.0% 20.0% 40.0% 60.0% 800% 100% 120.0% Expanded funding base increases franchise liquidity; loan/deposit ratio drops from 104.5% to 74.1% AesPremierWest. 6 te ol rca data cuvent cs of 2/8008
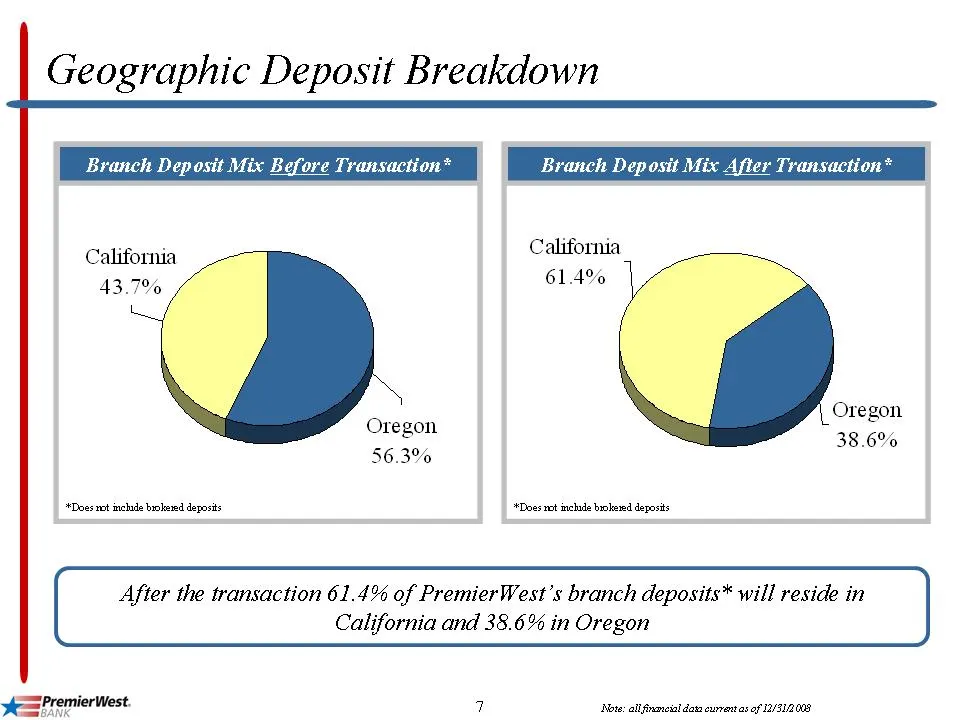
Slide 7: Geographic Deposit Breakdown
Geographic Deposit Breakdown | Branch Deposit Mix Before Transaction* | Branch Deposit Mix After Transaction* Oregon, 38.6% 56.3% Does not inchs banked deposits Does not inchs tasked deposits After the transaction 61.4% of PremierWe. California and 38.6% in Oregon yes PremierWest. 7 te ol rca data c
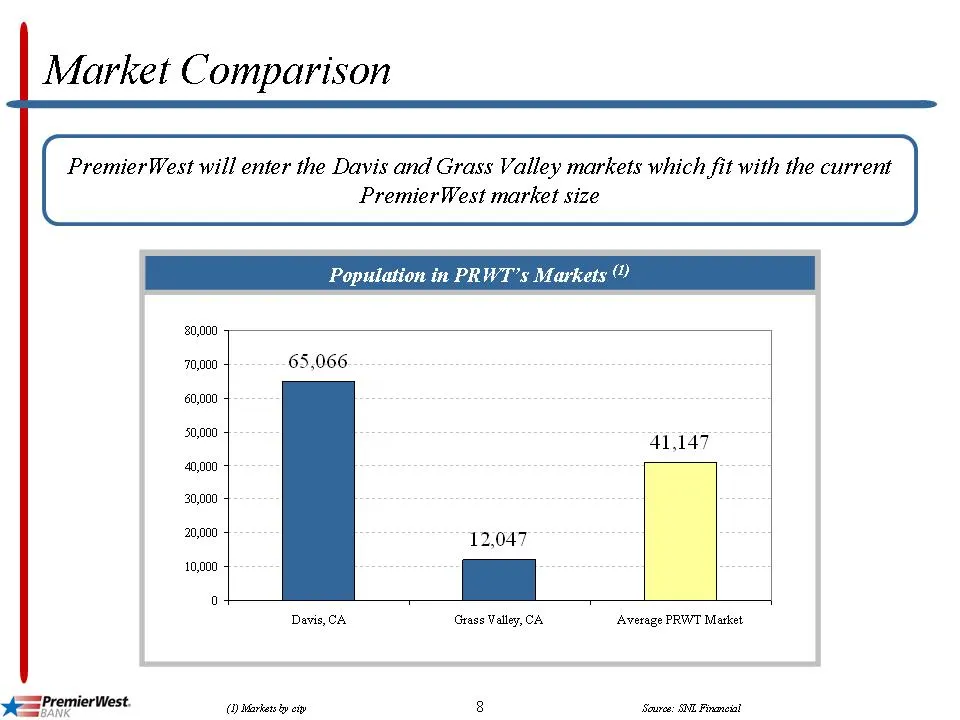
Slide 8: Market Comparison
Market Comparison PremierWest will enter the Davis and Grass Valley markets which fit with the current PremierWest market size Poputation it @ 70,000 65,066. 41,147 12,047 Davis, CA Grass Valley, CA, Average PRWT Market yes PremierWest. (2D) Markets by otty 8 Source: SNL Financial
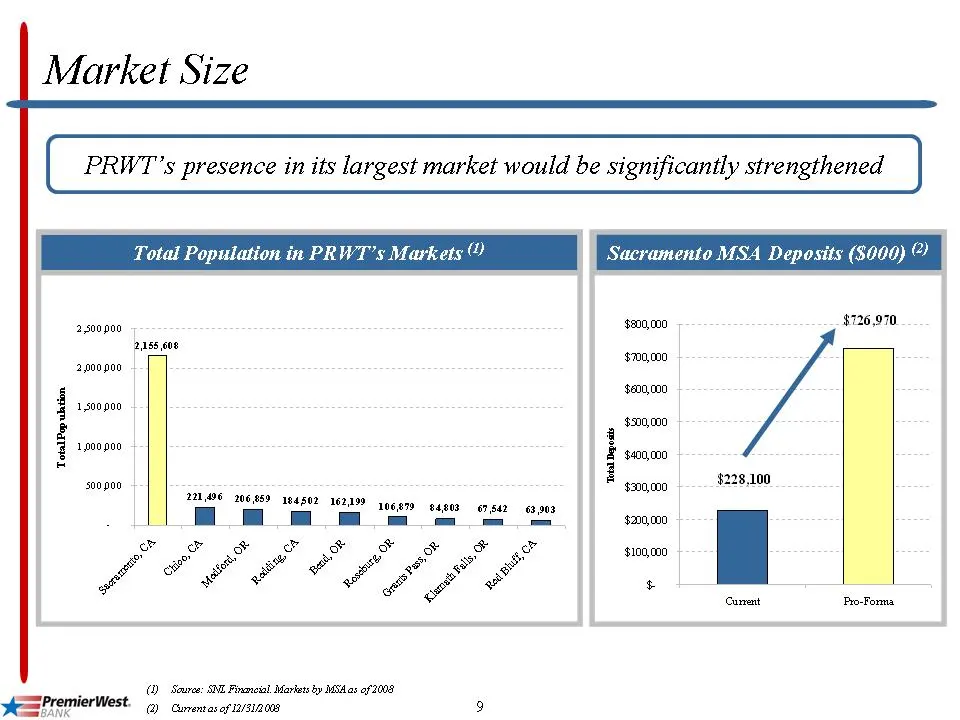
Slide 9: Market Size
Market Size Total Population in PRWT’s Markets? ) Sacramento MSA Deposits ($000) ® 2,500 p00 $800,000 $726,970 E 709.000 2,00 p00 sm) § ‘$e00,000 4 rsnpoo ssnqon0 f q soo poo i $00,000 $228,100 [| @ oe oe ee SS 200.000 109000 cs ume ProForm veri (Scare: SNE Francia Mares by MSA of 208 pesPremierWest
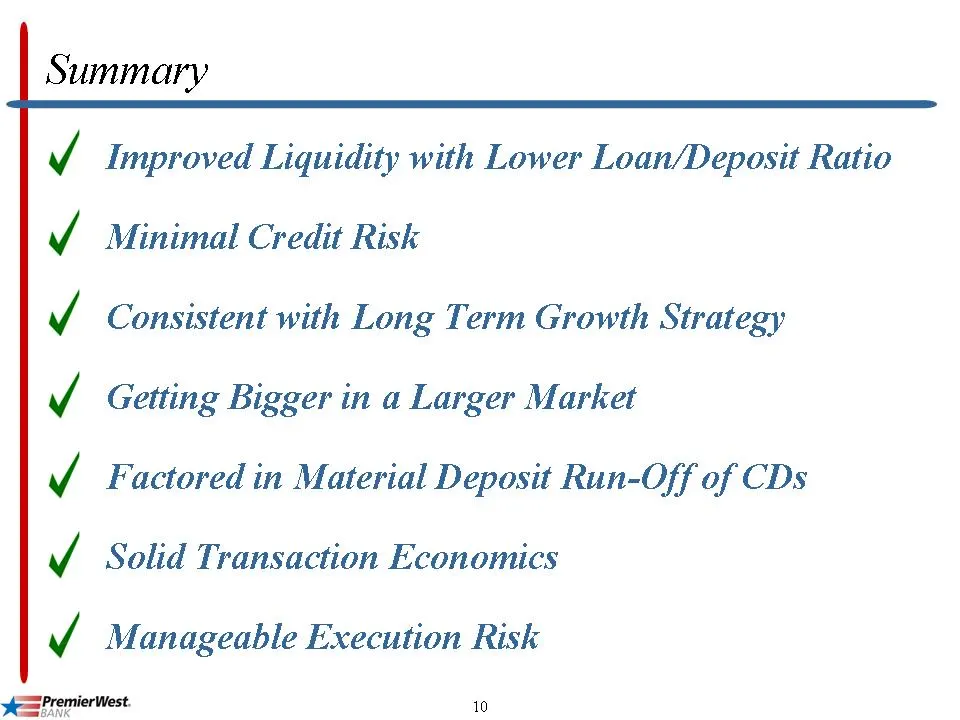
Slide 10: Improved Liquidity with Lower Loan/Deposit Ratio
/ / / / / / / yes PremierWest. Improved Liquidity with Lower Loan/Deposit Ratio Minimal Credit Risk Consistent with Long Term Growth Strategy Getting Bigger in a Larger Market Factored in Material Deposit Run-Off of CDs Solid Transaction Economics Manageable Execution Risk 10
Source: SEC EDGAR · 8-K filed Feb 19, 2009
More decks from PremierWest Bancorp
 Shareholder Meeting (May 2011)27 slides · May 26, 2011
 Shareholder Meeting (May 2010)29 slides · May 28, 2010
 D.A. Davidson & Co. Annual Financial Services Conference 201027 slides · May 12, 2010
 IPO Roadshow (February 2010)28 slides · Feb 18, 2010
 Shareholder Meeting (June 2009)27 slides · Jun 24, 2009
 Sandler O'Neill 2009 West Coast Financial Services Conference16 slides · Feb 26, 2009