Superior Drilling Products Inc
Superior Drilling Products — Q1 2020 Earnings Presentation
17 slides from Superior Drilling Products's earnings presentation, May 8, 2020
Slide 1: First Quarter 2020 Financial Results Conference Call
Wy SUPERIOR DRILLING PRODUCTS FIRST QUARTER 2020 FINANCIAL RESULTS CONFERENCE CALL MAY 8, 2020 NYSE American: SDPI www.sdpi.com © 2020 Superi
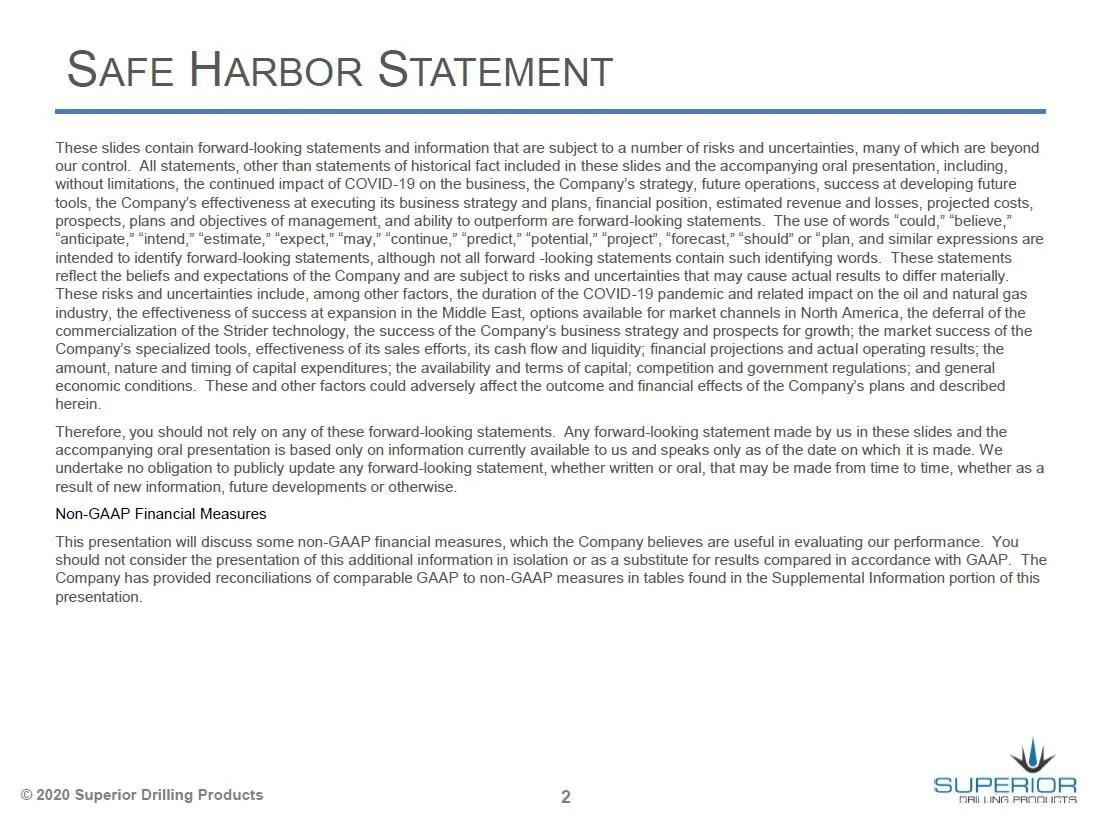
Slide 2: Safe Harbor Statement
SAFE HARBOR STATEMENT These slides contain forward-looking statements and information that are subject to a number of risks and uncertainties, many of which are beyond our control. All statements, other than statements of historical fact included in these slides and the accompanying oral presentatio
Slide 3: Troy Meier, Chairman and Chief Executive Officer
Wy SUPERIOR DRILLING PRODUCTS TROY MEIER CHAIRMAN AND CHIEF EXECUTIVE OFFICER © 2020 Superior Drilling Products
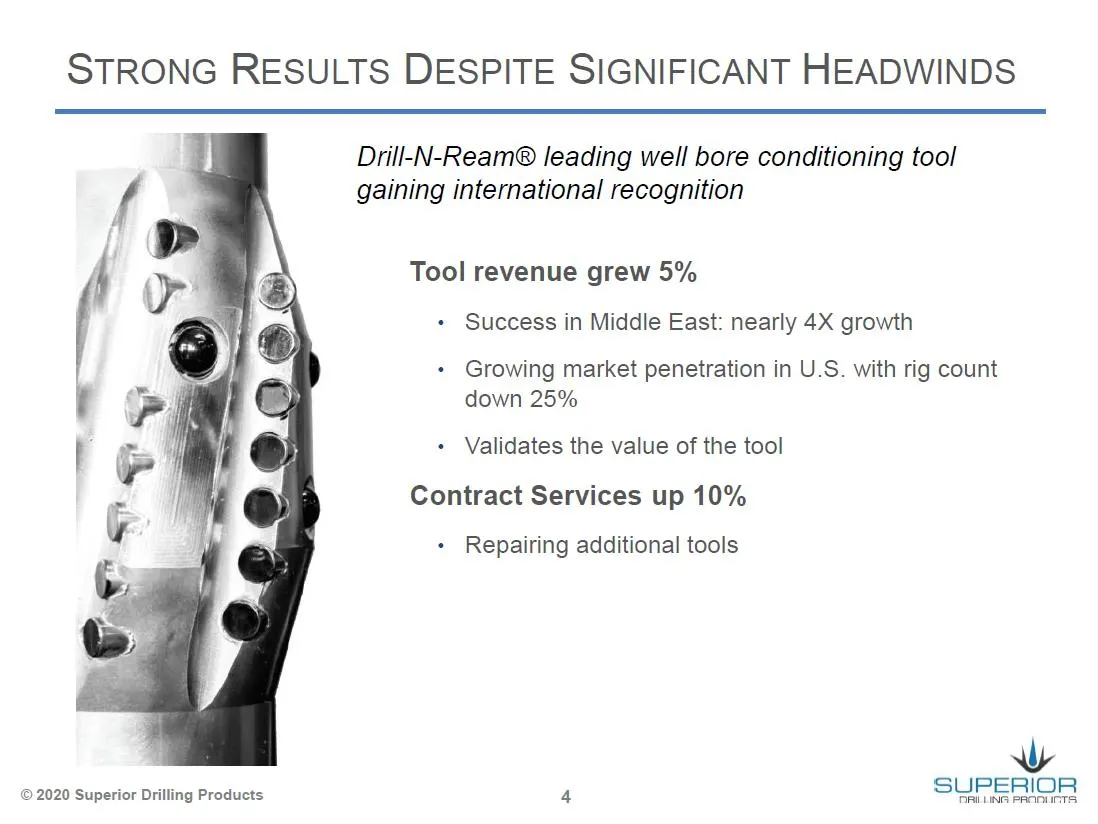
Slide 4: Strong Results Despite Significant Headwinds
STRONG RESULTS DESPITE SIGNIFICANT HEADWINDS Drill-N-Ream® leading well bore conditioning tool gaining international recognition Tool revenue grew 5% + Success in Middle East: nearly 4X growth + Growing market penetration in U.S. with rig count down 25% + Validates the value of the tool Contract Ser
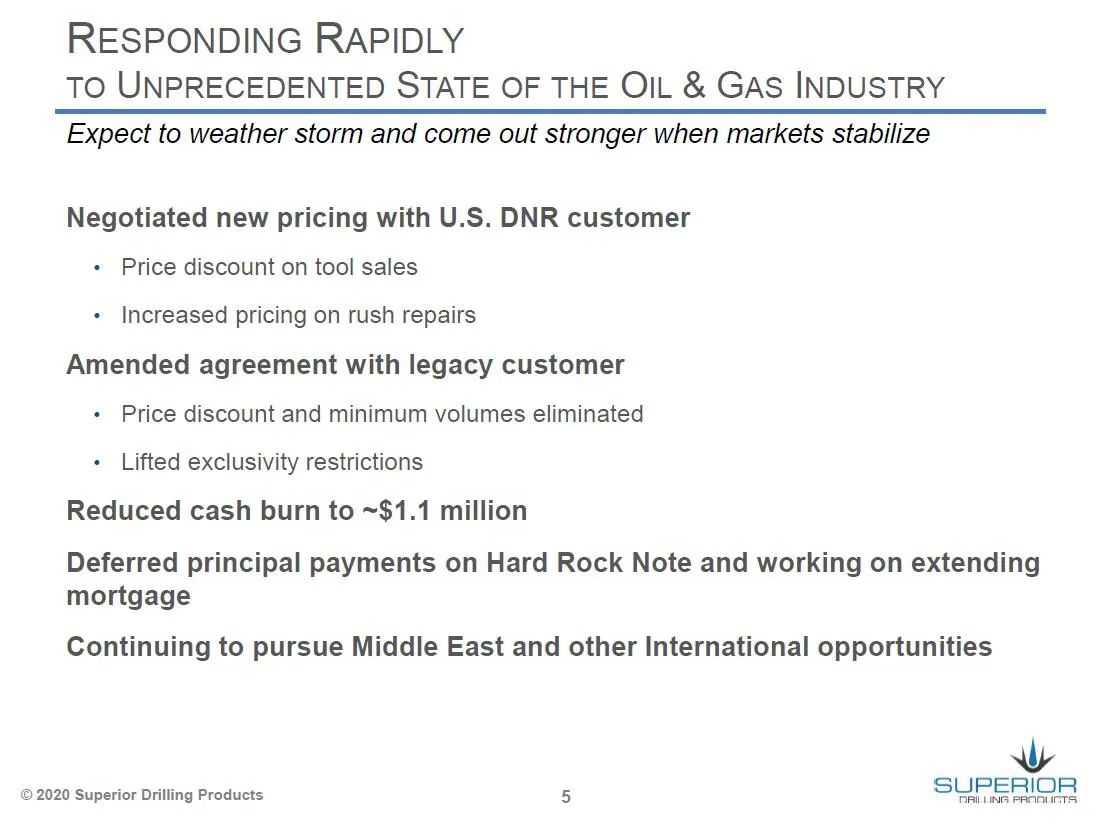
Slide 5: Responding Rapidly to Unprecedented State of the Oil & Gas Industry
RESPONDING RAPIDLY TO UNPRECEDENTED STATE OF THE OIL & GAS INDUSTRY Expect to weather storm and come out stronger when markets stabilize Negotiated new pricing with U.S. DNR customer + Price discount on tool sales + Increased pricing on rush repairs Amended agreement with legacy customer + Price dis
Slide 6: Christopher Cashion, Chief Financial Officer
Wy SUPERIOR DRILLING PRODUCTS CHRISTOPHER CASHION CHIEF FINANCIAL OFFICER ©2020 Superior
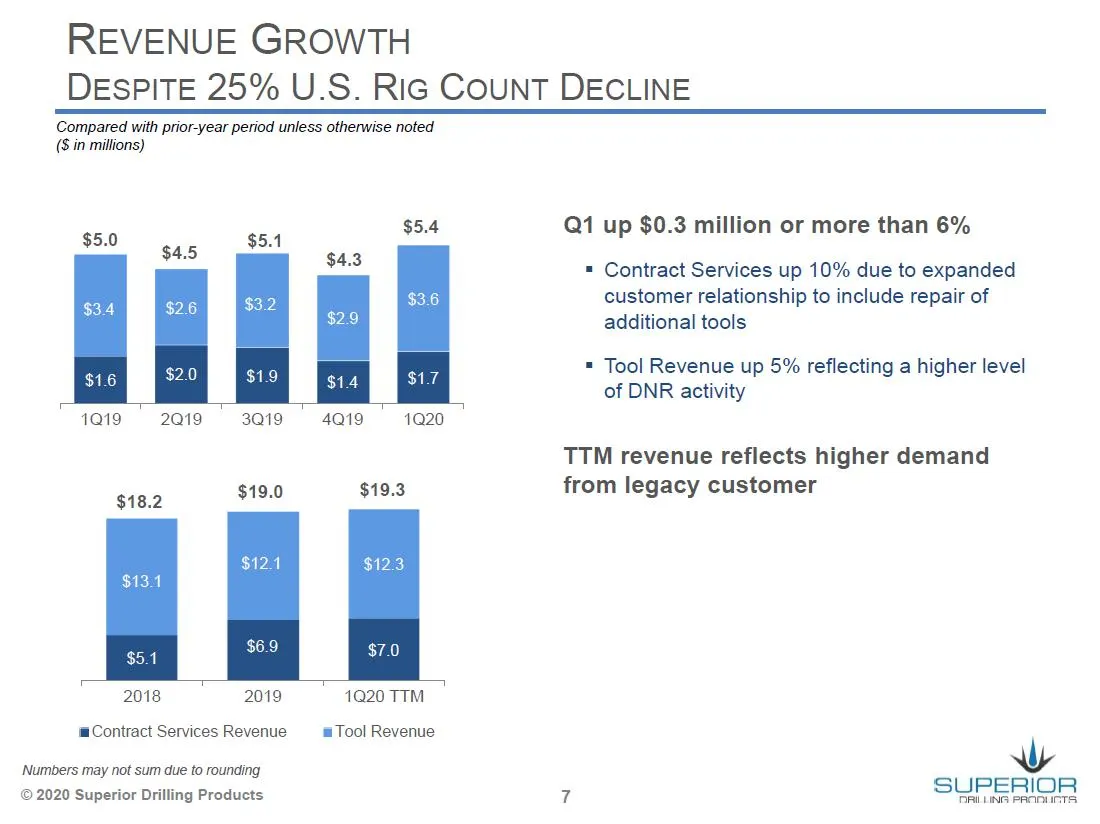
Slide 7: Revenue Growth Despite 25% U.S. Rig Count Decline
REVENUE GROWTH DESPITE 25% U.S. RIG COUNT DECLINE Compared with prior-year period unless otherwise noted (8 in millions) Q1 up $0.3 million or more than 6% = Contract Services up 10% due to expanded customer relationship to include repair of additional tools = Tool Revenue up 5% reflecting a higher
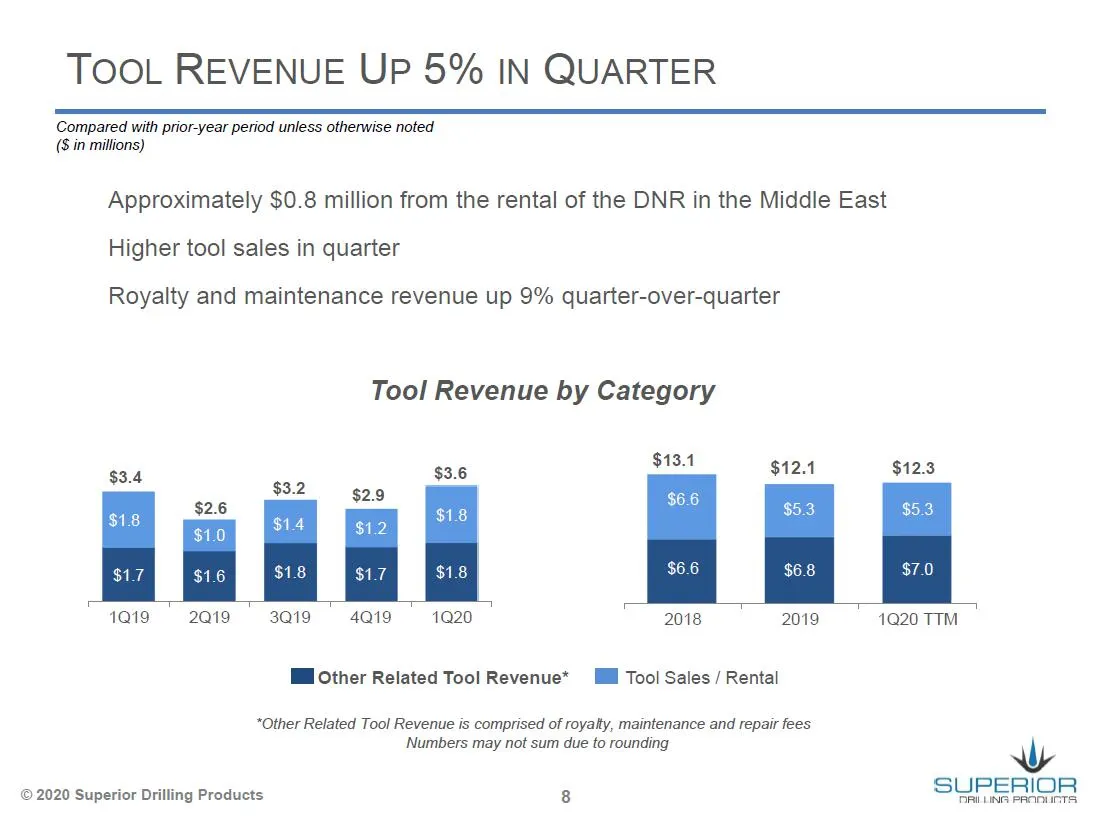
Slide 8: Tool Revenue Up 5% in Quarter
TOOL REVENUE UP 5% IN QUARTER Compared with prior-year period unless otherwise noted (8 in millions) Approximately $0.8 million from the rental of the DNR in the Middle East Higher tool sales in quarter Royalty and maintenance revenue up 9% quarter-over-quarter Tool Revenue by Category S184 $12.4 $1
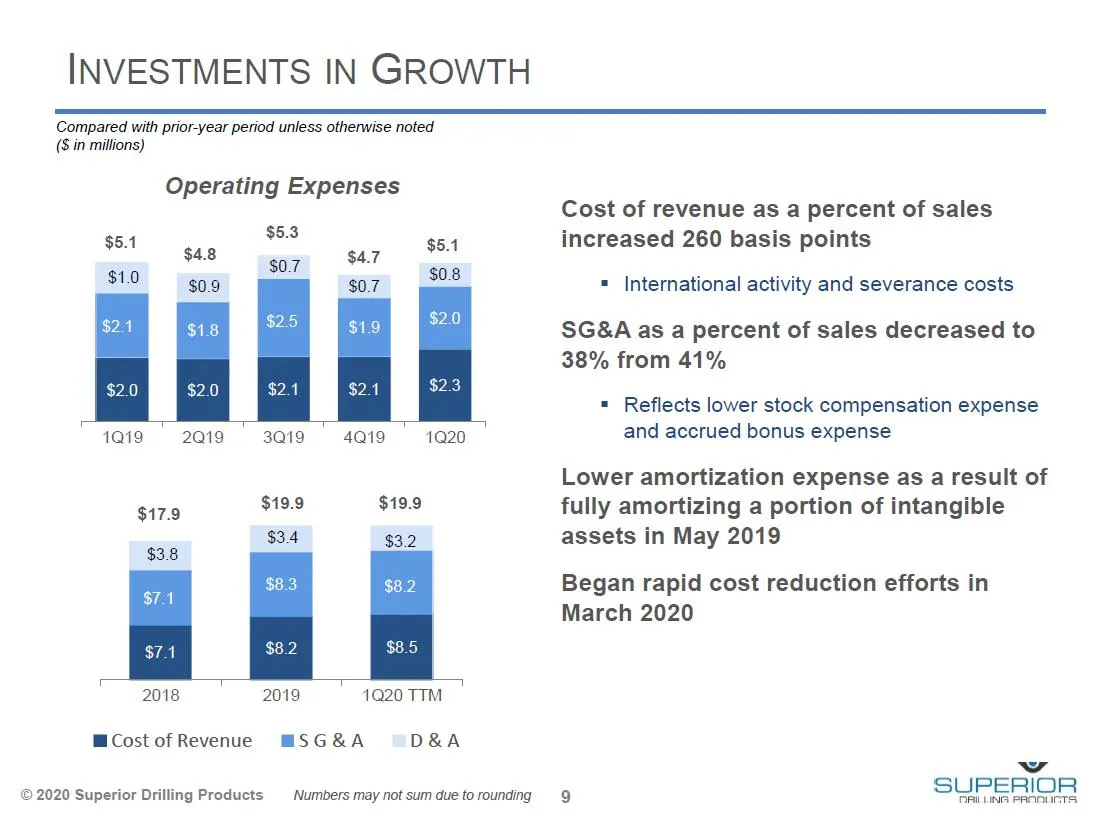
Slide 9: Investments in Growth
INVESTMENTS IN GROWTH Compared with prior-year period unless otherwise noted (8 in millions) Operating Expenses $5.3 $07 $5.1 $1.0 $4.8 $0.9 $4.7 $07 1a19 2019. 3Q19. 4Q19.—: 1420 $17.9 $19.9 $19.9 $3.4 3.2 $3.8 . $7.1 $7.1 “2018 "2019 1Q20TTM | MCostofRevenue MSG&A D&A © 2020 Superior Drilling Prod
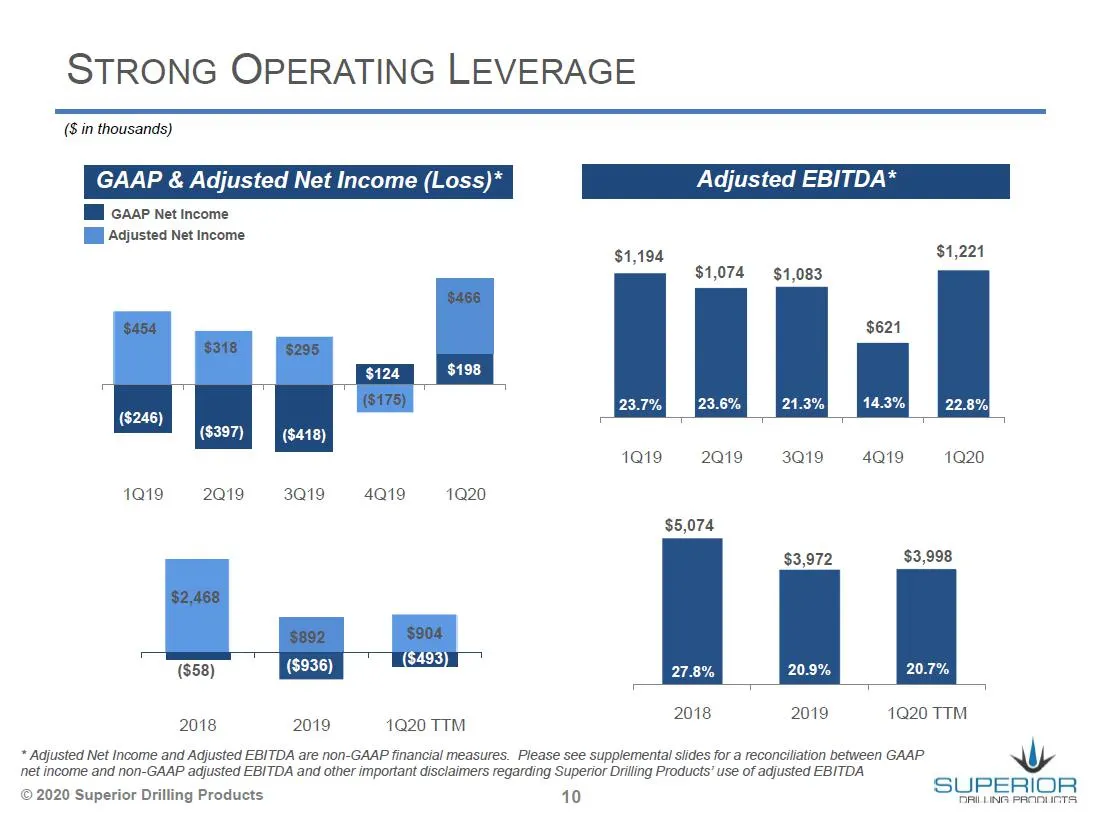
Slide 10: Strong Operating Leverage
STRONG OPERATING LEVERAGE (8 in thousands) GAAP & Adjusted Net Income (Loss)* Tl caap Net income [Hl Agjusted Net Income ($246) ($397) ($418) 1Q19 2Q19 3Q19 4Q19 1Q20 Adjusted EBITDA* $1,194 $1,221 1Q19 2019 3019 4Q19 1Q20 $5,074 $3,972 $3,998 ($58) — 278% 209% 20.7% 2018 2019 1920 TTM 2018 2oie 102
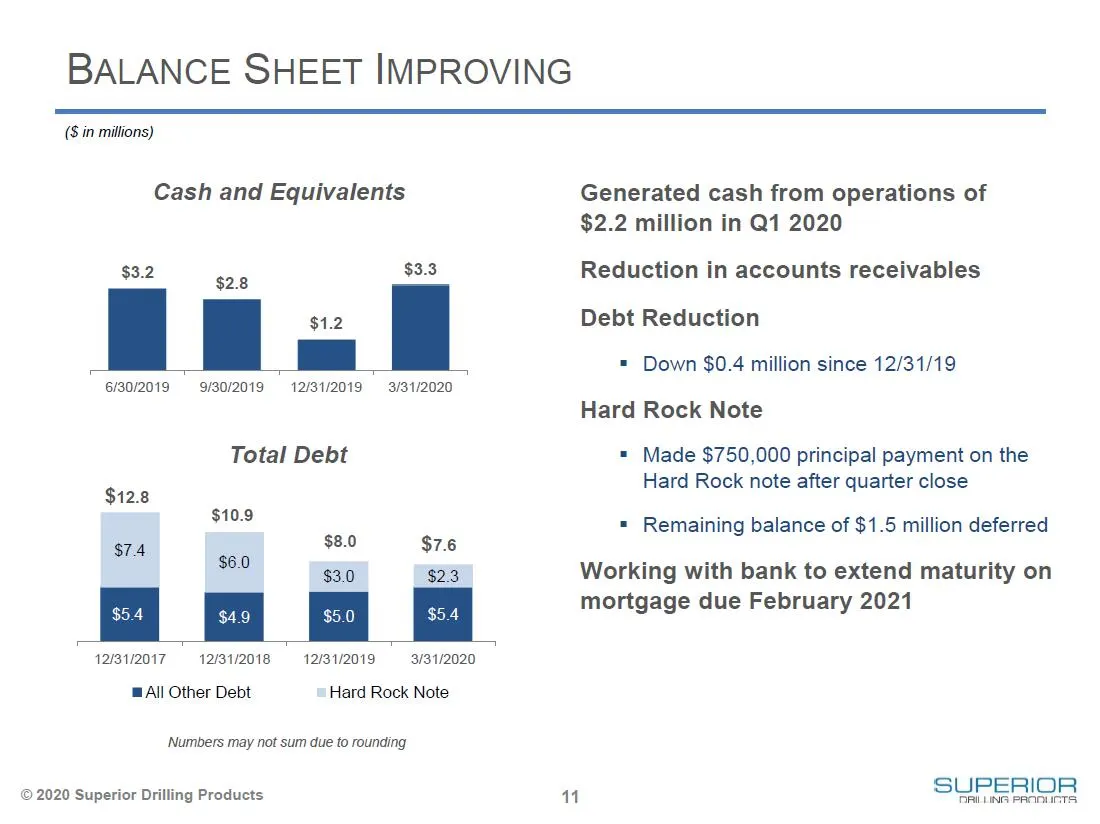
Slide 11: Balance Sheet Improving
BALANCE SHEET IMPROVING (Sin millions) Cash and Equivalents sla $2.8 3 $1.2 6/30/2019 9/30/2019 12/31/2019 3/31/2020 Total Debt $128 $10.9 $8.0 $7.6 $3.0 $23 $5.0 12/31/2017 12/31/2018 + 12/31/2019 3/31/2020 All Other Debt Hard Rock Note ‘Numbers may not sum due to rounding © 2020 Superior Drilling
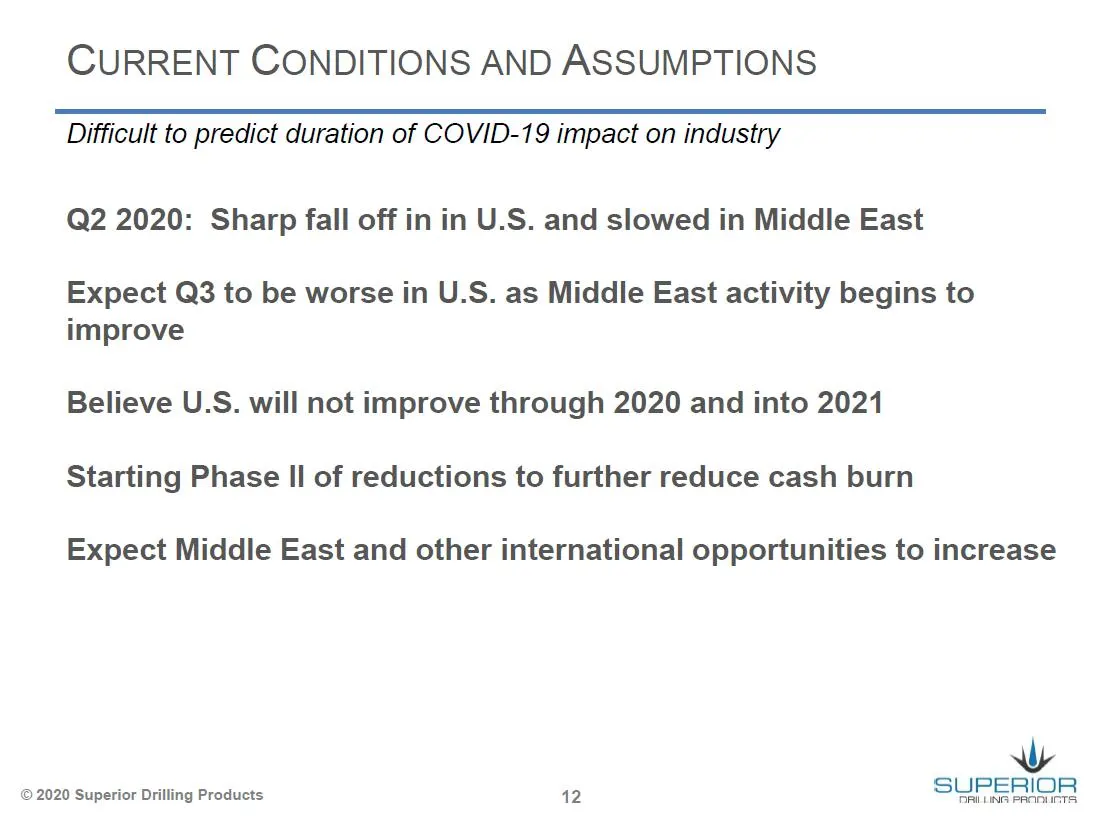
Slide 12: Current Conditions and Assumptions
CURRENT CONDITIONS AND ASSUMPTIONS Difficult to predict duration of COVID-19 impact on industry Q2 2020: Sharp fall off in in U.S. and slowed in Middle East Expect Q3 to be worse in U.S. as Middle East activity begins to improve Believe U.S. will not improve through 2020 and into 2021 Starting Phase
Slide 13: Supplemental Information
Wy SUPERIOR DRILLING PRODUCTS SUPPLEMENTAL INFORMATION
Slide 14: Adjusted Net Income Reconciliation
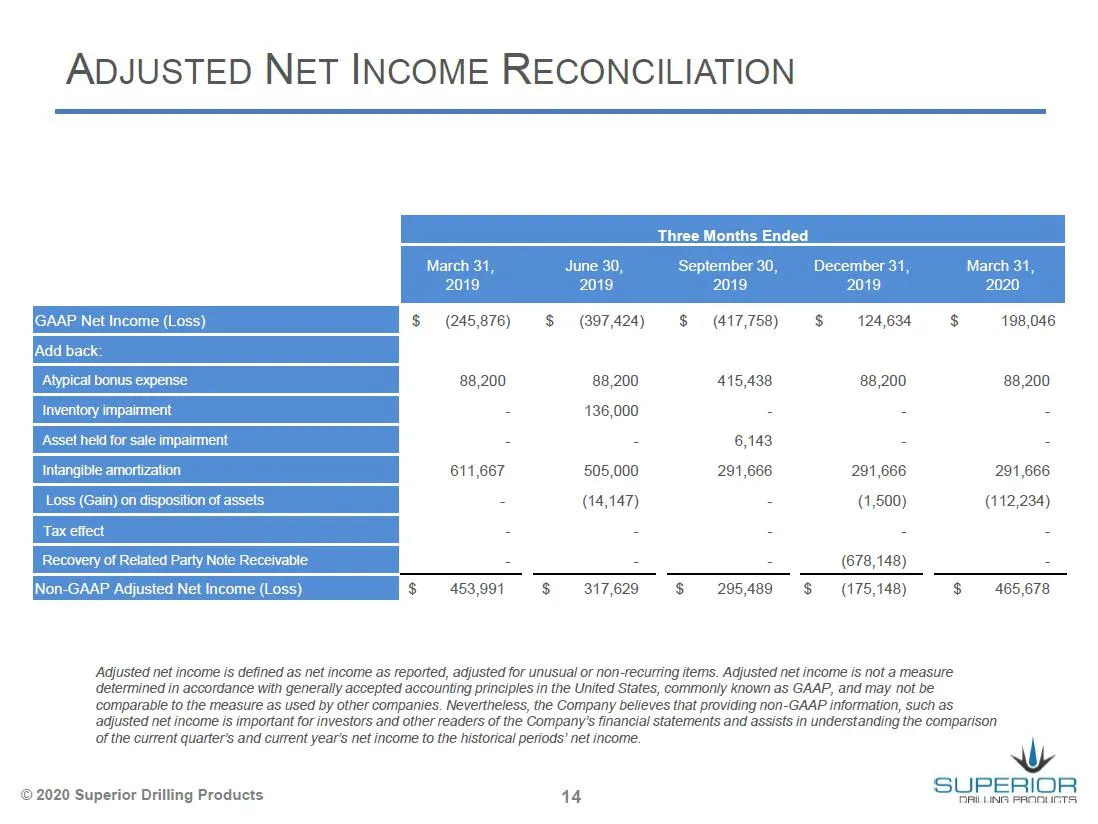
ADJUSTED NET INCOME RECONCILIATION $ (245,876) $ (397,424) $ (417,758) $ 124634 $ 198,046 88,200 88,200 415,438 88,200 88,200 - 99000 . : 611,667 505,000 291,666 291,666 291,666 san team) 9230 . . ___ra48 Non-GAAP Adjusted Net Income (Loss) $ 453991 $ 317629 $ 295,489 $ (175,148) $ 465,678 Adjusted
Slide 15: Adjusted Net Income Reconciliation
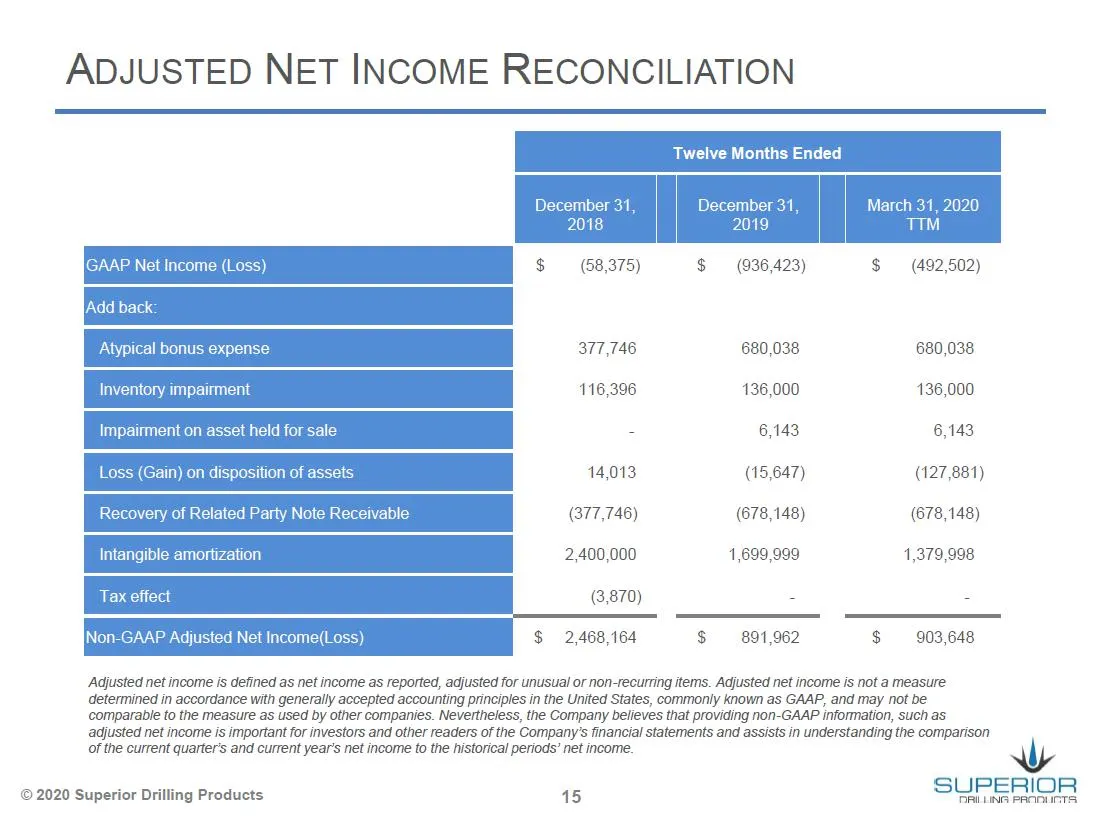
ADJUSTED NET INCOME RECONCILIATION elve Months Ended December 31, December 31, 2019 $ (68,375) $ (936,423) $ (492,502) 377,746 680,038 680,038 116,396 136,000 136,000 - 6,143 6,143 14,013 (15,647) (127,881) (377,746) (678,148) (678,148) 2,400,000 1,699,999 1,379,998 (3,870) = 2 $ 2,468,164 $ 891,962
Slide 16: Adjusted EBITDA Reconciliation
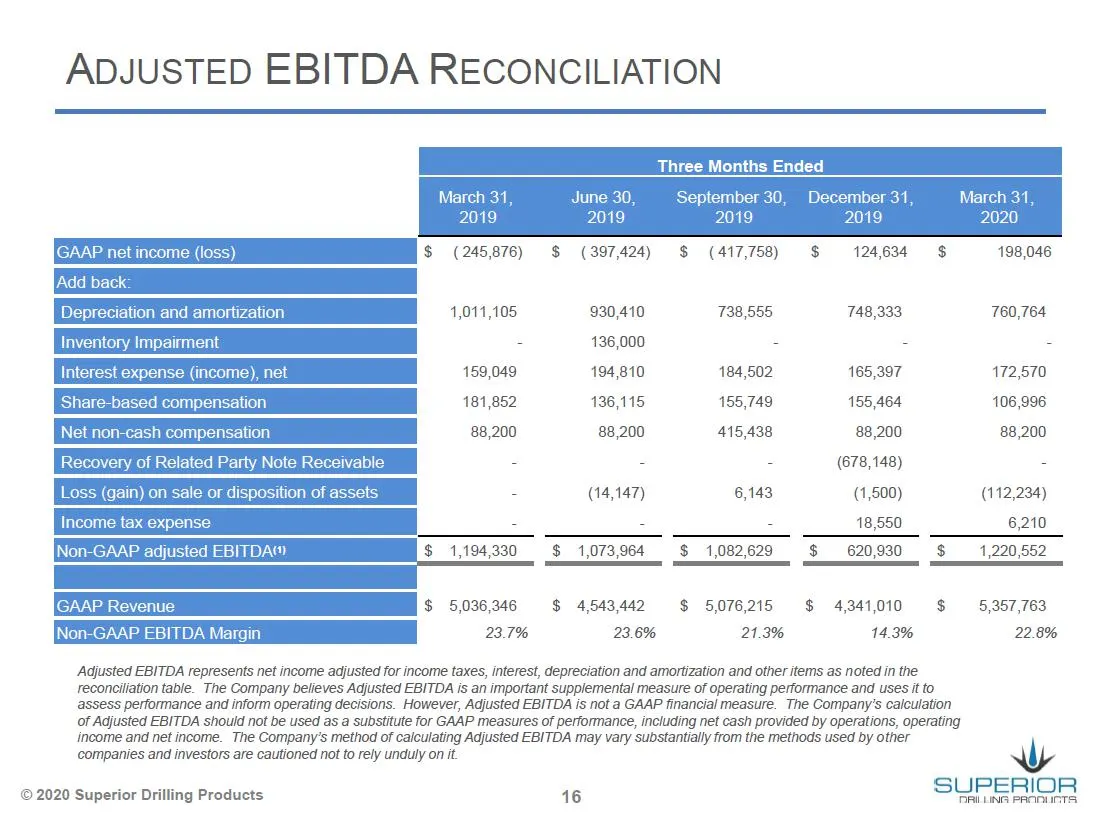
ADJUSTED EBITDA RECONCILIATION Three Months Ended March 31, 2020 June 30, September 30, 2019 2019 $ |GAAP net income (loss) $ (245,876) $ (397,424) Add bi 1,011,105 930,410 738,555 748,333 760,764 - 136,000 - 189,049 194,810 184,502 165,397 172,570 181,852 136,115 155,749 155,464 106,996 88,200 88,2
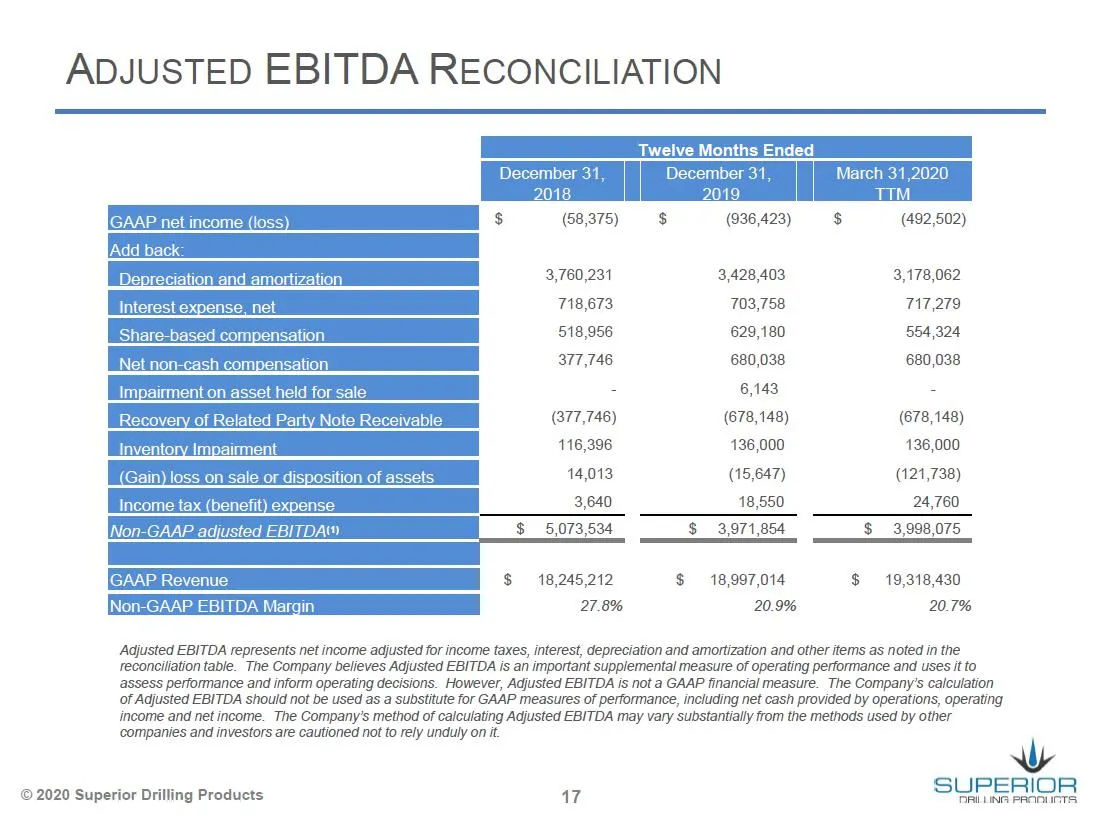
Slide 17: Adjusted EBITDA Reconciliation
ADJUSTED EBITDA RECONCILIATION Twelve Months Ended 2018 01 S$ (69375) $938,428) $492,802) [2] Ll 3,760,231 3,428,403 3,178,062 ne Share-based compensation 518,956 629,180 554,324 377,748 680,038 680,038 Impairment on asset held for sale - 6,143 2 Recovery of Related Party Note Receivable (377,746) (
Source: SEC EDGAR · 8-K filed May 8, 2020
More decks from Superior Drilling Products Inc
 Q3 2023 Earnings Presentation12 slides · Nov 9, 2023
 Q2 2023 Earnings Presentation12 slides · Aug 14, 2023
 Q1 2023 Earnings Presentation12 slides · May 15, 2023
 FY2022 Earnings Presentation13 slides · Mar 10, 2023
 Q3 2022 Earnings Presentation12 slides · Nov 14, 2022
 MicroCap Rodeo Windy City Roundup 202220 slides · Oct 12, 2022