Superior Drilling Products Inc
Superior Drilling Products — Q3 2023 Earnings Presentation
12 slides from Superior Drilling Products's earnings presentation, Nov 9, 2023
Slide 1: Third Quarter 2023 Financial Results Conference Call
Wy SUPERIOR DRILLING PRODUCTS THIRD QUARTER 2023 FINANCIAL RESULTS CONFERENCE CALL NOVEMBER 9, 2023 TROY MEIER CHRISTOPHER CASHION CHAIRMAN AND CHIEF EXECUTIVE OFFICER CHIEF FINANCIAL OFFICER NYSE American: SDPI www.sdpi.com © 2023 Superior Drilling Products
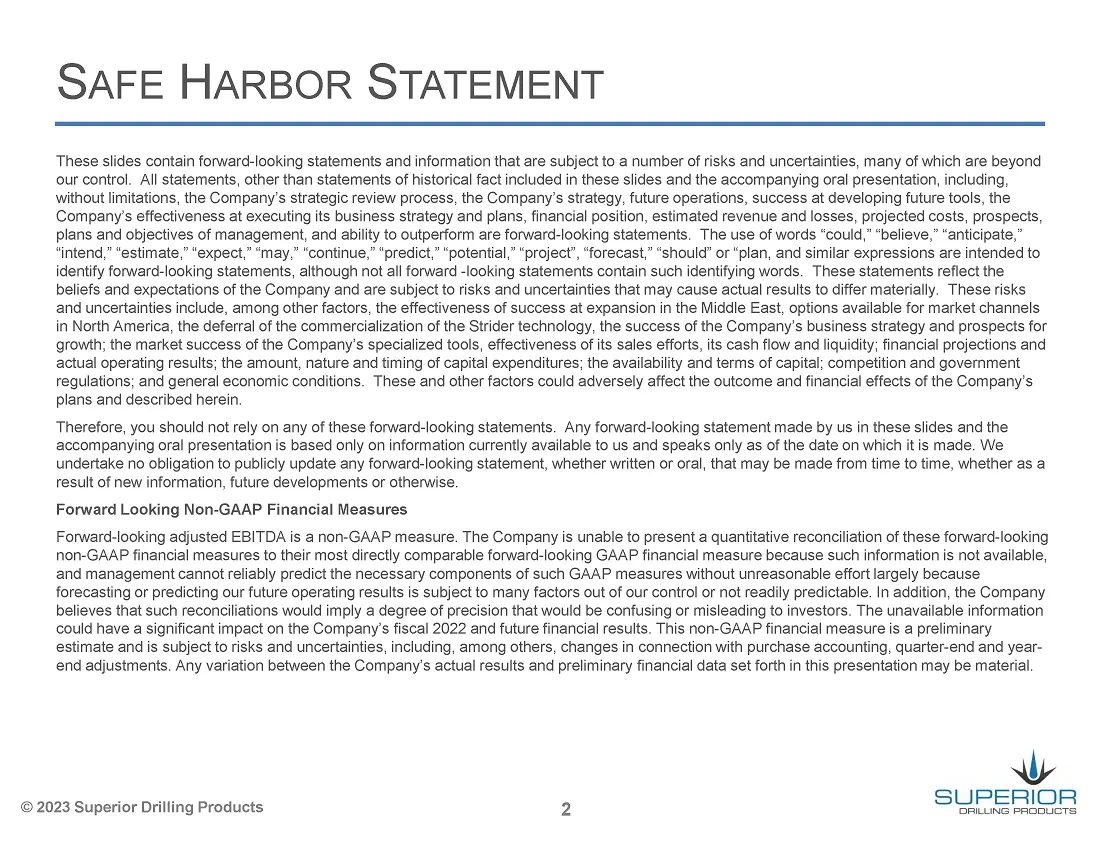
Slide 2: Safe Harbor Statement
SAFE HARBOR STATEMENT These slides contain forward-looking statements and information that are subject to a number of risks and uncertainties, many of which are beyond our control. All statements, other than statements of historical fact included in these slides and the accompanying oral presentatio
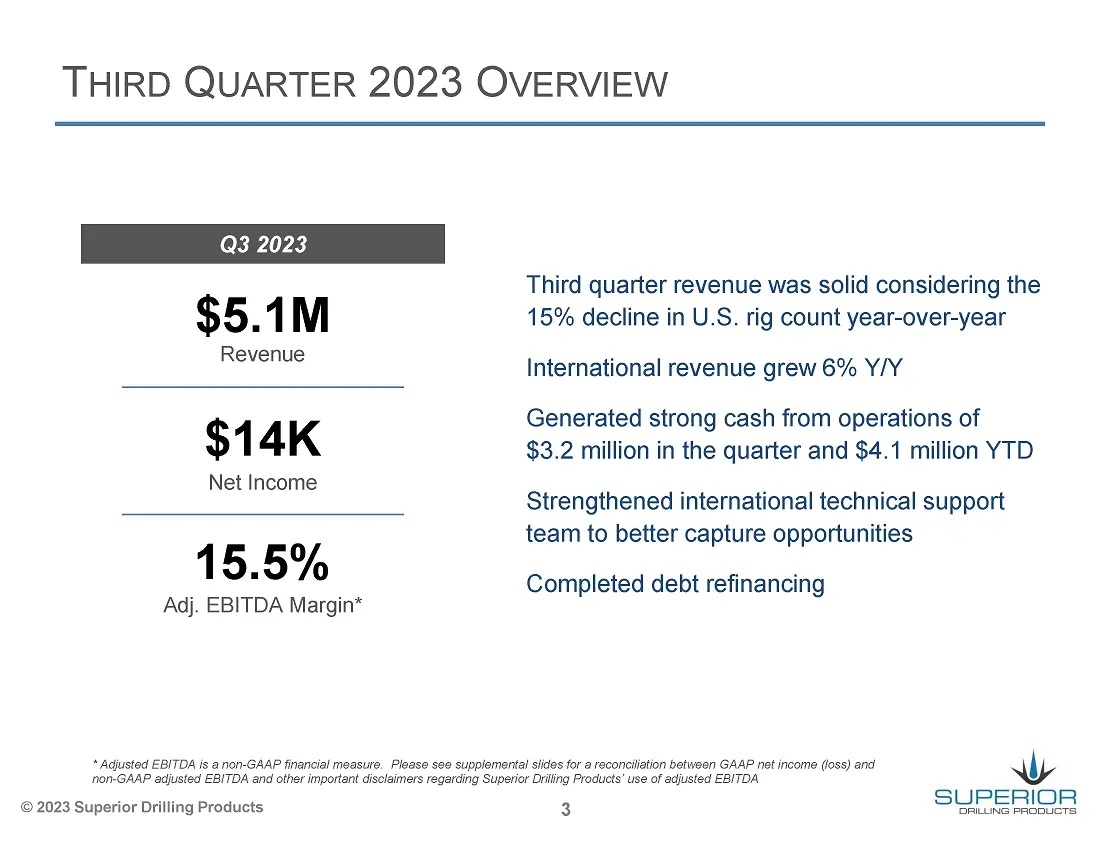
Slide 3: Third Quarter 2023 Overview
THIRD QUARTER 2023 OVERVIEW Q3 2023 Third quarter revenue was solid considering the $5.1 M 15% decline in U.S. rig count year-over-year Revenue . International revenue grew 6% Y/Y Generated strong cash from operations of $1 4K $3.2 million in the quarter and $4.1 million YTD Net Income 15.5% ‘Adj. E
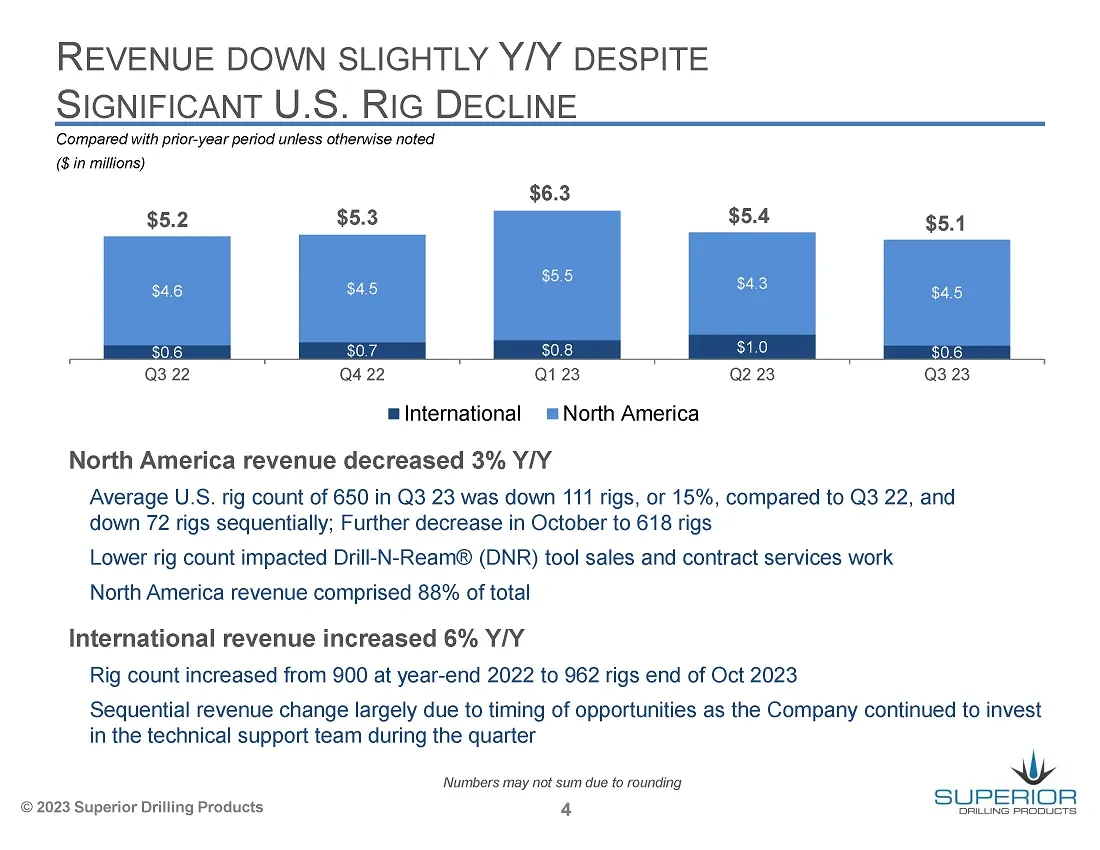
Slide 4: Revenue Down Slightly Y/Y Despite Significant U.S. Rig Decline
REVENUE DOWN SLIGHTLY Y/Y DESPITE SIGNIFICANT U.S. RIG DECLINE Compared with prior-year period unless otherwise noted (8 in millions) $6.3 $5.2 $5.3 $5.4 Q3 22 Q4 22 Q1 23 Q2 23 Q3 23 ulnternational =North America North America revenue decreased 3% Y/Y Average U.S. rig count of 650 in Q3 23 was down
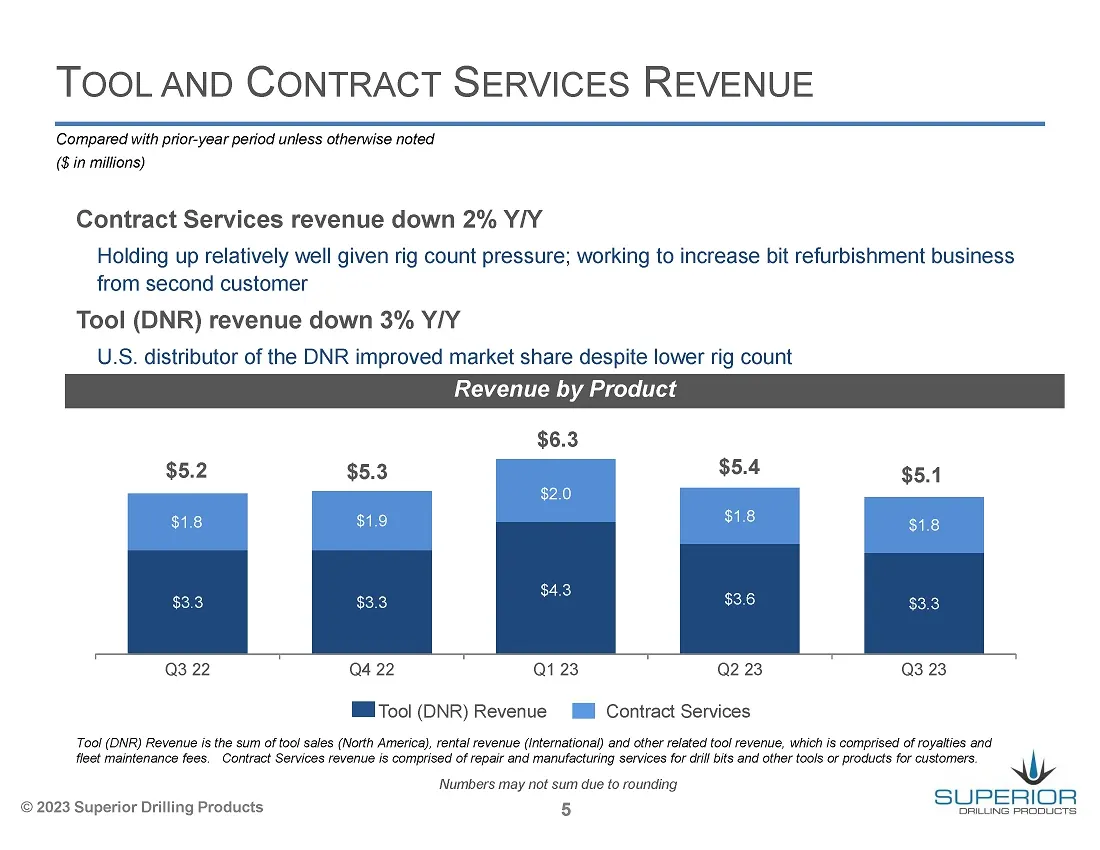
Slide 5: Tool and Contract Services Revenue
TOOL AND CONTRACT SERVICES REVENUE Compared with prior-year period unless otherwise noted (8 in mitfions) Contract Services revenue down 2% Y/Y Holding up relatively well given rig count pressure; working to increase bit refurbishment business from second customer Tool (DNR) revenue down 3% Y/Y U.S.
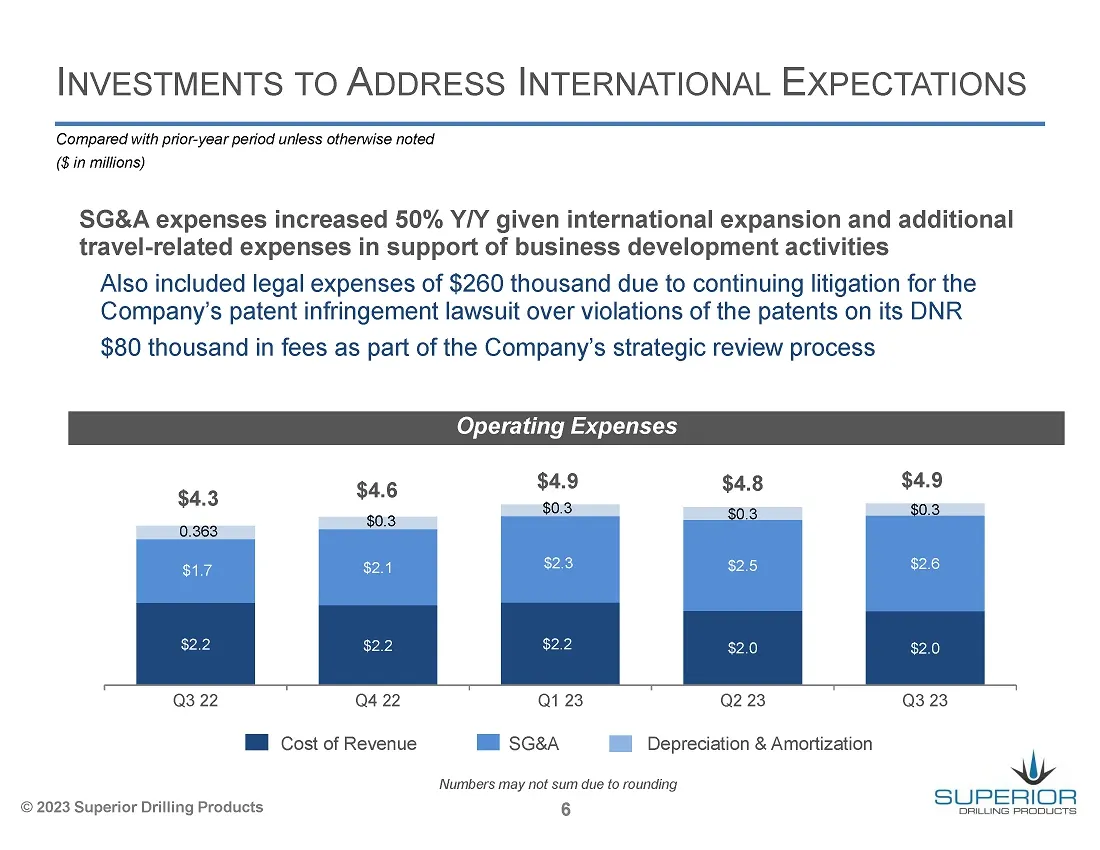
Slide 6: Investments to Address International Expectations
INVESTMENTS TO ADDRESS INTERNATIONAL EXPECTATIONS Compared with prior-year period unless otherwise noted (8 in mitfions) SG&A expenses increased 50% Y/Y given international expansion and additional travel-related expenses in support of business development activities Also included legal expenses of
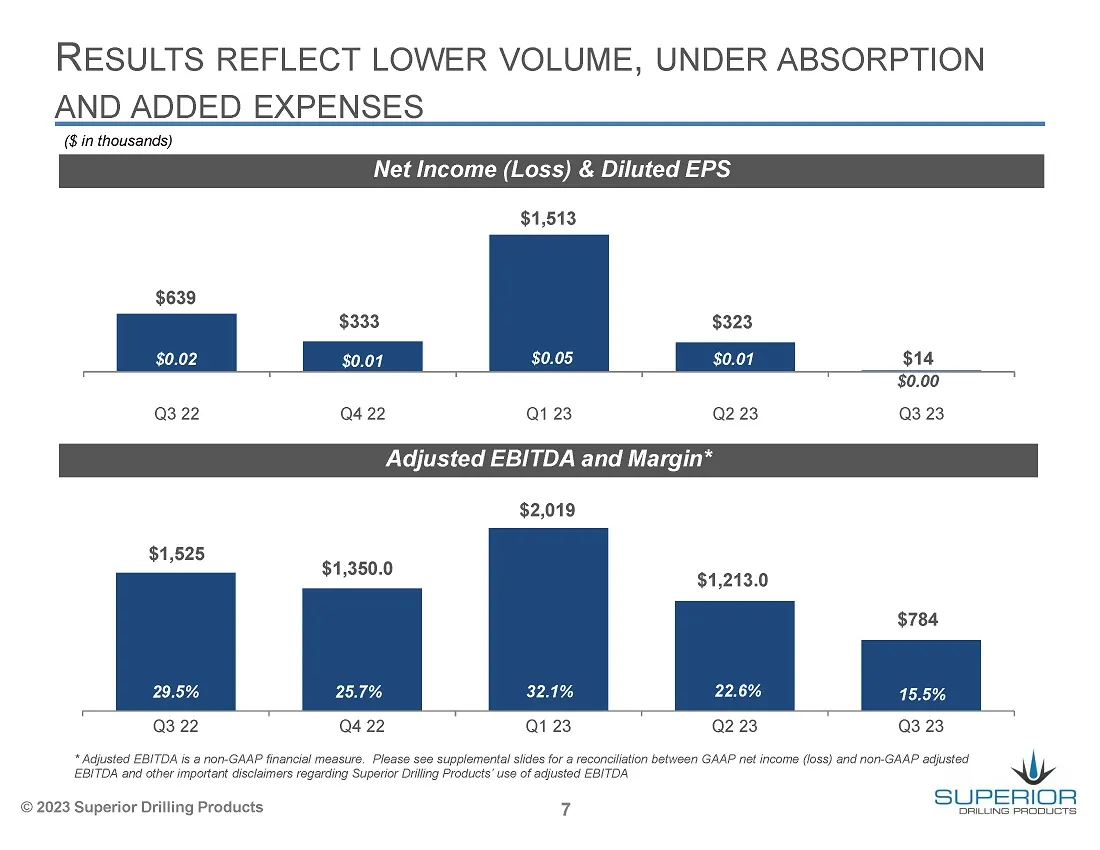
Slide 7: Results Reflect Lower Volume, Under Absorption and Added Expenses
RESULTS REFLECT LOWER VOLUME, UNDER ABSORPTION AND ADDED EXPENSES (8 in thousands) Net Income (Loss) & Diluted EPS $1,513 $323 $14 $0.00 Q3 22 04.22 Q1 23 Q2 23 Q3 23 Adjusted EBITDA and Margin* $2,019 $1,350.0 $1,213.0 $784 22.6% Q3 22 Q4 22 Qt 23 Q2 23 Q3 23 * Adjusted EBITDA is @ non-GAAP financi
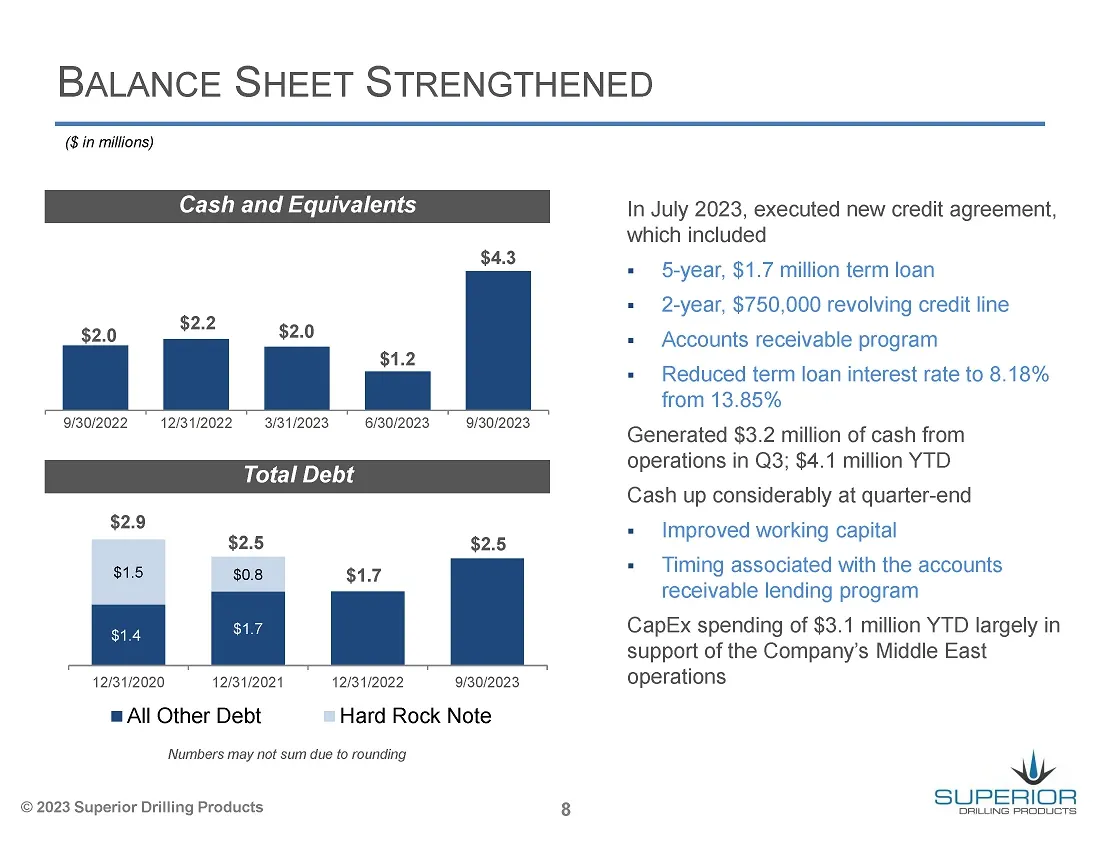
Slide 8: Balance Sheet Strengthened
BALANCE SHEET STRENGTHENED ( in milions) Cash and Equivalents $4.3 $2.2 $2.0 Lire 9/30/2022 12/31/2022 3/31/2023 = 9/30/2023 Total Debt $2.9 $2.5 $2.5 $1.5 $0.8 $1.7 $1.4 12/31/2020 12/31/2021 12/31/2022 9/30/2023 BAIl Other Debt Hard Rock Note ‘Numbers may not sum due to rounding © 2023 Superior Dr
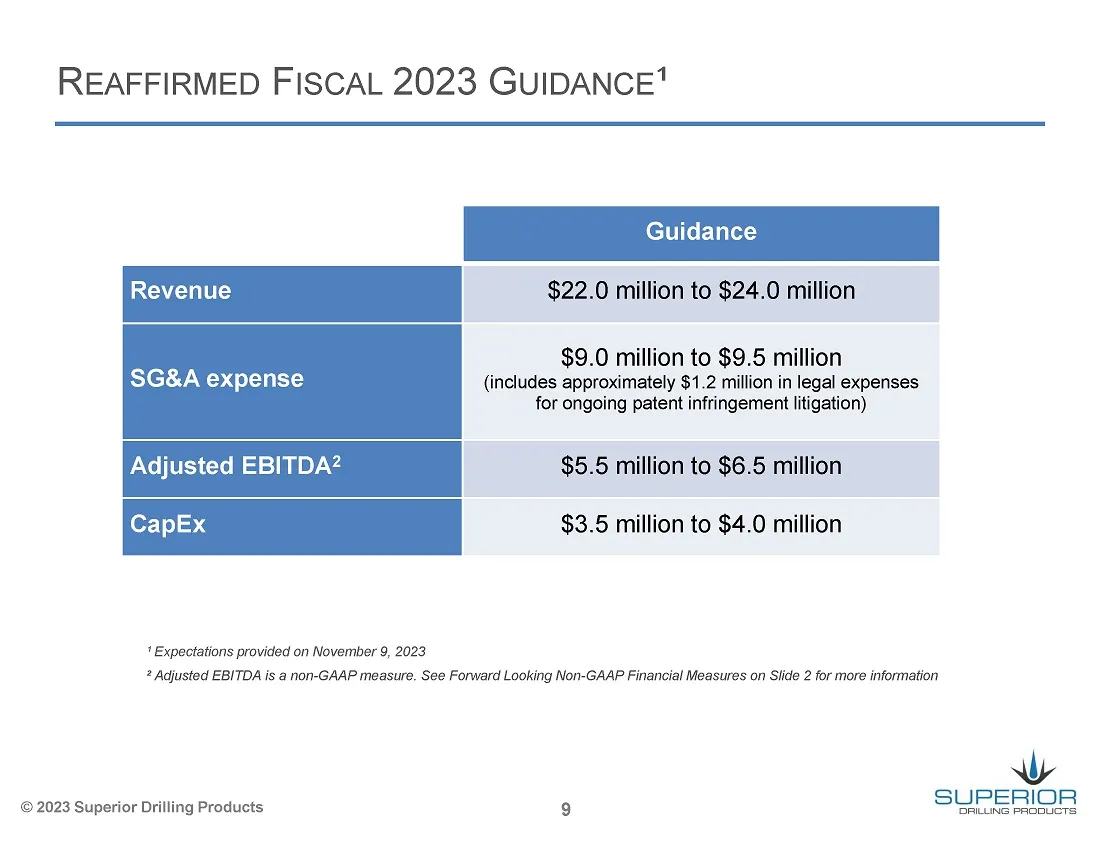
Slide 9: Reaffirmed Fiscal 2023 Guidance
REAFFIRMED FISCAL 2023 GUIDANCE" $22.0 million to $24.0 million $9.0 million to $9.5 million SG&A expense (includes approximately $1.2 million in legal expenses for ongoing patent infringement litigation) Adjusted EBITDA $5.5 million to $6.5 million $3.5 milion to $4.0 milion ' Expectations provided
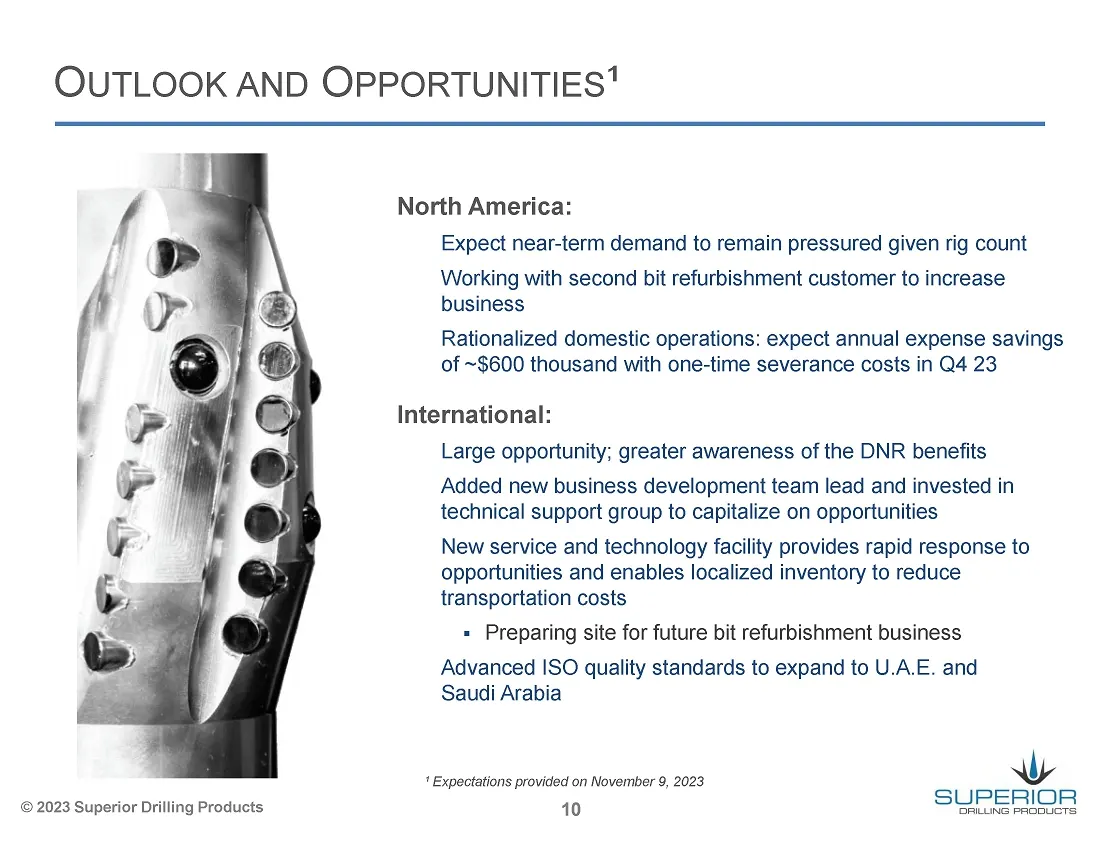
Slide 10: Outlook and Opportunities
OUTLOOK AND OPPORTUNITIES" North America: Expect near-term demand to remain pressured given rig count Working with second bit refurbishment customer to increase business Rationalized domestic operations: expect annual expense savings of ~$600 thousand with one-time severance costs in Q4 23 Internati
Slide 11: Supplemental Information
Wy SUPERIOR DRILLING PRODUCTS SUPPLEMENTAL INFORMATION © 2023 Superior Drilling Products
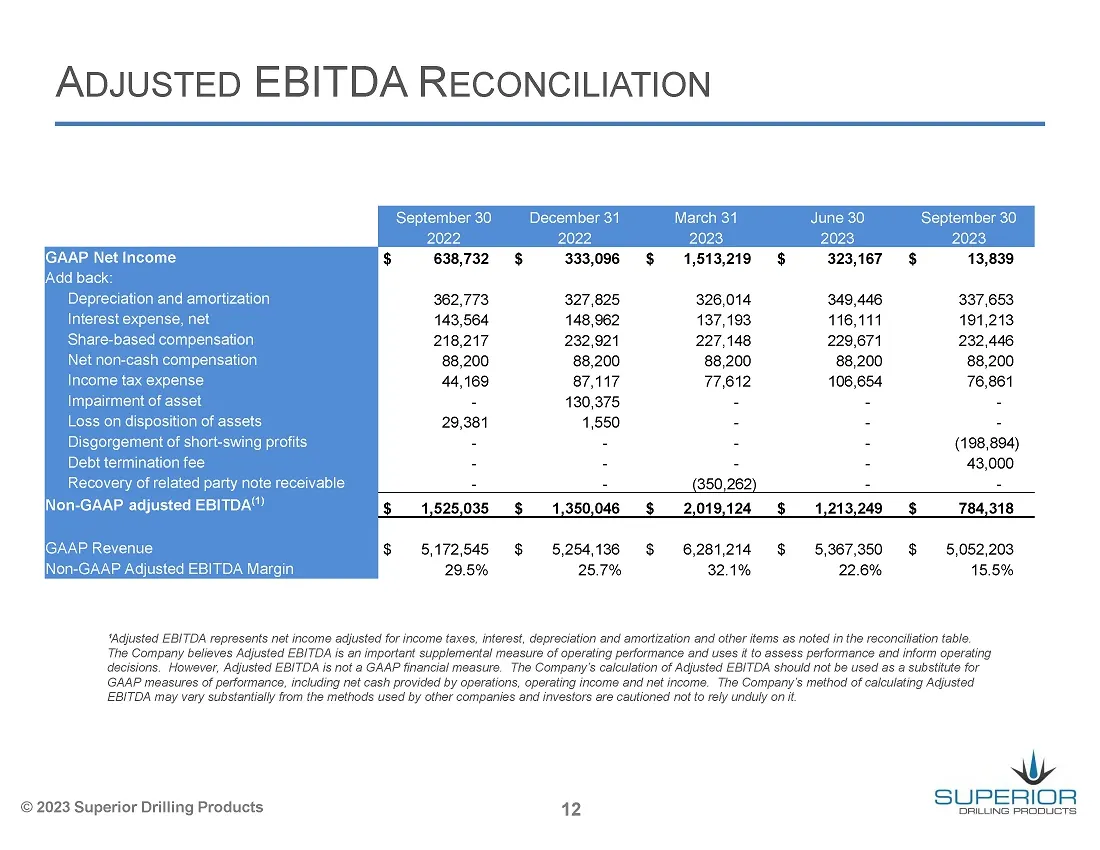
Slide 12: Adjusted EBITDA Reconciliation
ADJUSTED EBITDA RECONCILIATION September 30 December 31 June 30 September 30 2022 2022 2023 2023 2023 IGAAP Net Income 638,732 1,513,219 $ 323,167 $ 13,839 Add back Depreciation and amortization 362,773, 326,014 349,446 337,653, Interest expense, net 143,564 148,962 437,193 116,111 191,213 Share-bas
Source: SEC EDGAR · 8-K filed Nov 9, 2023
More decks from Superior Drilling Products Inc
 Q2 2023 Earnings Presentation12 slides · Aug 14, 2023
 Q1 2023 Earnings Presentation12 slides · May 15, 2023
 FY2022 Earnings Presentation13 slides · Mar 10, 2023
 Q3 2022 Earnings Presentation12 slides · Nov 14, 2022
 MicroCap Rodeo Windy City Roundup 202220 slides · Oct 12, 2022
 Q2 2022 Earnings Presentation12 slides · Aug 12, 2022