Superior Drilling Products Inc
Superior Drilling Products — FY2022 Earnings Presentation
13 slides from Superior Drilling Products's earnings presentation, Mar 10, 2023
Slide 1: Fourth Quarter and Full Year 2022 Financial Results Conference Call
SUZ SUPERIOR DRILLING PRODUCTS FOURTH QUARTER AND FULL YEAR 2022 FINANCIAL RESULTS CONFERENCE CALL MARCH 10, 2023 TROY MEIER CHRISTOPHER CASHION CHAIRMAN AND CHIEF EXECUTIVE OFFICER: CHIEF FINANCIAL OFFICER NYSE American: SDPI wwwsdpi.com 2023 Superior Driling Products
Slide 2: Safe Harbor Statement
SAFE HARBOR STATEMENT ‘These slides contain forward-looking statements and information that are subject o @ number of risks and uncertainties, many of which are beyond ‘our control All statements, other than statements of historical fact included in these slides and the accompanying oral presentatio
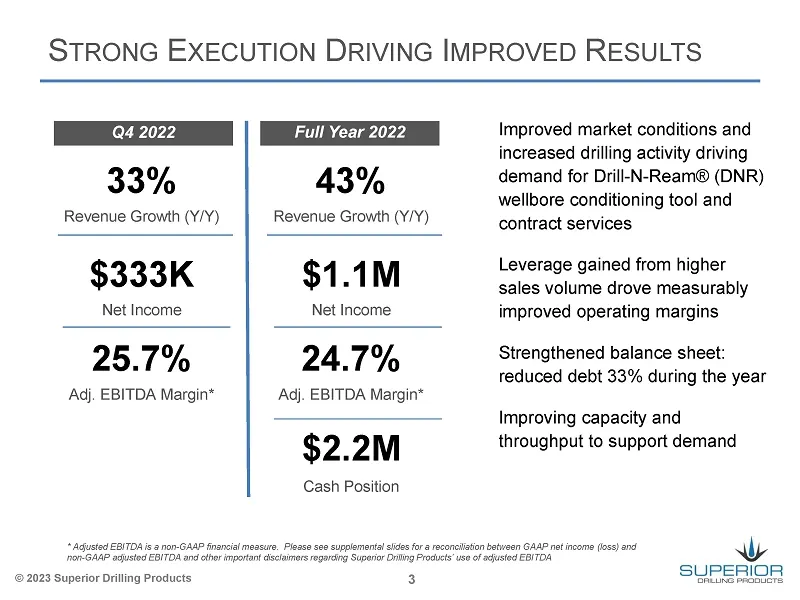
Slide 3: Strong Execution Driving Improved Results
STRONG EXECUTION DRIVING IMPROVED RESULTS 33% Revenue Growth (Y/Y) 43% Revenue Growth (Y/Y) $333K Net Income $1.1M Net Income 25.7% Adj, EBITDA Margin* © 2028 Superior Drilling Products 24.7% Adj. EBITDA Margin* $2.2M Cash Position Improved market conditions and increased drilling activity driving d
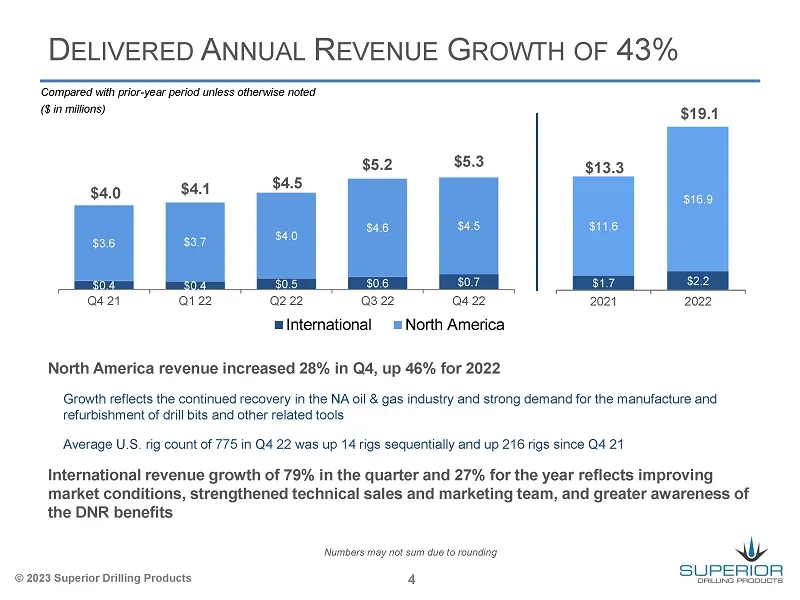
Slide 4: Delivered Annual Revenue Growth of 43%
DELIVERED ANNUAL REVENUE GROWTH OF 43% ‘Compared with prior-year period unless otherwise noted ($n mitions) $19.1 $5.3 $13.3 $4.0 $44 $4.5 421 a2 22 03.22 422 2021 2022 mlnternational = North America North America revenue increased 28% in Q4, up 46% for 2022 Growth reflects the continued recovery in
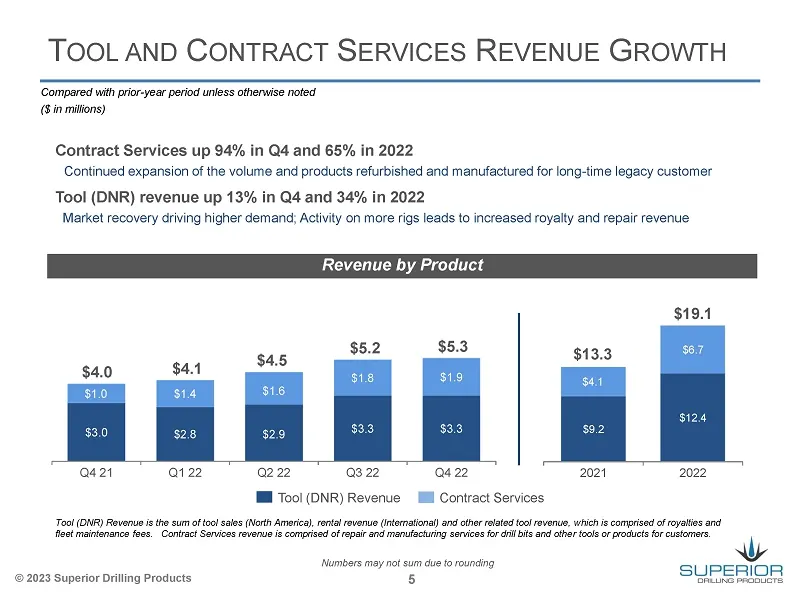
Slide 5: Tool and Contract Services Revenue Growth
TOOL AND CONTRACT SERVICES REVENUE GROWTH ‘Compared with prior-year period unless otherwise noted ($n mitions) Contract Services up 94% in Q4 and 65% in 2022 Continued expansion of the volume and products refurbished and manufactured for long-time legacy customer Tool (DNR) revenue up 13% in Q4 and
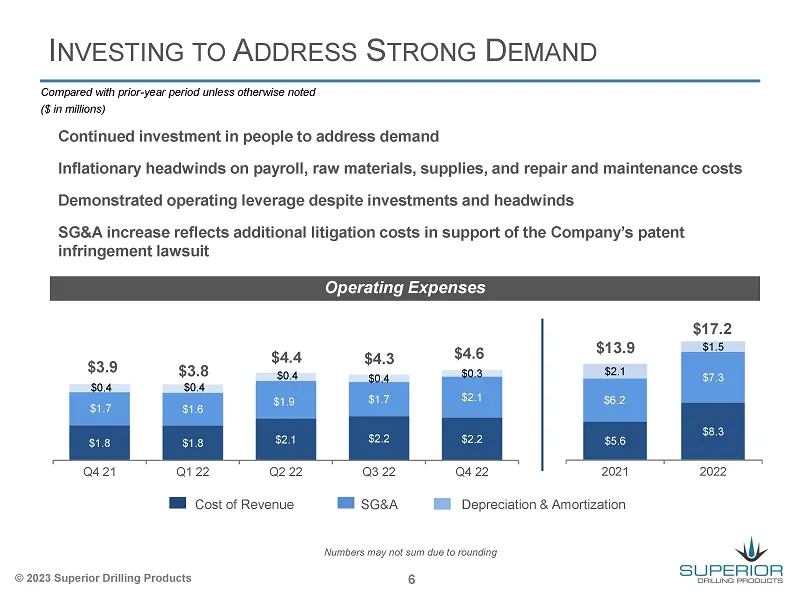
Slide 6: Investing to Address Strong Demand
INVESTING TO ADDRESS STRONG DEMAND ‘Compared with prior-year period unless otherwise noted ($n mitions) Continued investment in people to address demand Inflationary headwinds on payroll, raw materials, supplies, and repair and maintenance costs Demonstrated operating leverage despite investments an
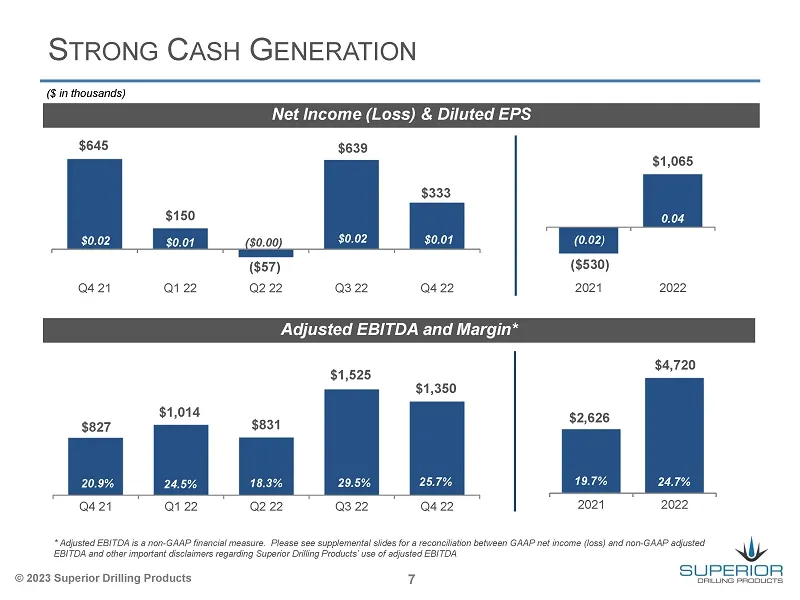
Slide 7: Strong Cash Generation
STRONG CASH GENERATION (in thousands) Net Income (Loss) & Diluted EPS $645 $639 $1,065 ($530) aaa at22 222 9322 0422 2021 2022 Adjusted EBITDA and Margin* $1,525 $4,720 $1,350 2021 2022 421 ai 22 2.22 322 + Adjusted EBITDA i a nan-GAAP nario measur. Plase See supelemental ses for a recenlitionbetuse
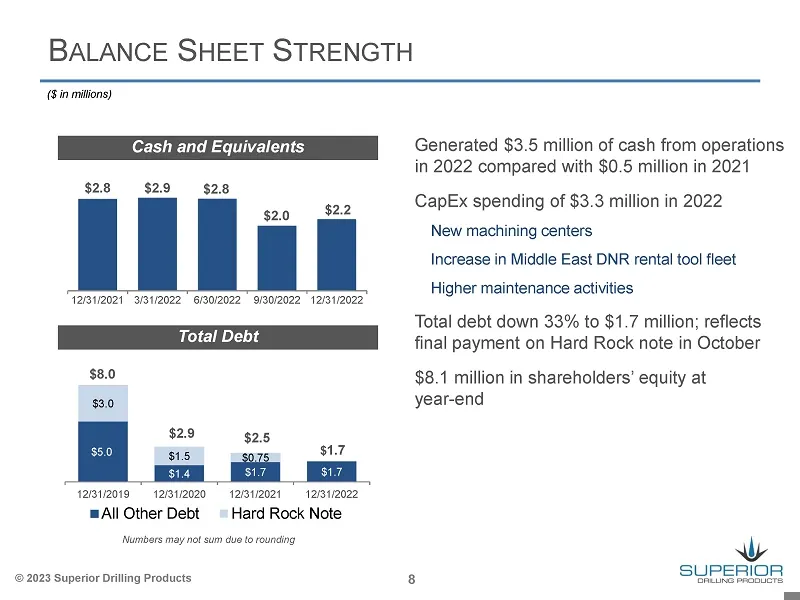
Slide 8: Balance Sheet Strength
BALANCE SHEET STRENGTH ($n milions) Cash and Equivalents Generated $3.5 million of cash from operations in 2022 compared with $0.5 million in 2021 $28 $29 $28 - a: $20 $2.2 CapEx spending of $3.3 million in 2022 New machining centers Increase in Middle East DNR rental too! fleet Higher maintenance a
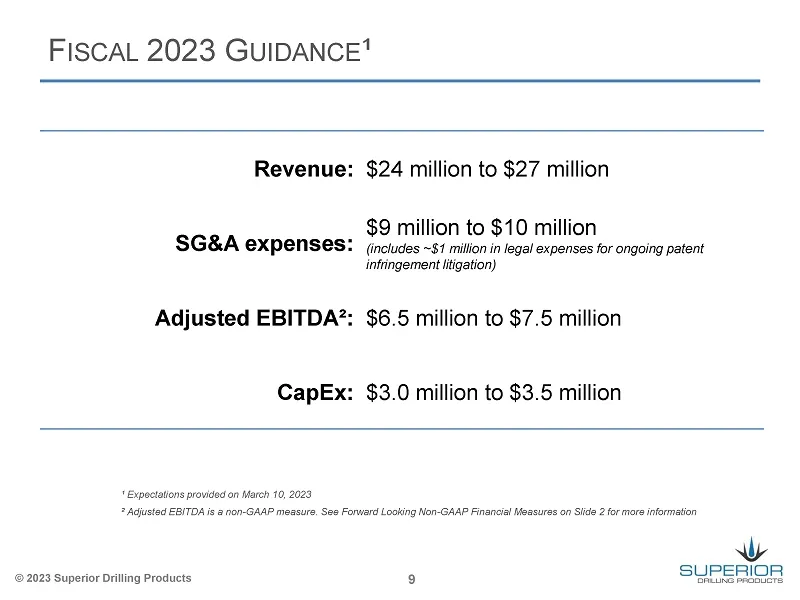
Slide 9: Fiscal 2023 Guidance
FISCAL 2023 GUIDANCE" Revenue: $24 million to $27 million $9 million to $10 million SG&A expenses: includes ~$1 milion in legal expenses for ongoing patent infringement litigation) Adjusted EBITDA: $6.5 million to $7.5 million CapEx: $3.0 million to $3.5 million © 2028 Superior Drilling Products 9
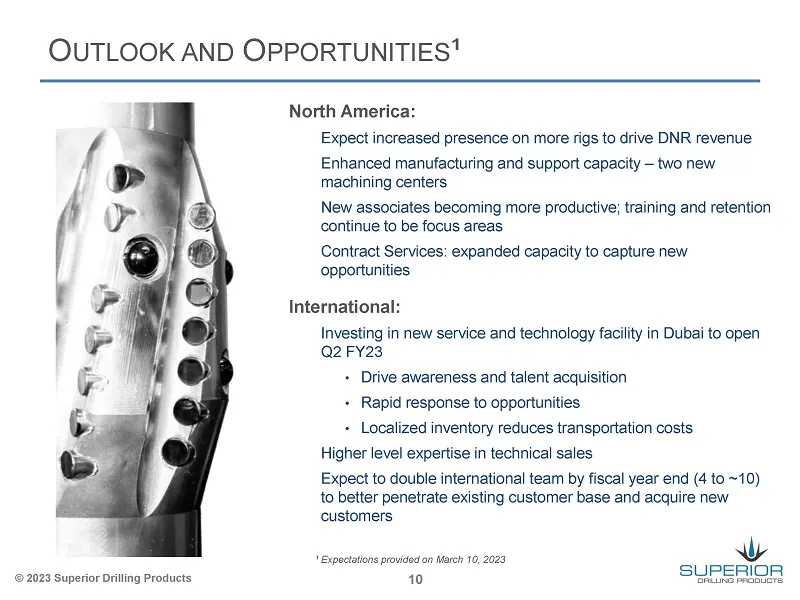
Slide 10: Outlook and Opportunities
OUTLOOK AND OPPORTUNITIES" (© 2023 Superior Drilling Products North America: Expect increased presence on more rigs to drive DNR revenue Enhanced manufacturing and support capacity — two new machining centers New associates becoming more productive; training and retention continue to be focus areas
Slide 11: Supplemental Information
RUZ SUPERIOR DRILLING PRODUCTS SUPPLEMENTAL INFORMATION
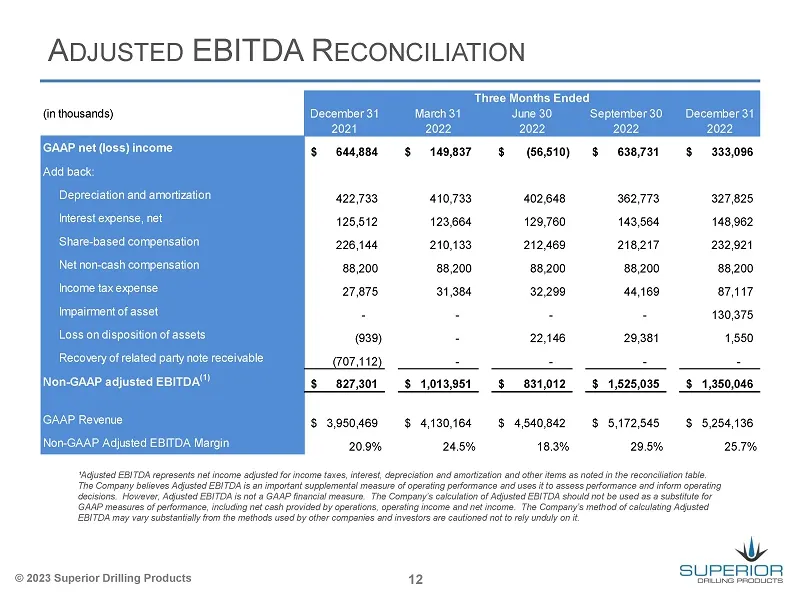
Slide 12: Adjusted EBITDA Reconciliation
ADJUSTED EBITDA RECONCILIATION (in thousands) P net (loss) inco $ 644884 $ 149,837 $ (66,810) $ 638,731 $$ 333,096 depreciation and amortization 4227%3 410,733 402,648 362,773 327,825 Her 125,512 123,664 129,760 143,564 148,962 >d compensati 226,144 210,193 212,469 218217 22921 , mpensatc 88,200 88,
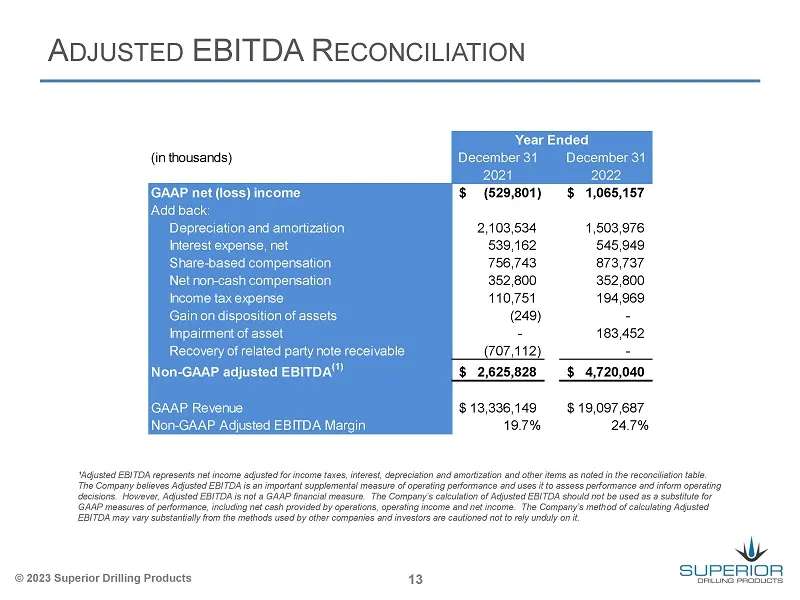
Slide 13: Adjusted EBITDA Reconciliation
ADJUSTED EBITDA RECONCILIATION ‘Year Ended ember 31 December 31 2021 2022 (529,801) $1,085,157 2,103,534 1,503,976 539,162 545,949 756,743 873,737 352,800 352,800 110,751 194,969 183,452 overy of related party note receiv : Non-GAAP adjusted EBITDA” $ 2,625,828 _$ 4,720,040 GAAP Revenue $13,396,149
Source: SEC EDGAR · 8-K filed Mar 10, 2023
More decks from Superior Drilling Products Inc
 Q3 2023 Earnings Presentation12 slides · Nov 9, 2023
 Q2 2023 Earnings Presentation12 slides · Aug 14, 2023
 Q1 2023 Earnings Presentation12 slides · May 15, 2023
 Q3 2022 Earnings Presentation12 slides · Nov 14, 2022
 MicroCap Rodeo Windy City Roundup 202220 slides · Oct 12, 2022
 Q2 2022 Earnings Presentation12 slides · Aug 12, 2022