Superior Drilling Products Inc
Superior Drilling Products — Q3 2022 Earnings Presentation
12 slides from Superior Drilling Products's earnings presentation, Nov 14, 2022
Slide 1: Third Quarter 2022 Financial Results Conference Call
Wy SUPERIOR DRILLING PRODUCTS THIRD QUARTER 2022 FINANCIAL RESULTS CONFERENCE CALL NOVEMBER 11, 2022 TROY MEIER CHRISTOPHER CASHION CHAIRMAN AND CHIEF EXECUTIVE OFFICER CHIEF FINANCIAL OFFICER NYSE American: SDPI www.sdpi.com © 2022 Superior Drilling Products
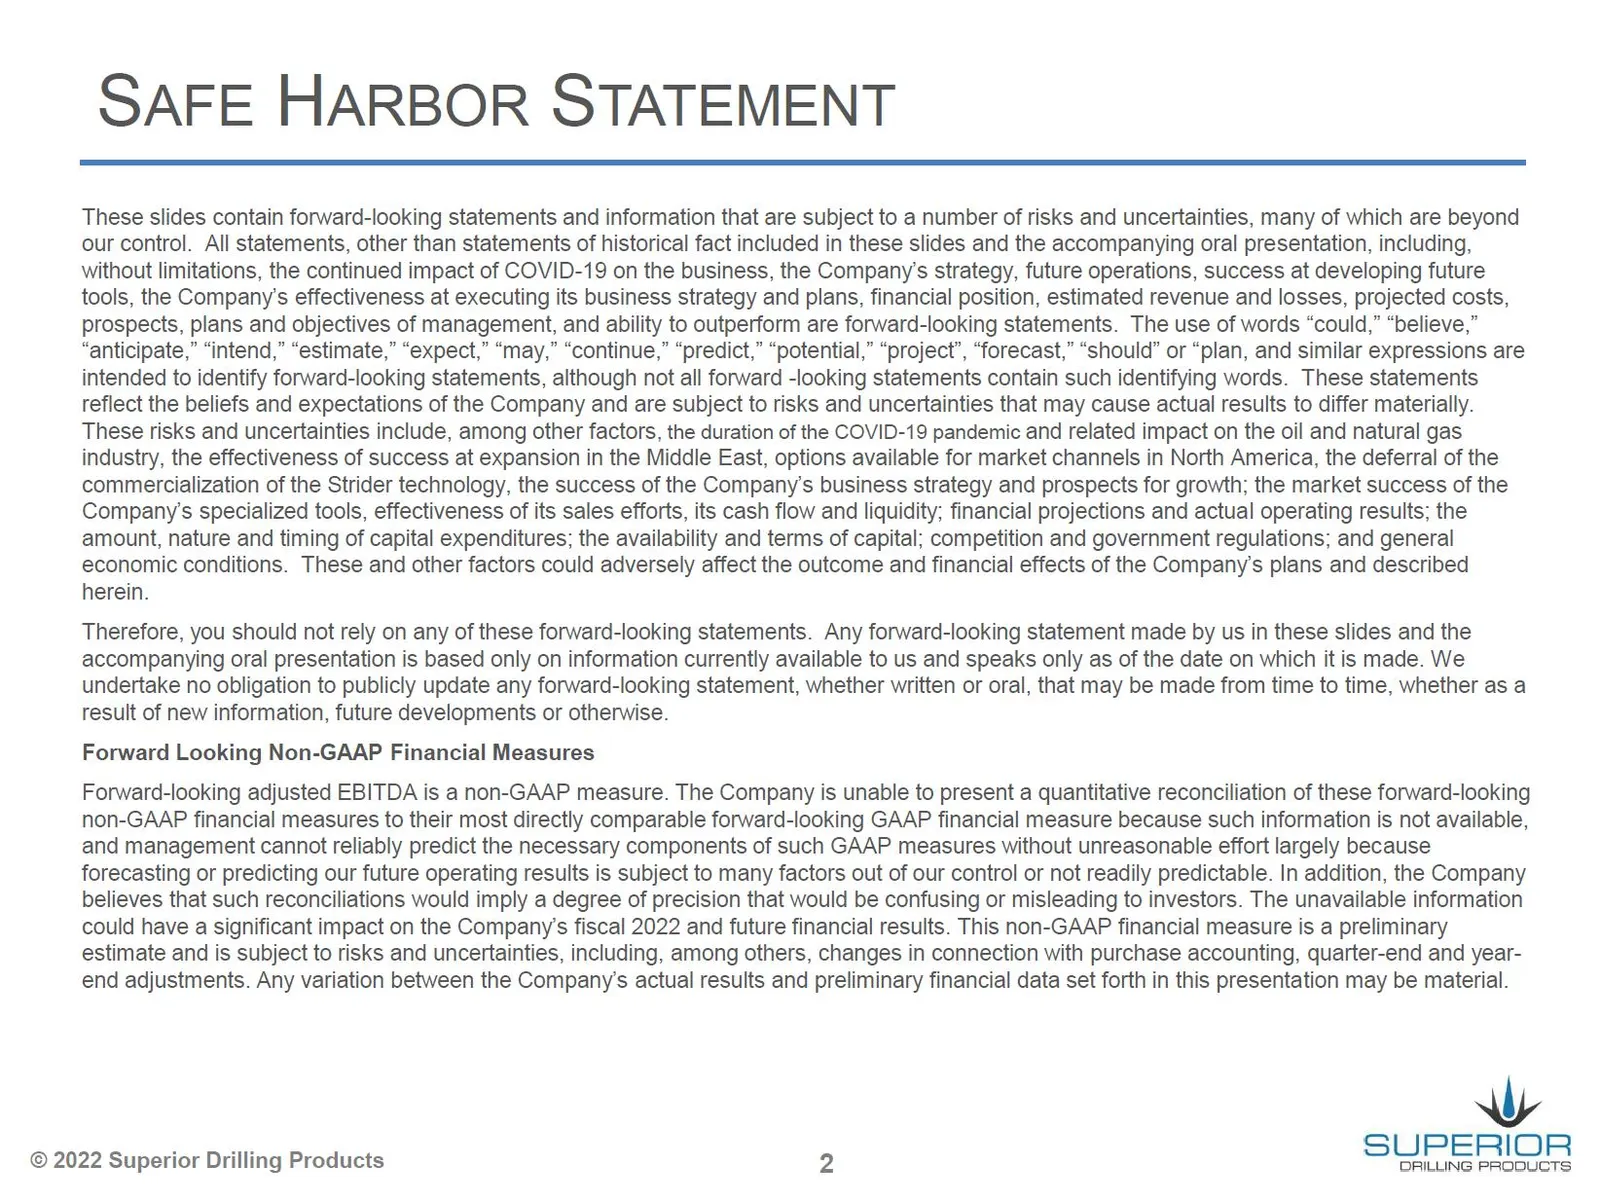
Slide 2: Safe Harbor Statement
SAFE HARBOR STATEMENT These slides contain forward-looking statements and information that are subject to a number of risks and uncertainties, many of which are beyond our control. All statements, other than statements of historical fact included in these slides and the accompanying oral presentatio
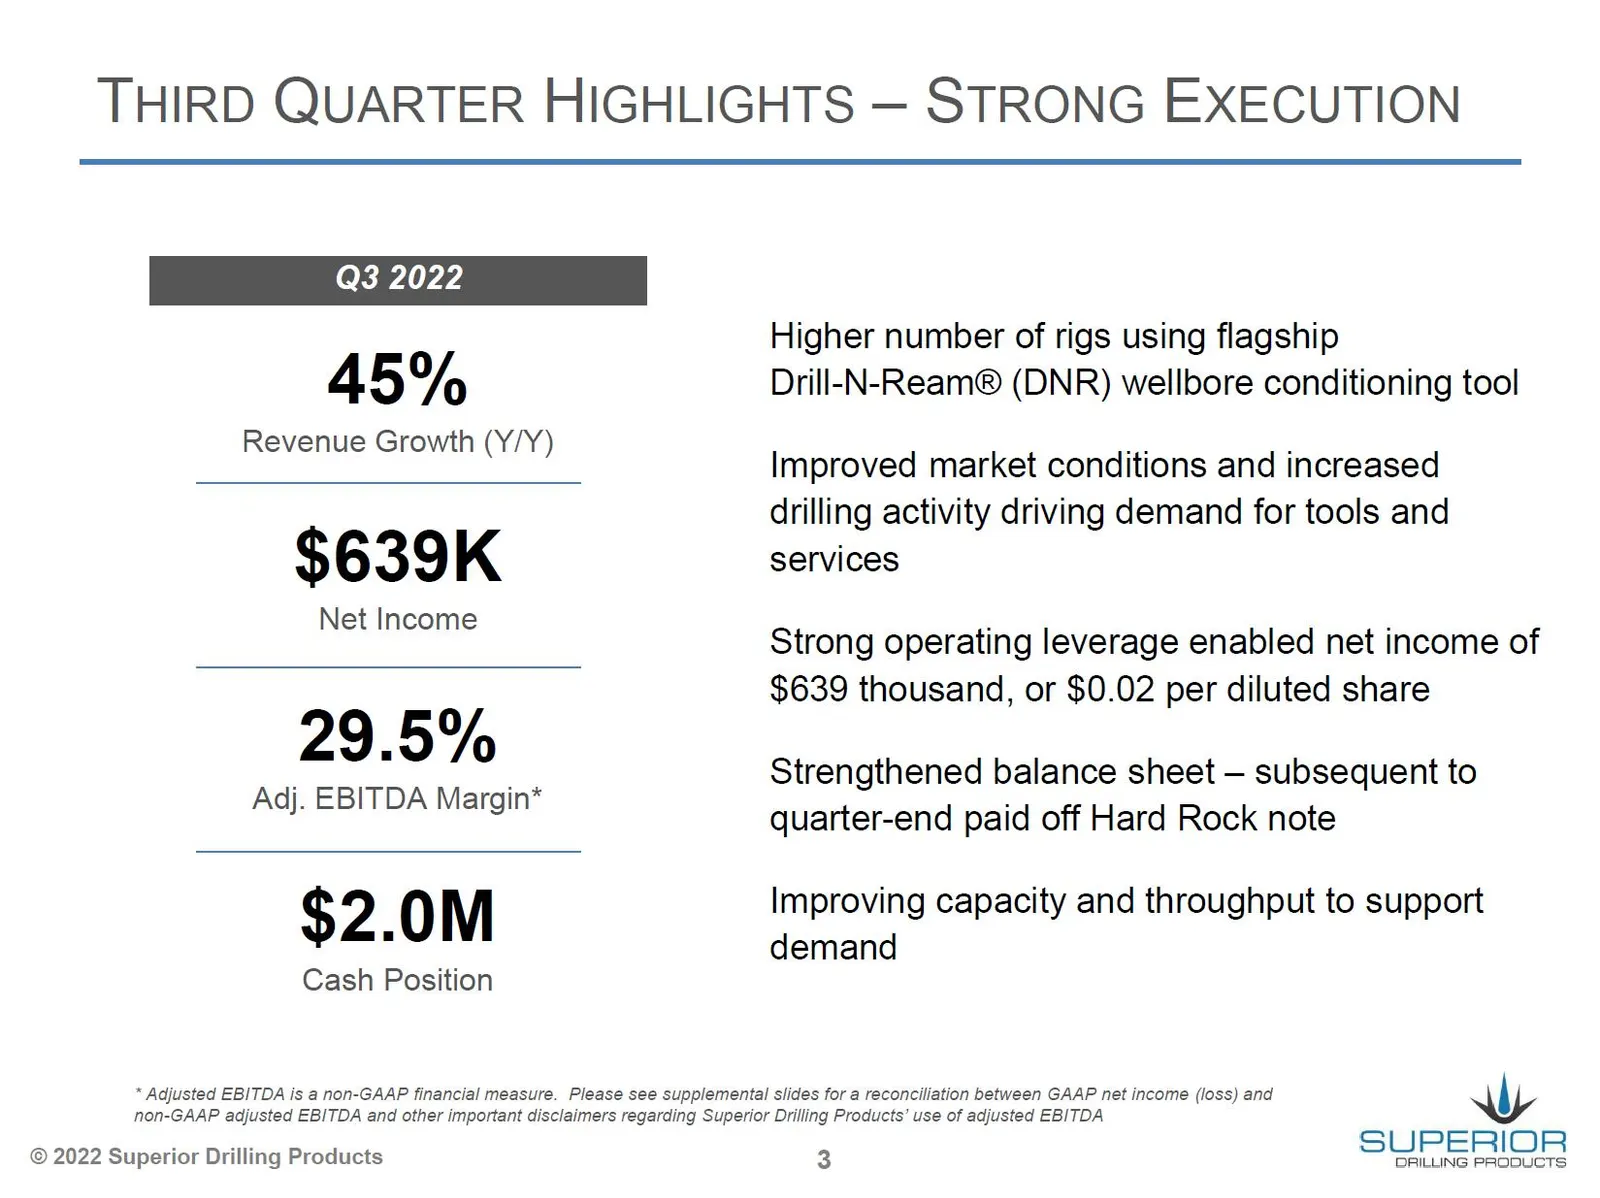
Slide 3: Third Quarter Highlights — Strong Execution
THIRD QUARTER HIGHLIGHTS — STRONG EXECUTION Higher number of rigs using flagship 45% Drill-N-Ream® (DNR) wellbore conditioning tool Revenue Growth (Y/Y ue . ald Improved market conditions and increased drilling activity driving demand for tools and $639K services Net Income 29.5% Adj. EBITDA Margin*
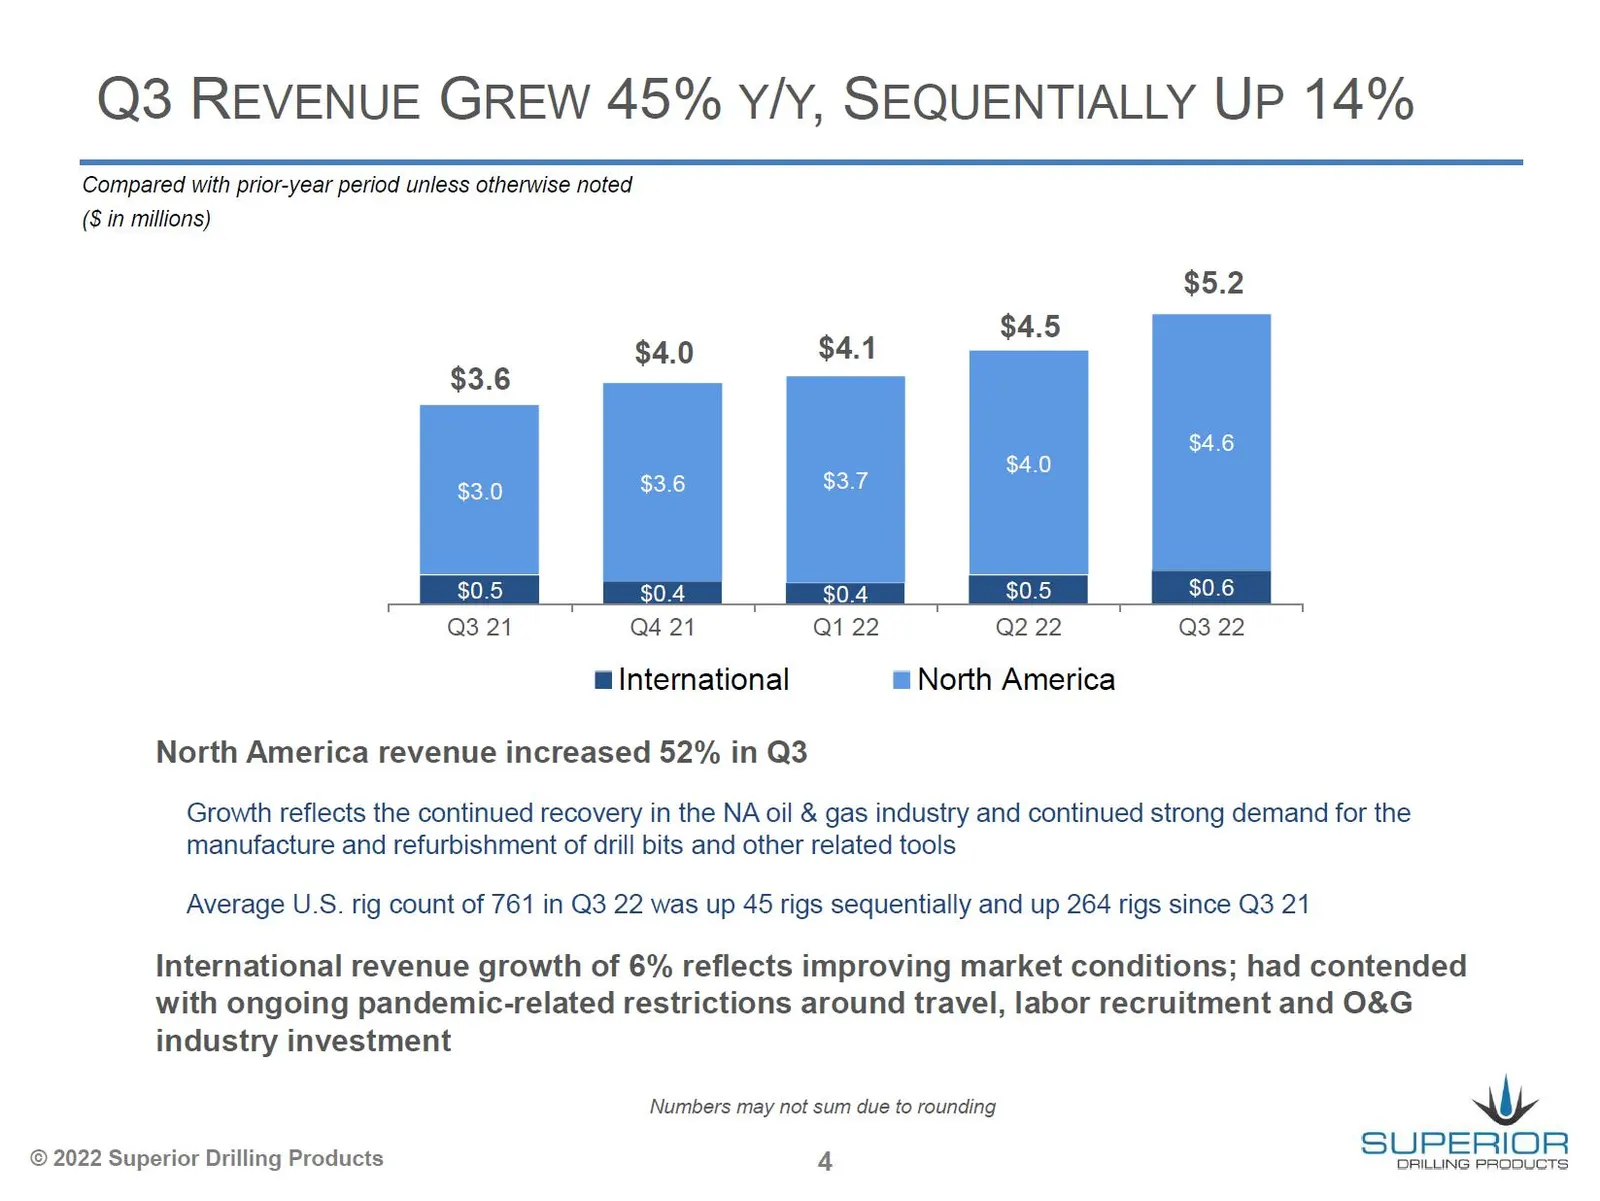
Slide 4: Q3 Revenue Grew 45% Y/Y, Sequentially Up 14%
Q3 REVENUE GREW 45% Y/Y, SEQUENTIALLY UP 14% Compared with prior-year period unless otherwise noted (S in millions) $5.2 $4.5 $4.0 $4.1 $3.6 $0.4 . $0.5 Q3 21 Q4 21 Q1 22 Q2 22 mg International m= North America North America revenue increased 52% in Q3 Growth reflects the continued recovery in the N
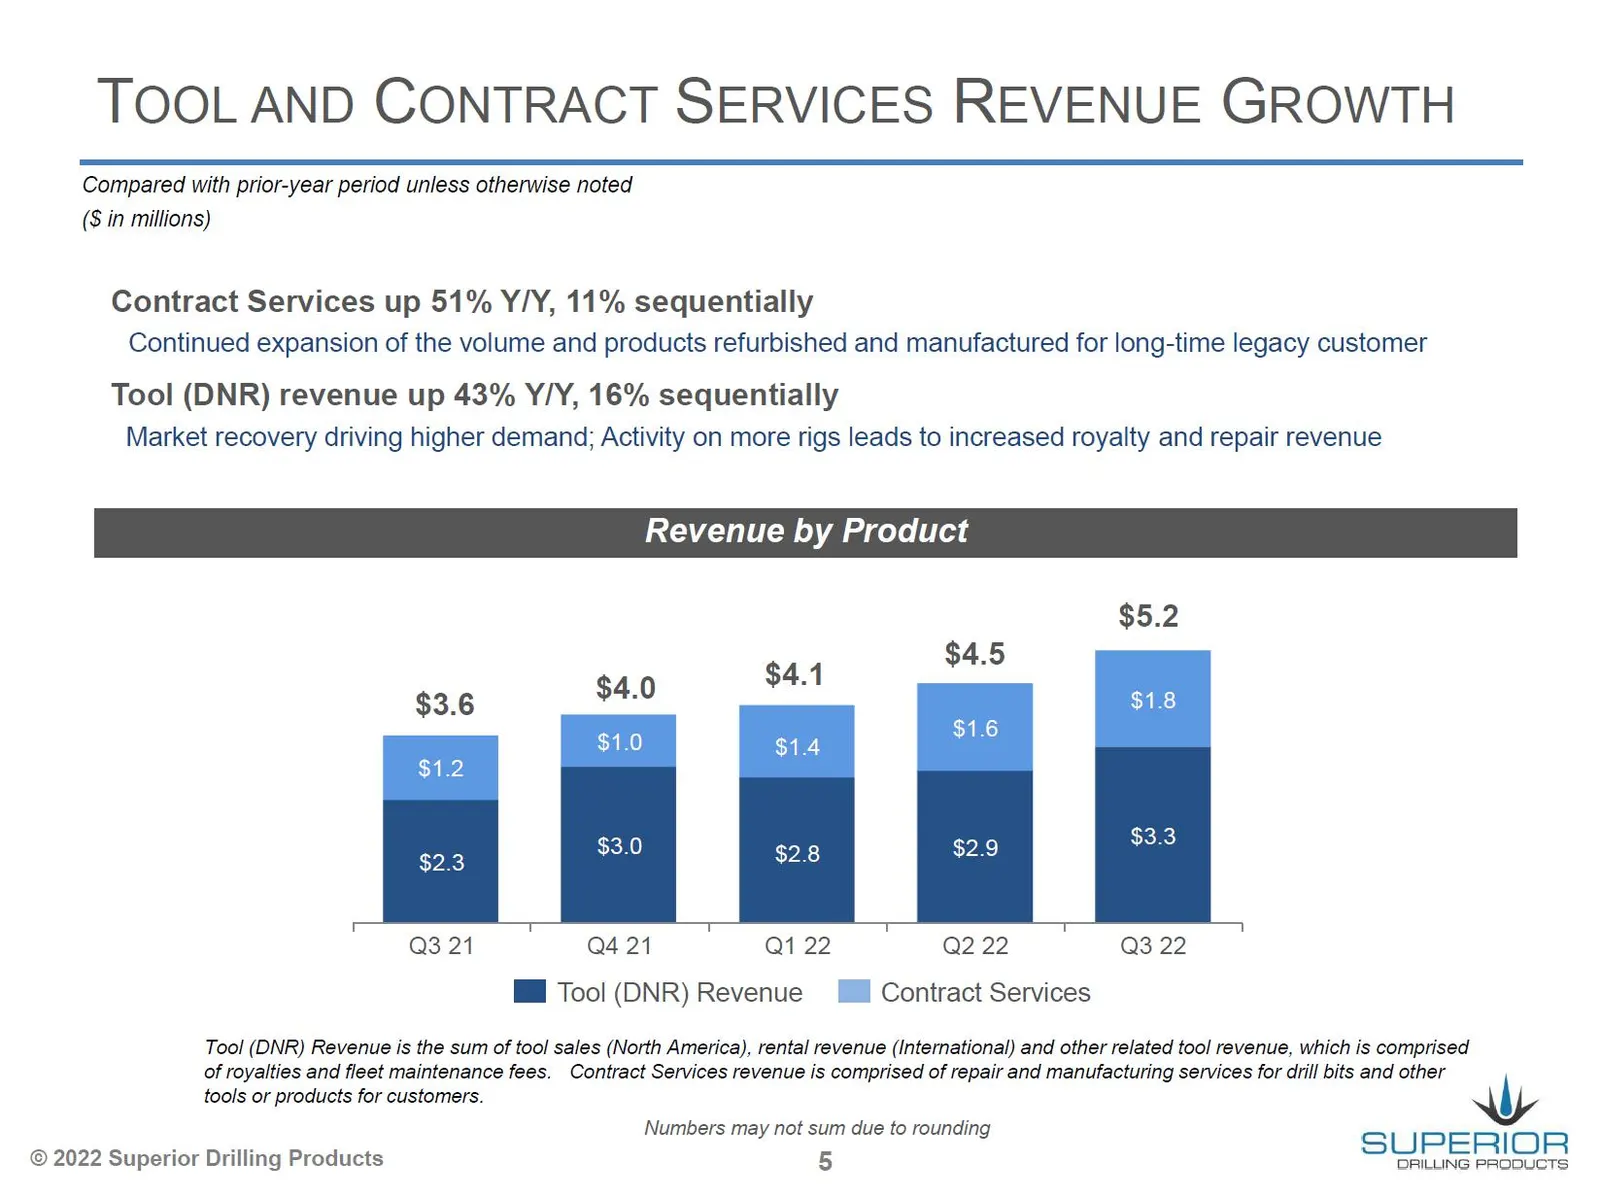
Slide 5: Tool and Contract Services Revenue Growth
TOOL AND CONTRACT SERVICES REVENUE GROWTH Compared with prior-year period unless otherwise noted (S in millions) Contract Services up 51% Y/Y, 11% sequentially Continued expansion of the volume and products refurbished and manufactured for long-time legacy customer Tool (DNR) revenue up 43% Y/Y, 16%
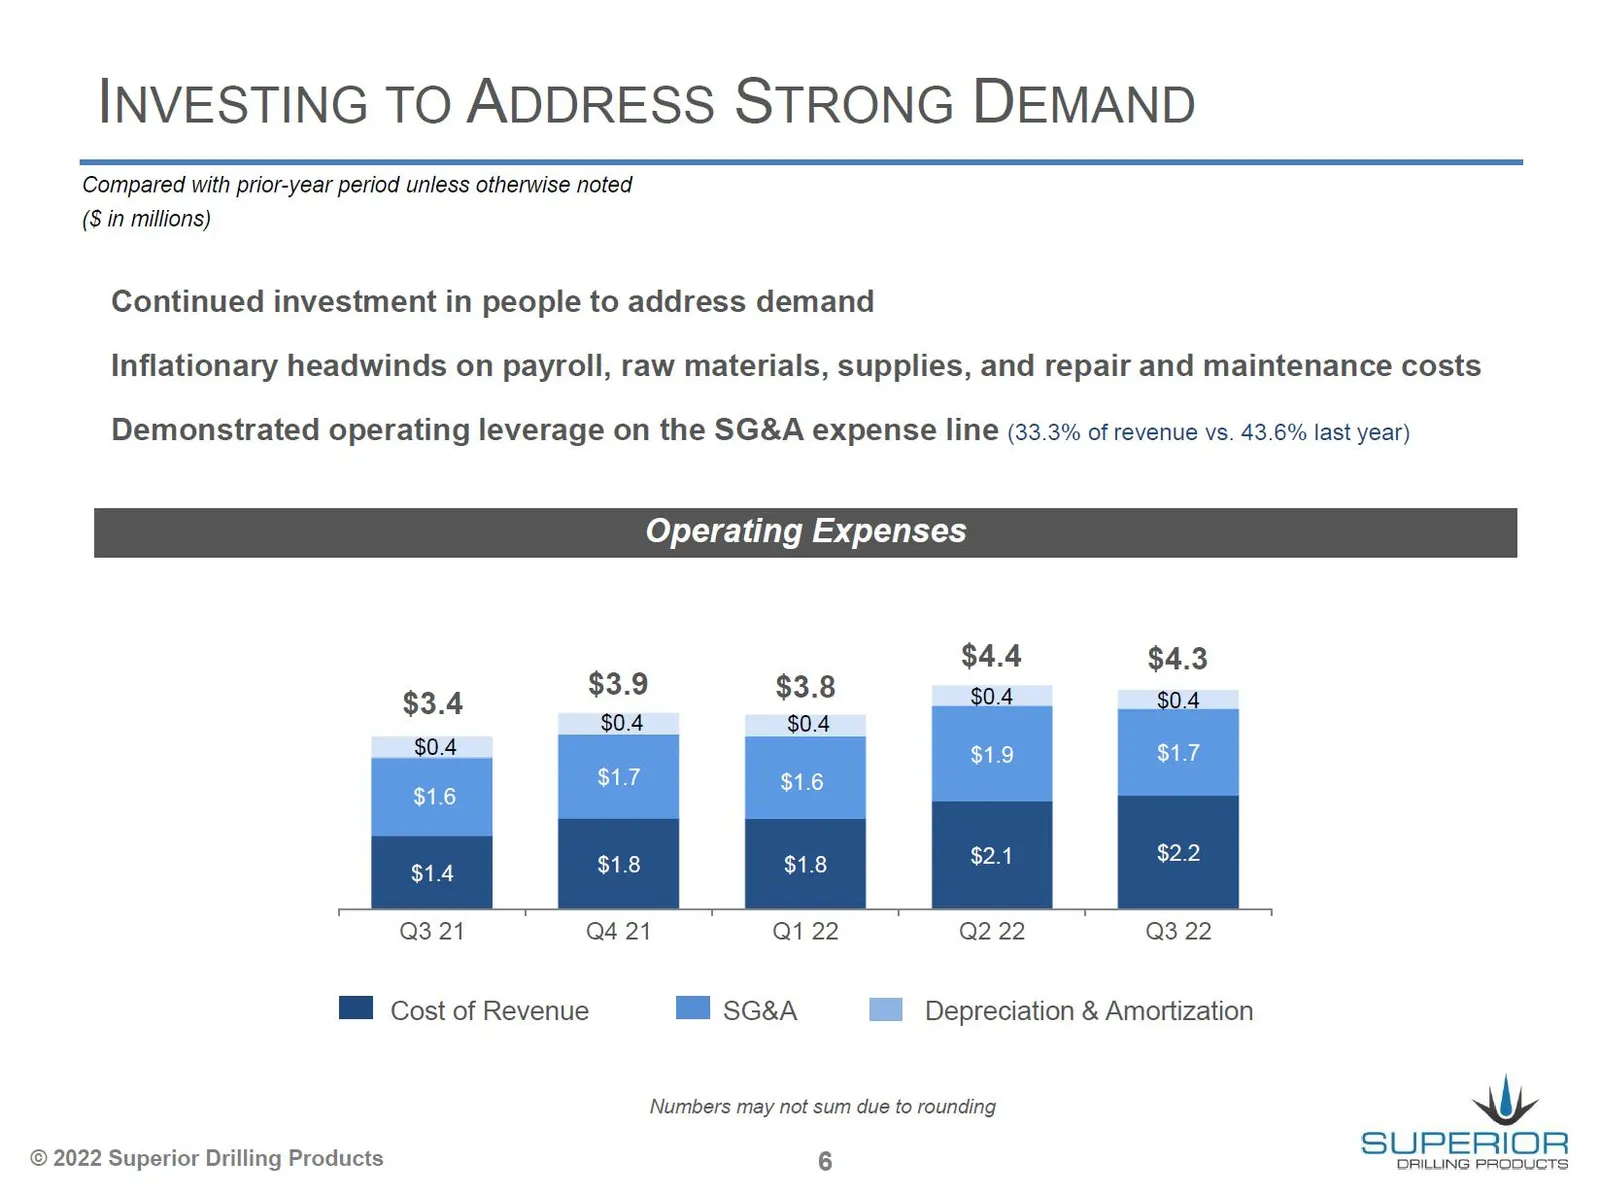
Slide 6: Investing to Address Strong Demand
INVESTING TO ADDRESS STRONG DEMAND Compared with prior-year period unless otherwise noted (S in millions) Continued investment in people to address demand Inflationary headwinds on payroll, raw materials, supplies, and repair and maintenance costs Demonstrated operating leverage on the SG&A expense
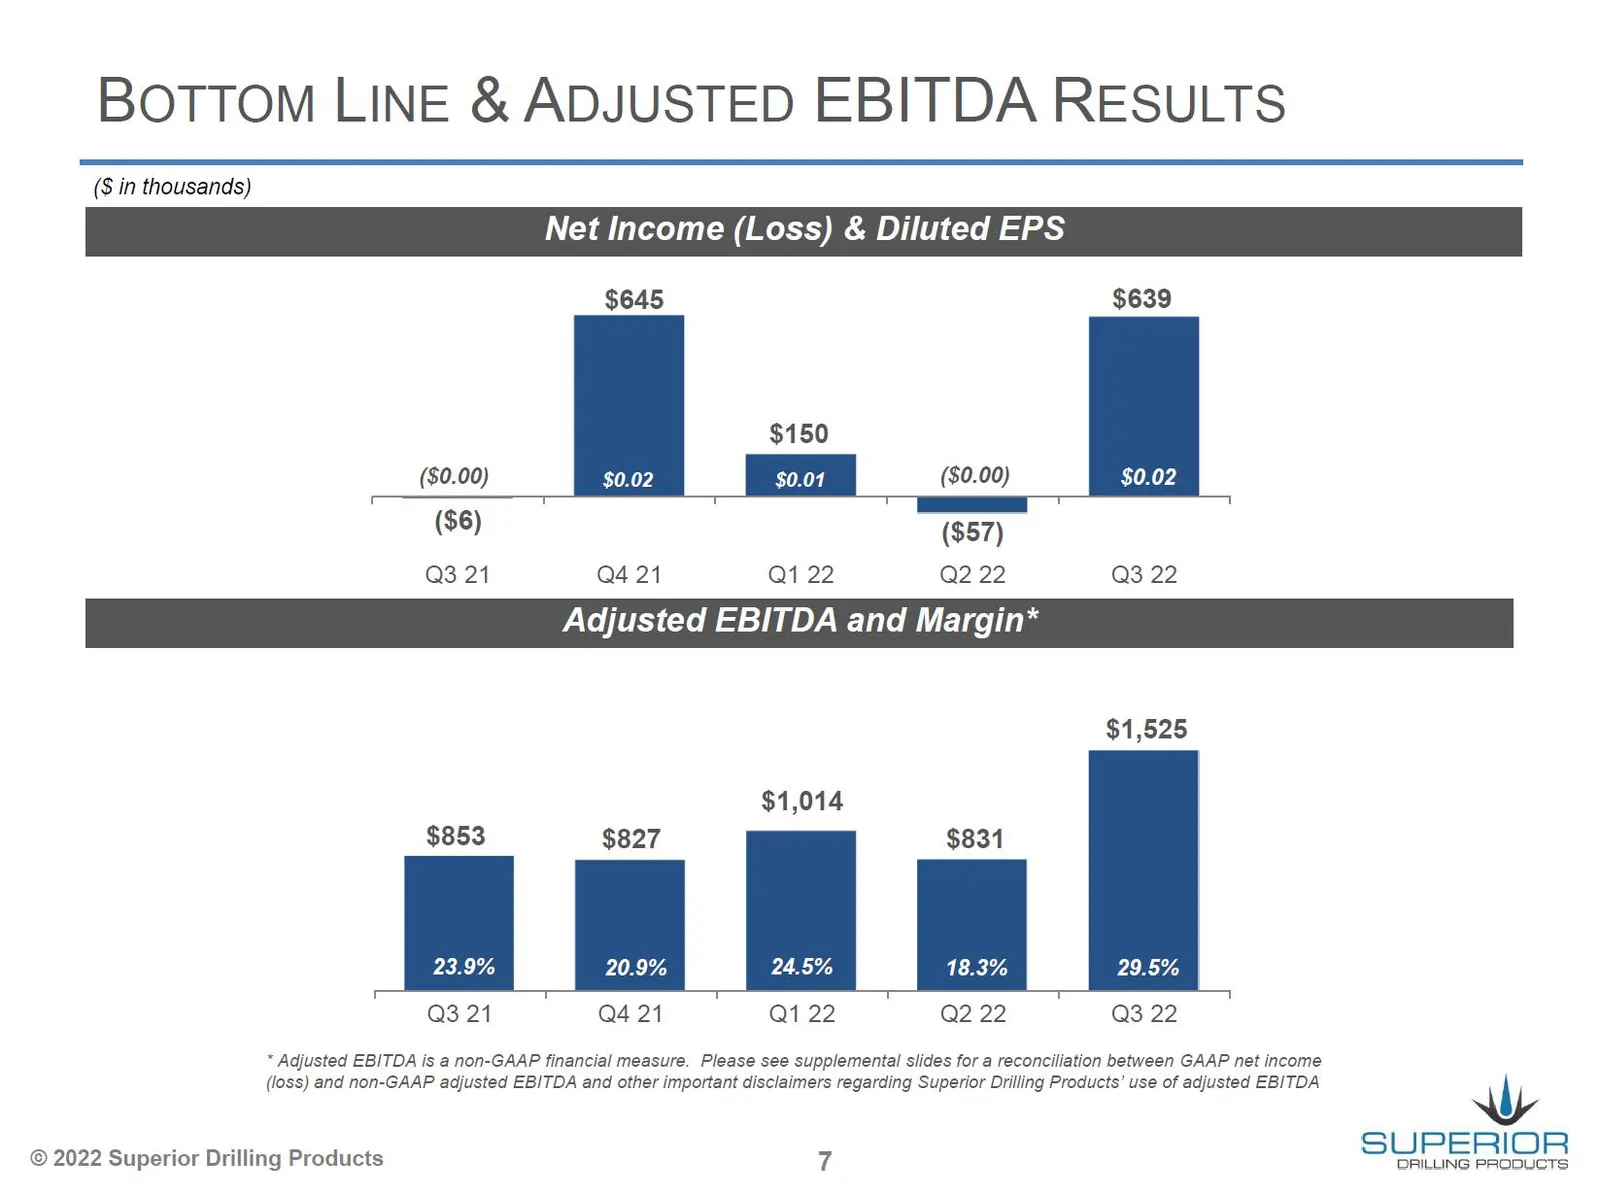
Slide 7: Bottom Line & Adjusted EBITDA Results
BOTTOM LINE & ADJUSTED EBITDA RESULTS (S$ in thousands) Net Income (Loss) & Diluted EPS $645 $639 $150 ($0.00) $0.02 $0.01 ($0.00) $0.02 ($6) ($57) Q3 21 Q4 21 Q1 22 Q2 22 Q3 22 Adjusted EBITDA and Margin* $1,525 $1,014 $853 $827 $831 29.5% "Q321 421“ Ds—“(itsiQDs— (ass * Adjusted EBITDA is a non-GA
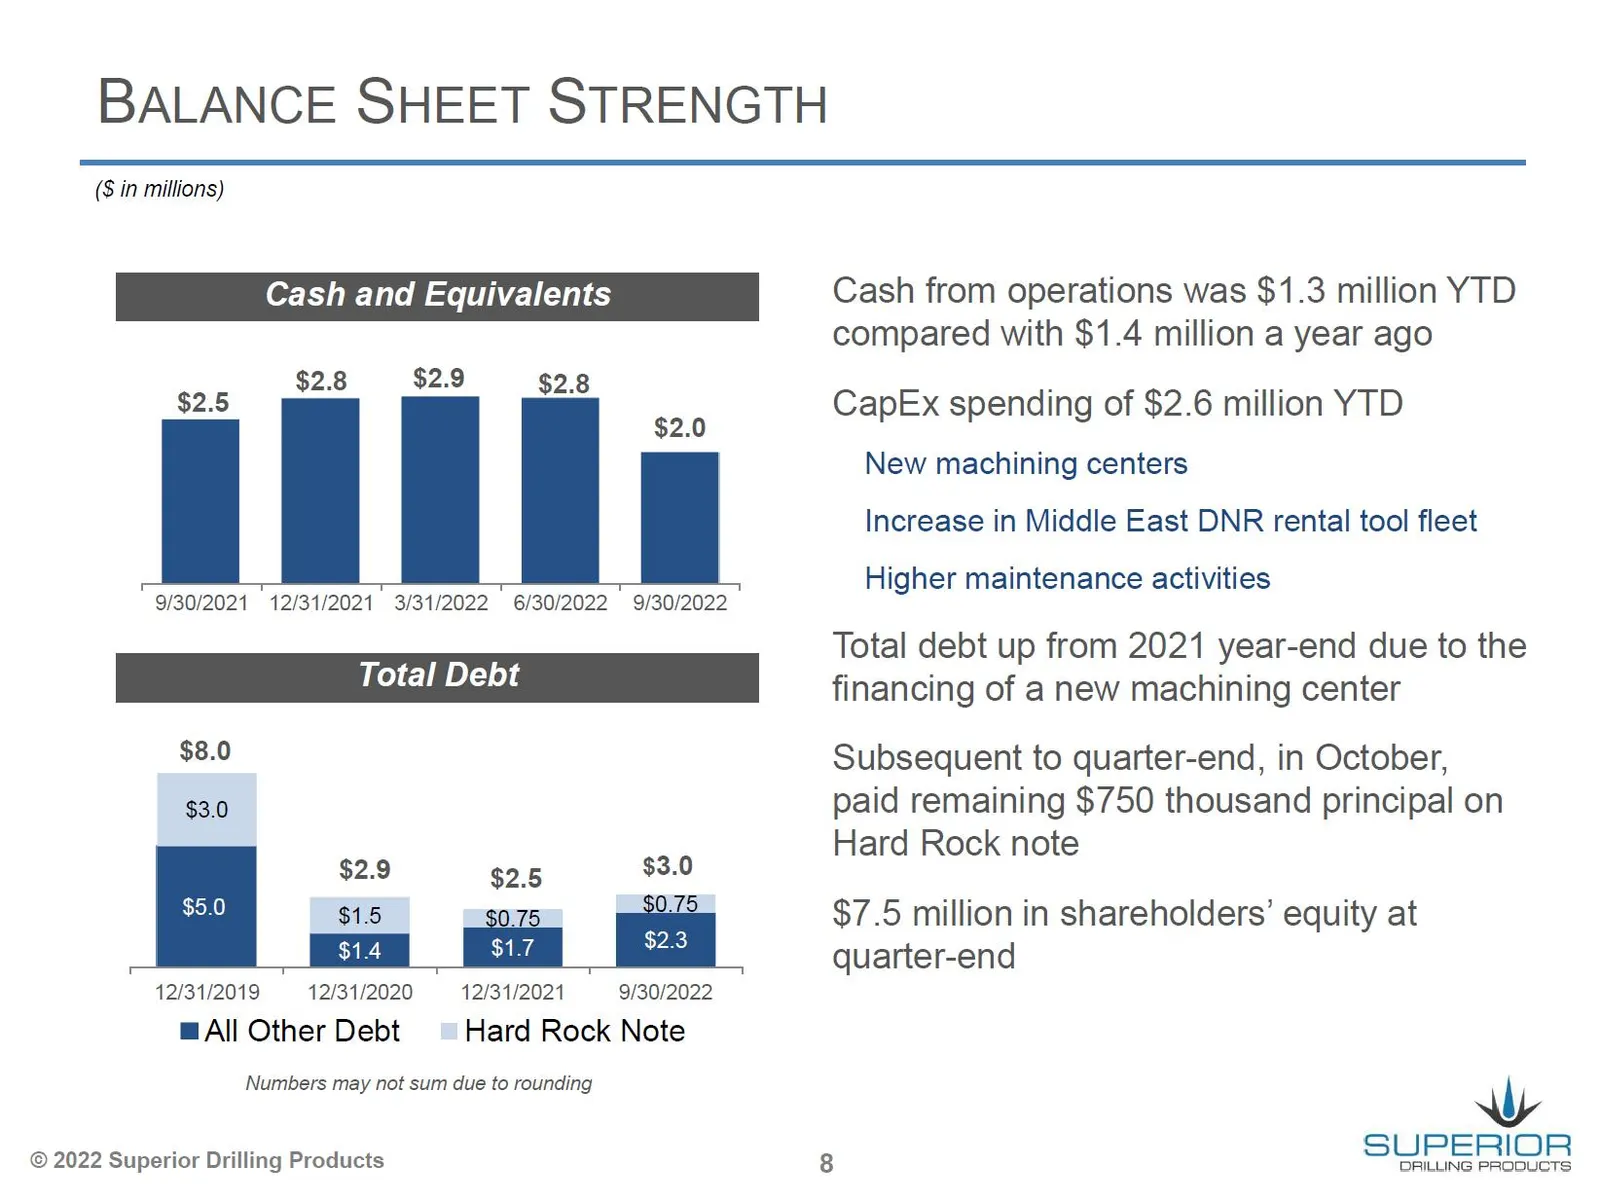
Slide 8: Balance Sheet Strength
BALANCE SHEET STRENGTH ($ in millions) Cash and Equivalents 2.8 $2.9 $2.5 $ $2.8 I i [ i : 9/30/2021 12/31/2021 3/31/2022 6/30/2022 9/30/2022 Total Debt $8.0 $3.0 | = $2.5 #68 $5.0 $15 0.75 ccm a "42912019 1231/2020 12/31/2021 9/30/2022 BAIl Other Debt Hard Rock Note Numbers may not sum due to round
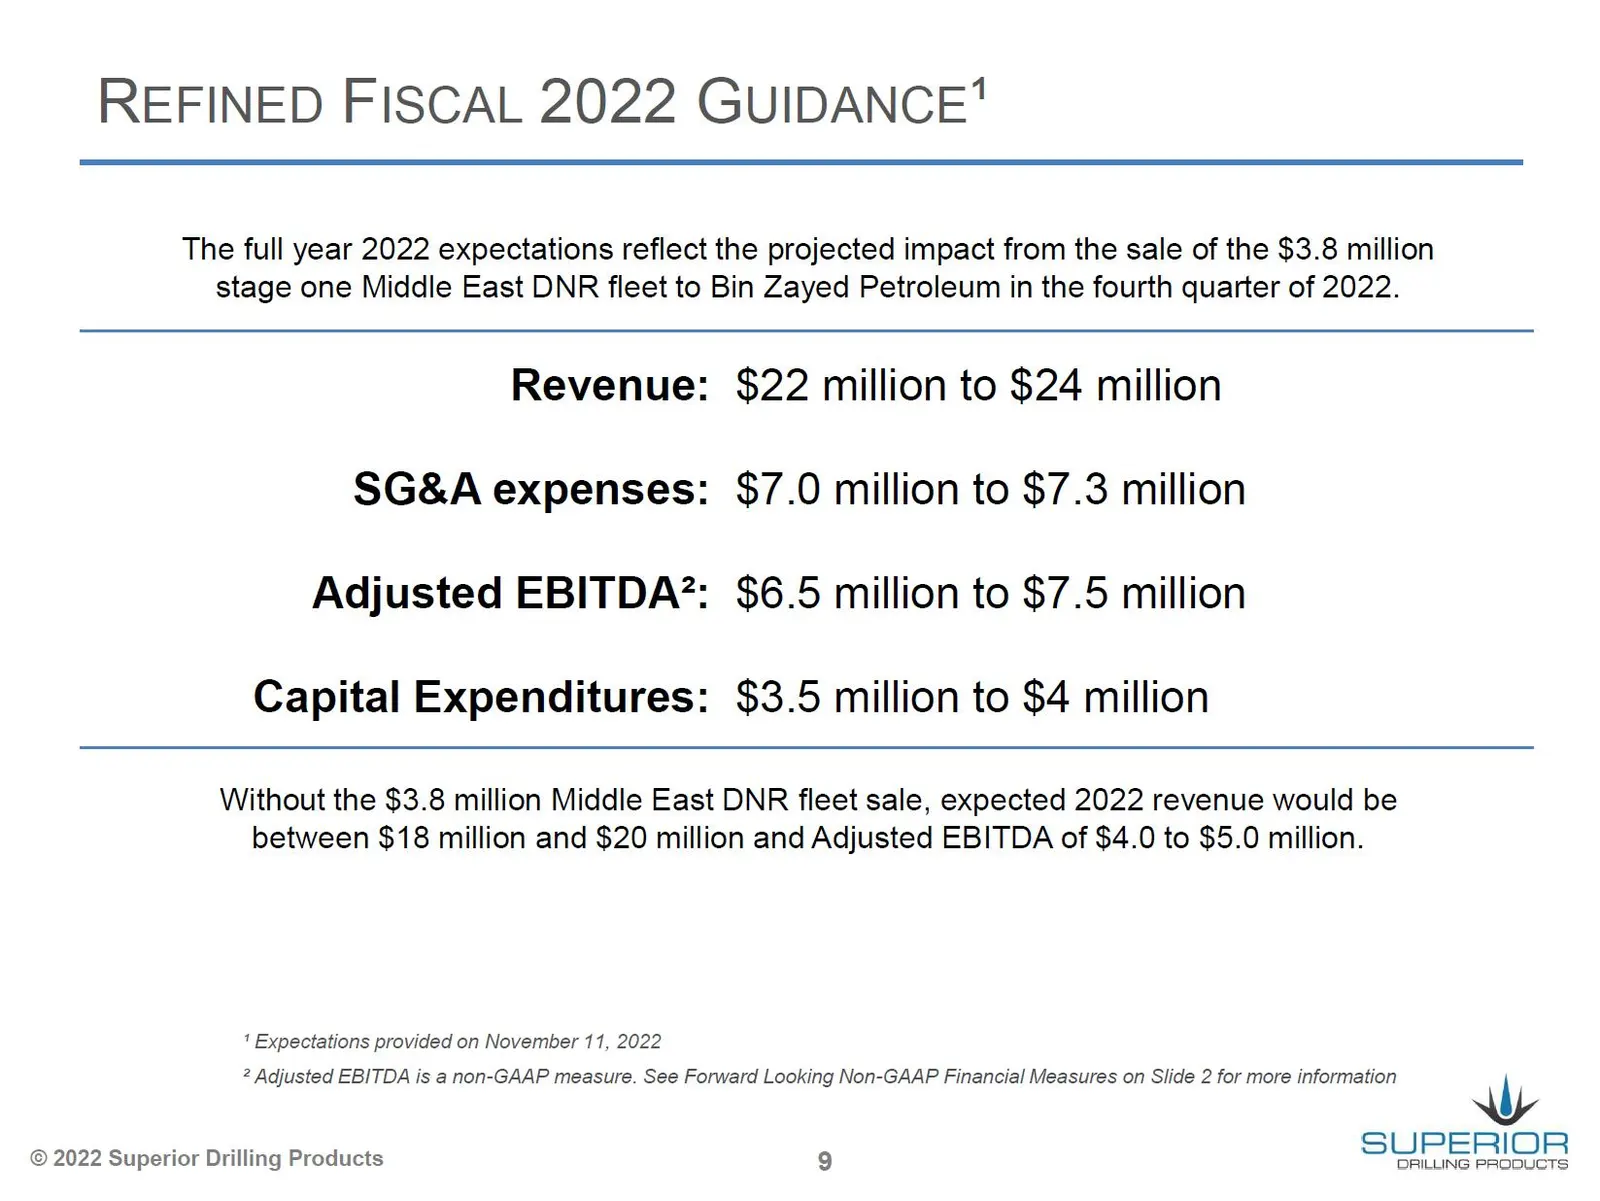
Slide 9: Refined Fiscal 2022 Guidance
REFINED FISCAL 2022 GUIDANCE" The full year 2022 expectations reflect the projected impact from the sale of the $3.8 million stage one Middle East DNR fleet to Bin Zayed Petroleum in the fourth quarter of 2022. Revenue: $22 million to $24 million SG&A expenses: $7.0 million to $7.3 million Adjusted
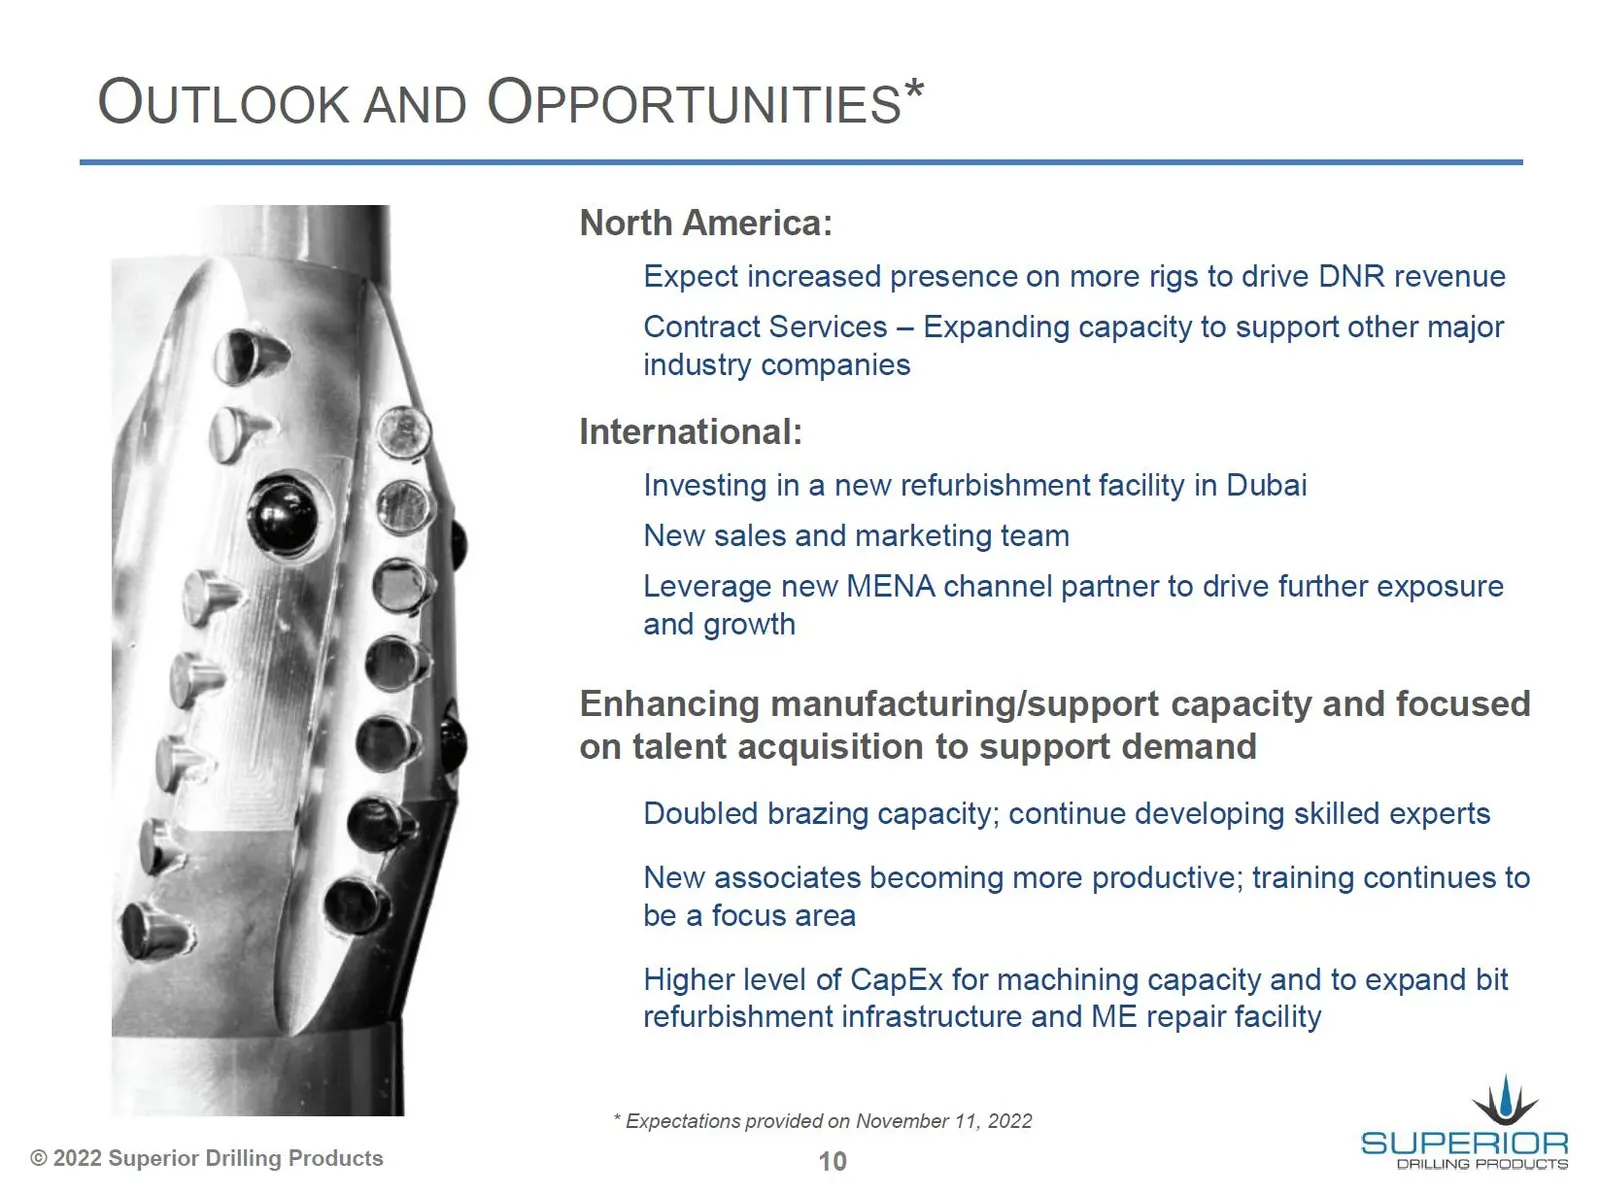
Slide 10: Outlook and Opportunities
OUTLOOK AND OPPORTUNITIES” North America: Expect increased presence on more rigs to drive DNR revenue Contract Services — Expanding capacity to support other major industry companies International: Investing in a new refurbishment facility in Dubai New sales and marketing team Leverage new MENA chan
Slide 11: Supplemental Information
Wy SUPERIOR DRILLING PRODUCTS SUPPLEMENTAL INFORMATION © 2022 Superior Drilling Products
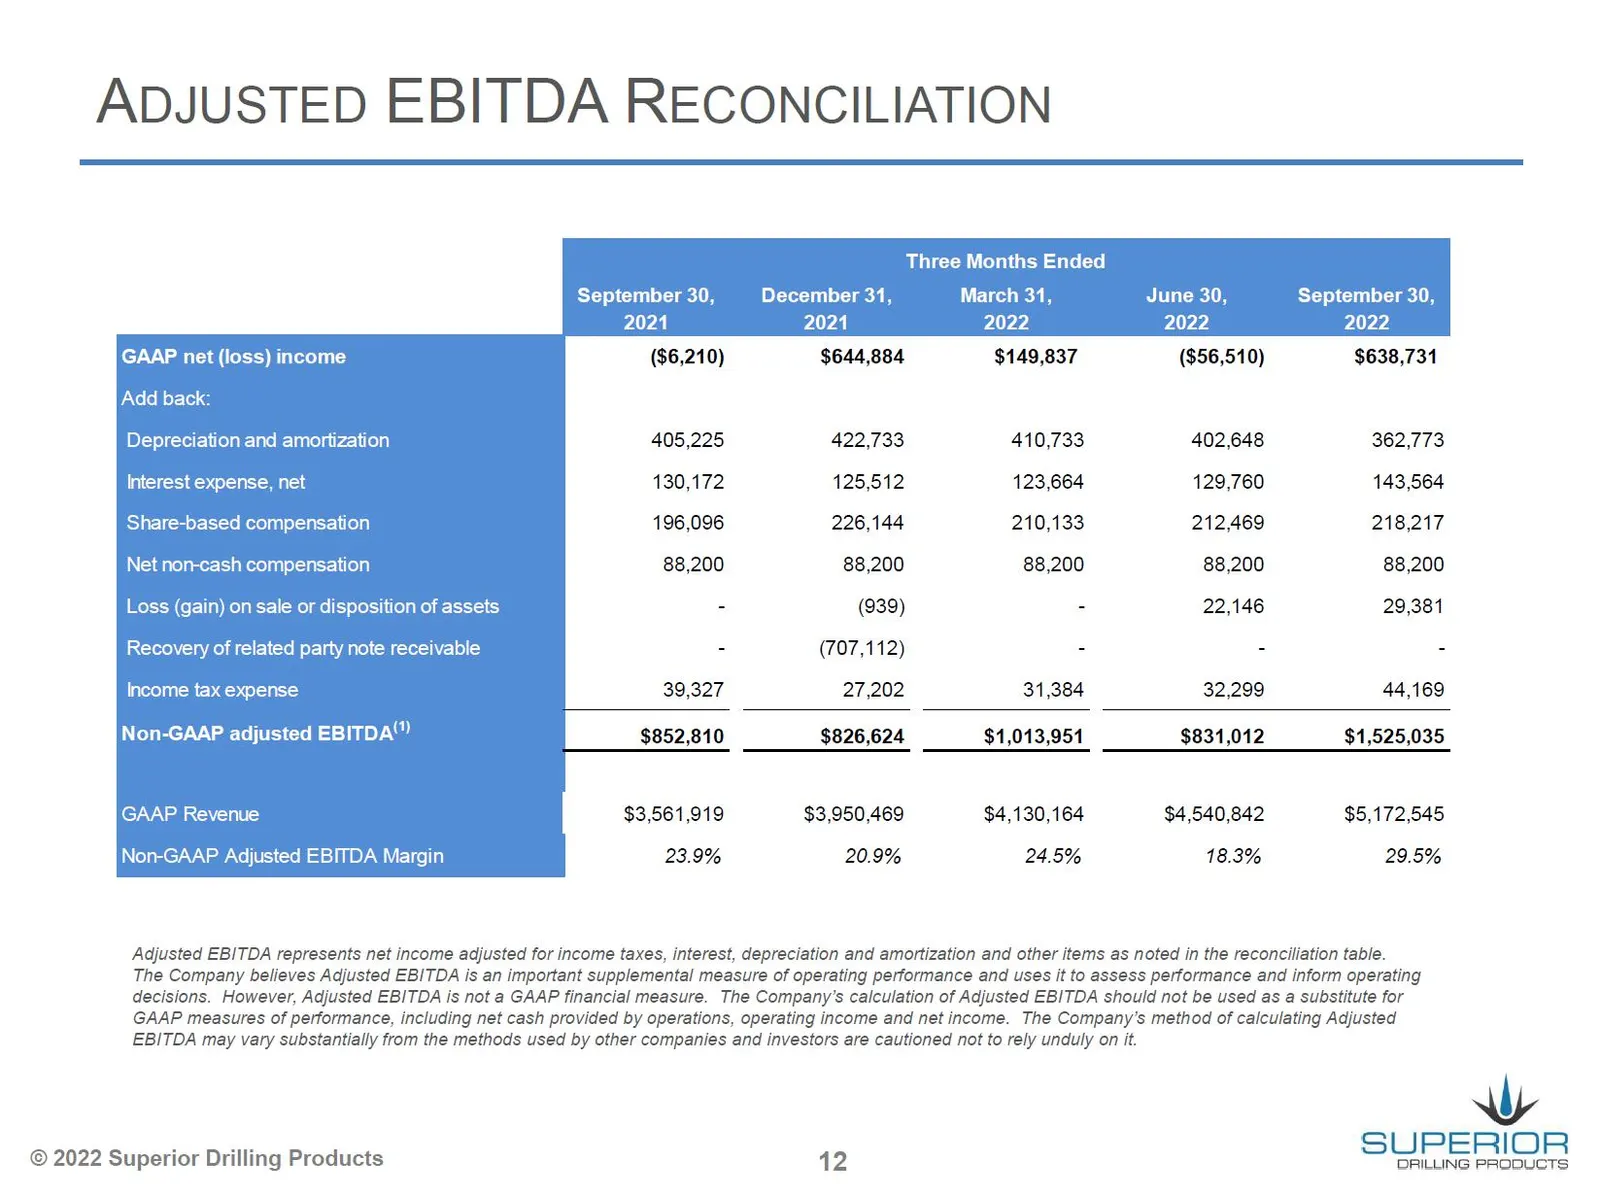
Slide 12: Adjusted EBITDA Reconciliation
ADJUSTED EBITDA RECONCILIATION GAAP net (loss) income Add back: Depreciation and amortization Interest expense, net Share-based compensation Net non-cash compensation Loss (gain) on sale or disposition of assets Recovery of related party note receivable Income tax expense Non-GAAP adjusted EBITDA GA
Source: SEC EDGAR · 8-K filed Nov 14, 2022
More decks from Superior Drilling Products Inc
 Q3 2023 Earnings Presentation12 slides · Nov 9, 2023
 Q2 2023 Earnings Presentation12 slides · Aug 14, 2023
 Q1 2023 Earnings Presentation12 slides · May 15, 2023
 FY2022 Earnings Presentation13 slides · Mar 10, 2023
 MicroCap Rodeo Windy City Roundup 202220 slides · Oct 12, 2022
 Q2 2022 Earnings Presentation12 slides · Aug 12, 2022