Superior Drilling Products Inc
Superior Drilling Products — Q1 2023 Earnings Presentation
12 slides from Superior Drilling Products's earnings presentation, May 15, 2023
Slide 1: First Quarter 2023 Financial Results Conference Call
SUZ SUPERIDR DRILLING PRODUCTS FIRST QUARTER 2023 FINANCIAL RESULTS CONFERENCE CALL May 11, 2023 TROY MEIER CHRISTOPHER CASHION CHAIRMAN AND CHIEF EXECUTIVE OFFICER CHIEF FINANCIAL OFFICER NYSE American: SDPI www.sdpi.com ©2023 Superior Drilling Products
Slide 2: Safe Harbor Statement
SAFE HARBOR STATEMENT These slides contain forward-looking statements and information that are subject to a number of risks and uncertainties, many of which are beyond our control. ll statements, other than statements of historical fact included in these slides and the acoompanying oral presentation
Slide 3: Strong Execution Drives Enhanced Results
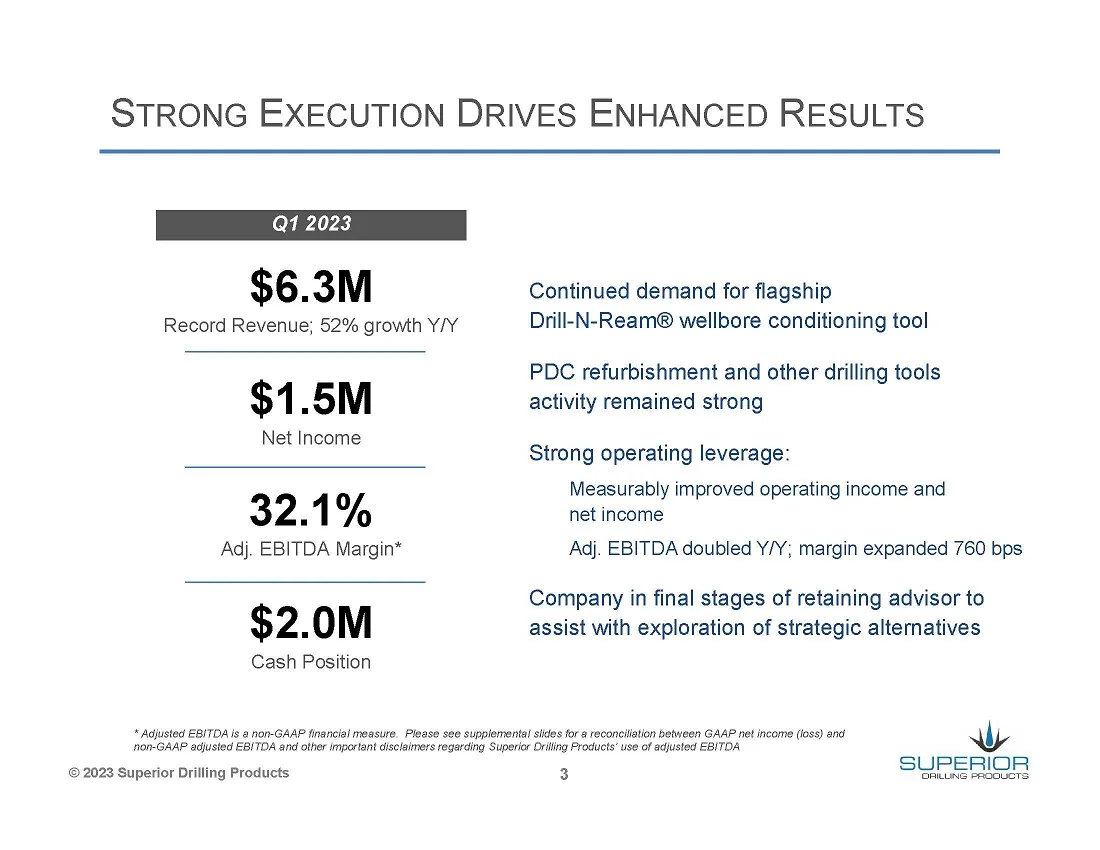
STRONG EXECUTION DRIVES ENHANCED RESULTS Q1 2023 $6. 3M Continued demand for flagship Record Revenue; 52% growth Y/Y Drill-N-Ream® wellbore conditioning tool PDC refurbishment and other drilling tools $1 .5M activity remained strong Net Income ql Strong operating leverage: 0 Measurably improved oper
Slide 4: Q1 Revenue Grew 52% Y/Y, Sequentially Up 19.5%
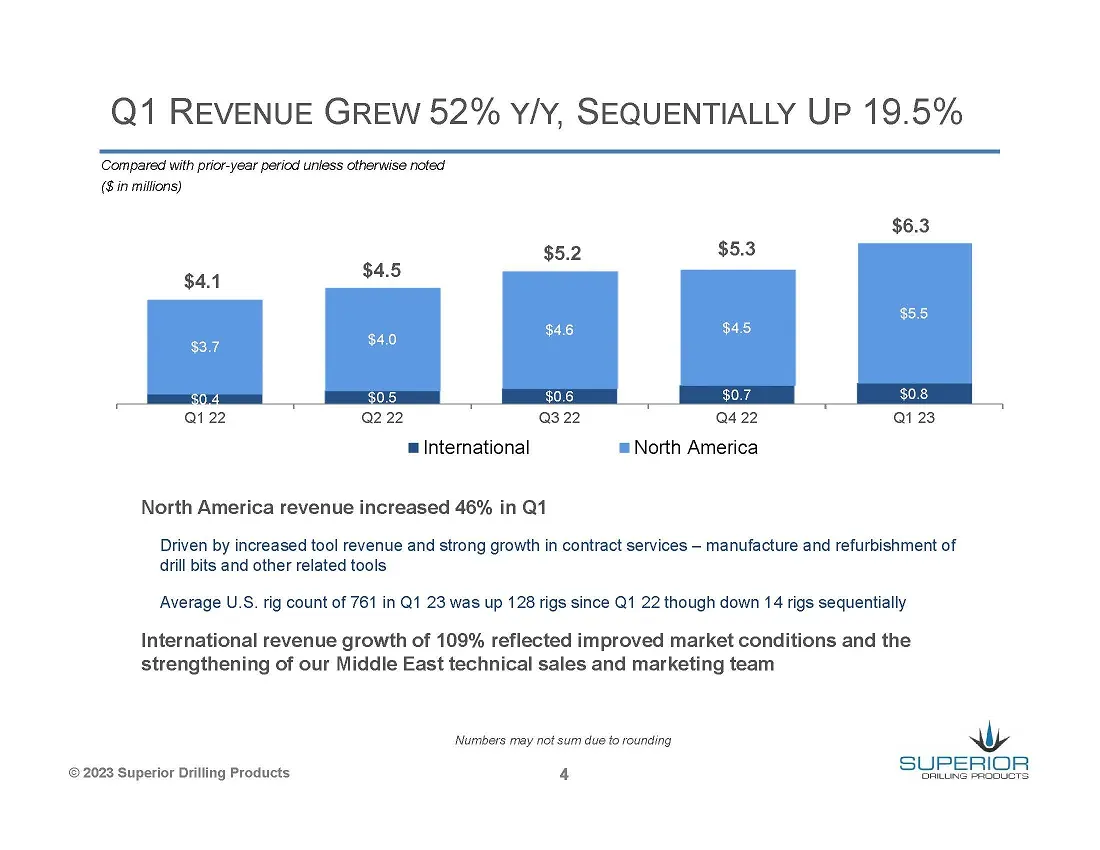
Q1 REVENUE GREW 52% Y/Y, SEQUENTIALLY UP 19.5% Compared with prior-year period unless otherwise noted ($ in millions) $6.3 $5.2 $4.4 $4.5 $5.5 $3.7 a4 an SO $0.5 $0.6 $0.8 Qi 22 2.22 93.22 2422 a1 23 m International = North America North America revenue increased 46% in Q1 Driven by increased tool r
Slide 5: Tool and Contract Services Revenue Growth
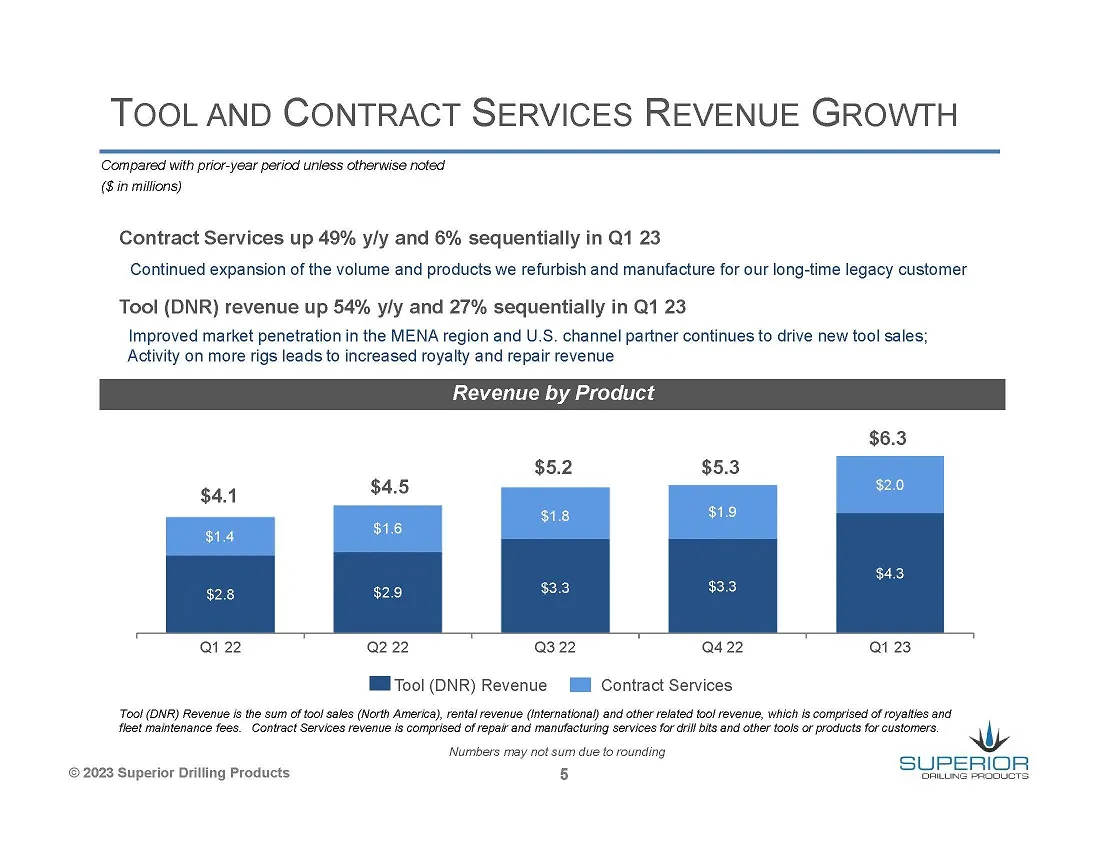
TOOL AND CONTRACT SERVICES REVENUE GROWTH Compared with prior-year period unless otherwise noted (Sin millions) Contract Services up 49% y/y and 6% sequentially in Q1 23 Continued expansion of the volume and products we refurbish and manufacture for our long-time legacy customer Tool (DNR) revenue u
Slide 6: Investing to Address Strong Demand
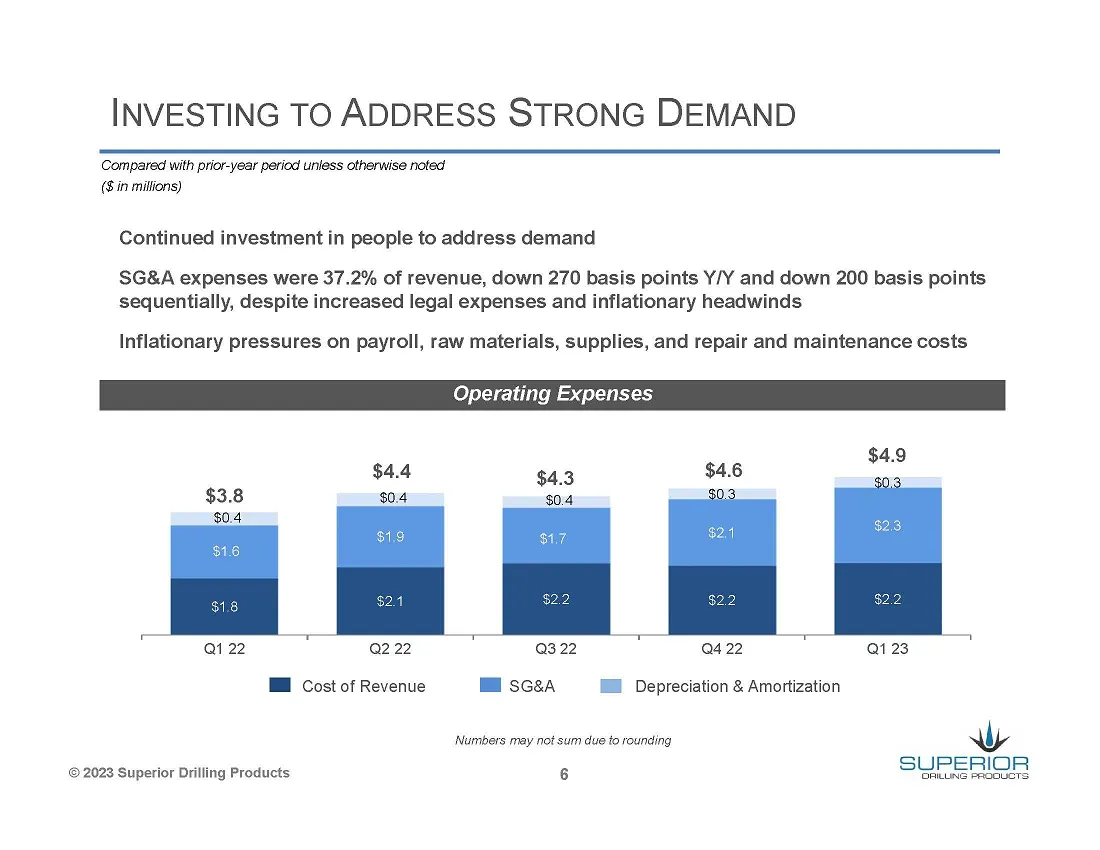
INVESTING TO ADDRESS STRONG DEMAND Compared with prior-year period unless otherwise noted (Sin millions) Continued investment in people to address demand SG&A expenses were 37.2% of revenue, down 270 basis points Y/Y and down 200 basis points sequentially, despite increased legal expenses and inflat
Slide 7: Enhanced Leverage Drove Strong Cash Generation
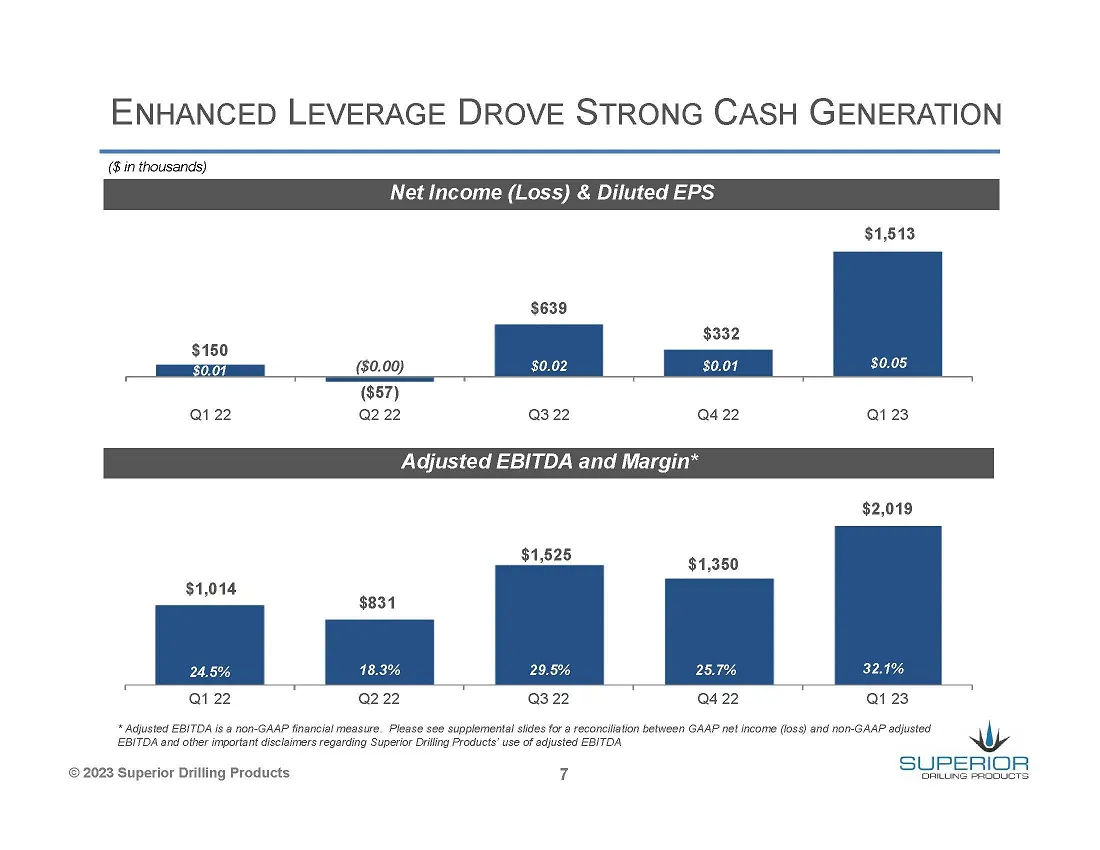
ENHANCED LEVERAGE DROVE STRONG CASH GENERATION (8 in thousands) Net Income (Loss) & Diluted EPS $1,513 $639 $150 $332 a ($0.00) $0.02 ee (887) ai 22 222 0322 0422 an23 Adjusted EBITDA and Margin* $2,019 aE $1,360 32.1% ‘ Qi 22 : 0222 “9322 0422 . 123 ° * Adjusted EBITDA is @ non-GAAP financial measu
Slide 8: Balance Sheet Strength
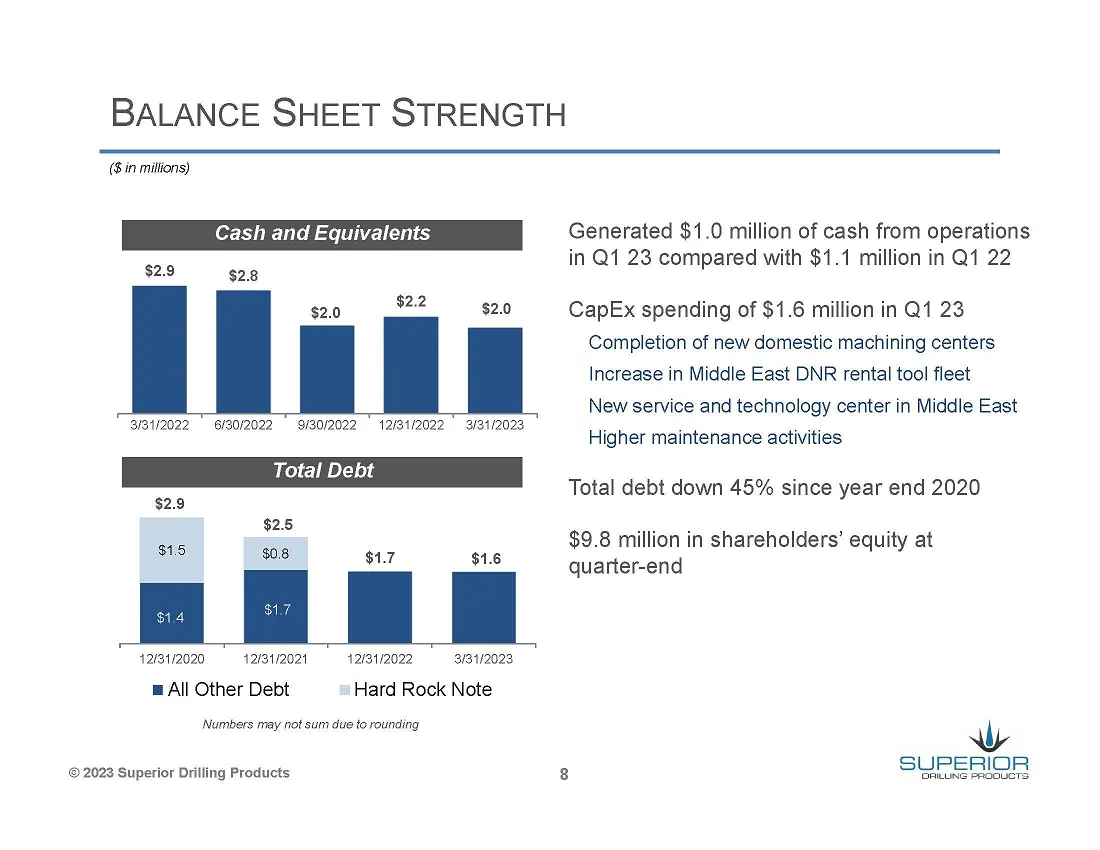
BALANCE SHEET STRENGTH (8 in millions) Cash and Equivalents Generated $1.0 million of cash from operations $2.9 $28 in Q1 23 compared with $1.1 million in Q1 22 $2.0 $2.2 $2.0 CapEx spending of $1.6 million in Q1 23 Completion of new domestic machining centers. Increase in Middle East DNR rental too
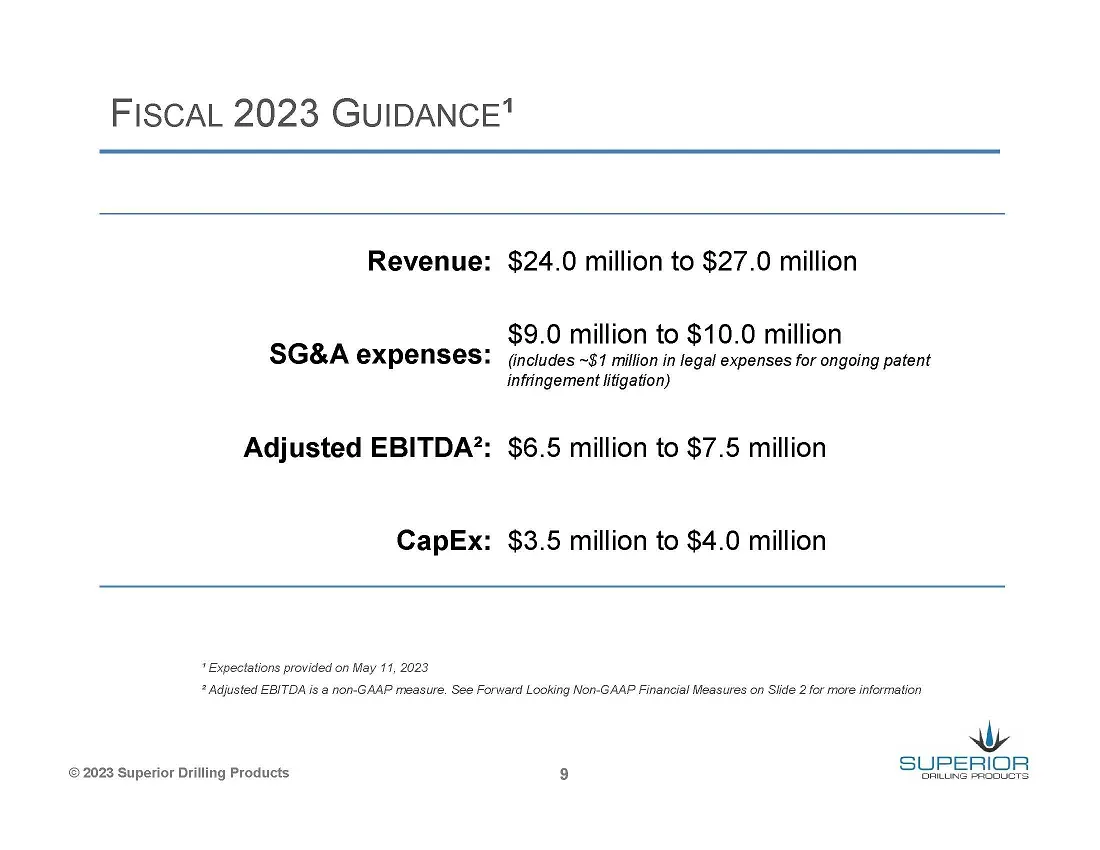
Slide 9: Fiscal 2023 Guidance
FISCAL 2023 GUIDANCE" Revenue: $24.0 million to $27.0 million $9.0 million to $10.0 million SG&A expenses: finciudes ~$1 million in legal expenses for ongoing patent infringement itfgation) Adjusted EBITDA?: $6.5 million to $7.5 million CapEx: $3.5 million to $4.0 million " Expectations provided on
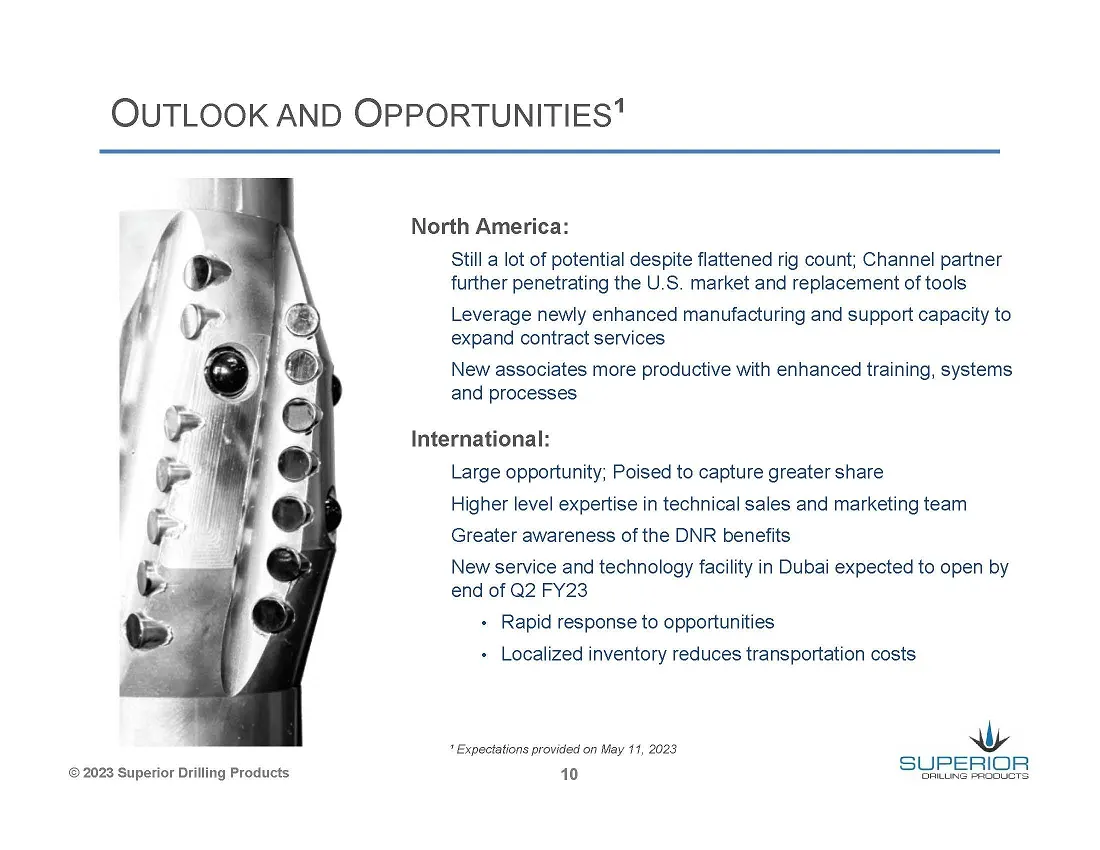
Slide 10: Outlook and Opportunities
OUTLOOK AND OPPORTUNITIES" © 2023 Superior Drilling Products North America: Still a lot of potential despite flattened rig count; Channel partner further penetrating the U.S. market and replacement of tools Leverage newly enhanced manufacturing and support capacity to expand contract services New as
Slide 11: Supplemental Information
Wy SUPERIDR DRILLING PRODUCTS SUPPLEMENTAL INFORMATION ©2028 Superior Drilling Products
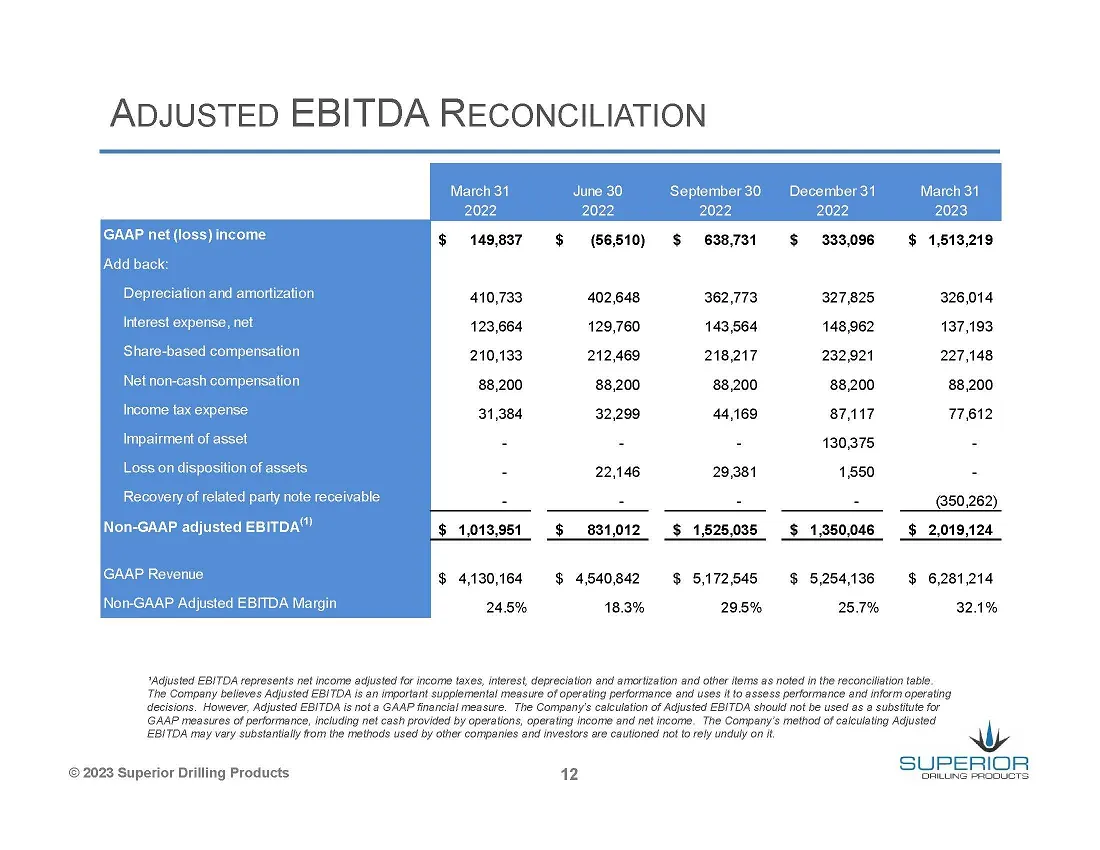
Slide 12: Adjusted EBITDA Reconciliation
ADJUSTED EBITDA RECONCILIATION GAAP net (loss) income Add back: Depreciation and amortization Interest expense, net Share-based compel Net non-cash compet Income Impairment of Non-GAAP adjusted EBITDA GAAP Revenue Non-GAAP Adjusted EBIMDA Margin March 31 2022 $ 149,837 June 30 September30 December 3
Source: SEC EDGAR · 8-K filed May 15, 2023
More decks from Superior Drilling Products Inc
 Q3 2023 Earnings Presentation12 slides · Nov 9, 2023
 Q2 2023 Earnings Presentation12 slides · Aug 14, 2023
 FY2022 Earnings Presentation13 slides · Mar 10, 2023
 Q3 2022 Earnings Presentation12 slides · Nov 14, 2022
 MicroCap Rodeo Windy City Roundup 202220 slides · Oct 12, 2022
 Q2 2022 Earnings Presentation12 slides · Aug 12, 2022