PetroQuest Energy — Investor Presentation (February 2015)
34 slides from PetroQuest Energy's investor presentation, Feb 18, 2015
Slide 1: PetroQuest Energy, Inc. February 2015
oe Energy, Inc. February 2015,
Slide 2: Forward Looking Statements
Forward Looking Statements 2 This presentation contains "forward-looking statements" within the meaning of Section 27A of the Securities Act of 1933, as amended, and Section 21E of the Securities Exchange Act of 1934, as amended. These forward-looking statements are subject to certain risks, trends
Slide 3: Navigating the Current Environment
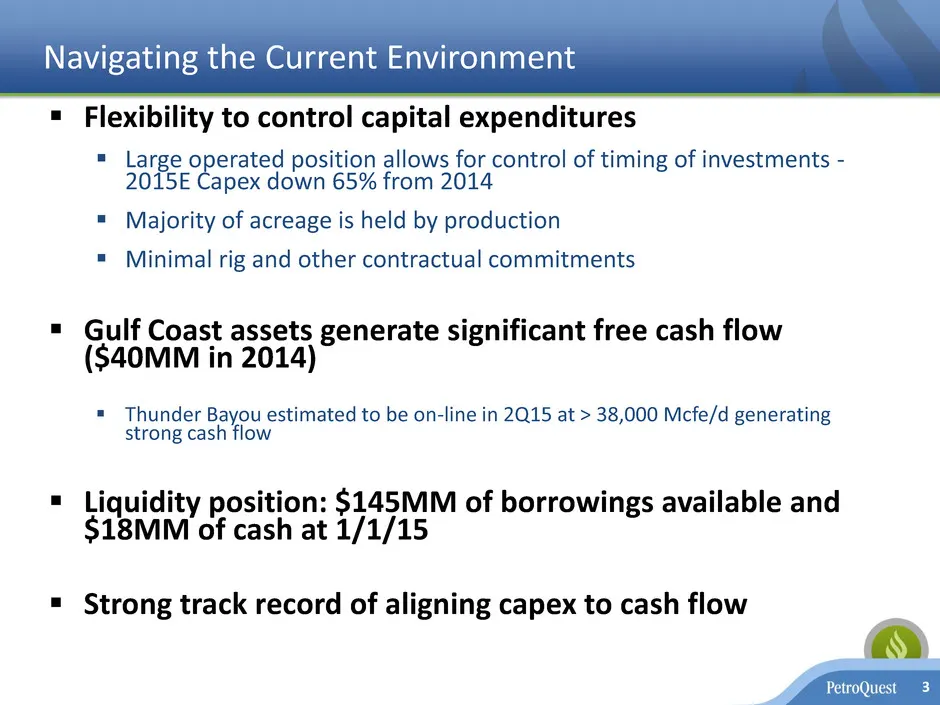
Navigating the Current Environment Flexibility to control capital expenditures Large operated position allows for control of timing of investments - 2015E Capex down 65% from 2014 Majority of acreage is held by production Minimal rig and other contractual commitments Gulf Coast assets gene
Slide 4: 2014 Recap
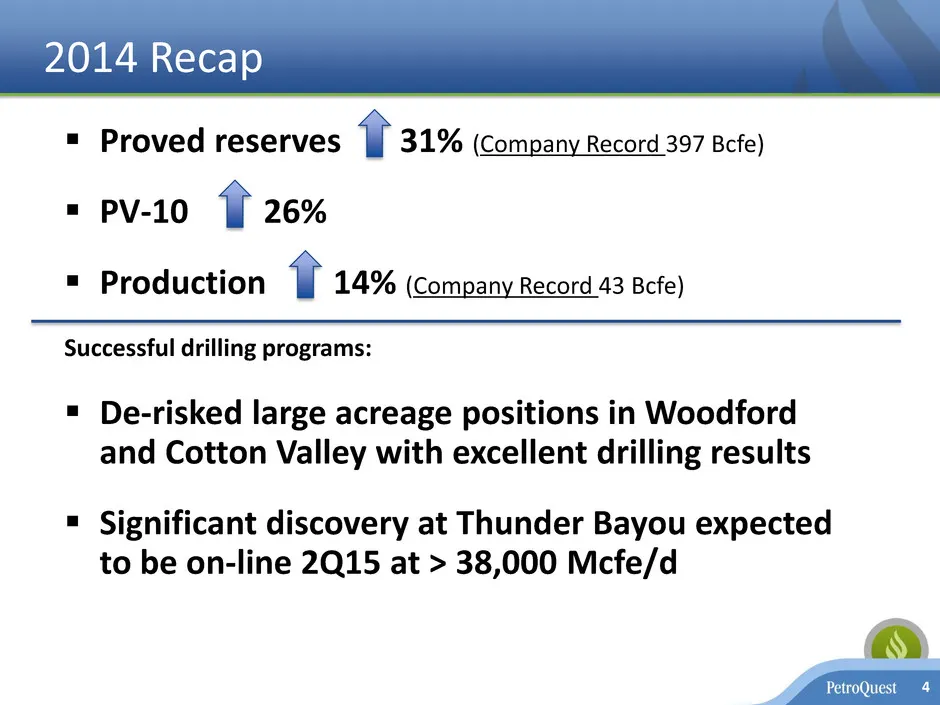
2014 Recap Proved reserves 31% (Company Record 397 Bcfe) PV-10 26% Production 14% (Company Record 43 Bcfe) Successful drilling programs: De-risked large acreage positions in Woodford and Cotton Valley with excellent drilling results Significant discovery at Thunder Bayou expected to be on-
Slide 5: Our Properties
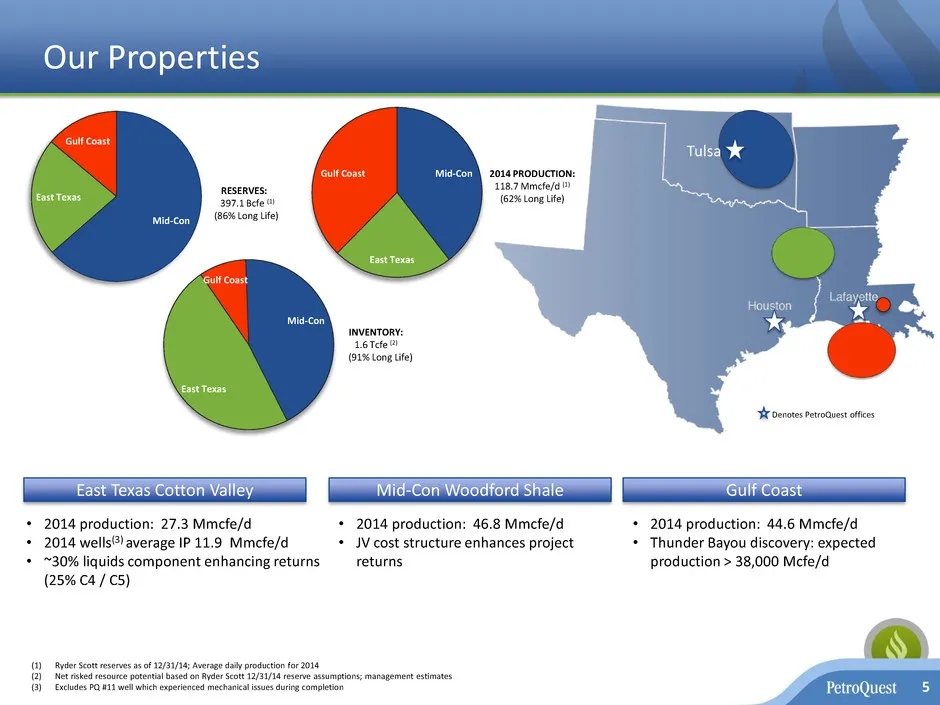
(1) Ryder Scott reserves as of 12/31/14; Average daily production for 2014 (2) Net risked resource potential based on Ryder Scott 12/31/14 reserve assumptions; management estimates (3) Excludes PQ #11 well which experienced mechanical issues during completion Our Properties 5 Mid-Con East Texas Gulf
Slide 6: Industry Activity - Cotton Valley Trend
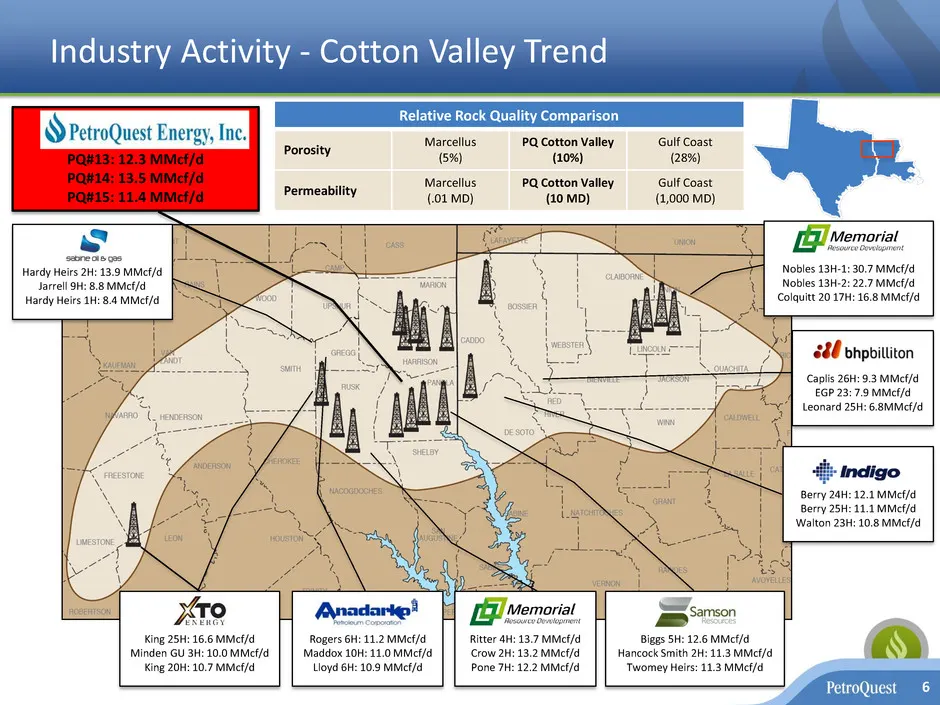
Industry Activity - Cotton Valley Trend 6 Caplis 26H: 9.3 MMcf/d EGP 23: 7.9 MMcf/d Leonard 25H: 6.8MMcf/d Nobles 13H-1: 30.7 MMcf/d Nobles 13H-2: 22.7 MMcf/d Colquitt 20 17H: 16.8 MMcf/d Berry 24H: 12.1 MMcf/d Berry 25H: 11.1 MMcf/d Walton 23H: 10.8 MMcf/d PQ#13: 12.3 MMcf/d PQ#14: 13.5 MMcf/d PQ#1
Slide 7: Cotton Valley Horizontal – Horizontal Uplift
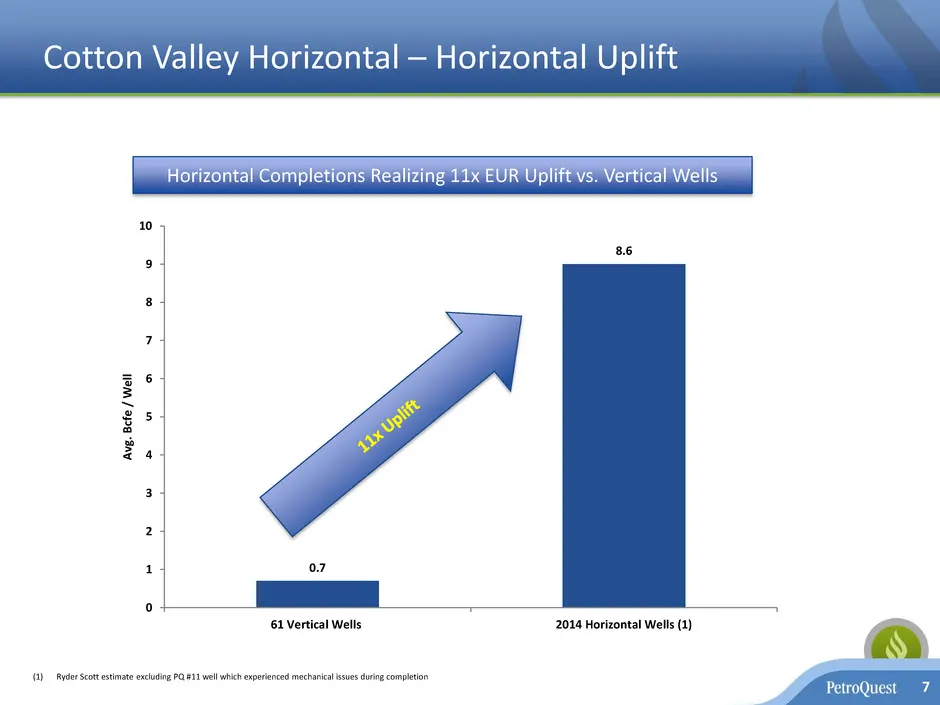
Cotton Valley Horizontal – Horizontal Uplift 7 Horizontal Completions Realizing 11x EUR Uplift vs. Vertical Wells (1) Ryder Scott estimate excluding PQ #11 well which experienced mechanical issues during completion 0.7 8.6 0 1 2 3 4 5 6 7 8 9 10 61 Vertical Wells 2014 Horizontal Wells (1) A vg . B c
Slide 8: Cotton Valley Horizontal – Moving Up the Curve
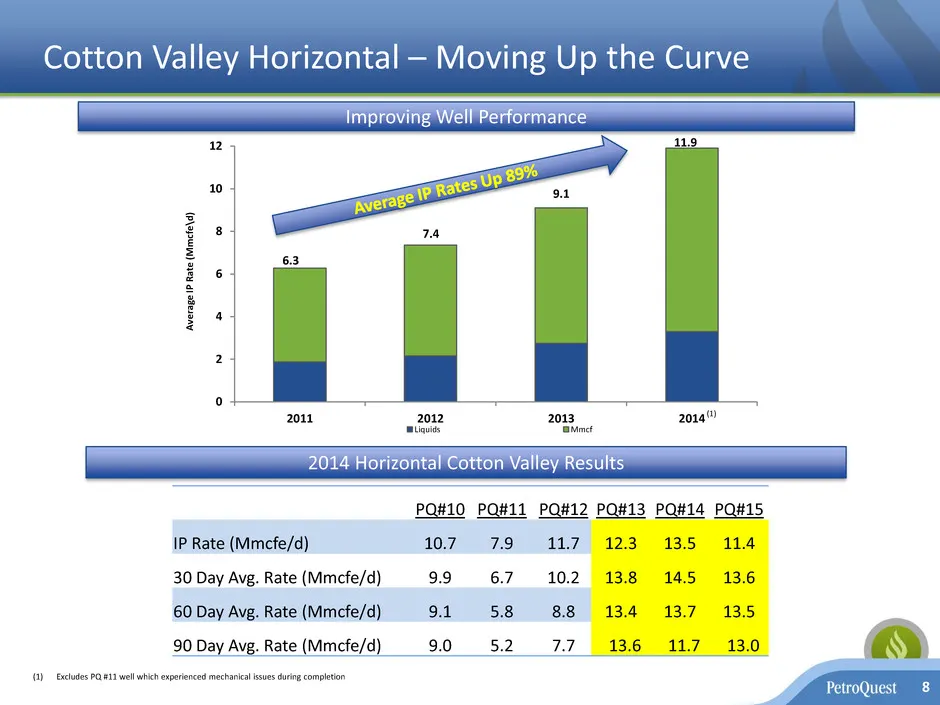
Cotton Valley Horizontal – Moving Up the Curve 8 Improving Well Performance (1) Excludes PQ #11 well which experienced mechanical issues during completion (1) 6.3 7.4 9.1 11.9 0 2 4 6 8 10 12 2011 2012 2013 2014 A ve rag e IP Ra te ( M m cf e \d ) Liquids Mmcf 2014 Horizontal Cotton Valley Results P
Slide 9: Cotton Valley Horizontal Economics
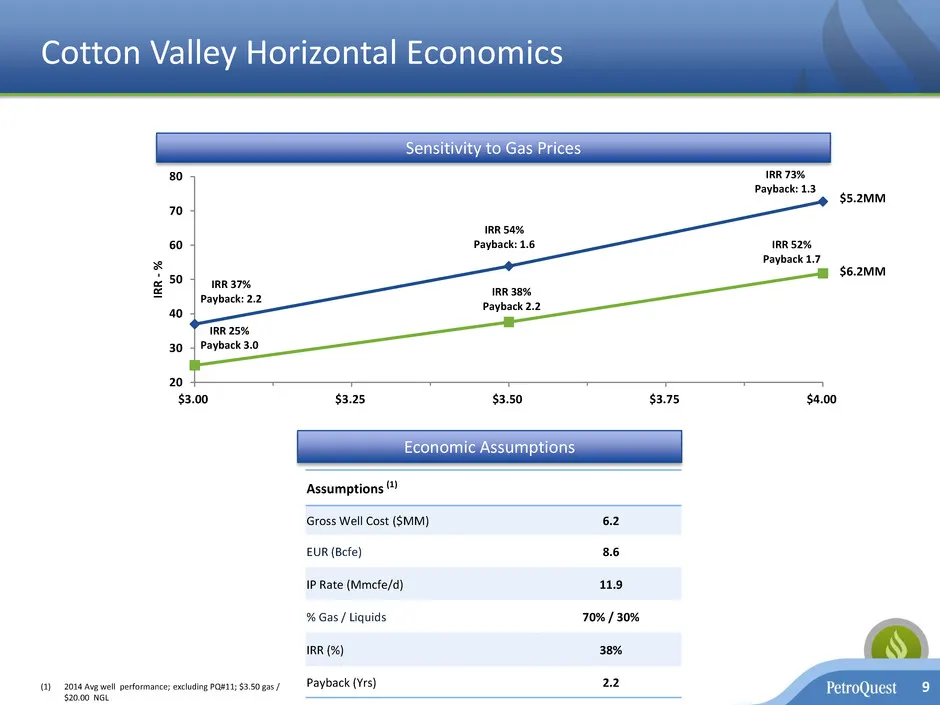
Cotton Valley Horizontal Economics 9 Assumptions (1) Gross Well Cost ($MM) 6.2 EUR (Bcfe) 8.6 IP Rate (Mmcfe/d) 11.9 % Gas / Liquids 70% / 30% IRR (%) 38% Payback (Yrs) 2.2(1) 2014 Avg well performance; excluding PQ#11; $3.50 gas / $20.00 NGL Sensitivity to Gas Prices Economic Assumptions IRR 37% Pa
Slide 10: Cotton Valley Horizontal Planned Activity and Inventory
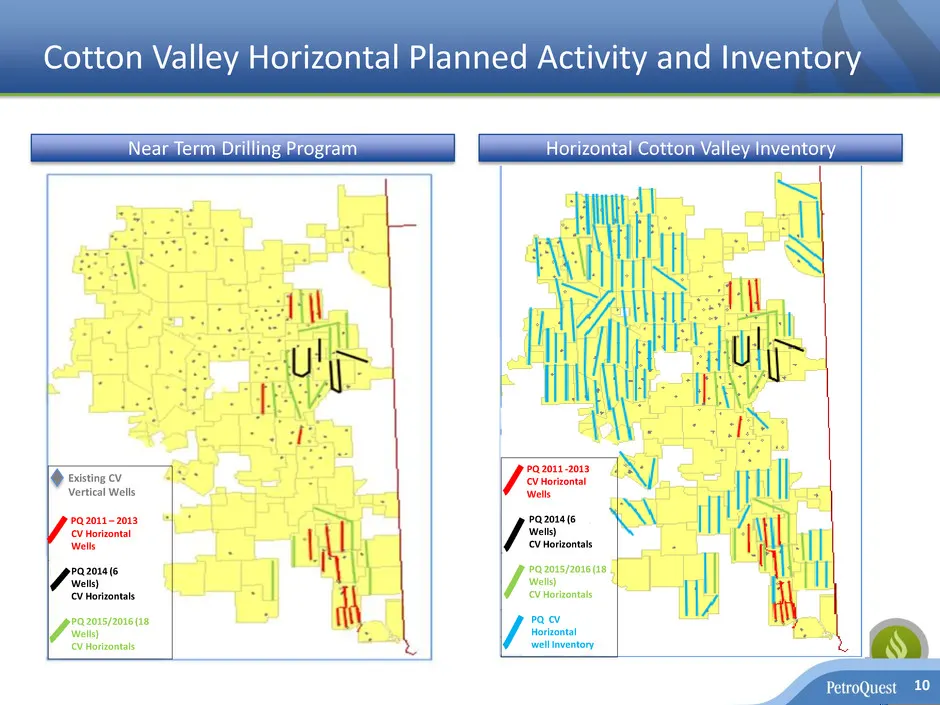
Cotton Valley Horizontal Planned Activity and Inventory 10 Near Term Drilling Program Horizontal Cotton Valley Inventory PQ 2011 – 2013 CV Horizontal Wells PQ 2014 (6 Wells) CV Horizontals PQ 2015 (18 Wells) CV Horizontals Existing CV Vertical Wells PQ 2011 – 2013 CV Horizontal Wells PQ 2014 (6 Well
Slide 11: Cotton Valley Drilling to Unlock NAV
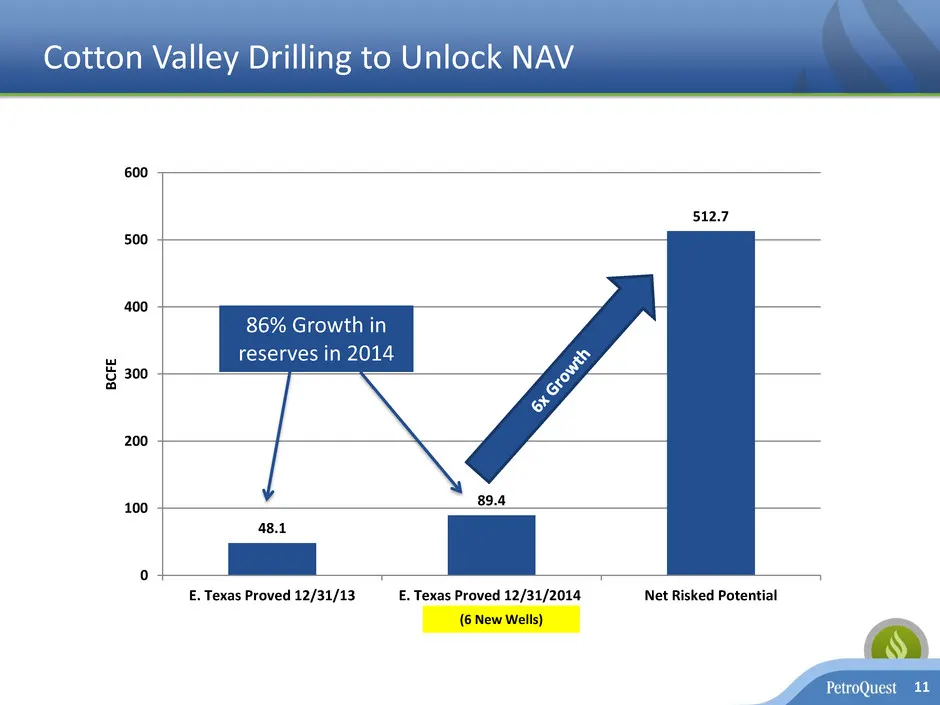
Cotton Valley Drilling to Unlock NAV 11 48.1 89.4 512.7 0 100 200 300 400 500 600 E. Texas Proved 12/31/13 E. Texas Proved 12/31/2014 Net Risked Potential BCF E (6 New Wells) 86% Growth in reserves in 2014
Slide 12: Gulf Coast – Free Cash Flow Generator
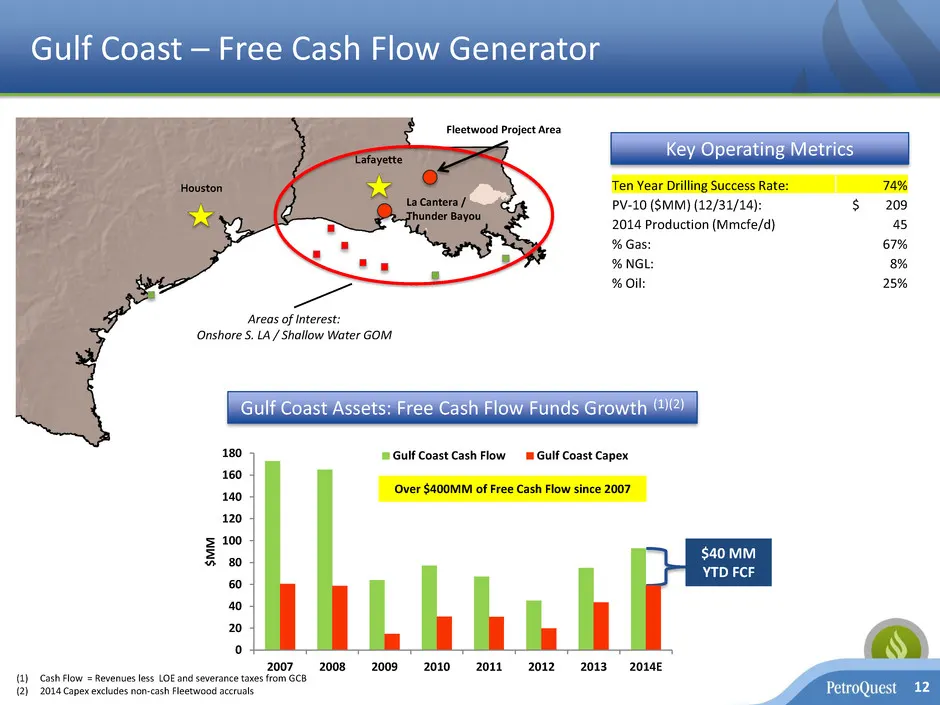
Gulf Coast – Free Cash Flow Generator 12 Houston Lafayette Areas of Interest: Onshore S. LA / Shallow Water GOM Key Operating Metrics Fleetwood Project Area (1) Cash Flow = Revenues less LOE and severance taxes from GCB (2) 2014 Capex excludes non-cash Fleetwood accruals Gulf Coast Assets: Free Cash
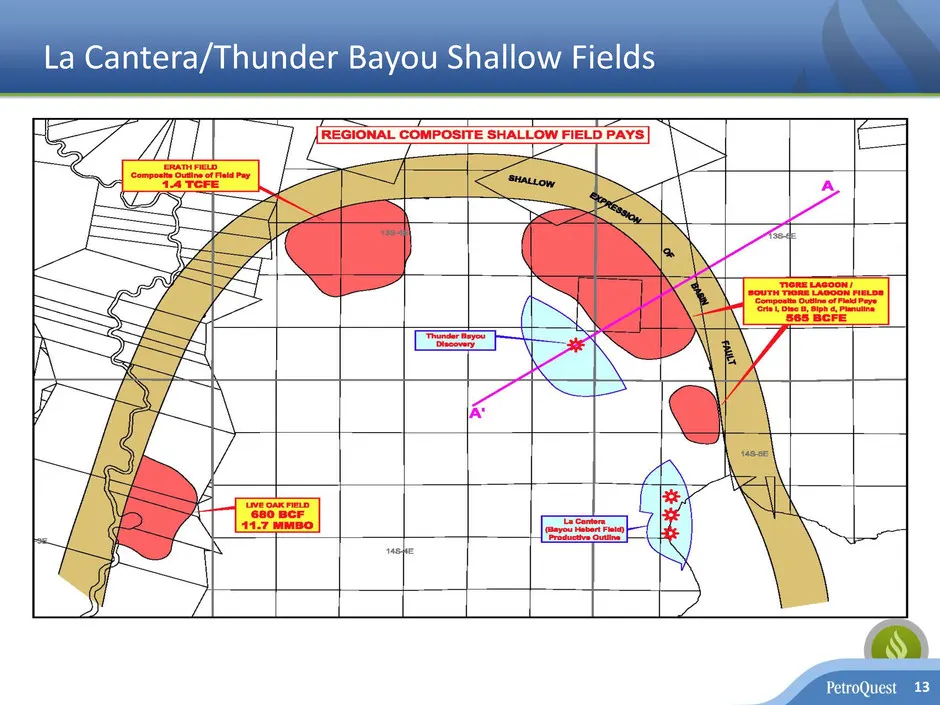
Slide 13: La Cantera/Thunder Bayou Shallow Fields
La Cantera/Thunder Bayou Shallow Fields 13
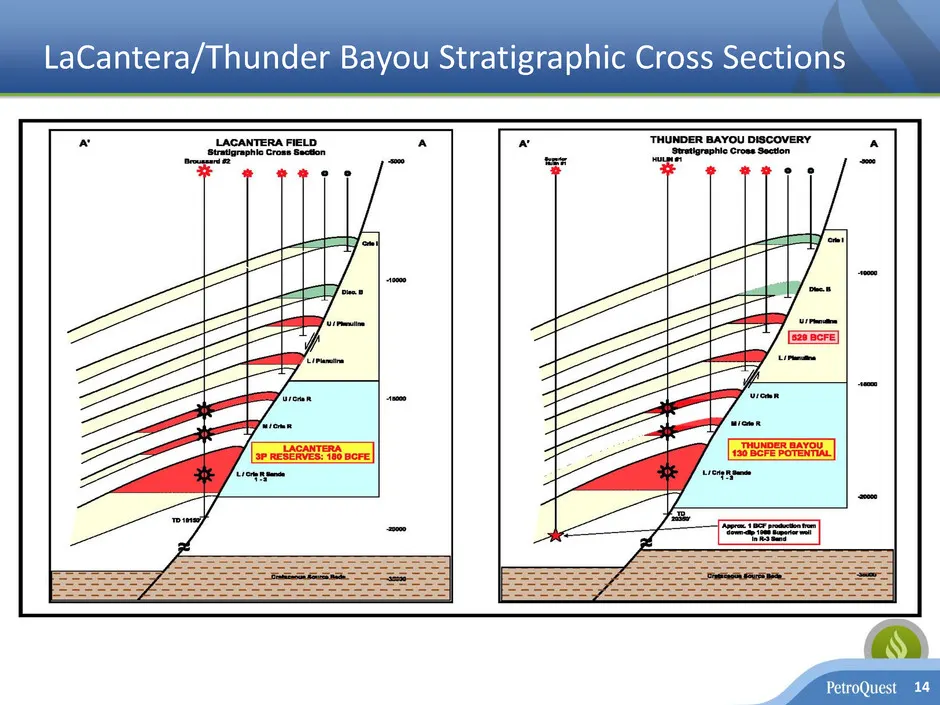
Slide 14: LaCantera/Thunder Bayou Stratigraphic Cross Sections
LaCantera/Thunder Bayou Stratigraphic Cross Sections 14
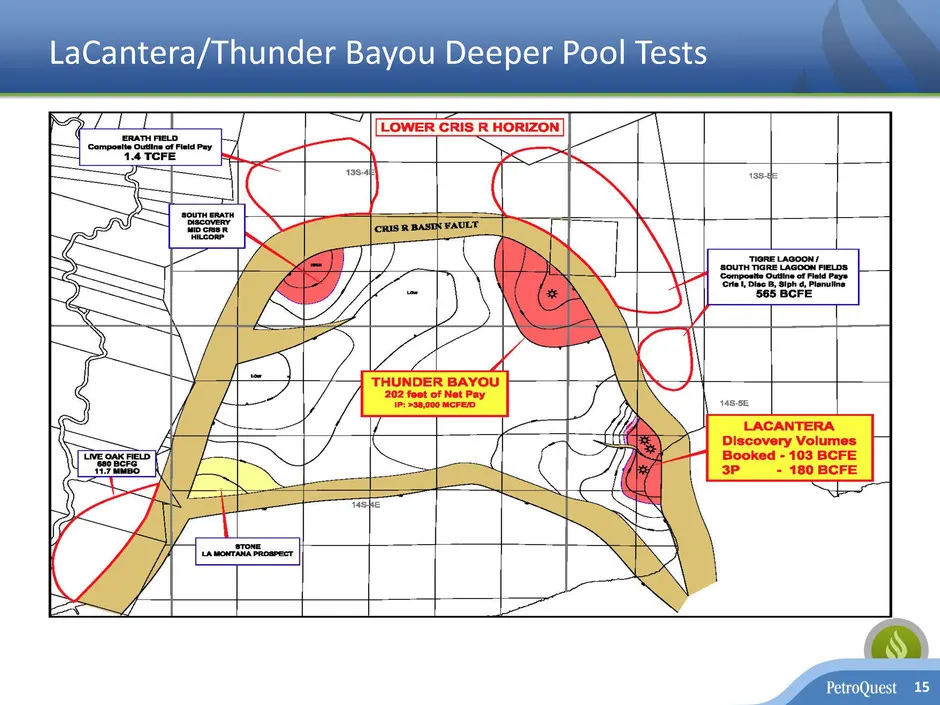
Slide 15: LaCantera/Thunder Bayou Deeper Pool Tests
LaCantera/Thunder Bayou Deeper Pool Tests 15
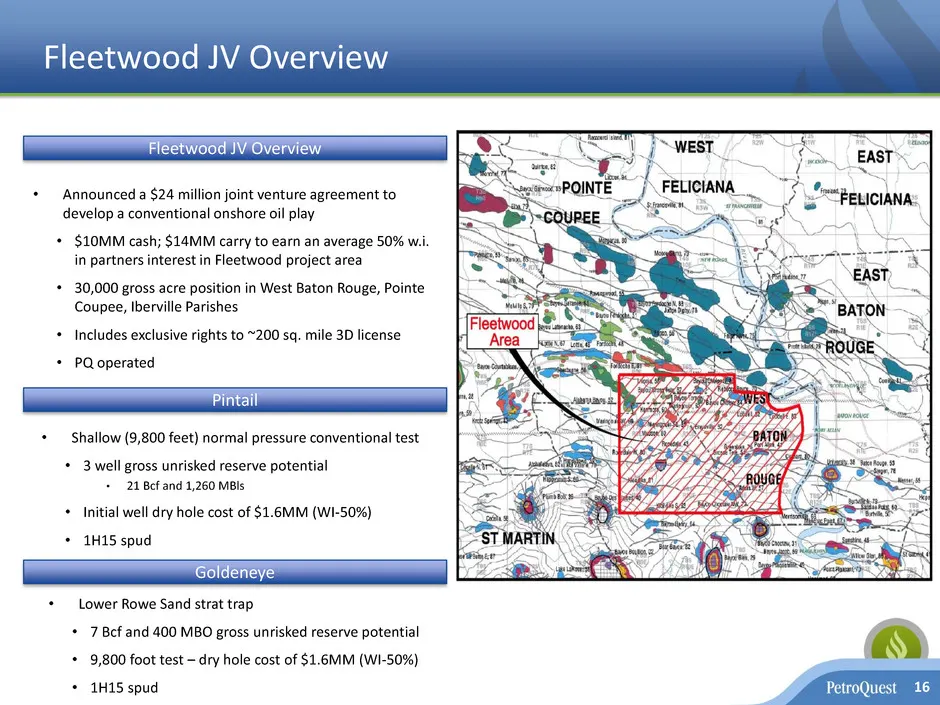
Slide 16: Fleetwood JV Overview
Fleetwood JV Overview • Announced a $24 million joint venture agreement to develop a conventional onshore oil play • $10MM cash; $14MM carry to earn an average 50% w.i. in partners interest in Fleetwood project area • 30,000 gross acre position in West Baton Rouge, Pointe Coupee, Iberville Parishes
Slide 17: Mid-Continent Woodford Shale
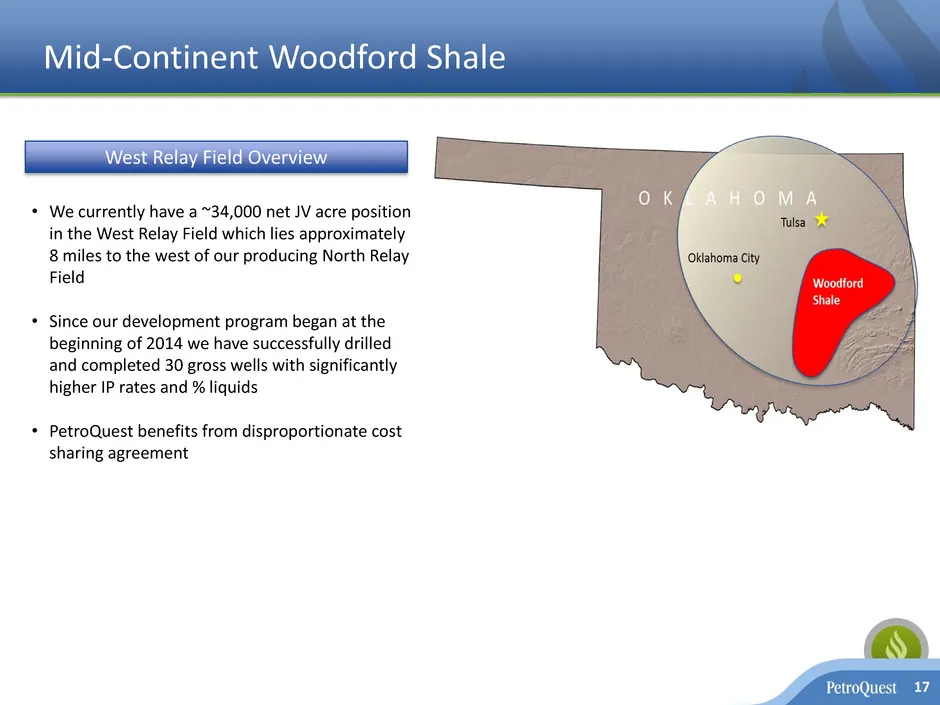
Mid-Continent Woodford Shale 17 • We currently have a ~34,000 net JV acre position in the West Relay Field which lies approximately 8 miles to the west of our producing North Relay Field • Since our development program began at the beginning of 2014 we have successfully drilled and completed 30 gros
Slide 18: Woodford Position – Ramping Up Development
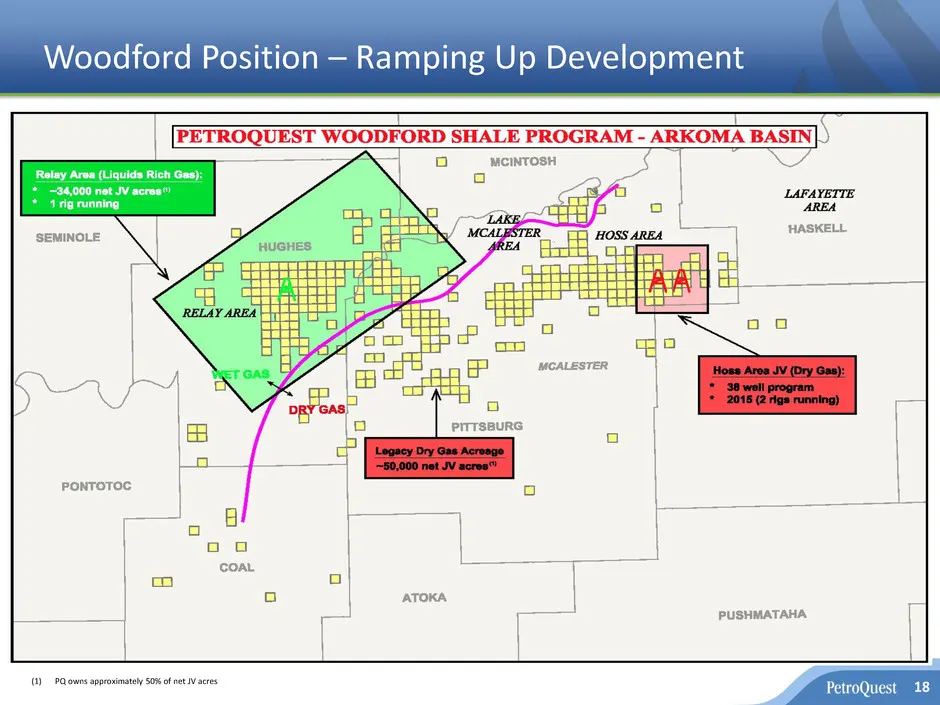
Woodford Position – Ramping Up Development 18(1) PQ owns approximately 50% of net JV acres
Slide 19: West Relay Program - Strong Initial Results
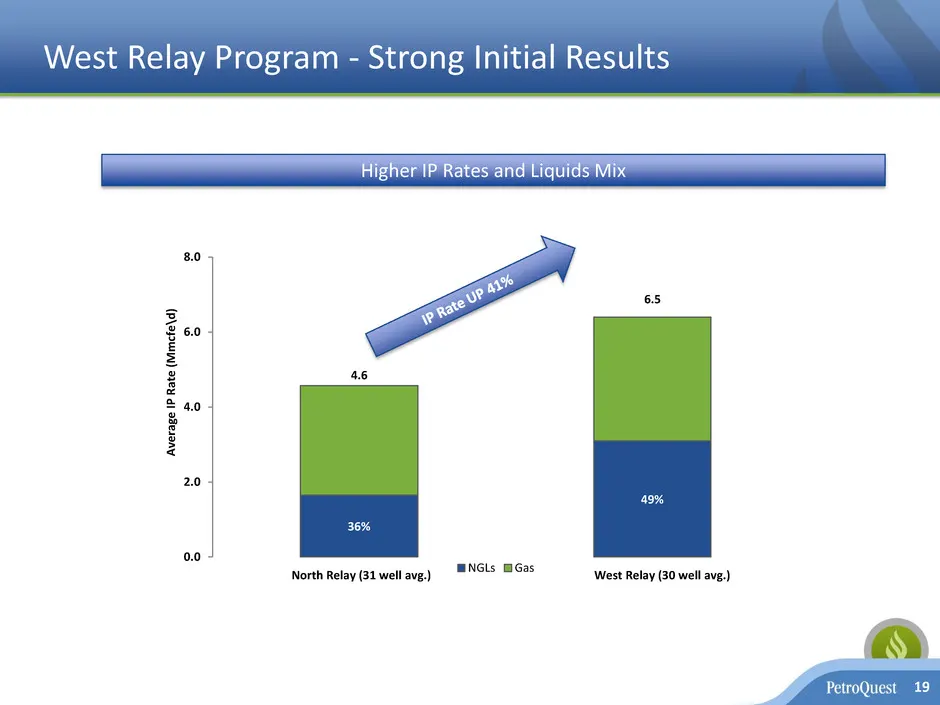
West Relay Program - Strong Initial Results 19 Higher IP Rates and Liquids Mix 36% 49% 4.6 6.5 0.0 2.0 4.0 6.0 8.0 A ve ra ge I P R ate ( M m cf e \d ) NGLs Gas North Relay (31 well avg.) West Relay (30 well avg.)
Slide 20: Woodford Liquids Rich Gas – West Relay Field
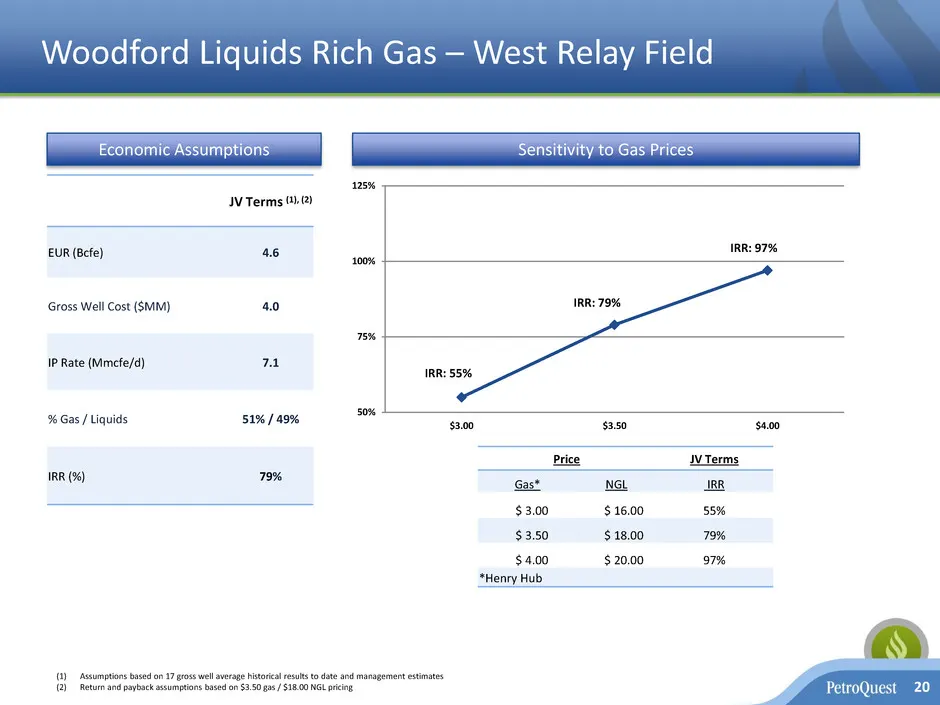
Woodford Liquids Rich Gas –West Relay Field 20 Price JV Terms Gas* NGL IRR $ 3.00 $ 16.00 55% $ 3.50 $ 18.00 79% $ 4.00 $ 20.00 97% *Henry Hub JV Terms (1), (2) EUR (Bcfe) 4.6 Gross Well Cost ($MM) 4.0 IP Rate (Mmcfe/d) 7.1 % Gas / Liquids 51% / 49% IRR (%) 79% Sensitivity to Gas Prices 50% 75% 100%
Slide 21: Liquidity Metrics and Leverage
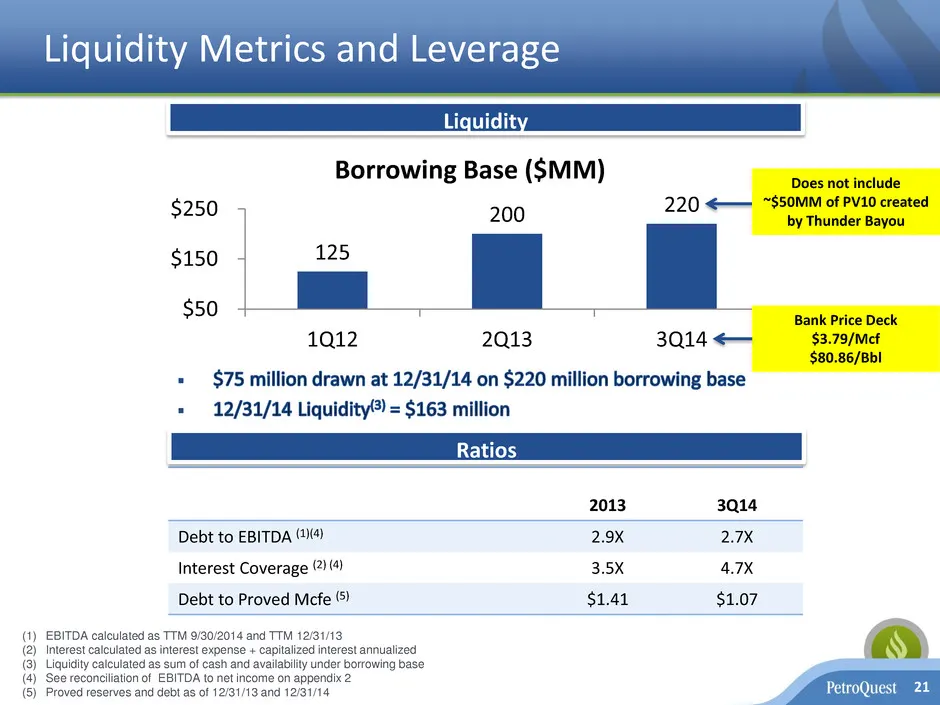
Liquidity Metrics and Leverage 21 2013 3Q14 Debt to EBITDA (1)(4) 2.9X 2.7X Interest Coverage (2) (4) 3.5X 4.7X Debt to Proved Mcfe (5) $1.41 $1.07 (1) EBITDA calculated as TTM 9/30/2014 and TTM 12/31/13 (2) Interest calculated as interest expense + capitalized interest annualized (3) Liquidity calc
Slide 22: Strong Track Record of Funding Drilling with Cash Flow
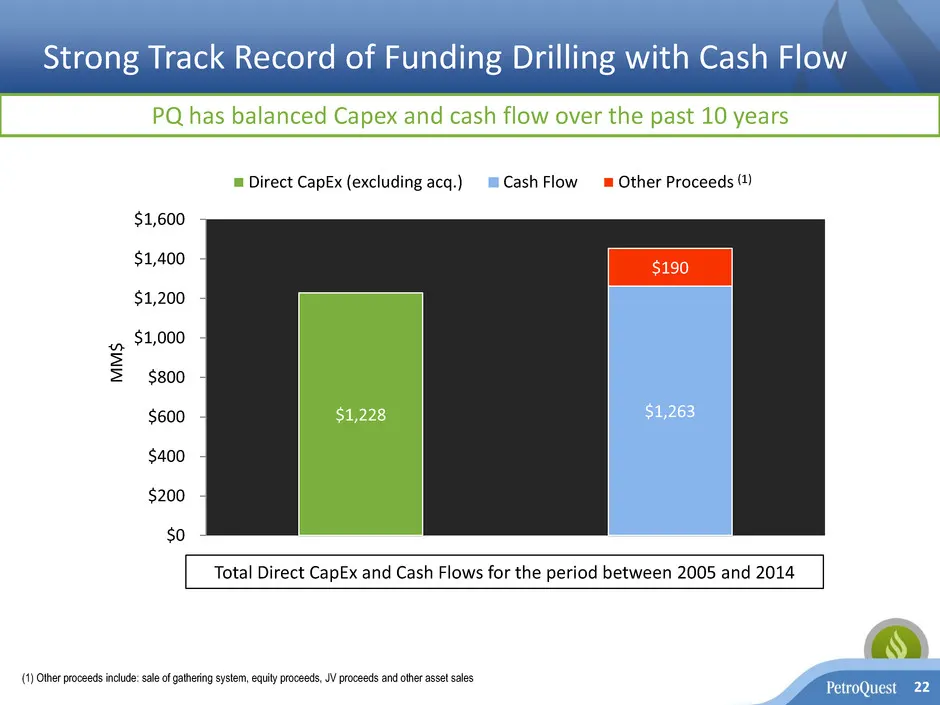
Strong Track Record of Funding Drilling with Cash Flow 22 MM $ Total Direct CapEx and Cash Flows for the period between 2005 and 2014 PQ has balanced Capex and cash flow over the past 10 years (1) (1) Other proceeds include: sale of gathering system, equity proceeds, JV proceeds and other asset sale
Slide 23: Operating & Financial Metrics
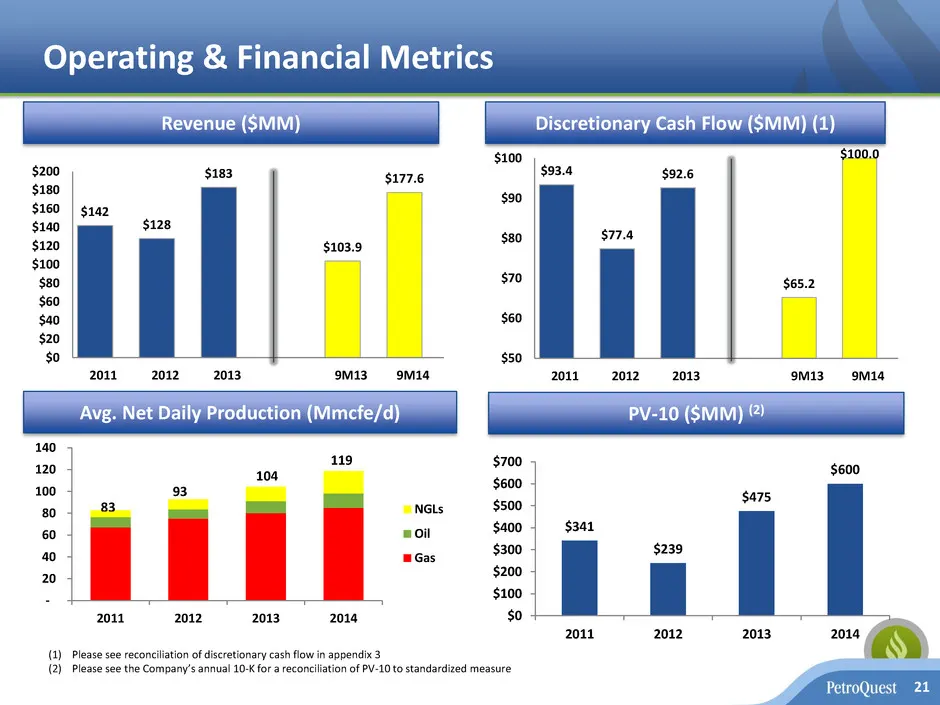
Operating & Financial Metrics $142 $128 $183 $103.9 $177.6 $0 $20 $40 $60 $80 $100 $120 $140 $160 $180 $200 2011 2012 2013 9M13 9M14 21 Revenue ($MM) Discretionary Cash Flow ($MM) (1) $93.4 $77.4 $92.6 $65.2 $100.0 $50 $60 $70 $80 $90 $100 2011 2012 2013 9M13 9M14 Avg. Net Daily Production (Mmcfe/d)
Slide 24: Summary
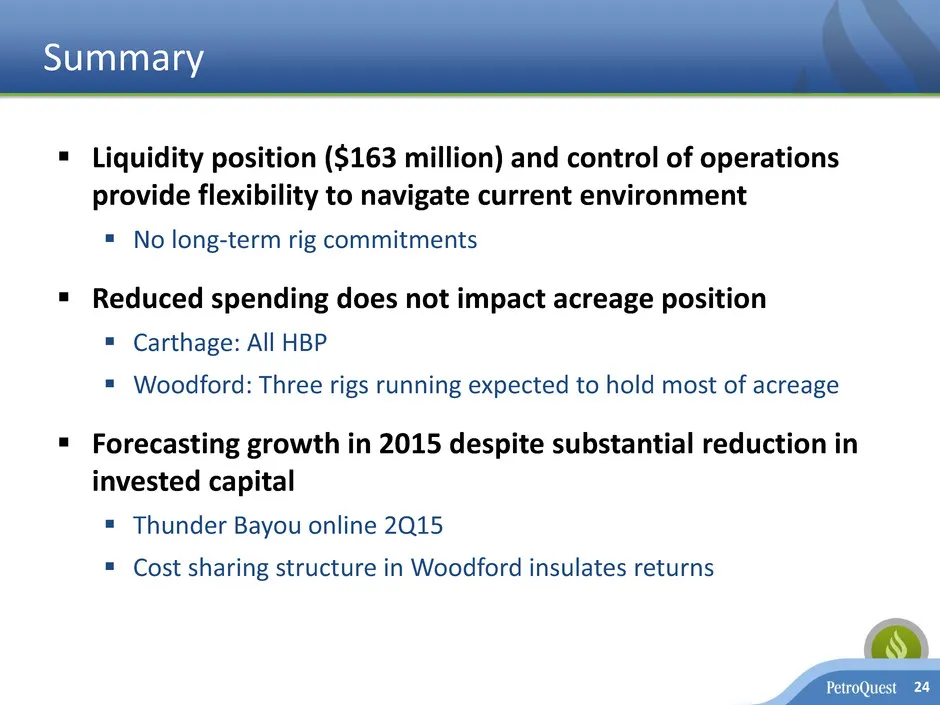
Summary Liquidity position ($163 million) and control of operations provide flexibility to navigate current environment No long-term rig commitments Reduced spending does not impact acreage position Carthage: All HBP Woodford: Three rigs running expected to hold most of acreage Forecasti
Slide 25: Appendix
25 Appendix
Slide 26: Appendix - Hedging Positions
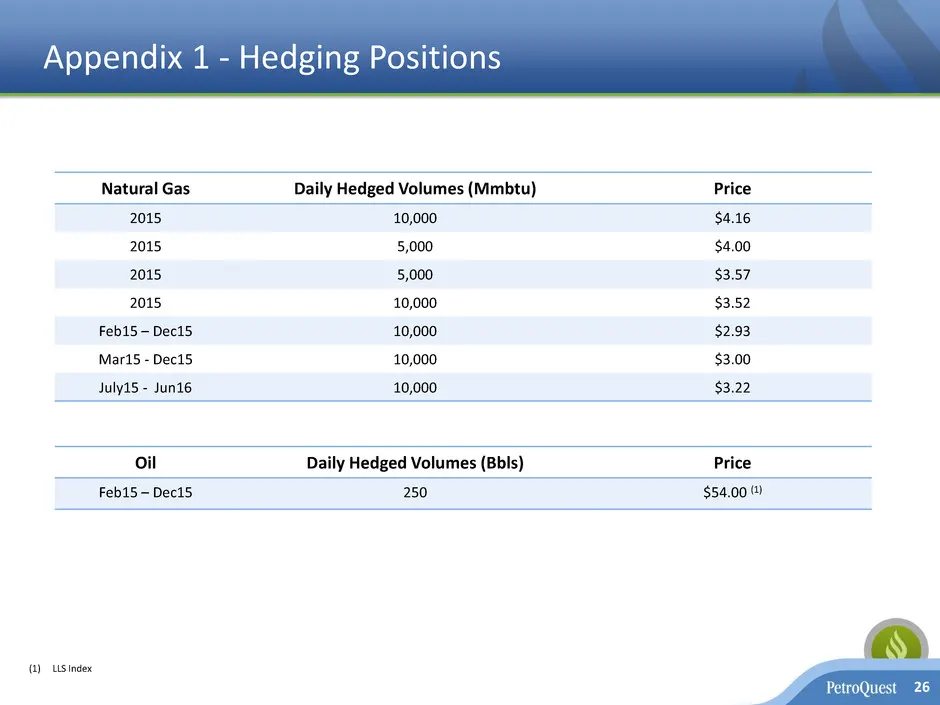
Appendix 1 - Hedging Positions 26 Natural Gas Daily Hedged Volumes (Mmbtu) Price 2015 10,000 $4.16 2015 5,000 $4.00 2015 5,000 $3.57 2015 10,000 $3.52 Feb15 – Dec15 10,000 $2.93 Mar15 - Dec15 10,000 $3.00 July15 - Jun16 10,000 $3.22 Oil Daily Hedged Volumes (Bbls) Price Feb15 – Dec15 250 $54.00 (1)
Slide 27: Appendix - Adjusted EBITDA
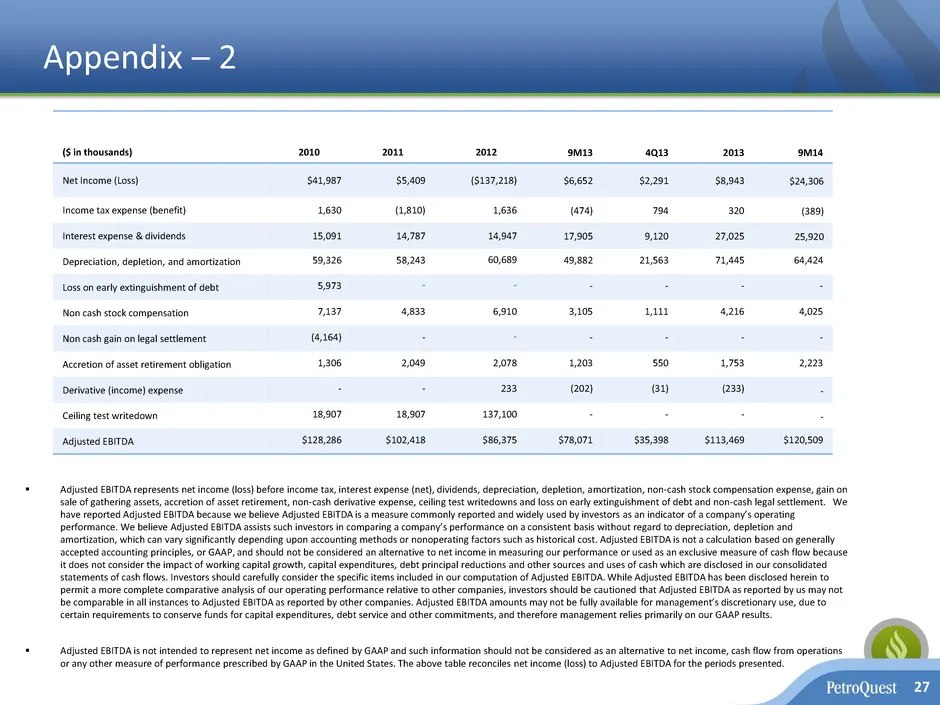
Appendix – 2 Adjusted EBITDA represents net income (loss) before income tax, interest expense (net), dividends, depreciation, depletion, amortization, non-cash stock compensation expense, gain on sale of gathering assets, accretion of asset retirement, non-cash derivative expense, ceiling test wri
Slide 28: Appendix - Discretionary Cash Flow Reconciliation
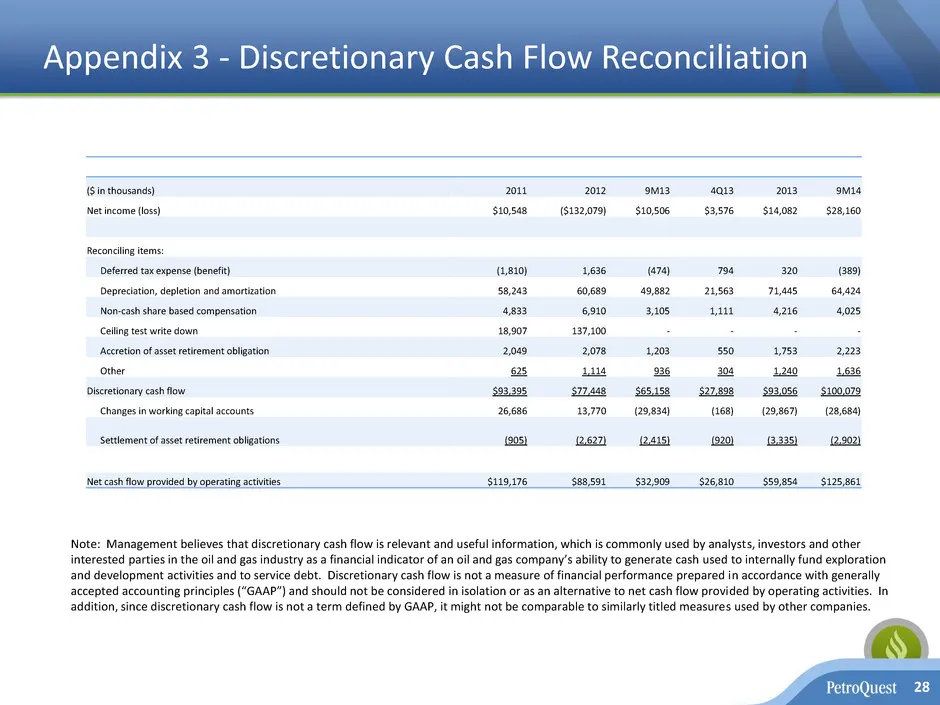
Appendix 3 - Discretionary Cash Flow Reconciliation ($ in thousands) 2011 2012 9M13 4Q13 2013 9M14 Net income (loss) $10,548 ($132,079) $10,506 $3,576 $14,082 $28,160 Reconciling items: Deferred tax expense (benefit) (1,810) 1,636 (474) 794 320 (389) Depreciation, depletion and amortization 58,243 6
Slide 29: Appendix - Woodford Dry Gas – Hoss Field Joint Venture
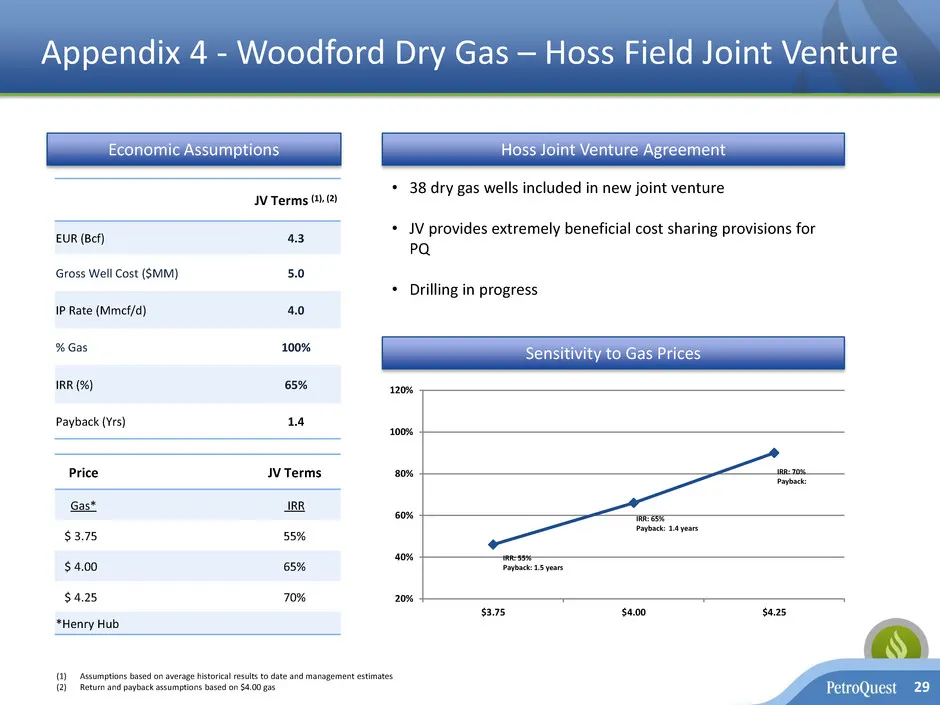
Appendix 4 - Woodford Dry Gas – Hoss Field Joint Venture 29 Price JV Terms Gas* IRR $ 3.75 55% $ 4.00 65% $ 4.25 70% *Henry Hub JV Terms (1), (2) EUR (Bcf) 4.3 Gross Well Cost ($MM) 5.0 IP Rate (Mmcf/d) 4.0 % Gas 100% IRR (%) 65% Payback (Yrs) 1.4 • 38 dry gas wells included in new joint venture • J
Slide 30: Appendix - La Cantera Development
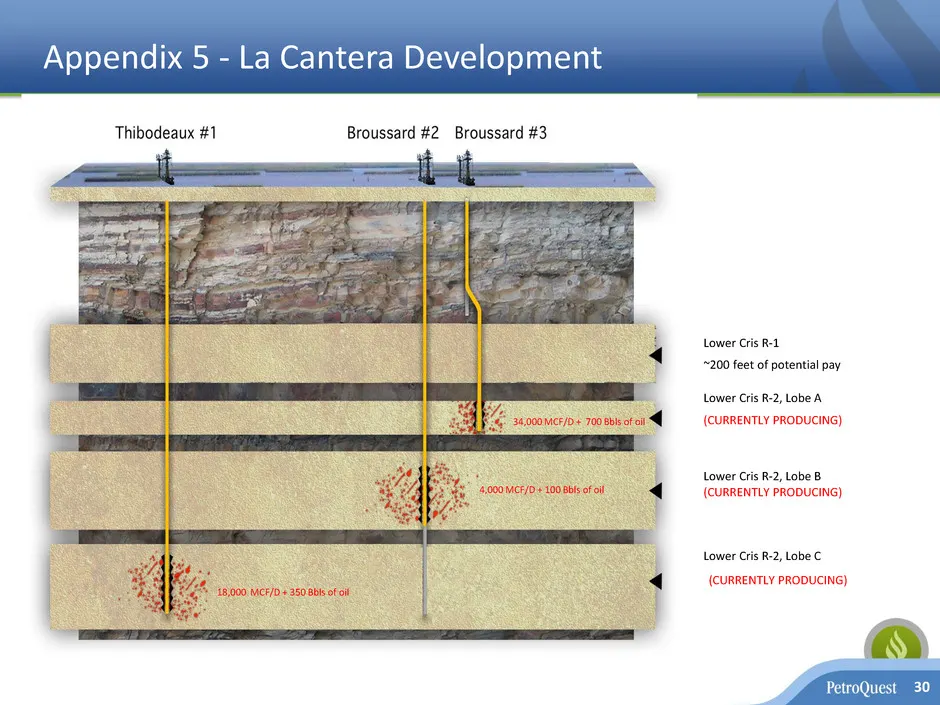
Appendix 5 - La Cantera Development 30 15,000 MCF/D + 250 Bbls of oil Lower Cris R-1 Lower Cris R-2, Lobe A Lower Cris R-2, Lobe B Lower Cris R-2, Lobe C (CURRENTLY PRODUCING) (CURRENTLY PRODUCING) ~200 feet of potential pay (CURRENTLY PRODUCING) 18,000 MCF/D + 350 Bbls of oil 4,000 MCF/D + 100 Bbls
Slide 31: Appendix - Panola County Cotton Valley – Room to Run
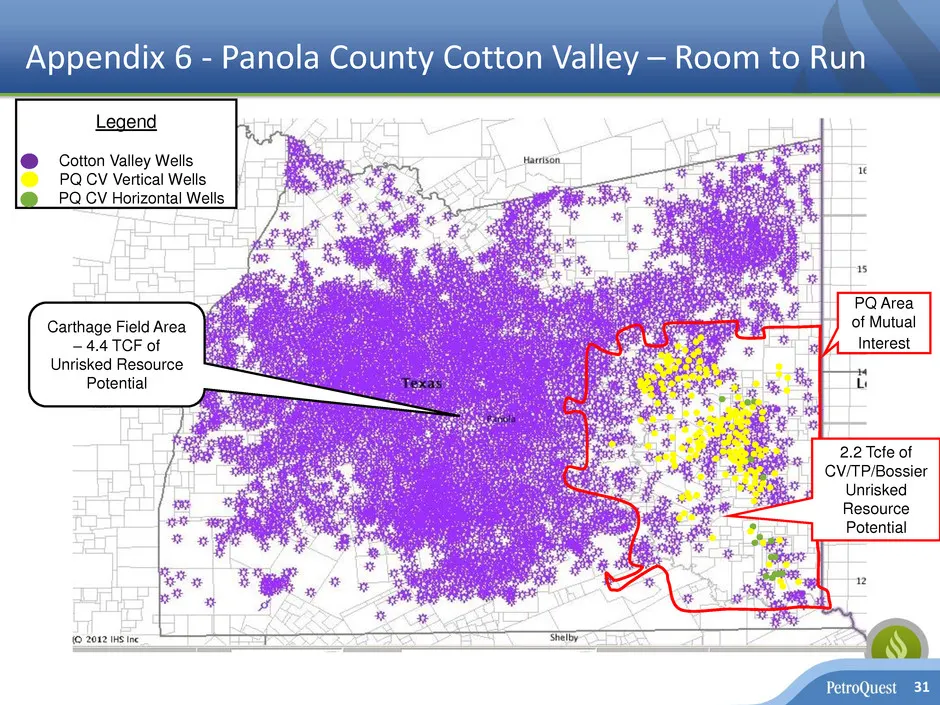
Appendix 6 - Panola County Cotton Valley – Room to Run 31 Legend Cotton Valley Wells PQ CV Vertical Wells PQ CV Horizontal Wells PQ Area of Mutual Interest Carthage Field Area – 4.4 TCF of Unrisked Resource Potential 2.2 Tcfe of CV/TP/Bossier Unrisked Resource Potential
Slide 32: Appendix - PQ Operated Gulf Coast Drilling Summary
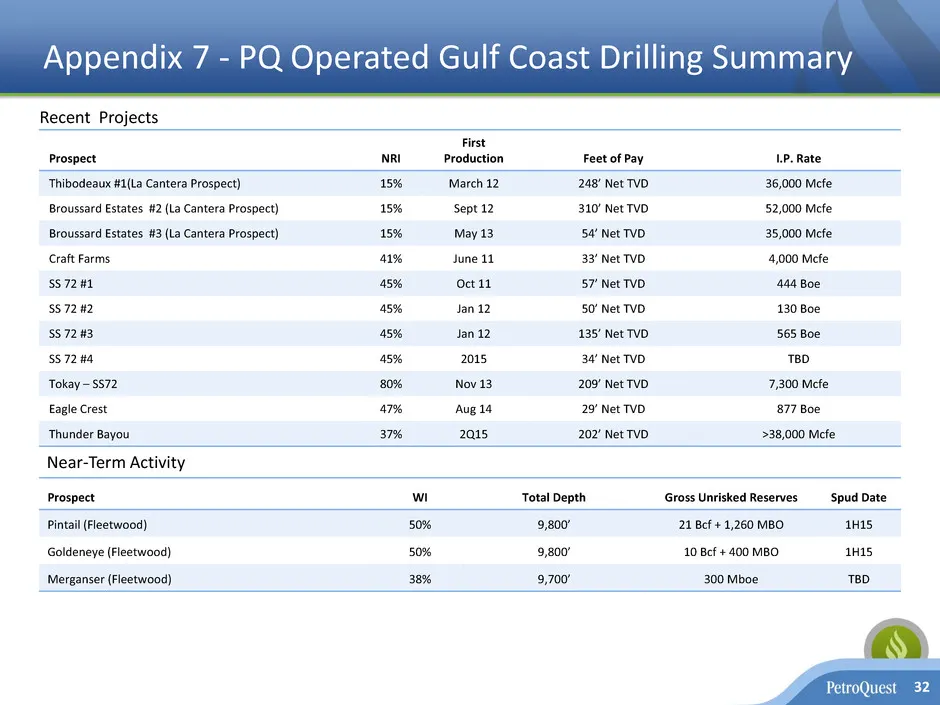
Appendix 7 - PQ Operated Gulf Coast Drilling Summary Prospect WI Total Depth Gross Unrisked Reserves Spud Date Pintail (Fleetwood) 50% 9,800’ 21 Bcf + 1,260 MBO 1H15 Goldeneye (Fleetwood) 50% 9,800’ 10 Bcf + 400 MBO 1H15 Merganser (Fleetwood) 38% 9,700’ 300 Mboe TBD 32 Prospect NRI First Production
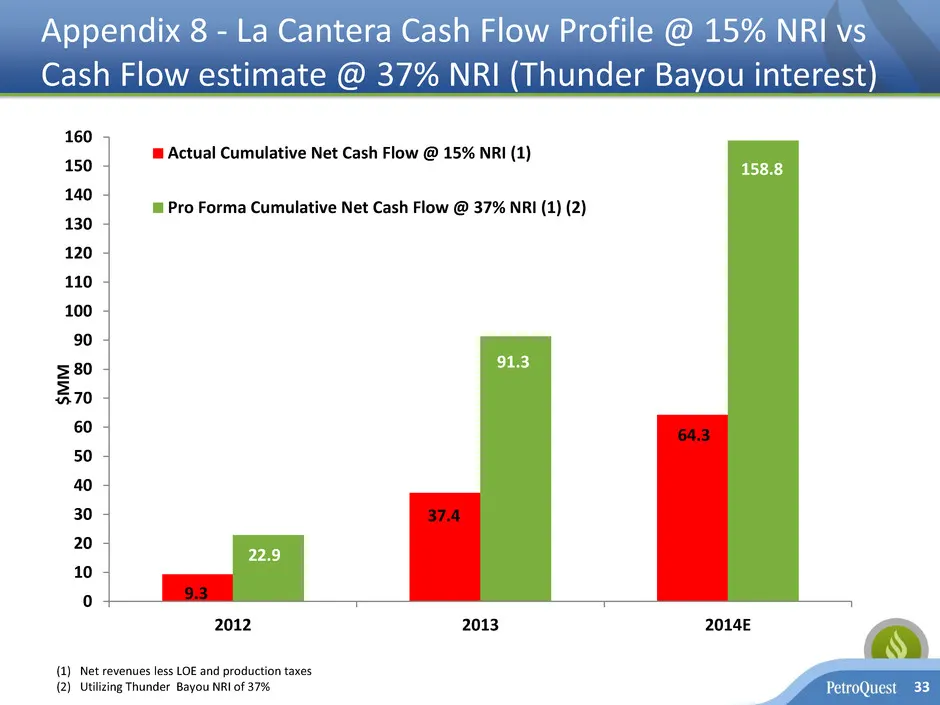
Slide 33: Appendix - La Cantera Cash Flow Profile
Appendix 8 - La Cantera Cash Flow Profile @ 15% NRI vs Cash Flow estimate @ 37% NRI (Thunder Bayou interest) 33 9.3 37.4 64.3 22.9 91.3 158.8 0 10 20 30 40 50 60 70 80 90 100 110 120 130 140 150 160 2012 2013 2014E $ M M Actual Cumulative Net Cash Flow @ 15% NRI (1) Pro Forma Cumulative Net Cash Flo
Slide 34: Company Information
Company Information 34 400 East Kaliste Saloom Road, Suite 6000 Lafayette, Louisiana 70508 Phone: (337) 232-7028 Fax: (337) 232-0044 www.petroquest.com This presentation contains "forward-looking statements" within the meaning of Section 27A of the Securities Act of 1933, as amended, and Section 21E
Source: SEC EDGAR · 8-K filed Feb 18, 2015
More decks from PetroQuest Energy Inc
 Corporate Update (June 2019)15 slides · Jun 19, 2019
 Investor Presentation (November 2018)16 slides · Nov 7, 2018
 Investor Presentation (July 2018)29 slides · Jul 10, 2018
 Investor Presentation (December 2017)6 slides · Dec 20, 2017
 Investor Presentation (January 2017)28 slides · Jan 9, 2017
 Investor Presentation (April 2016)29 slides · Apr 5, 2016