PetroQuest Energy — Investor Presentation (July 2018)
29 slides from PetroQuest Energy's investor presentation, Jul 10, 2018
Slide 1: PetroQuest Energy, Inc.
Wrerroorcs: Energy, Inc.
Slide 2: Forward-Looking Statements
Forward-Looking Statements This presentation contains "forward-looking statements" within the meaning of Section 27A of the Securities Act of 1933, as amended, and Section 21E of the Securities Exchange Act of 1934, as amended. All statements other than statements of historical fact included in this
Slide 3: 2018 Overview
2018 Overview ▪ Acquired low-cost position in the Louisiana Austin Chalk providing opportunity for oil growth and acreage value appreciation ▪ Sold GOM assets in early 2018 to remove regulatory risk and substantial P&A burden ▪ Production growth takes a step back with divestiture ▪ Cash interest on
Slide 4: Production Profile
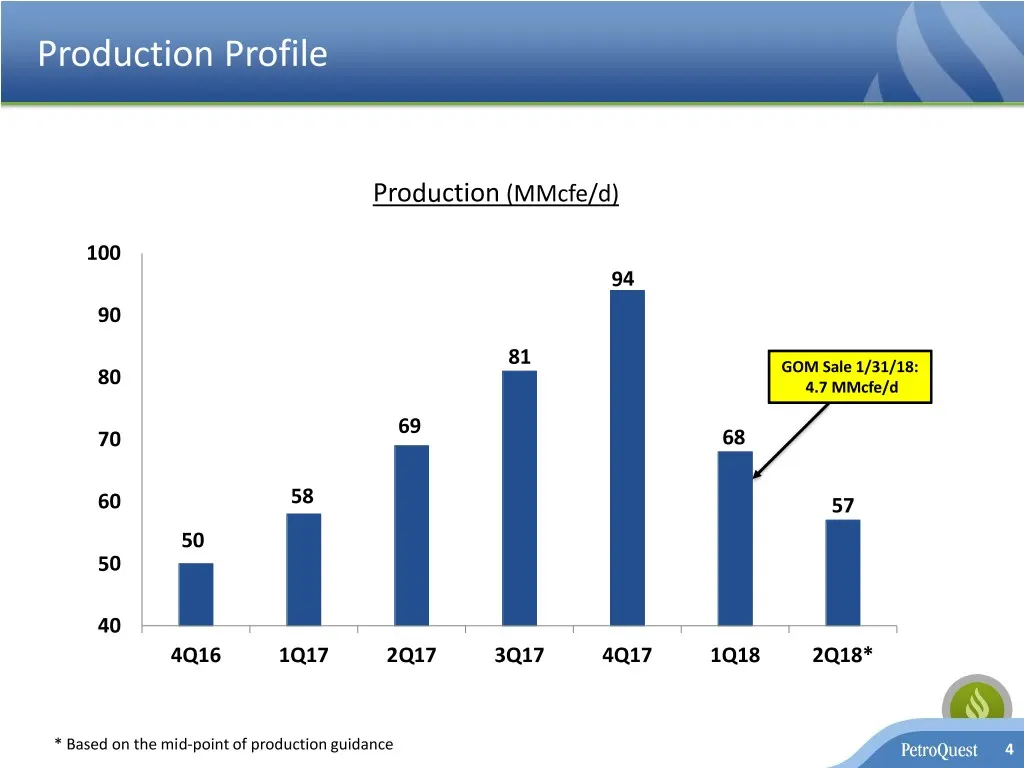
Production Profile Production (MMcfe/d) 100 94 90 81 GOM Sale 1/31/18: 80 4.7 MMcfe/d 69 70 68 60 58 57 50 50 40 4Q16 1Q17 2Q17 3Q17 4Q17 1Q18 2Q18* * Based on the mid-point of production guidance 4
Slide 5: Our Properties
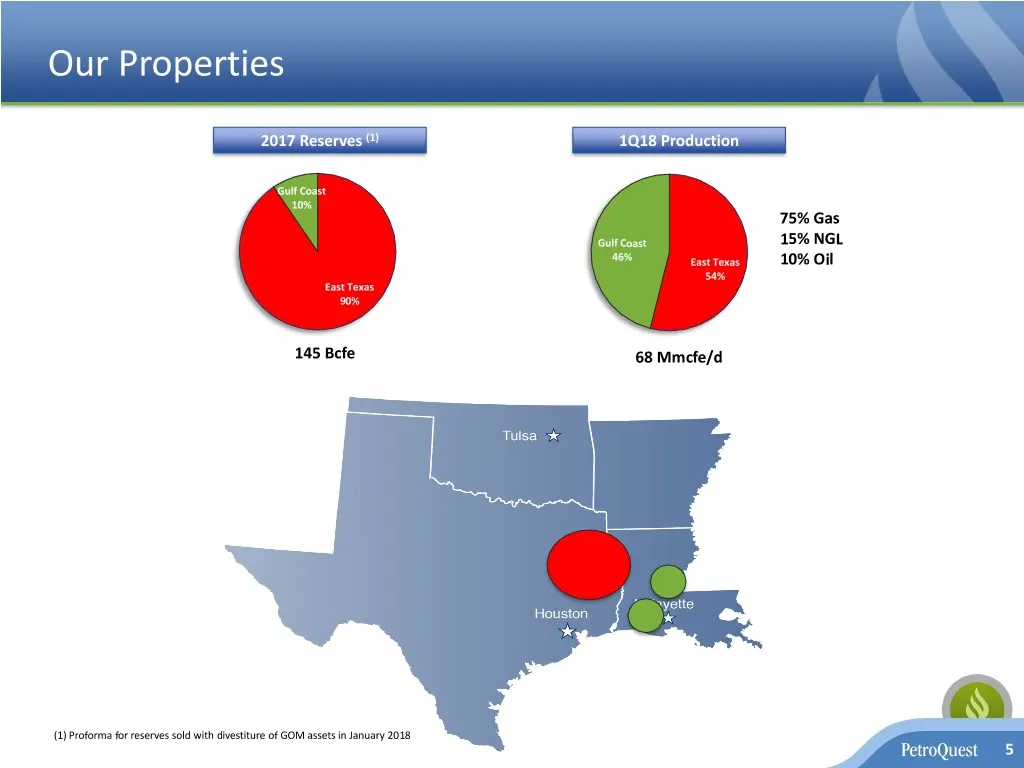
Our Properties 2017 Reserves (1) 1Q18 Production Gulf Coast 10% 75% Gas Gulf Coast 15% NGL 46% East Texas 10% Oil 54% East Texas 90% 145 Bcfe 68 Mmcfe/d (1) Proforma for reserves sold with divestiture of GOM assets in January 2018 5
Slide 6: Louisiana Austin Chalk Entry Rationale for PQUE
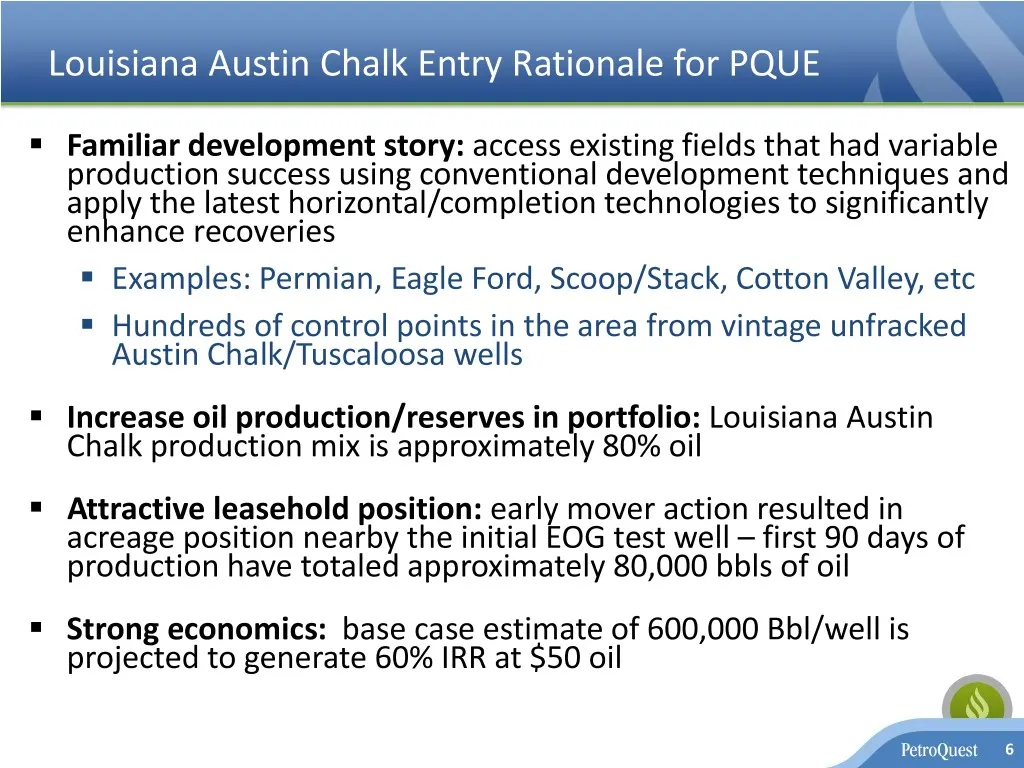
Louisiana Austin Chalk Entry Rationale for PQUE ▪ Familiar development story: access existing fields that had variable production success using conventional development techniques and apply the latest horizontal/completion technologies to significantly enhance recoveries ▪ Examples: Permian, Eagle F
Slide 7: Austin Chalk Trend Regional Overview
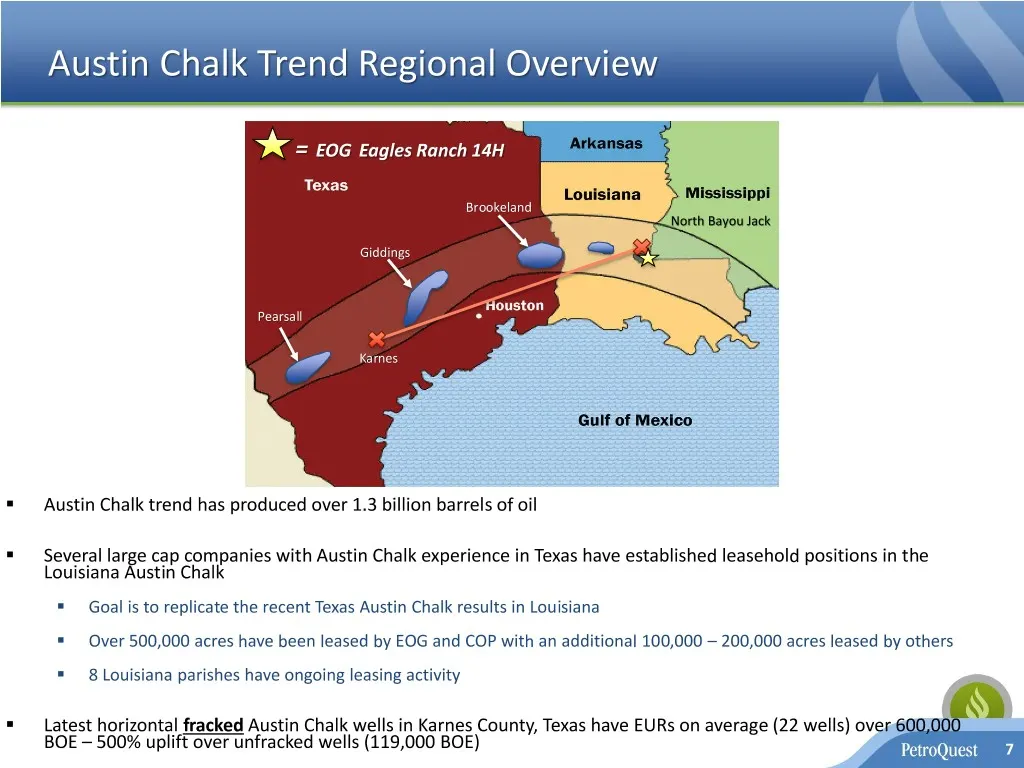
Austin Chalk Trend Regional Overview = EOG Eagles Ranch 14H Brookeland North Bayou Jack Giddings Master’s Pearsall Creek Karnes ▪ Austin Chalk trend has produced over 1.3 billion barrels of oil ▪ Several large cap companies with Austin Chalk experience in Texas have established leasehold positions i
Slide 8: Chalk Comparison: Texas – Louisiana
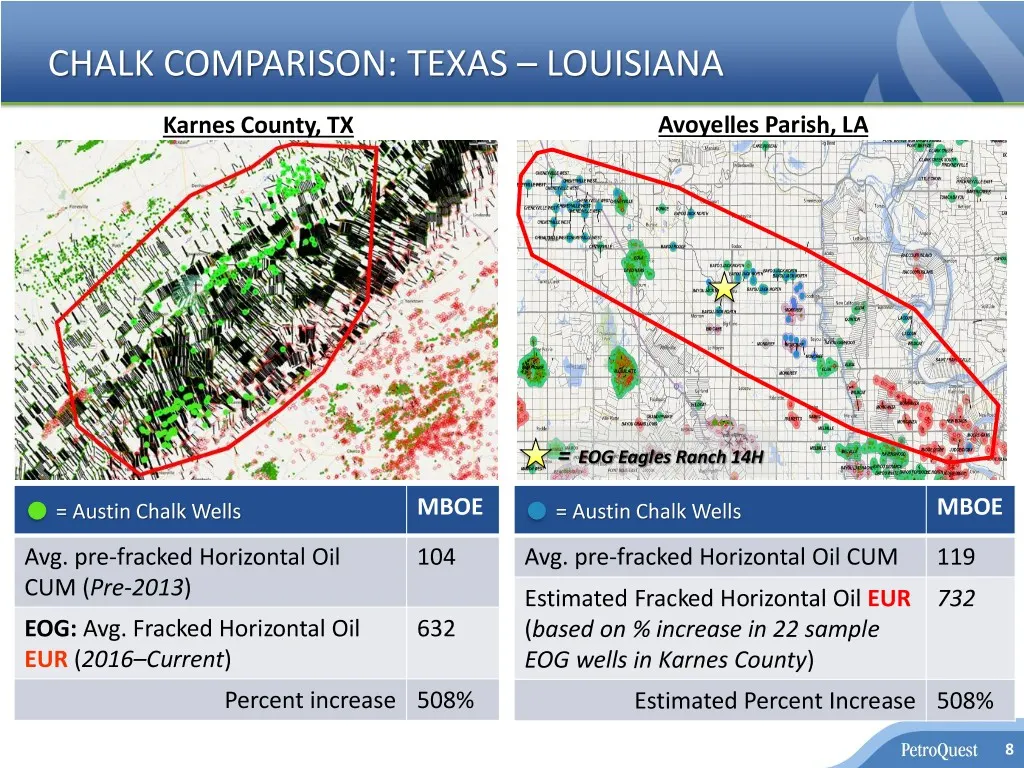
CHALK COMPARISON: TEXAS – LOUISIANA Karnes County, TX Avoyelles Parish, LA = EOG Eagles Ranch 14H = Austin Chalk Wells MBOE = Austin Chalk Wells MBOE Avg. pre-fracked Horizontal Oil 104 Avg. pre-fracked Horizontal Oil CUM 119 CUM (Pre-2013) Estimated Fracked Horizontal Oil EUR 732 EOG: Avg. Fracked
Slide 9: Louisiana Acreage Map (>600,000 acres)
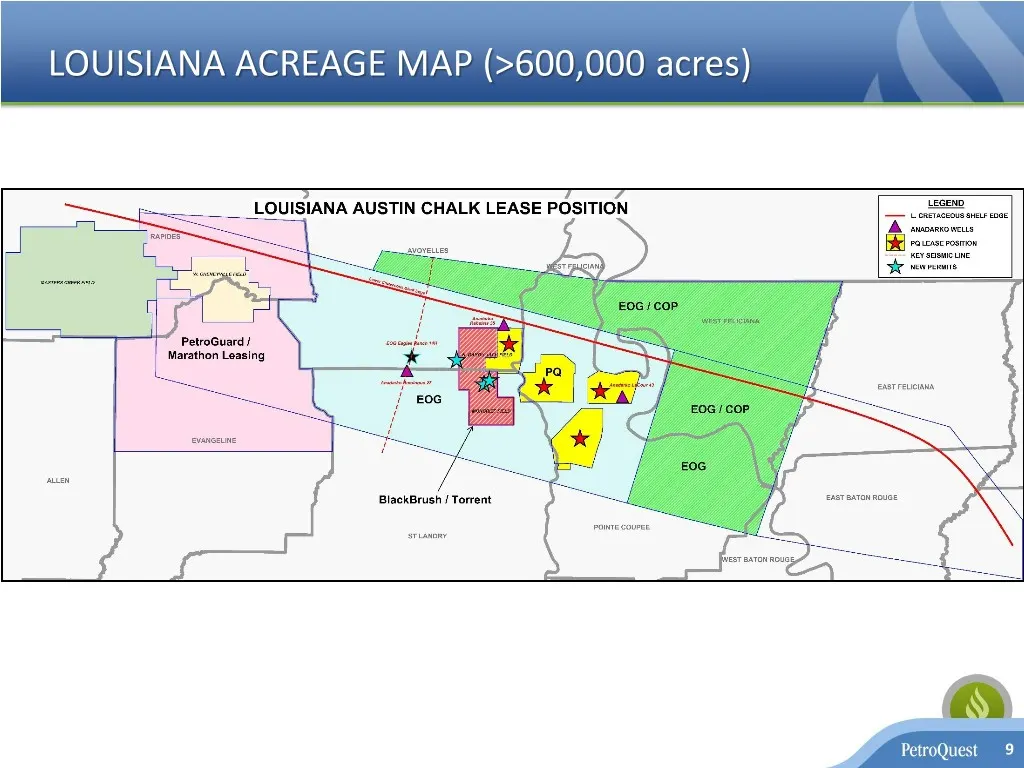
LOUISIANA ACREAGE MAP (>600,000 acres) 9
Slide 10: Eagles Ranch 14H: Directional Survey
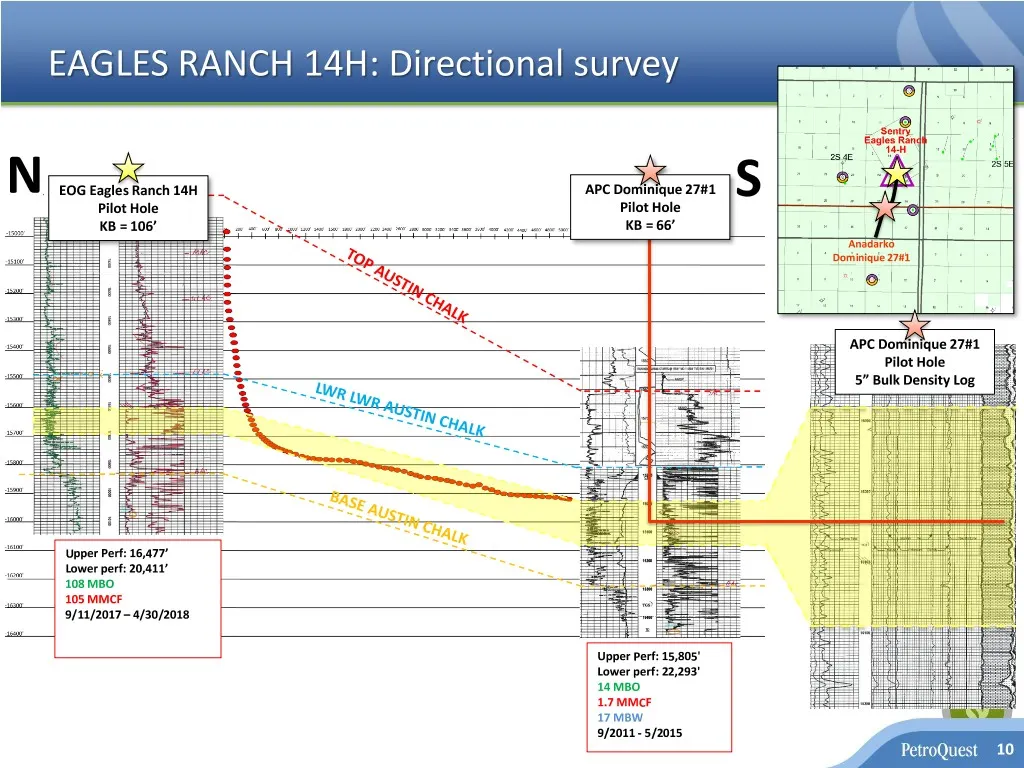
EAGLES RANCH 14H: Directional survey N EOG Eagles Ranch 14H APC Dominique 27#1 S Pilot Hole Pilot Hole KB = 106’ KB = 66’ Anadarko Dominique 27#1 APC Dominique 27#1 Pilot Hole 5” Bulk Density Log Upper Perf: 16,477’ Lower perf: 20,411’ 108 MBO 105 MMCF 9/11/2017 – 4/30/2018 Upper Perf: 15,805' Lower
Slide 11: Hydraulic Fracture Uplift
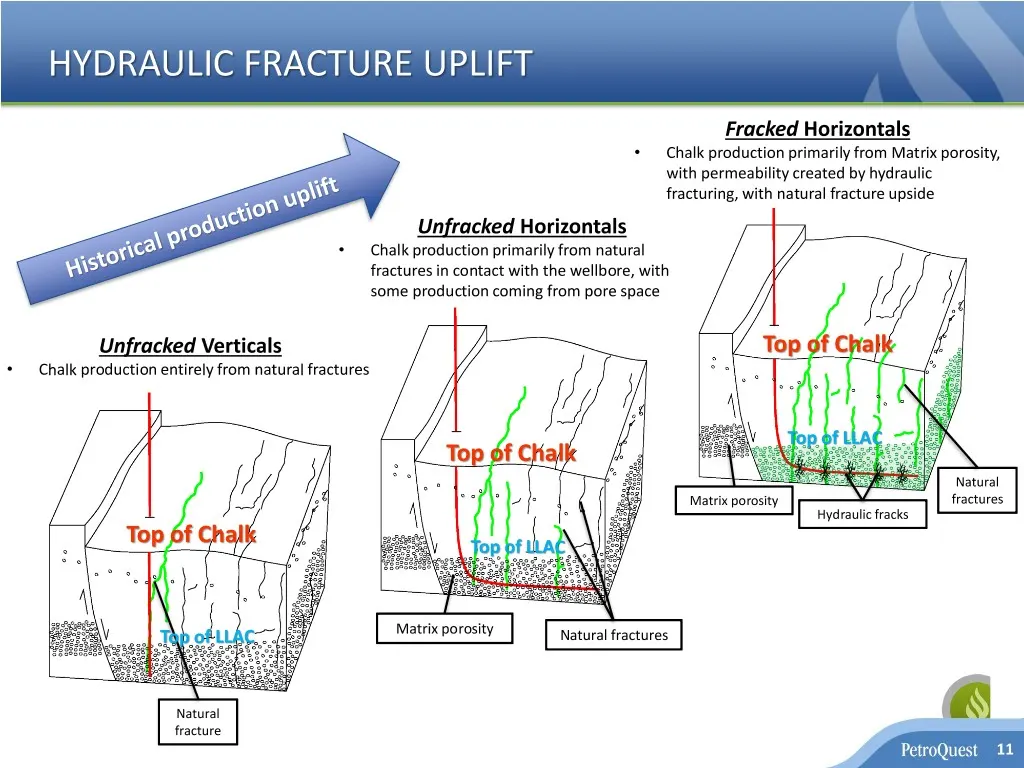
HYDRAULIC FRACTURE UPLIFT Fracked Horizontals • Chalk production primarily from Matrix porosity, with permeability created by hydraulic fracturing, with natural fracture upside Unfracked Horizontals • Chalk production primarily from natural fractures in contact with the wellbore, with some productio
Slide 12: Baird Energy Report - Top Basins
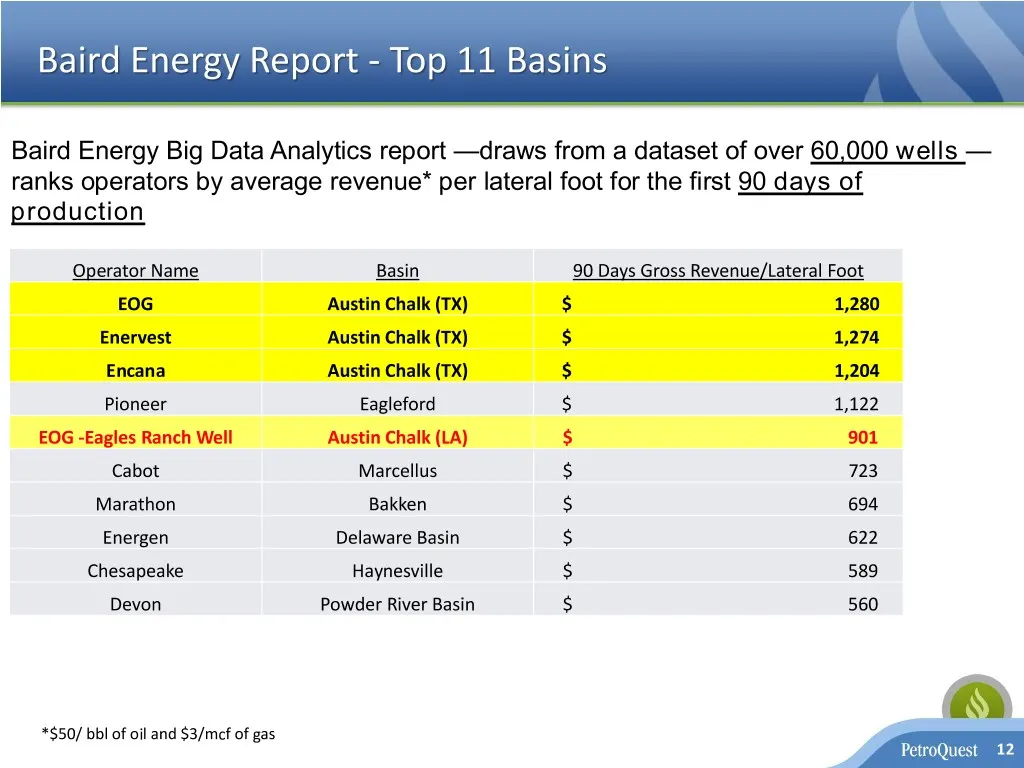
Baird Energy Report - Top 11 Basins Baird Energy Big Data Analytics report —draws from a dataset of over 60,000 wells — ranks operators by average revenue* per lateral foot for the first 90 days of production Operator Name Basin 90 Days Gross Revenue/Lateral Foot EOG Austin Chalk (TX) $ 1,280 Enerve
Slide 13: Louisiana Austin Chalk - Economic Sensitivities
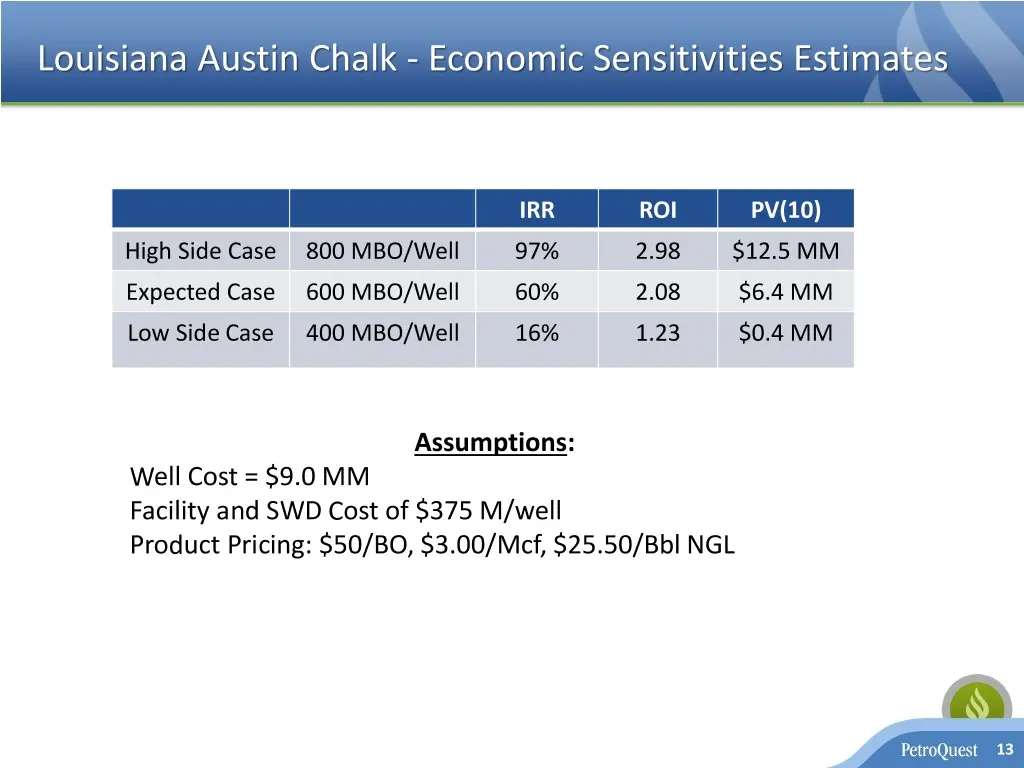
Louisiana Austin Chalk - Economic Sensitivities Estimates IRR ROI PV(10) High Side Case 800 MBO/Well 97% 2.98 $12.5 MM Expected Case 600 MBO/Well 60% 2.08 $6.4 MM Low Side Case 400 MBO/Well 16% 1.23 $0.4 MM Assumptions: Well Cost = $9.0 MM Facility and SWD Cost of $375 M/well Product Pricing: $50/BO
Slide 14: Industry Activity - Cotton Valley Trend
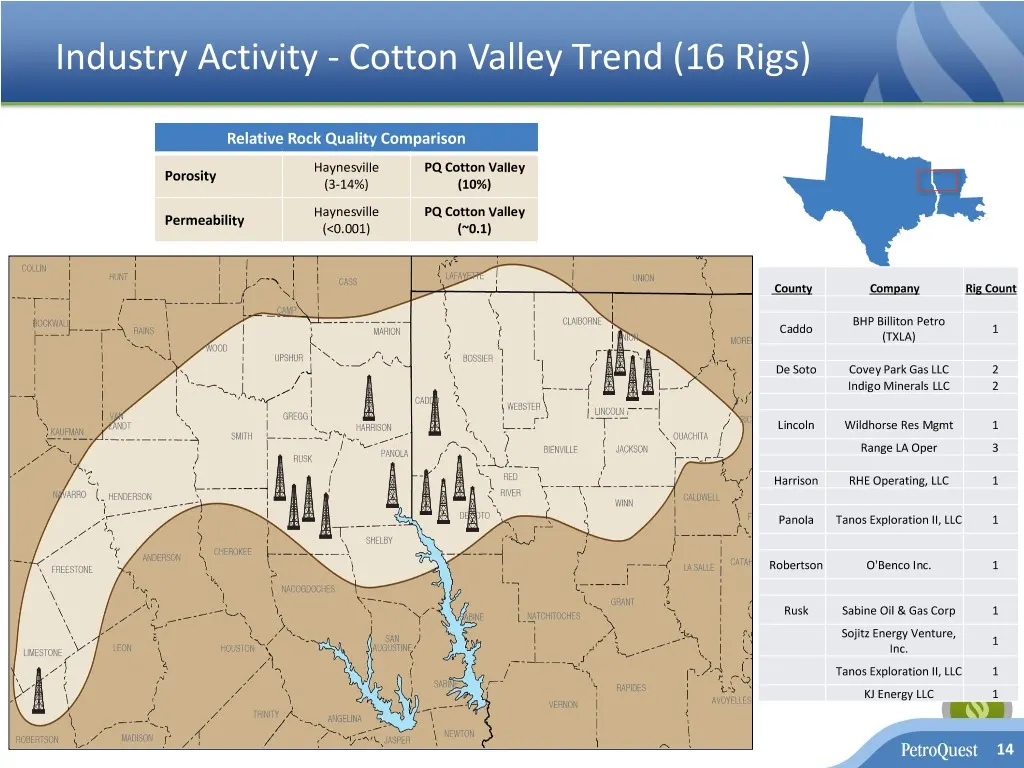
Industry Activity - Cotton Valley Trend (16 Rigs) Relative Rock Quality Comparison Haynesville PQ Cotton Valley Porosity (3-14%) (10%) Haynesville PQ Cotton Valley Permeability (<0.001) (~0.1) County Company Rig Count BHP Billiton Petro Caddo 1 (TXLA) De Soto Covey Park Gas LLC 2 Indigo Minerals LLC
Slide 15: Advantages of PQUE's Cotton Valley
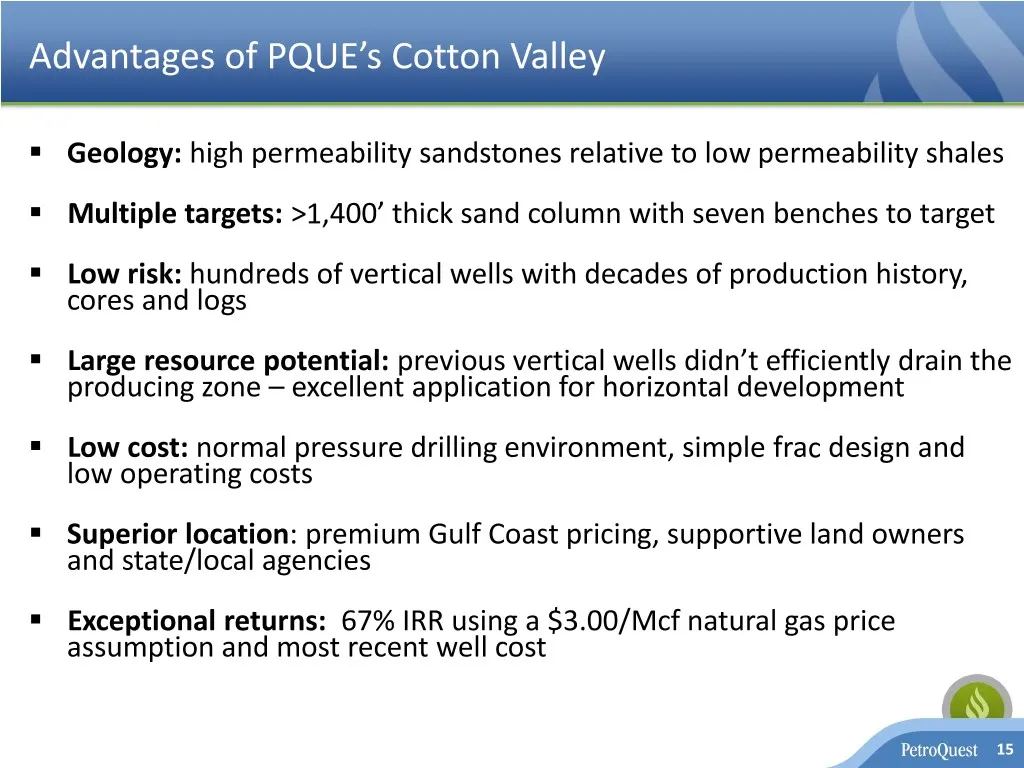
Advantages of PQUE’s Cotton Valley ▪ Geology: high permeability sandstones relative to low permeability shales ▪ Multiple targets: >1,400’ thick sand column with seven benches to target ▪ Low risk: hundreds of vertical wells with decades of production history, cores and logs ▪ Large resource potenti
Slide 16: Cotton Valley Horizontal – Production Up with Costs Down
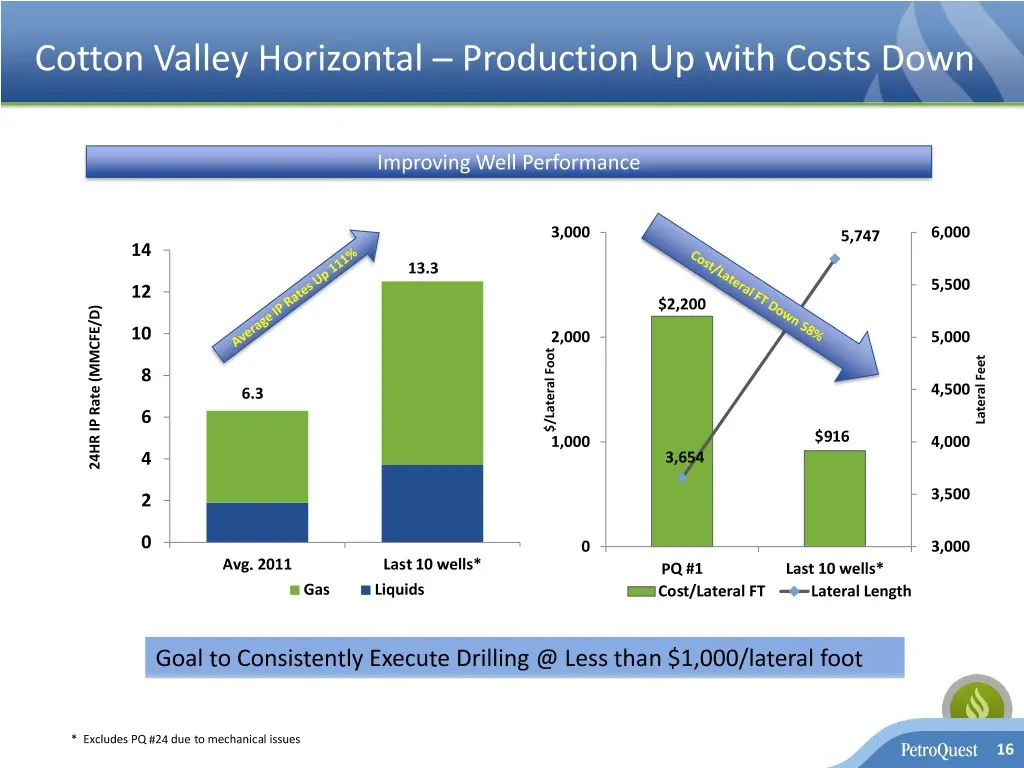
Cotton Valley Horizontal – Production Up with Costs Down Improving Well Performance 3,000 5,747 6,000 14 13.3 12 5,500 $2,200 10 2,000 5,000 8 6.3 4,500 6 LateralFeet $/LateralFoot 1,000 $916 4,000 4 3,654 24HR IP Rate (MMCFE/D) 24HRRate IP 2 3,500 0 0 3,000 Avg. 2011 Last 10 wells* PQ #1 Last 10 we
Slide 17: Cotton Valley Horizontal Economics
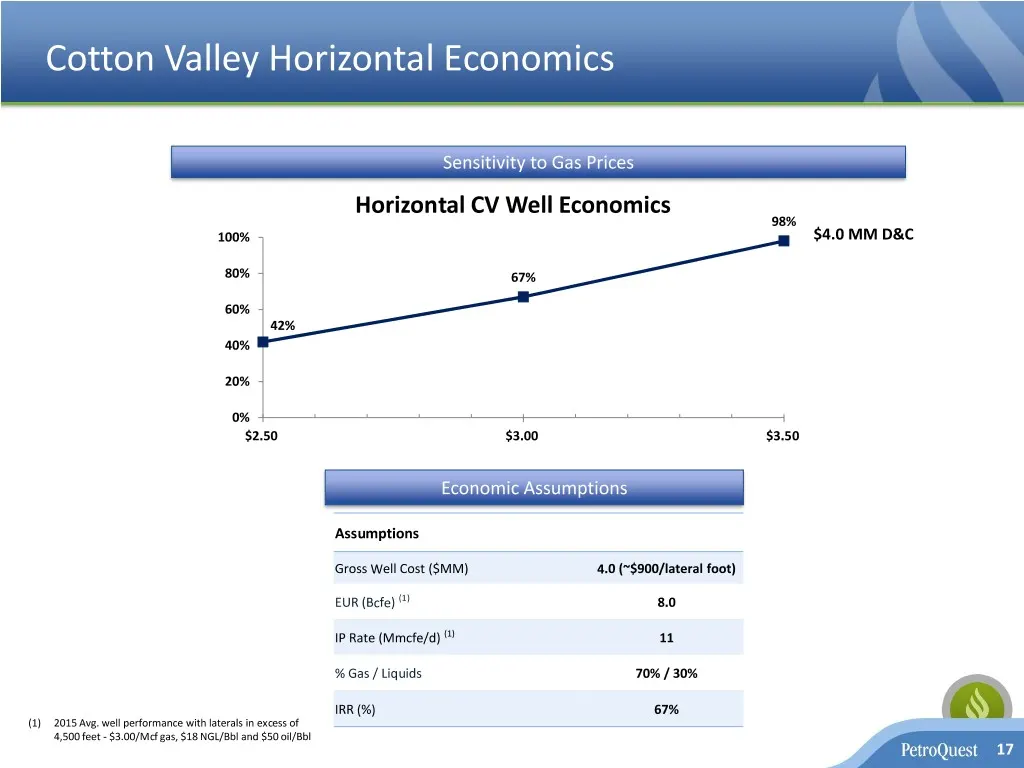
Cotton Valley Horizontal Economics Sensitivity to Gas Prices Horizontal CV Well Economics 98% 100% $4.0 MM D&C 80% 67% 60% 42% 40% 20% 0% $2.50 $3.00 $3.50 Economic Assumptions Assumptions Gross Well Cost ($MM) 4.0 (~$900/lateral foot) EUR (Bcfe) (1) 8.0 IP Rate (Mmcfe/d) (1) 11 % Gas / Liquids 70%
Slide 18: SE Carthage Multi-Bench Cotton Valley Opportunities
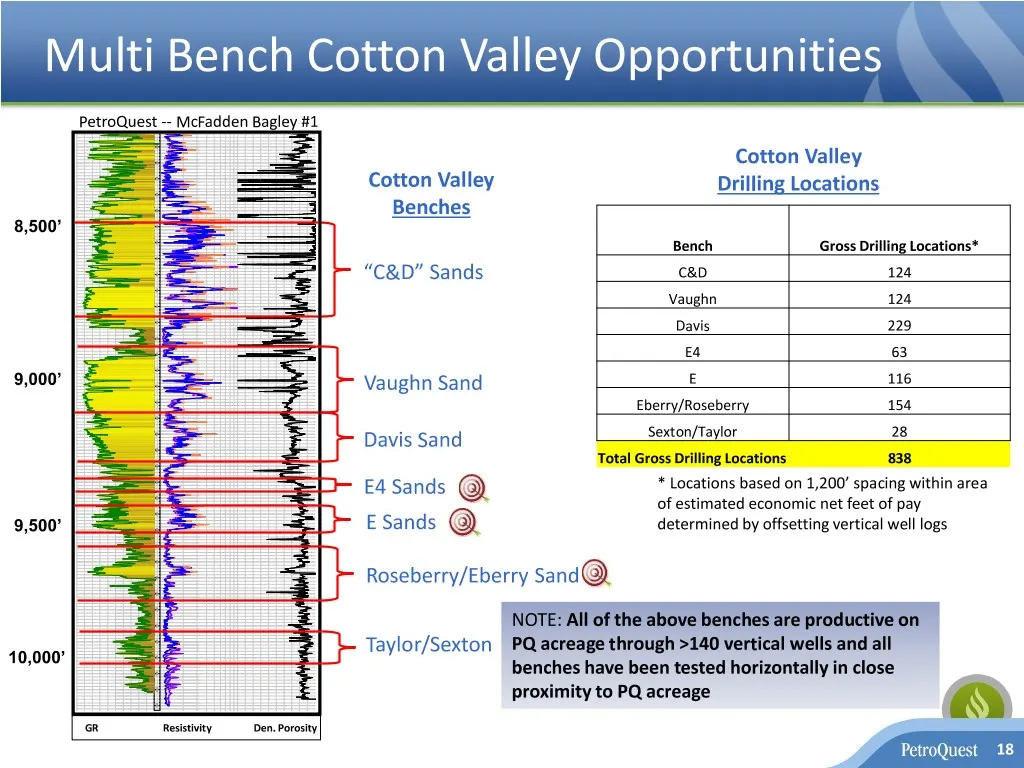
SE CARTHAGE 8200 8250 8250 8250 8300 8300 8300 8350 Multi 8350 Bench Cotton Valley Opportunities8350 8400 8400 8400 8450 8450 8450 8500 PetroQuest 8500 -- McFadden Bagley #1 8500 8550 8550 8550 8600 8600 8600 8650 8650 8650Cotton Valley 8700 8700 Cotton Valley Drilling8700 Locations 8750 8750 8750 8
Slide 19: PQ Cotton Valley - Future Locations
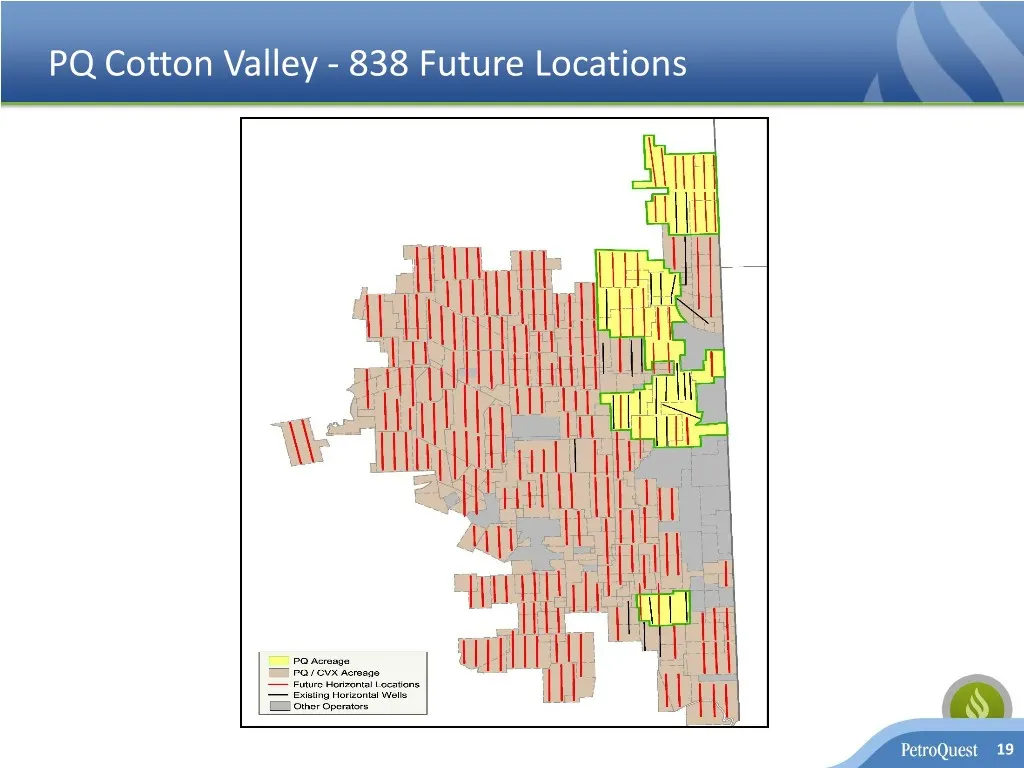
PQ Cotton Valley - 838 Future Locations 19
Slide 20: Thunder Bayou
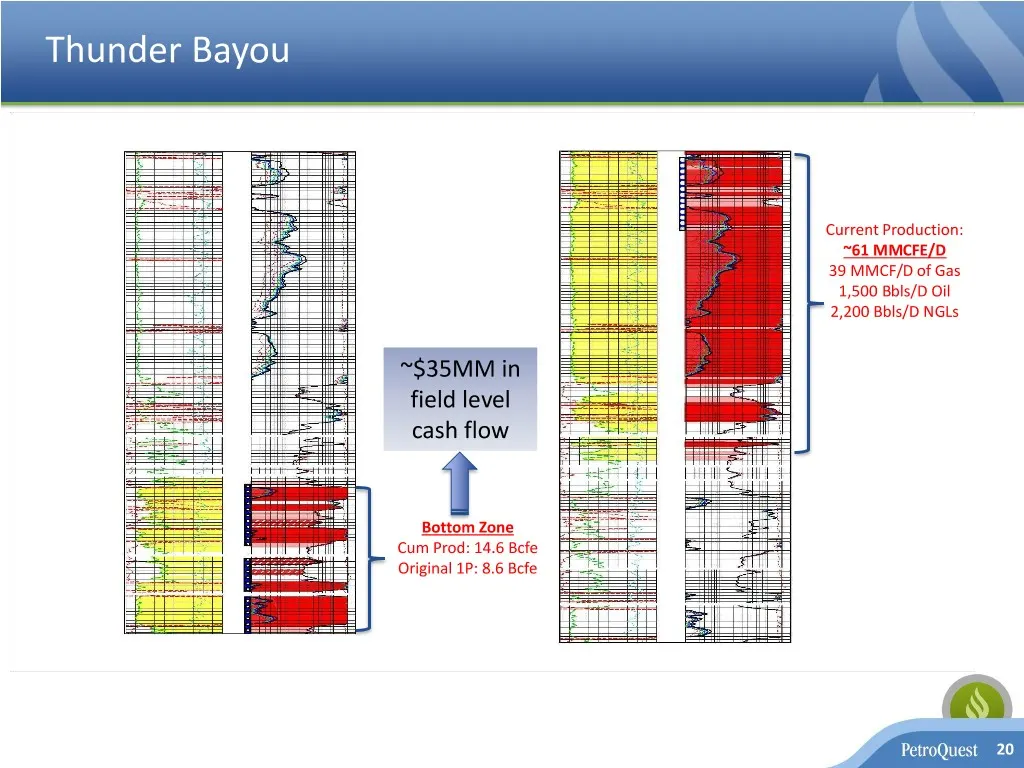
Thunder Bayou Current Production: ~61 MMCFE/D 39 MMCF/D of Gas 1,500 Bbls/D Oil 2,200 Bbls/D NGLs ~$35MM in field level cash flow Bottom Zone Cum Prod: 14.6 Bcfe Original 1P: 8.6 Bcfe 20
Slide 21: Debt Maturity Profile
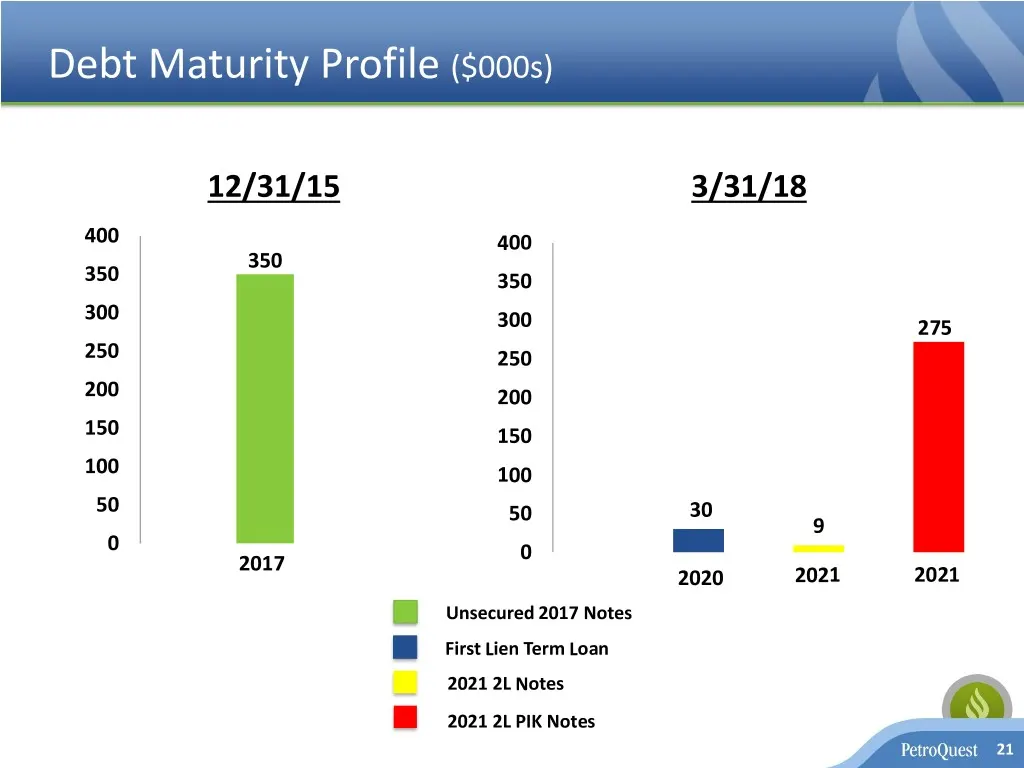
Debt Maturity Profile ($000s) 12/31/15 3/31/18 400 400 350 350 350 300 300 275 250 250 200 200 150 150 100 100 50 50 30 9 0 0 2017 2020 2021 2021 Unsecured 2017 Notes First Lien Term Loan 2021 2L Notes 2021 2L PIK Notes 21
Slide 22: Summary
Summary ▪ Substantial growth accomplished in 2017 through Cotton Valley development and Thunder Bayou recompletion ▪ Significant exposure to emerging Louisiana Austin Chalk Oil Trend ▪ ~25,000 acres in the core of the trend ▪ Initial well expected to spud in 4Q18 ▪ GOM assets sold in January 2018 ▪
Slide 23: Appendix
Appendix 23
Slide 24: Appendix – Adjusted EBITDA Reconciliation
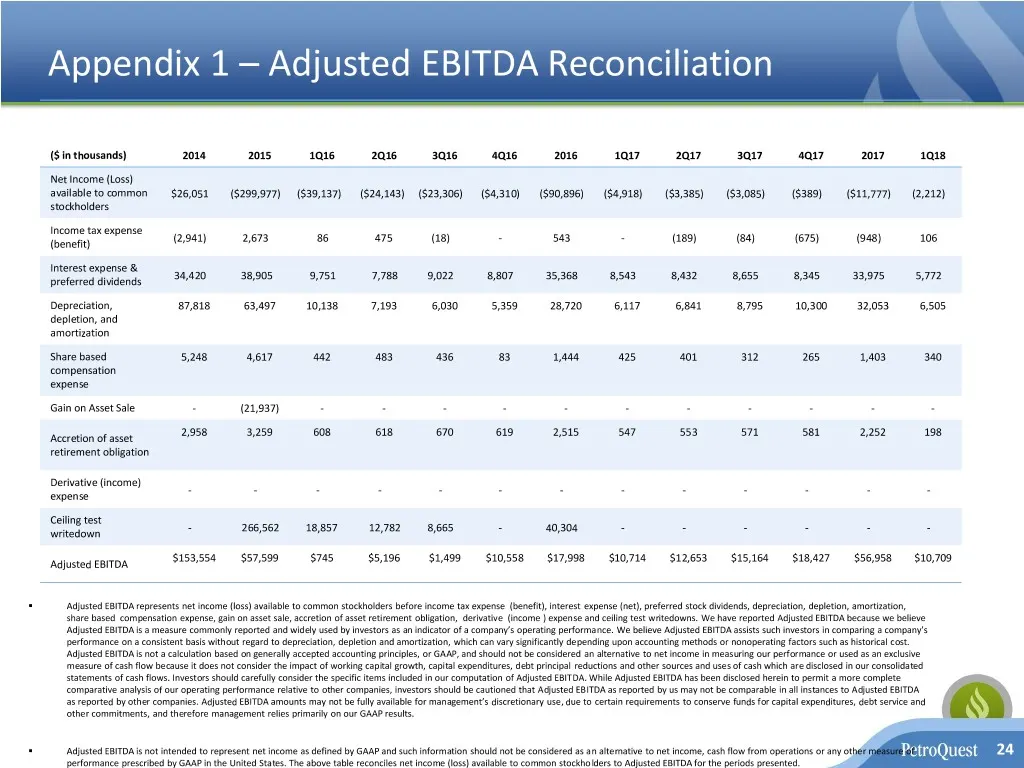
Appendix 1 – Adjusted EBITDA Reconciliation ($ in thousands) 2014 2015 1Q16 2Q16 3Q16 4Q16 2016 1Q17 2Q17 3Q17 4Q17 2017 1Q18 Net Income (Loss) available to common $26,051 ($299,977) ($39,137) ($24,143) ($23,306) ($4,310) ($90,896) ($4,918) ($3,385) ($3,085) ($389) ($11,777) (2,212) stockholders Inc
Slide 25: Appendix - Discretionary Cash Flow Reconciliation
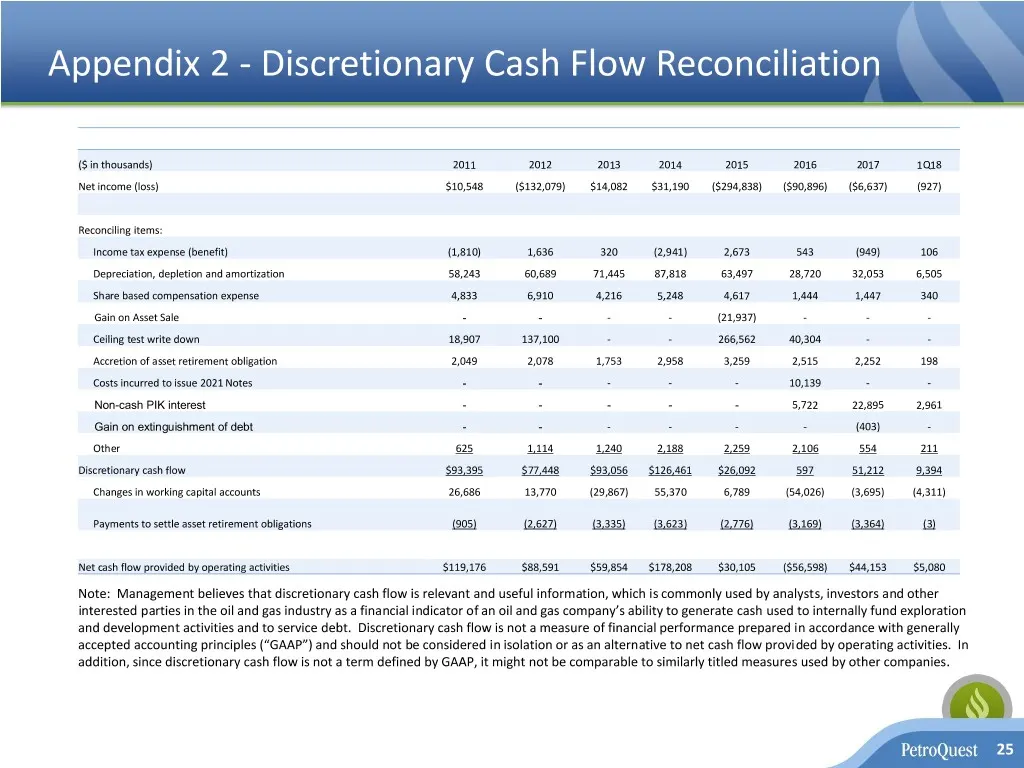
Appendix 2 - Discretionary Cash Flow Reconciliation ($ in thousands) 2011 2012 2013 2014 2015 2016 2017 1Q18 Net income (loss) $10,548 ($132,079) $14,082 $31,190 ($294,838) ($90,896) ($6,637) (927) Reconciling items: Income tax expense (benefit) (1,810) 1,636 320 (2,941) 2,673 543 (949) 106 Deprecia
Slide 26: Appendix - Panola County Cotton Valley – Room to Run
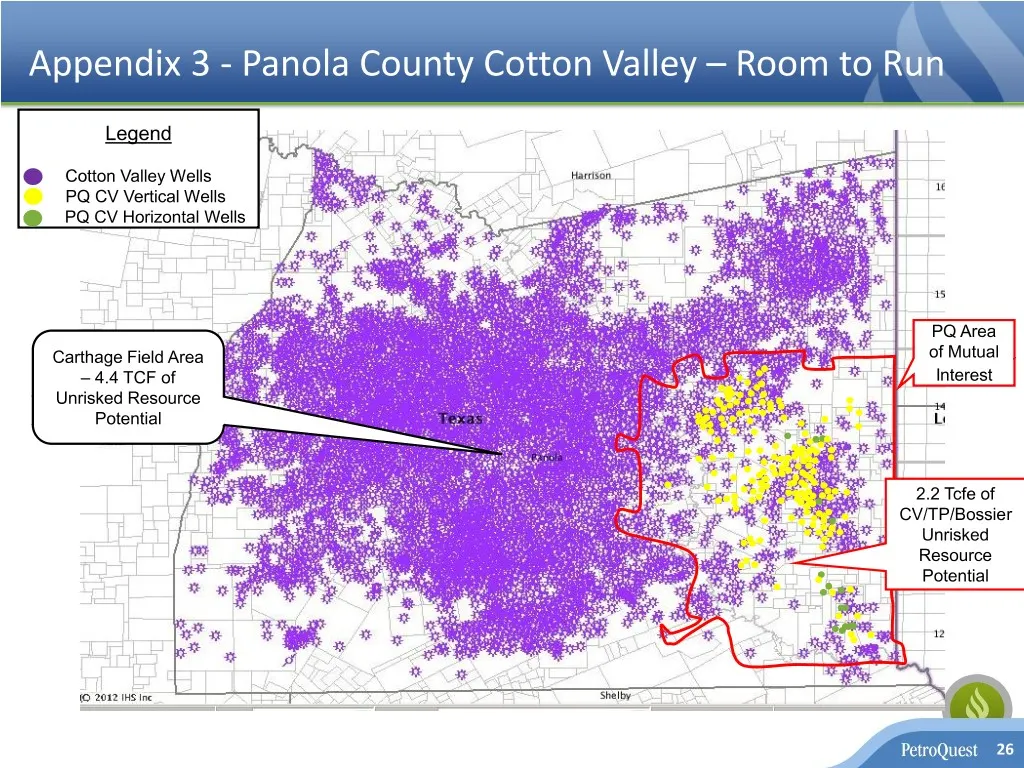
Appendix 3 - Panola County Cotton Valley – Room to Run Legend Cotton Valley Wells PQ CV Vertical Wells PQ CV Horizontal Wells PQ Area Carthage Field Area of Mutual – 4.4 TCF of Interest Unrisked Resource Potential 2.2 Tcfe of CV/TP/Bossier Unrisked Resource Potential 26
Slide 27: Appendix – Cotton Valley Production Profile
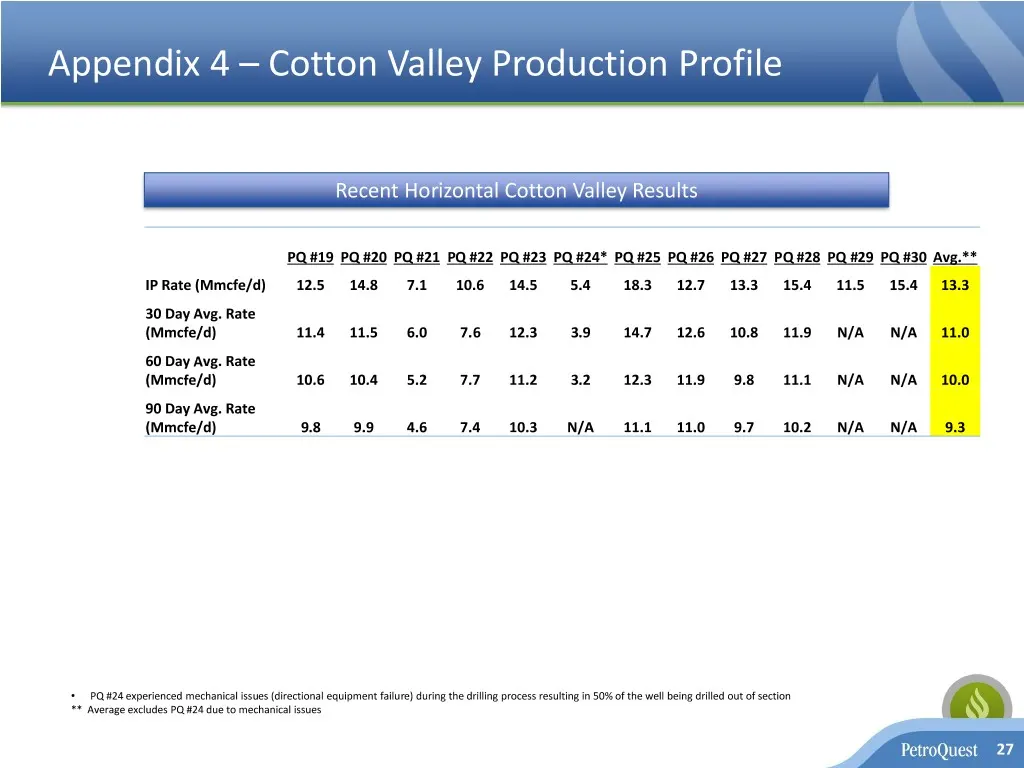
Appendix 4 – Cotton Valley Production Profile Recent Horizontal Cotton Valley Results PQ #19 PQ #20 PQ #21 PQ #22 PQ #23 PQ #24* PQ #25 PQ #26 PQ #27 PQ #28 PQ #29 PQ #30 Avg.** IP Rate (Mmcfe/d) 12.5 14.8 7.1 10.6 14.5 5.4 18.3 12.7 13.3 15.4 11.5 15.4 13.3 30 Day Avg. Rate (Mmcfe/d) 11.4 11.5 6.0
Slide 28: Appendix - Cotton Valley Acreage Position
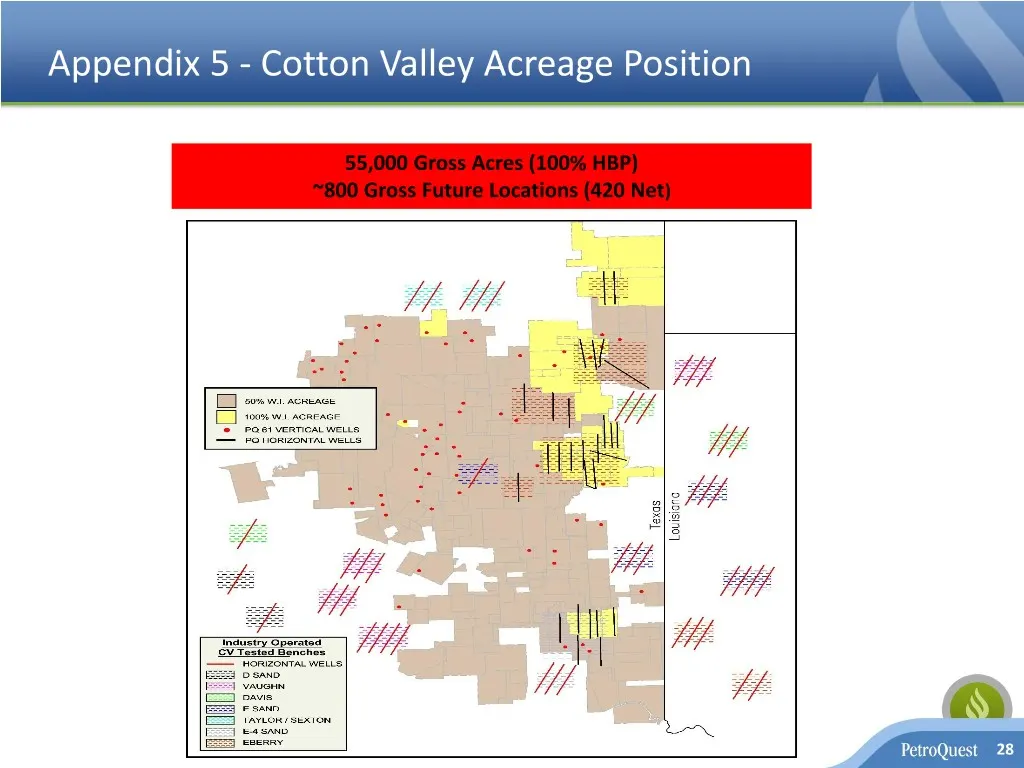
Appendix 5 - Cotton Valley Acreage Position 55,000 Gross Acres (100% HBP) ~800 Gross Future Locations (420 Net) 28
Slide 29: Company Information
Company Information 400 East Kaliste Saloom Road, Suite 6000 Lafayette, Louisiana 70508 Phone: (337) 232-7028 Fax: (337) 232-0044 www.petroquest.com V1 29
Source: SEC EDGAR · 8-K filed Jul 10, 2018
More decks from PetroQuest Energy Inc
 Corporate Update (June 2019)15 slides · Jun 19, 2019
 Investor Presentation (November 2018)16 slides · Nov 7, 2018
 Investor Presentation (December 2017)6 slides · Dec 20, 2017
 Investor Presentation (January 2017)28 slides · Jan 9, 2017
 Investor Presentation (April 2016)29 slides · Apr 5, 2016
 Investor Presentation (February 2016)28 slides · Feb 24, 2016