PetroQuest Energy — Investor Presentation (November 2018)
16 slides from PetroQuest Energy's investor presentation, Nov 7, 2018
Slide 1: Business Plan Overview
Exhibit 99.2 Business Plan Overview November 6, 2018 1 Seaport Global Securities LLC. Member FINRA/SIPC.Exhibit 99.2 Business Plan Overview November 6, 2018 1 Seaport Global Securities LLC. Member FINRA/SIPC.
Slide 2: Disclaimer
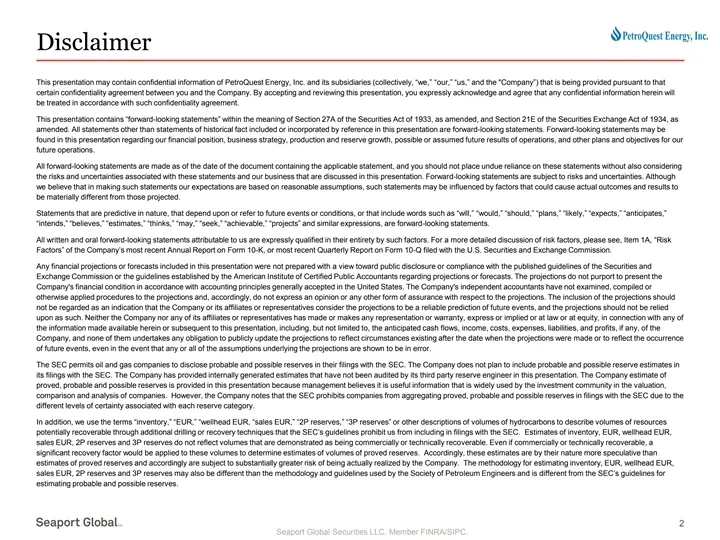
Disclaimer This presentation may contain confidential information of PetroQuest Energy, Inc. and its subsidiaries (collectively, “we,” “our,” “us,” and the Company”) that is being provided pursuant to that certain confidentiality agreement between you and the Company. By accepting and reviewing this
Slide 3: Business Plan Overview
Business Plan Overview 3 Seaport Global Securities LLC. Member FINRA/SIPC.Business Plan Overview 3 Seaport Global Securities LLC. Member FINRA/SIPC.
Slide 4: Business Plan and Global Assumptions
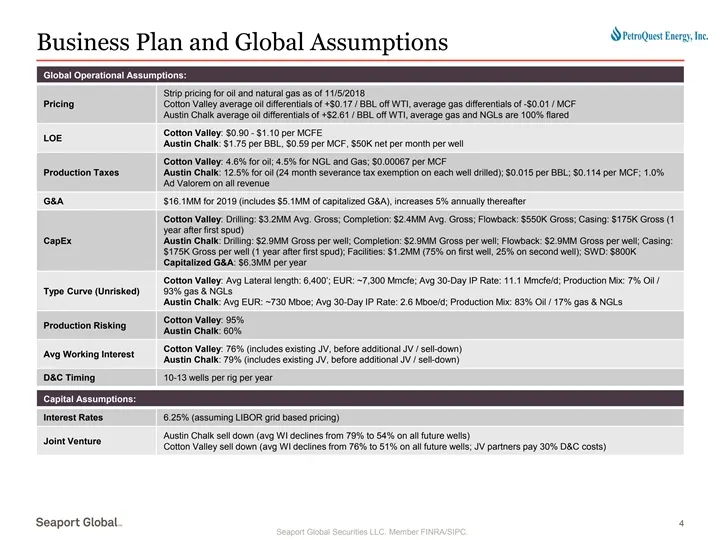
Business Plan and Global Assumptions Global Operational Assumptions: Strip pricing for oil and natural gas as of 11/5/2018 Pricing Cotton Valley average oil differentials of +$0.17 / BBL off WTI, average gas differentials of -$0.01 / MCF Austin Chalk average oil differentials of +$2.61 / BBL off WTI
Slide 5: Model Assumption and Output Summary
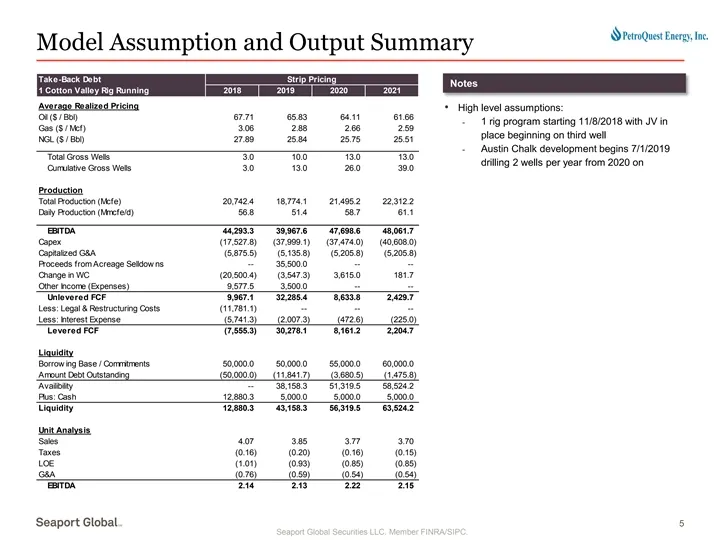
Model Assumption and Output Summary Take-Back Debt Strip Pricing Notes 1 Cotton Valley Rig Running 2018 2019 2020 2021 Average Realized Pricing • High level assumptions: Oil ($ / Bbl) 67.71 65.83 64.11 61.66 - 1 rig program starting 11/8/2018 with JV in Gas ($ / Mcf) 3.06 2.88 2.66 2.59 place beginn
Slide 6: Cotton Valley Overview
Cotton Valley Overview 6 Seaport Global Securities LLC. Member FINRA/SIPC.Cotton Valley Overview 6 Seaport Global Securities LLC. Member FINRA/SIPC.
Slide 7: PQ Land and Well Position
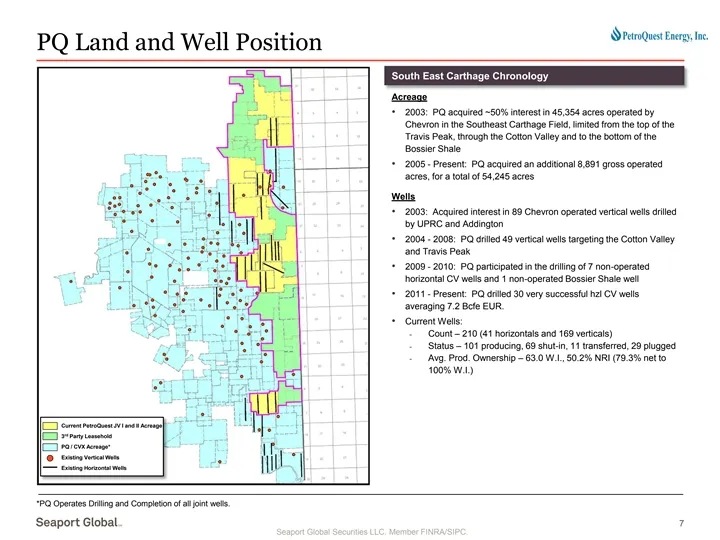
PQ Land and Well Position South East Carthage Chronology Acreage • 2003: PQ acquired ~50% interest in 45,354 acres operated by Chevron in the Southeast Carthage Field, limited from the top of the Travis Peak, through the Cotton Valley and to the bottom of the Bossier Shale • 2005 - Present: PQ acqui
Slide 8: CV Horizontal Wells Drilled Surrounding PQ Acreage
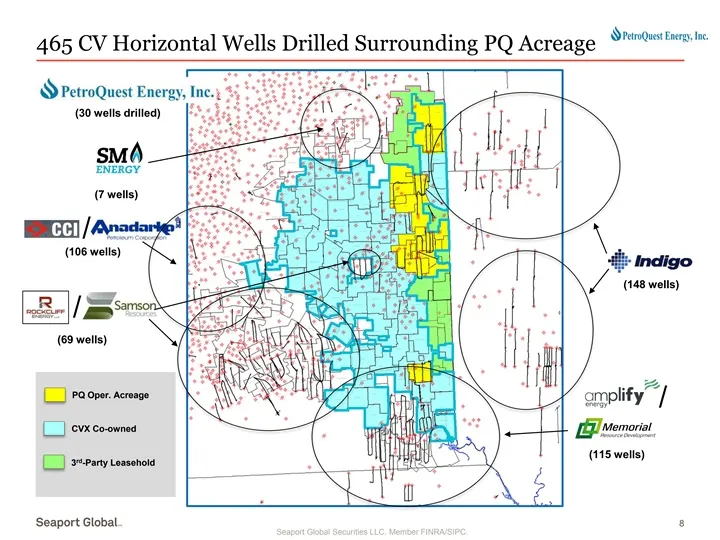
465 CV Horizontal Wells Drilled Surrounding PQ Acreage (30 wells drilled) (7 wells) / (106 wells) (148 wells) / (69 wells) PQ Oper. Acreage / CVX Co-owned (115 wells) rd 3 -Party Leasehold 8 Seaport Global Securities LLC. Member FINRA/SIPC.465 CV Horizontal Wells Drilled Surrounding PQ Acreage (30 w
Slide 9: Current Offset Activity
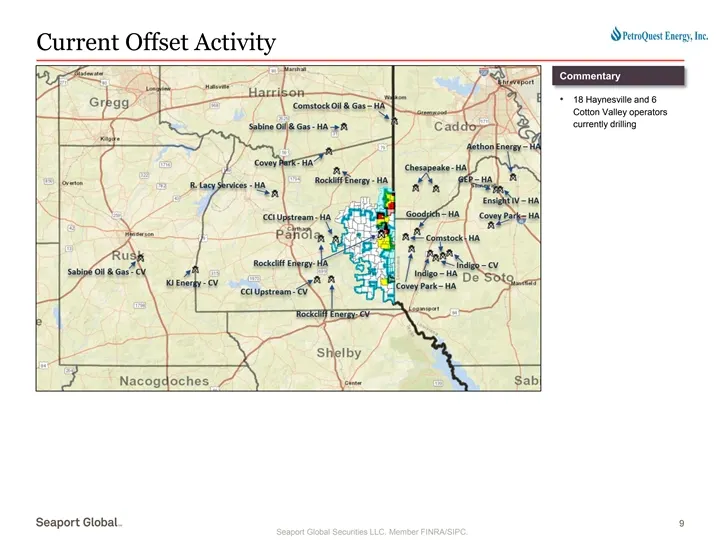
Current Offset Activity Commentary • 18 Haynesville and 6 Cotton Valley operators currently drilling 9 Seaport Global Securities LLC. Member FINRA/SIPC.Current Offset Activity Commentary • 18 Haynesville and 6 Cotton Valley operators currently drilling 9 Seaport Global Securities LLC. Member FINRA/S
Slide 10: Cotton Valley Formation Overview
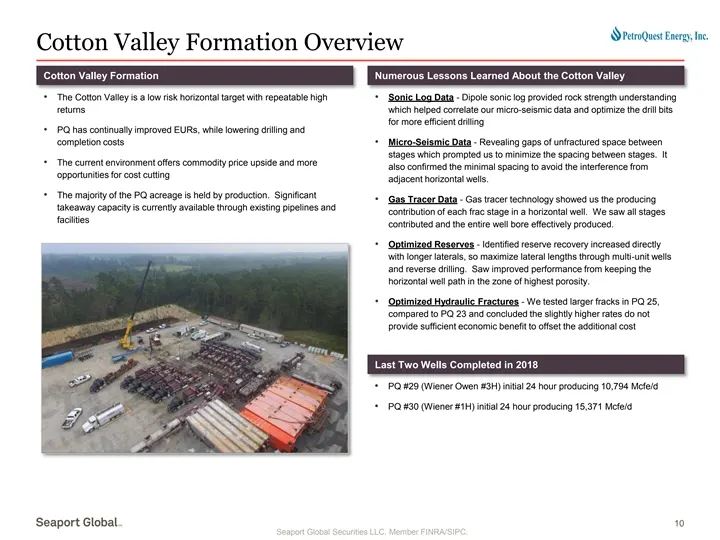
Cotton Valley Formation Overview Cotton Valley Formation Numerous Lessons Learned About the Cotton Valley • The Cotton Valley is a low risk horizontal target with repeatable high • Sonic Log Data - Dipole sonic log provided rock strength understanding returns which helped correlate our micro-seismic
Slide 11: Prospective Benches within the Cotton Valley
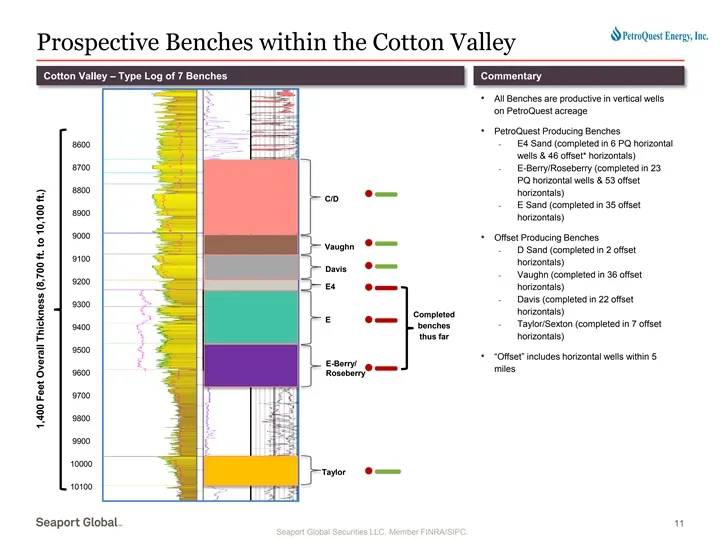
Prospective Benches within the Cotton Valley Cotton Valley – Type Log of 7 Benches Commentary • All Benches are productive in vertical wells on PetroQuest acreage • PetroQuest Producing Benches - E4 Sand (completed in 6 PQ horizontal 8600 wells & 46 offset* horizontals) 8700 - E-Berry/Roseberry (com
Slide 12: Horizontal Cotton Valley Type Curve Assumptions
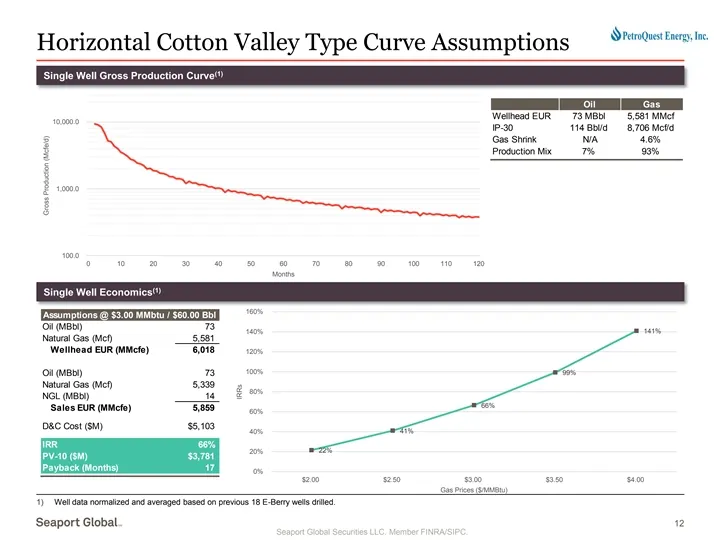
Horizontal Cotton Valley Type Curve Assumptions (1) Single Well Gross Production Curve Oil Gas Wellhead EUR 73 MBbl 5,581 MMcf 10,000.0 IP-30 114 Bbl/d 8,706 Mcf/d Gas Shrink N/A 4.6% Production Mix 7% 93% 1,000.0 100.0 0 10 20 30 40 50 60 70 80 90 100 110 120 Months (1) Single Well Economics 160% A
Slide 13: 2017 Operational Improvements
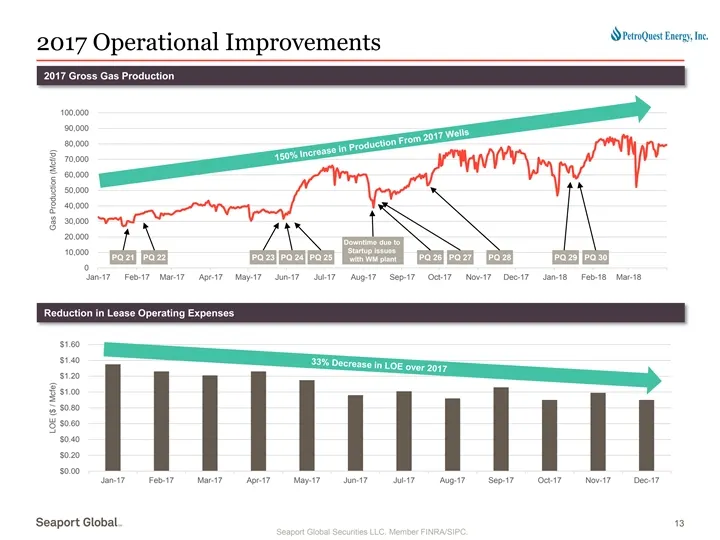
2017 Operational Improvements 2017 Gross Gas Production 100,000 90,000 80,000 70,000 60,000 50,000 40,000 30,000 20,000 Downtime due to Startup issues 10,000 PQ 21 PQ 22 PQ 23 PQ 24 PQ 25 PQ 26 PQ 27 PQ 28 PQ 29 PQ 30 with WM plant 0 Jan-17 Feb-17 Mar-17 Apr-17 May-17 Jun-17 Jul-17 Aug-17 Sep-17 Oct
Slide 14: 2017 Operational Improvements (Cont'd)
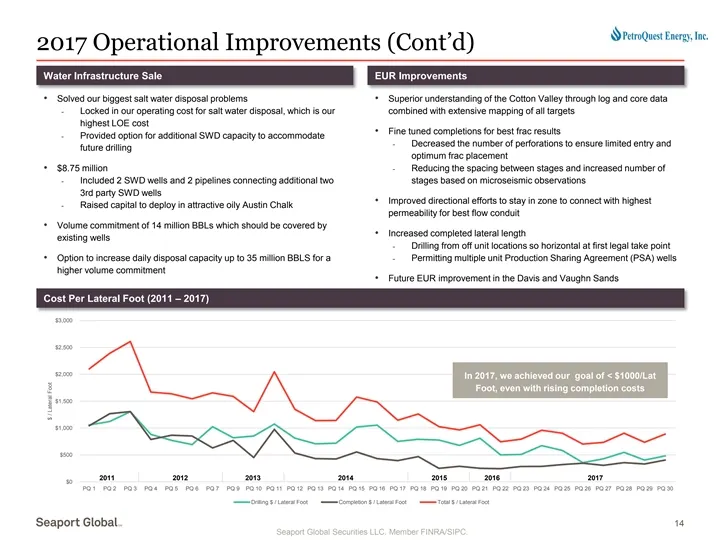
2017 Operational Improvements (Cont’d) Water Infrastructure Sale EUR Improvements • Solved our biggest salt water disposal problems • Superior understanding of the Cotton Valley through log and core data - Locked in our operating cost for salt water disposal, which is our combined with extensive map
Slide 15: Midstream Overview
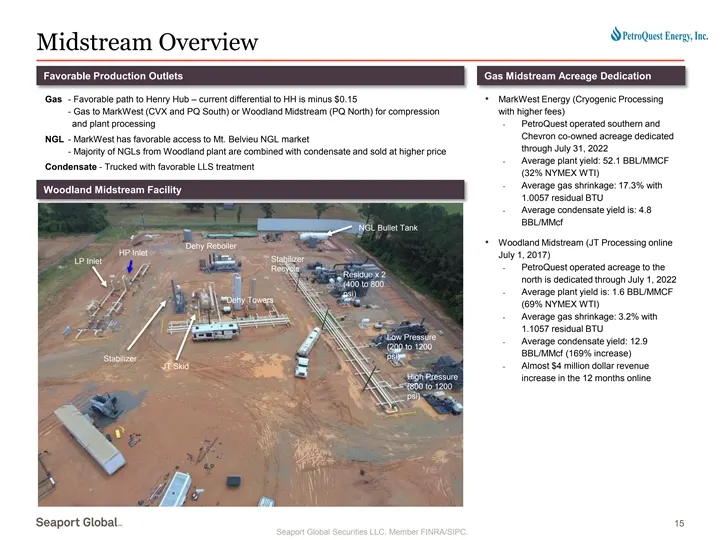
Midstream Overview Favorable Production Outlets Gas Midstream Acreage Dedication Gas - Favorable path to Henry Hub – current differential to HH is minus $0.15 • MarkWest Energy (Cryogenic Processing - Gas to MarkWest (CVX and PQ South) or Woodland Midstream (PQ North) for compression with higher fee
Slide 16: Summary of Cotton Valley
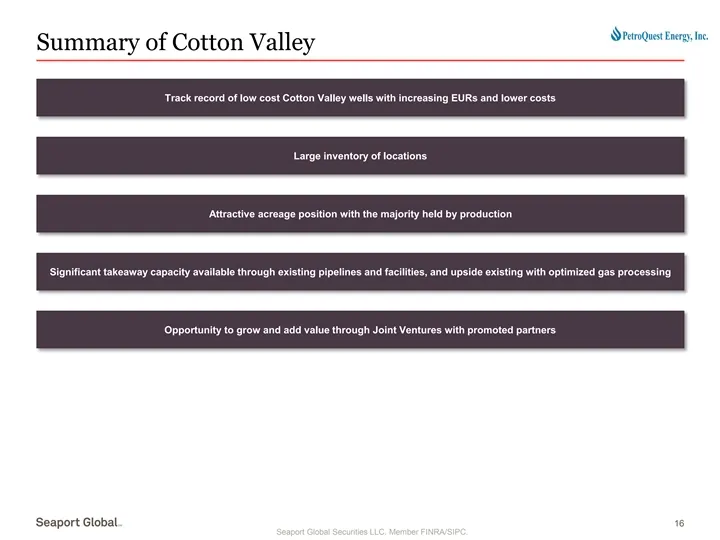
Summary of Cotton Valley Track record of low cost Cotton Valley wells with increasing EURs and lower costs Large inventory of locations Attractive acreage position with the majority held by production Significant takeaway capacity available through existing pipelines and facilities, and upside exist
Source: SEC EDGAR · 8-K filed Nov 7, 2018
More decks from PetroQuest Energy Inc
 Corporate Update (June 2019)15 slides · Jun 19, 2019
 Investor Presentation (July 2018)29 slides · Jul 10, 2018
 Investor Presentation (December 2017)6 slides · Dec 20, 2017
 Investor Presentation (January 2017)28 slides · Jan 9, 2017
 Investor Presentation (April 2016)29 slides · Apr 5, 2016
 Investor Presentation (February 2016)28 slides · Feb 24, 2016