PetroQuest Energy — Investor Presentation (April 2016)
29 slides from PetroQuest Energy's investor presentation, Apr 5, 2016
Slide 1: PetroQuest Energy, Inc. April 2016
oe Energy, Inc. April 2016
Slide 2: Forward-Looking Statements
Forward-Looking Statements 2 This presentation contains "forward-looking statements" within the meaning of Section 27A of the Securities Act of 1933, as amended, and Section 21E of the Securities Exchange Act of 1934, as amended. All statements other than statements of historical fact included in th
Slide 3: Our Properties
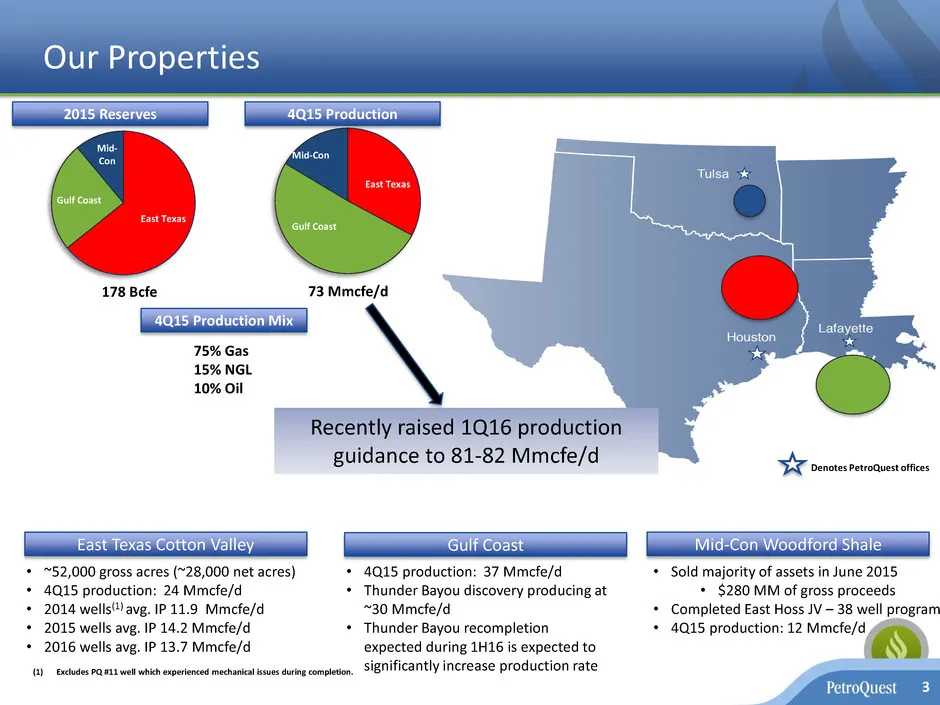
Our Properties 3 Gulf Coast Mid-Con Woodford Shale East Texas Cotton Valley • ~52,000 gross acres (~28,000 net acres) • 4Q15 production: 24 Mmcfe/d • 2014 wells(1) avg. IP 11.9 Mmcfe/d • 2015 wells avg. IP 14.2 Mmcfe/d • 2016 wells avg. IP 13.7 Mmcfe/d • 4Q15 production: 37 Mmcfe/d • Thunder Bayou d
Slide 4: Balance Sheet Strengthening Actions
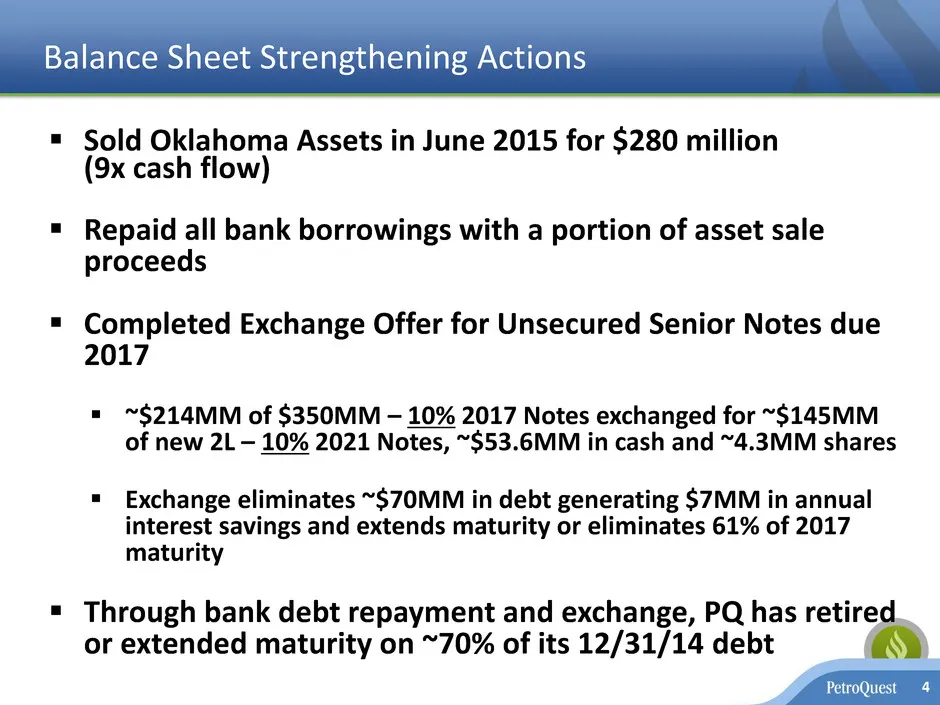
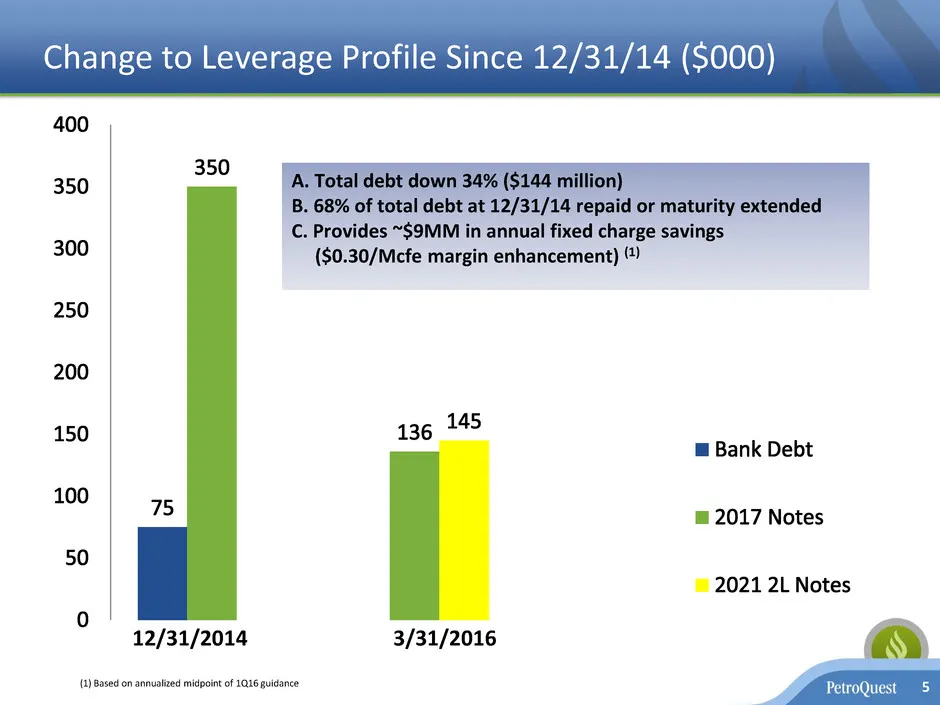
Balance Sheet Strengthening Actions 4 Sold Oklahoma Assets in June 2015 for $280 million (9x cash flow) Repaid all bank borrowings with a portion of asset sale proceeds Completed Exchange Offer for Unsecured Senior Notes due 2017 ~$214MM of $350MM – 10% 2017 Notes exchanged for ~$145MM of ne
Slide 5: Change to Leverage Profile Since 12/31/14
Change to Leverage Profile Since 12/31/14 ($000) A. Total debt down 34% ($144 million) B. 68% of total debt at 12/31/14 repaid or maturity extended C. Provides ~$9MM in annual fixed charge savings ($0.30/Mcfe margin enhancement) (1) 12/31/2014 3/31/2016 5 (1) Based on annualized midpoint of 1Q16 gui
Slide 6: Change to Maturity Profile
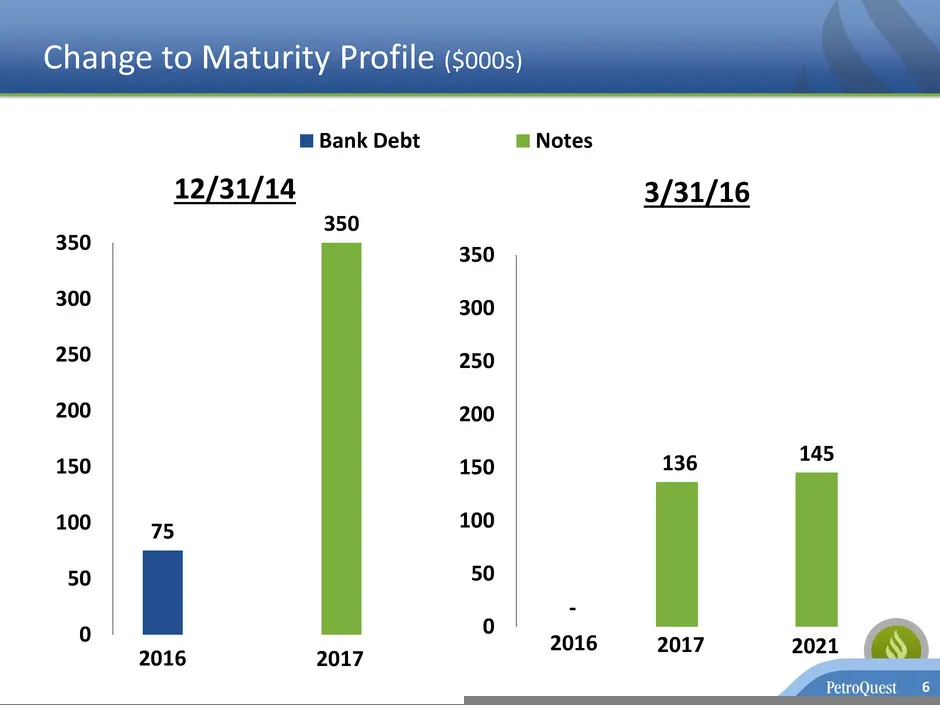
Change to Maturity Profile ($000s) 75 350 0 50 100 150 200 250 300 350 Bank Debt Notes 3/31/16 2016 2017 6 - 136 145 0 50 100 150 200 250 300 350 2016 2017 2021 12/31/14
Slide 7: Industry Activity - Cotton Valley Trend
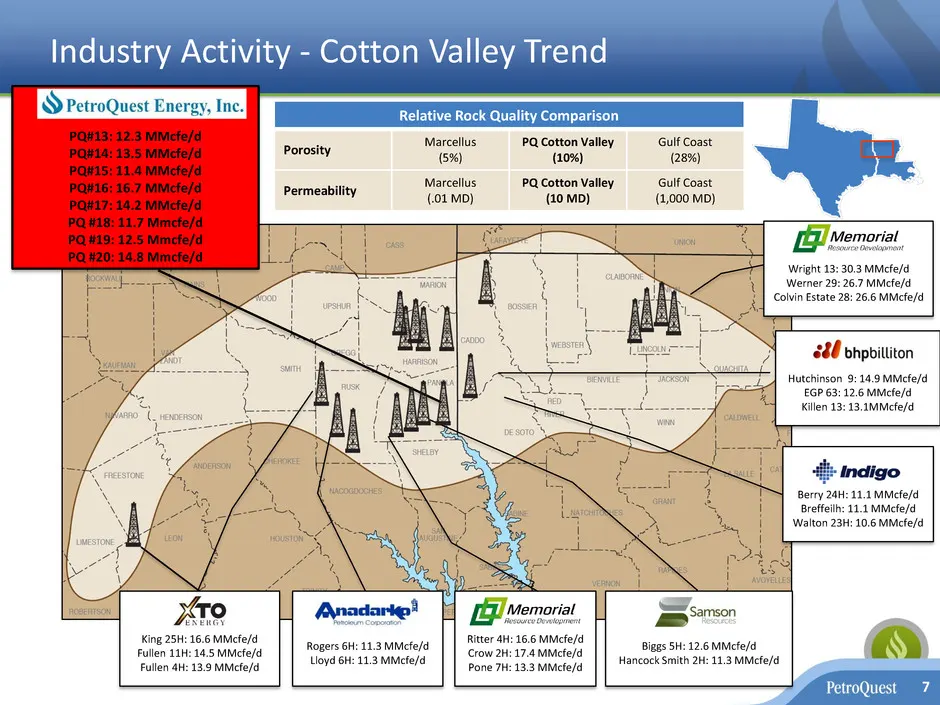
Industry Activity - Cotton Valley Trend 7 Hutchinson 9: 14.9 MMcfe/d EGP 63: 12.6 MMcfe/d Killen 13: 13.1MMcfe/d Wright 13: 30.3 MMcfe/d Werner 29: 26.7 MMcfe/d Colvin Estate 28: 26.6 MMcfe/d Berry 24H: 11.1 MMcfe/d Breffeilh: 11.1 MMcfe/d Walton 23H: 10.6 MMcfe/d PQ#13: 12.3 MMcfe/d PQ#14: 13.5 MMc
Slide 8: Cotton Valley Horizontal – Production Up with Costs Down
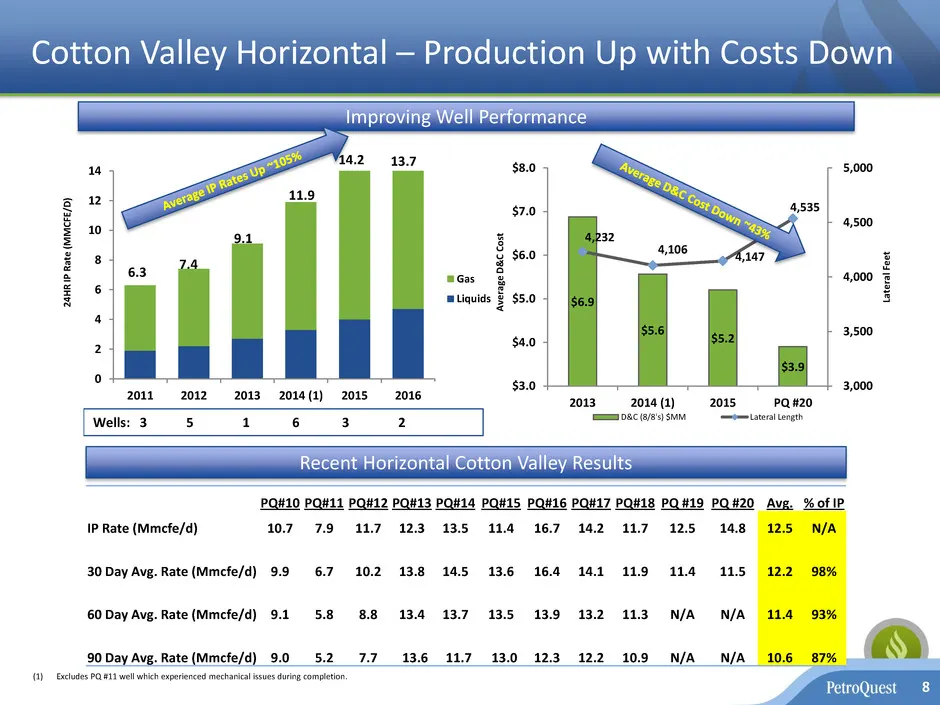
Cotton Valley Horizontal – Production Up with Costs Down 8 Improving Well Performance (1) Excludes PQ #11 well which experienced mechanical issues during completion. Recent Horizontal Cotton Valley Results $6.9 $5.6 $5.2 $3.9 4,232 4,106 4,147 4,535 3,000 3,500 4,000 4,500 5,000 $3.0 $4.0 $5.0 $6.0
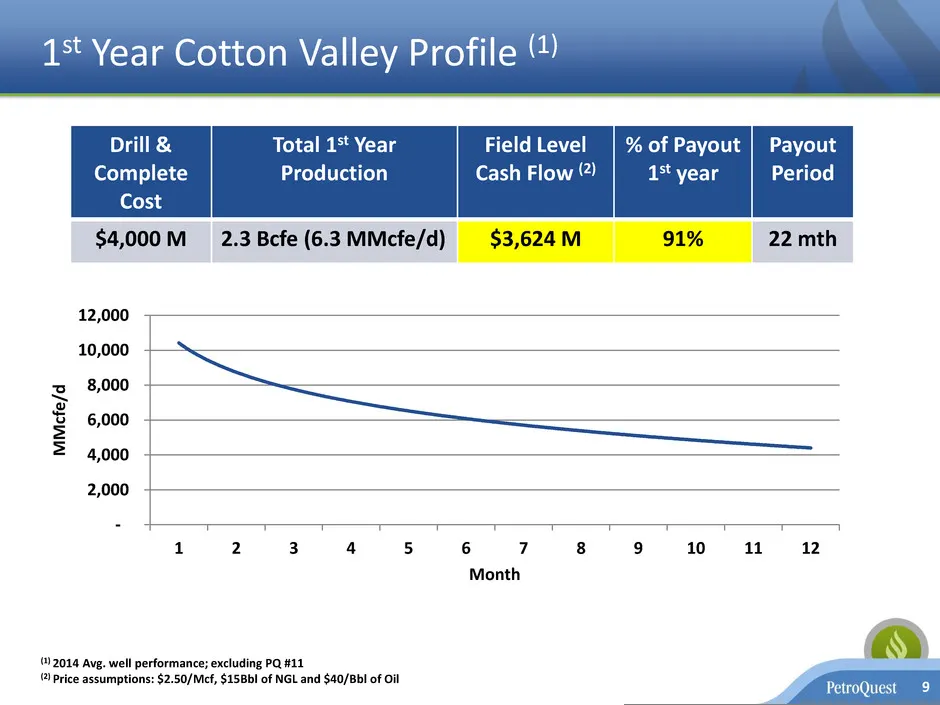
Slide 9: 1st Year Cotton Valley Profile
1st Year Cotton Valley Profile (1) 9 Drill & Complete Cost Total 1st Year Production Field Level Cash Flow (2) % of Payout 1st year Payout Period $4,000 M 2.3 Bcfe (6.3 MMcfe/d) $3,624 M 91% 22 mth (1) 2014 Avg. well performance; excluding PQ #11 (2) Price assumptions: $2.50/Mcf, $15Bbl of NGL and $
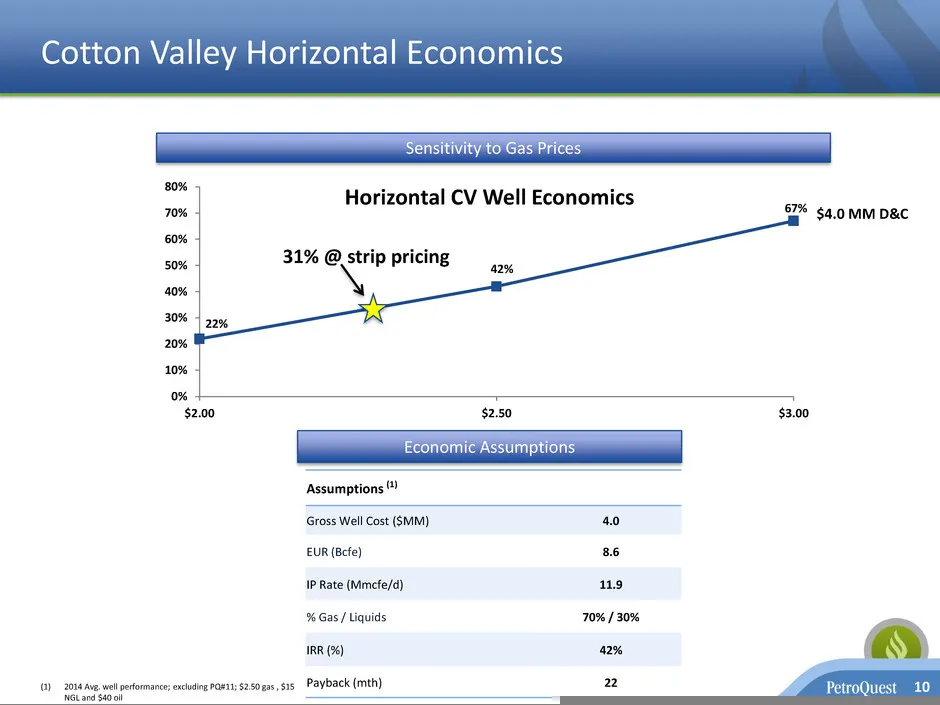
Slide 10: Cotton Valley Horizontal Economics
Cotton Valley Horizontal Economics 10 Assumptions (1) Gross Well Cost ($MM) 4.0 EUR (Bcfe) 8.6 IP Rate (Mmcfe/d) 11.9 % Gas / Liquids 70% / 30% IRR (%) 42% Payback (mth) 22 (1) 2014 Avg. well performance; excluding PQ#11; $2.50 gas , $15 NGL and $40 oil Sensitivity to Gas Prices 0 2000 4000 6000 800
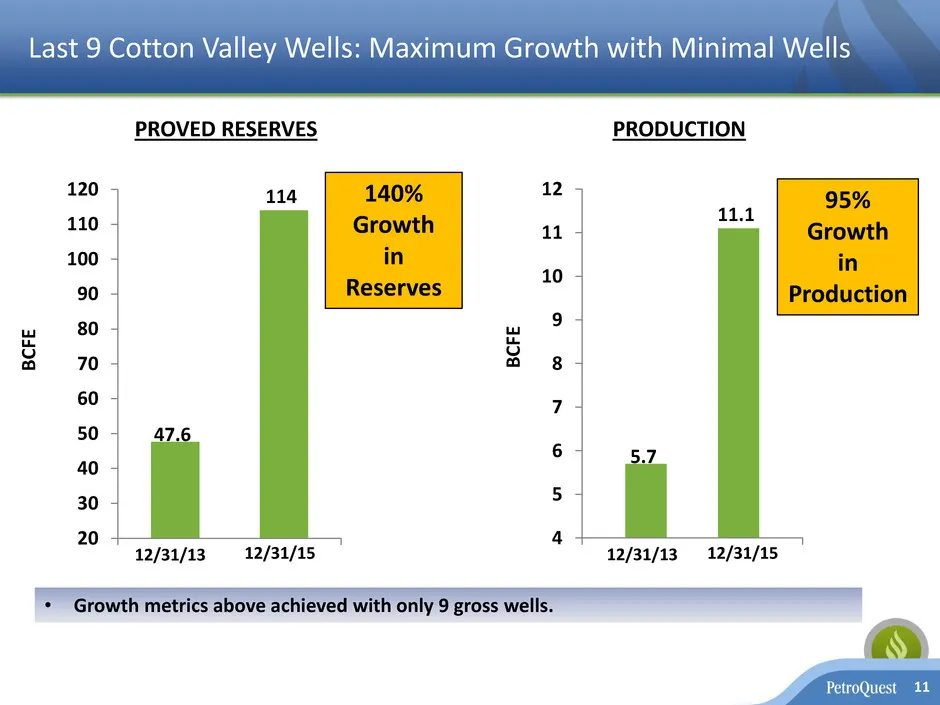
Slide 11: Last Cotton Valley Wells: Maximum Growth with Minimal Wells
11 Last 9 Cotton Valley Wells: Maximum Growth with Minimal Wells 5.7 11.1 4 5 6 7 8 9 10 11 12 BCF E 95% Growth in Production 12/31/13 12/31/15 • Growth metrics above achieved with only 9 gross wells. 47.6 114 20 30 40 50 60 70 80 90 100 110 120 BCF E 140% Growth in Reserves 12/31/15 PROVED RESERVES
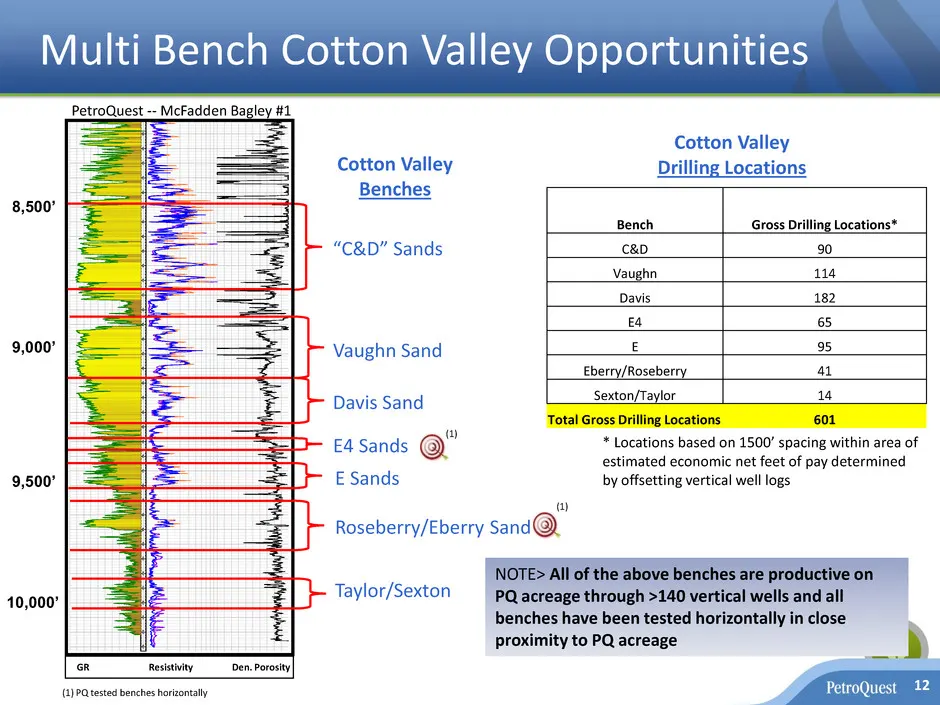
Slide 12: McFadden-Bagley Uni well log
MCFADDEN-BAGLEY UNI 1 42365359740000 CUMGAS : 153,052 MCF CUMOIL : 835 BBLS CUMWTR : 22,183 BBLS 2/15/2006 8 2 0 0 8 2 5 0 8 3 0 0 8 3 5 0 8 4 0 0 8 4 5 0 8 5 0 0 8 5 5 0 8 6 0 0 8 6 5 0 8 7 0 0 8 7 5 0 8 8 0 0 8 8 5 0 8 9 0 0 8 9 5 0 9 0 0 0 9 0 5 0 9 1 0 0 9 1 5 0 9 2 0 0 9 2 5 0 9 3 0 0 9 3 5 0 9
Slide 13: Cotton Valley Acreage Position
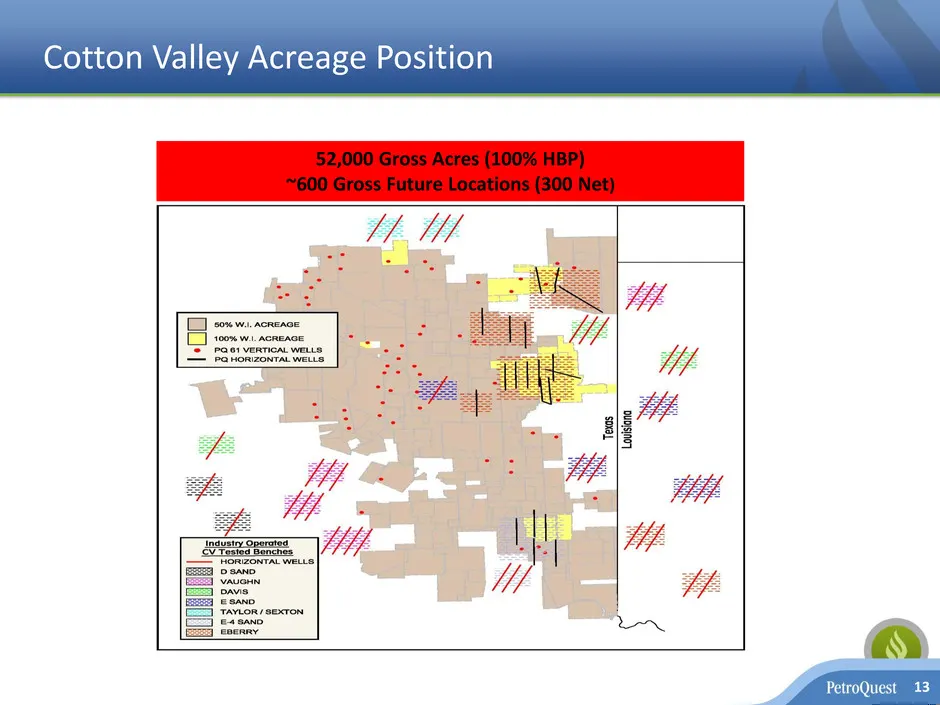
13 Cotton Valley Acreage Position 52,000 Gross Acres (100% HBP) ~600 Gross Future Locations (300 Net)
Slide 14: Gulf Coast – Free Cash Flow Generator
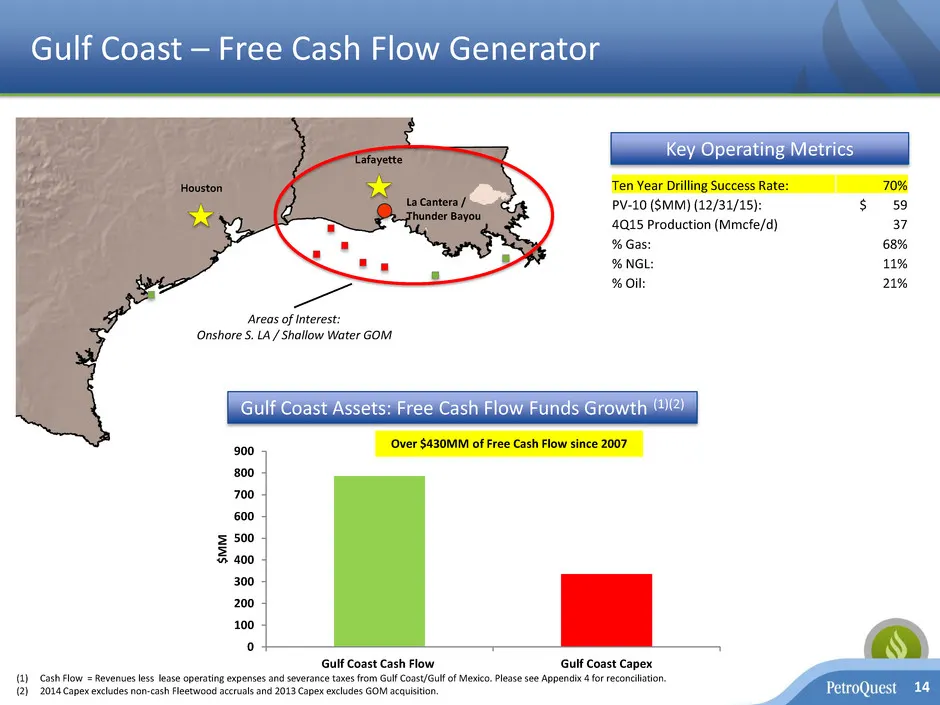
Gulf Coast – Free Cash Flow Generator 14 Houston Lafayette Areas of Interest: Onshore S. LA / Shallow Water GOM Key Operating Metrics (1) Cash Flow = Revenues less lease operating expenses and severance taxes from Gulf Coast/Gulf of Mexico. Please see Appendix 4 for reconciliation. (2) 2014 Capex ex
Slide 15: Thunder Bayou/La Cantera Summary
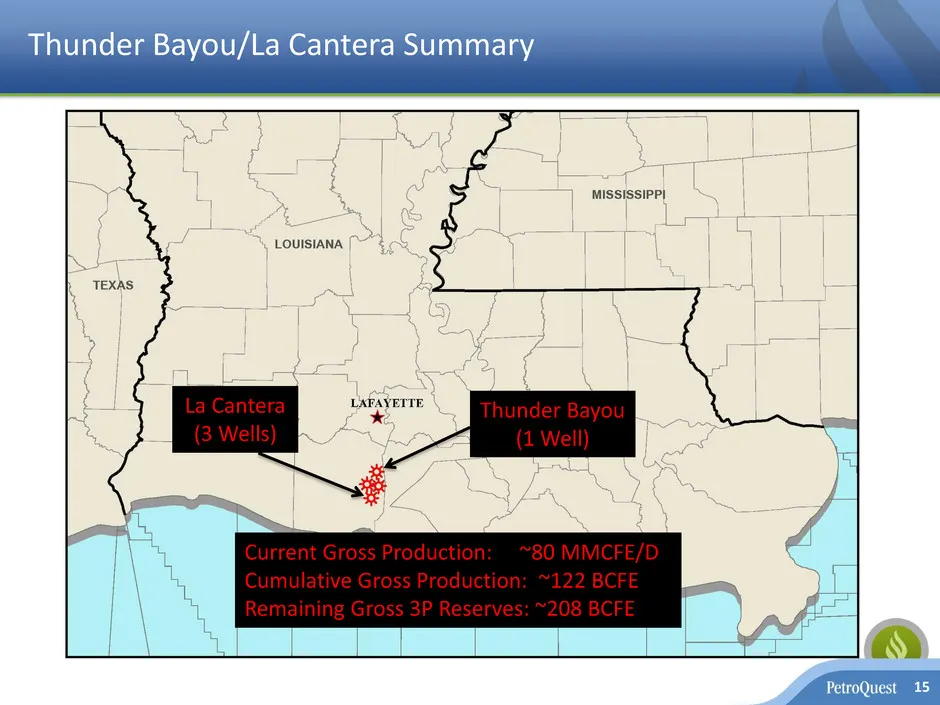
Thunder Bayou/La Cantera Summary 15 Thunder Bayou (1 Well) La Cantera (3 Wells) Current Gross Production: ~80 MMCFE/D Cumulative Gross Production: ~122 BCFE Remaining Gross 3P Reserves: ~208 BCFE
Slide 16: Thunder Bayou/La Cantera 3P Value
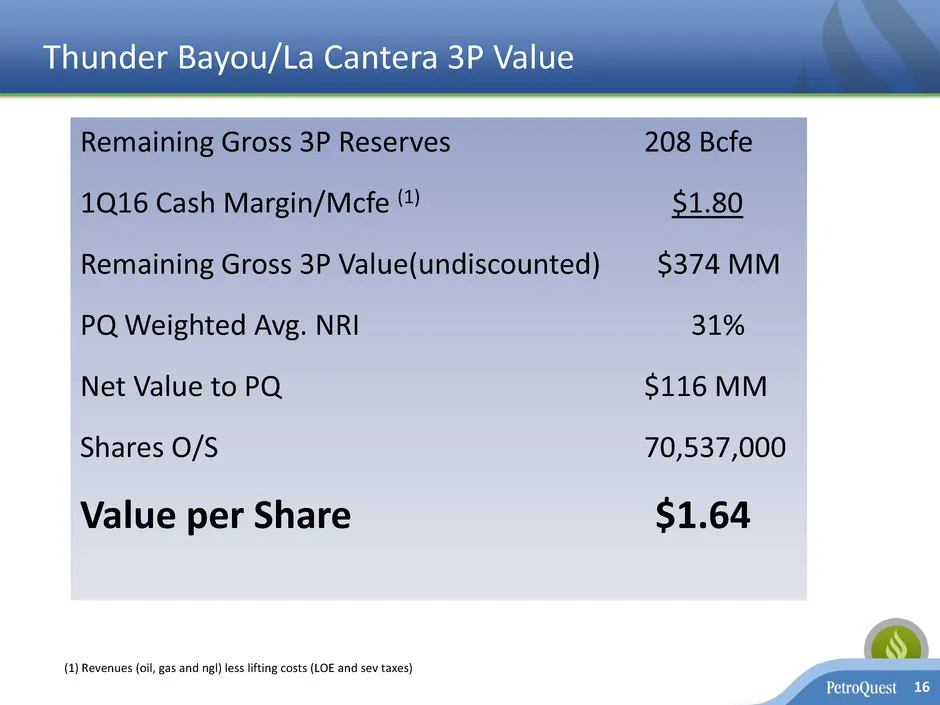
Thunder Bayou/La Cantera 3P Value Remaining Gross 3P Reserves 208 Bcfe 1Q16 Cash Margin/Mcfe (1) $1.80 Remaining Gross 3P Value(undiscounted) $374 MM PQ Weighted Avg. NRI 31% Net Value to PQ $116 MM Shares O/S 70,537,000 Value per Share $1.64 16 (1) Revenues (oil, gas and ngl) less lifting costs (LO
Slide 17: Thunder Bayou Recompletion: Low Cost Production Boost
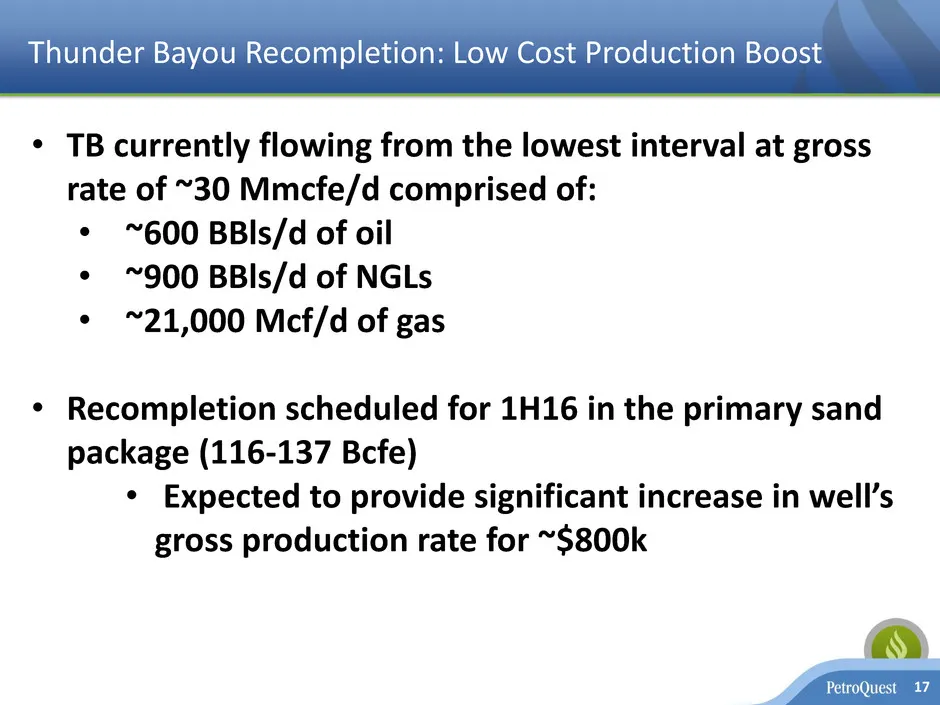
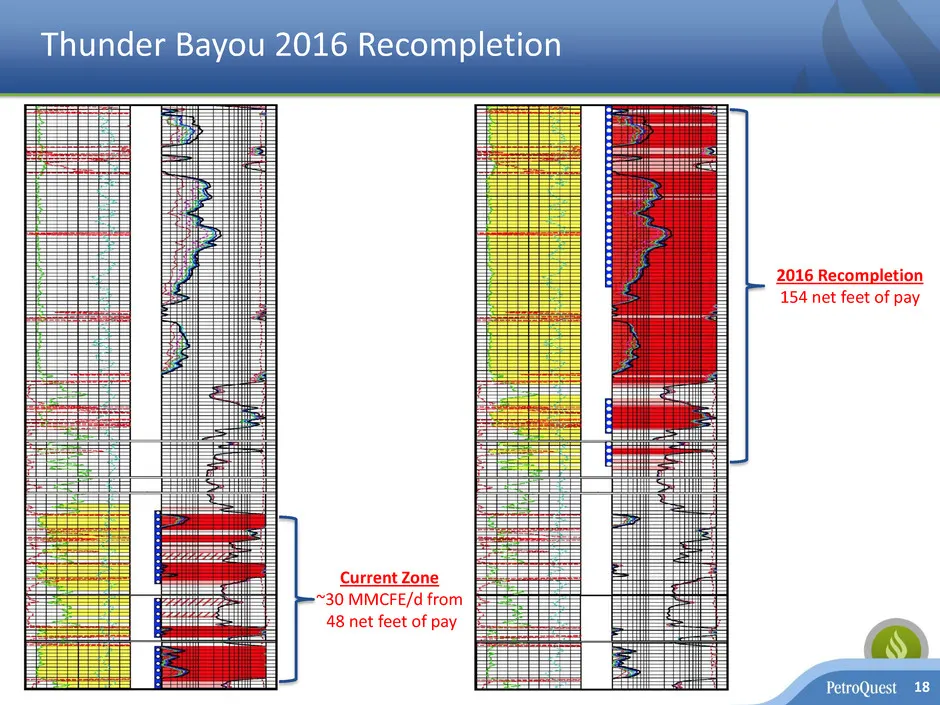
Thunder Bayou Recompletion: Low Cost Production Boost 17 • TB currently flowing from the lowest interval at gross rate of ~30 Mmcfe/d comprised of: • ~600 BBls/d of oil • ~900 BBls/d of NGLs • ~21,000 Mcf/d of gas • Recompletion scheduled for 1H16 in the primary sand package (116-137 Bcfe) • Expecte
Slide 18: Thunder Bayou 2016 Recompletion
Thunder Bayou 2016 Recompletion 18 Current Zone ~30 MMCFE/d from 48 net feet of pay 2016 Recompletion 154 net feet of pay
Slide 19: Summary
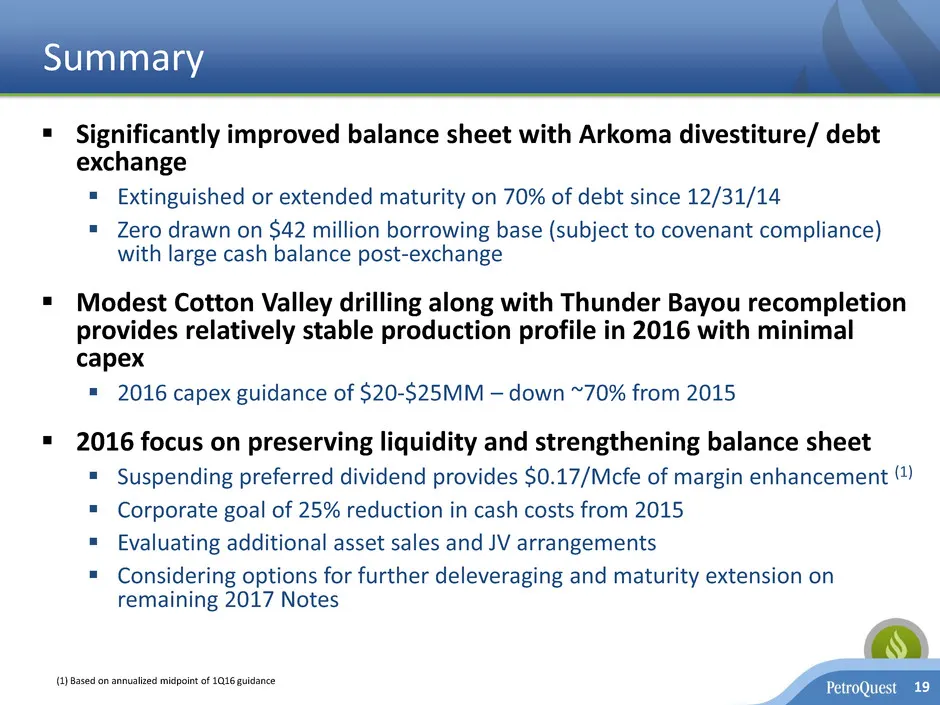
Summary Significantly improved balance sheet with Arkoma divestiture/ debt exchange Extinguished or extended maturity on 70% of debt since 12/31/14 Zero drawn on $42 million borrowing base (subject to covenant compliance) with large cash balance post-exchange Modest Cotton Valley drilling al
Slide 20: Appendix
20 Appendix
Slide 21: Appendix - Hedging Positions
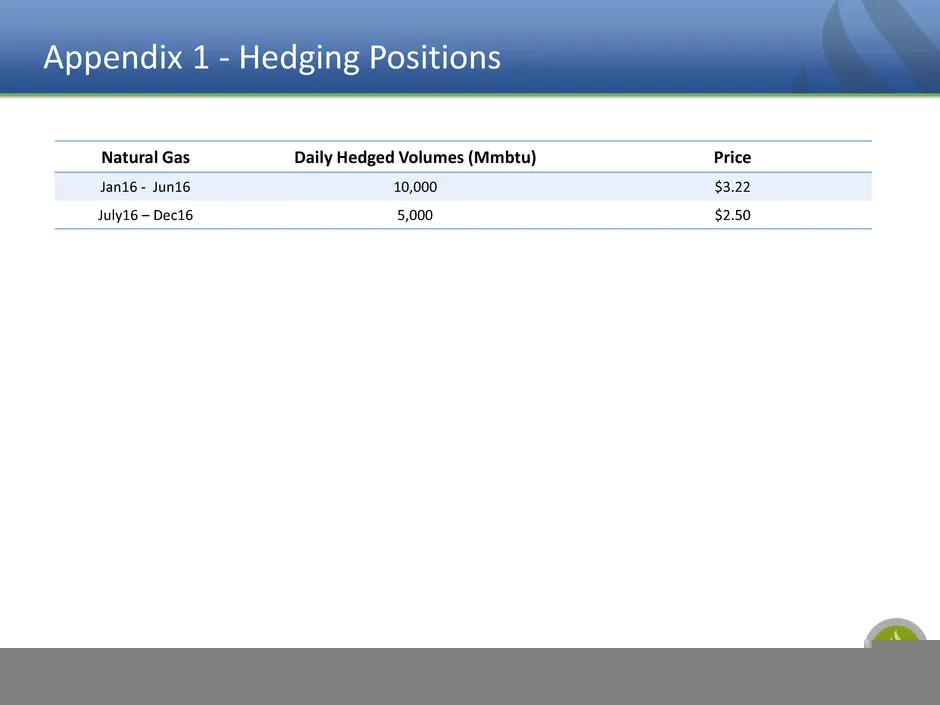
Appendix 1 - Hedging Positions 21 Natural Gas Daily Hedged Volumes (Mmbtu) Price Jan16 - Jun16 10,000 $3.22 July16 – Dec16 5,000 $2.50
Slide 22: Appendix – Adjusted EBITDA Reconciliation
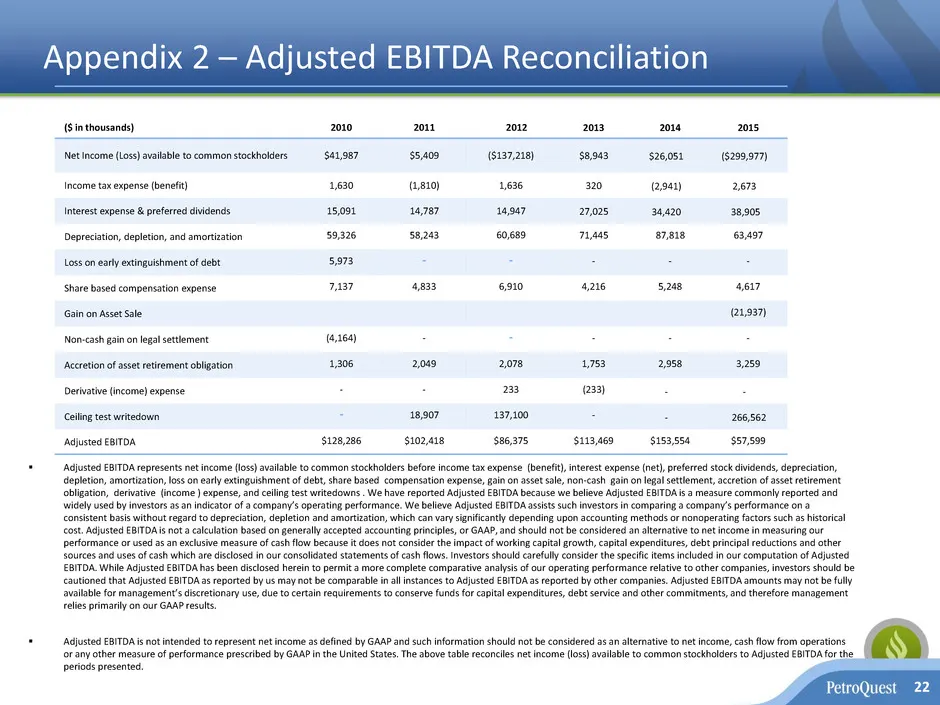
Appendix 2 – Adjusted EBITDA Reconciliation Adjusted EBITDA represents net income (loss) available to common stockholders before income tax expense (benefit), interest expense (net), preferred stock dividends, depreciation, depletion, amortization, loss on early extinguishment of debt, share based
Slide 23: Appendix - Discretionary Cash Flow Reconciliation
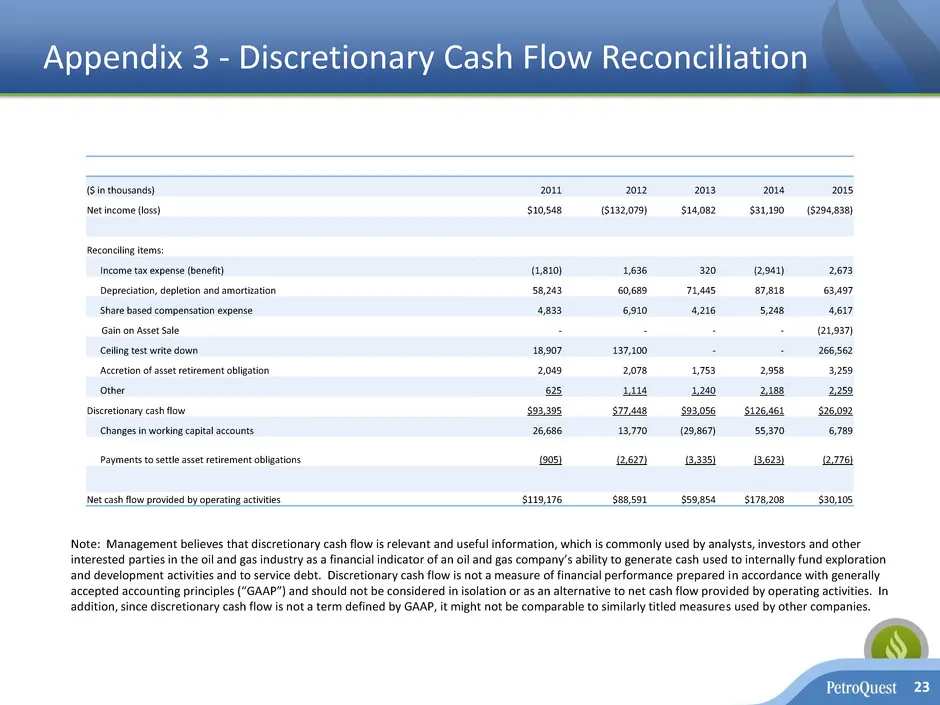
Appendix 3 - Discretionary Cash Flow Reconciliation ($ in thousands) 2011 2012 2013 2014 2015 Net income (loss) $10,548 ($132,079) $14,082 $31,190 ($294,838) Reconciling items: Income tax expense (benefit) (1,810) 1,636 320 (2,941) 2,673 Depreciation, depletion and amortization 58,243 60,689 71,445
Slide 24: Appendix – Gulf Coast/GOM Free Cash Flow Reconciliation
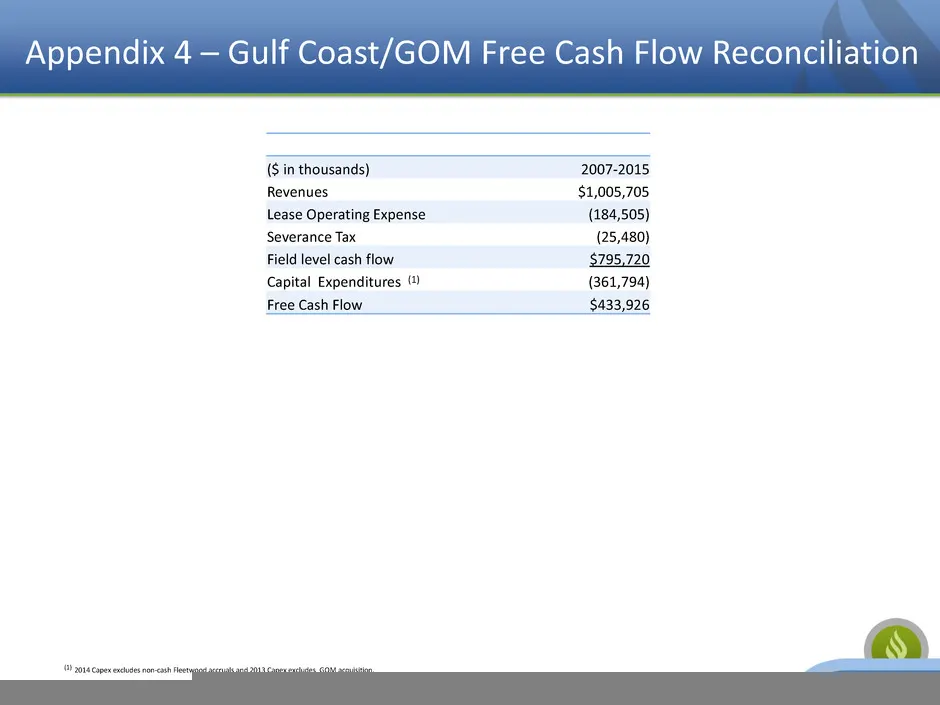
Appendix 4 – Gulf Coast/GOM Free Cash Flow Reconciliation ($ in thousands) 2007-2015 Revenues $1,005,705 Lease Operating Expense (184,505) Severance Tax (25,480) Field level cash flow $795,720 Capital Expenditures (1) (361,794) Free Cash Flow $433,926 24 (1) 2014 Capex excludes non-cash Fleetwood ac
Slide 25: Appendix - La Cantera Development
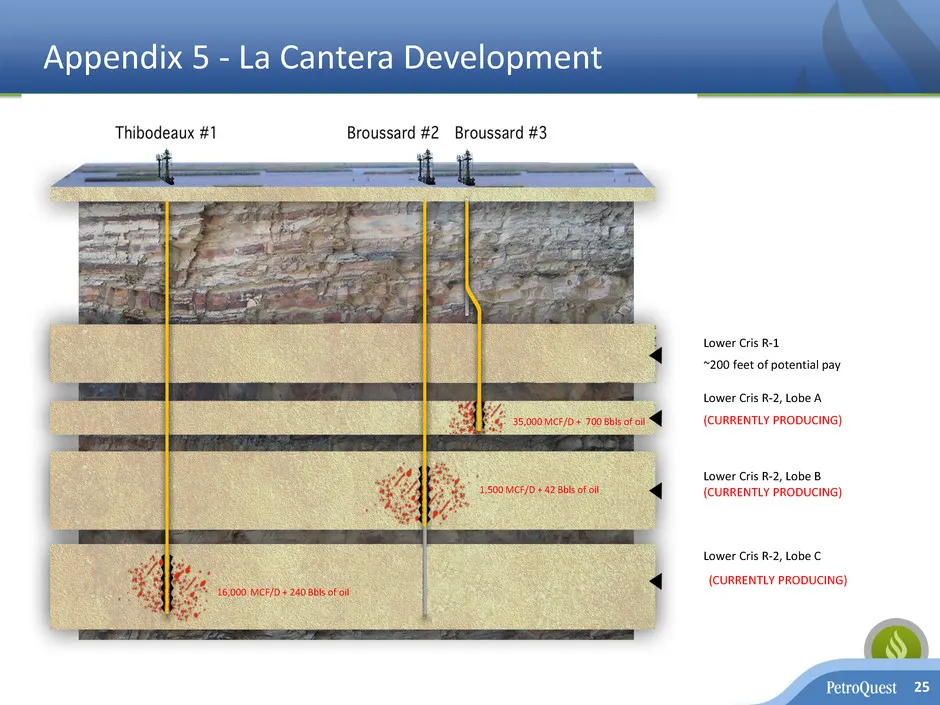
Appendix 5 - La Cantera Development 25 15,000 MCF/D + 250 Bbls of oil Lower Cris R-1 Lower Cris R-2, Lobe A Lower Cris R-2, Lobe B Lower Cris R-2, Lobe C (CURRENTLY PRODUCING) (CURRENTLY PRODUCING) ~200 feet of potential pay (CURRENTLY PRODUCING) 16,000 MCF/D + 240 Bbls of oil 1,500 MCF/D + 42 Bbls
Slide 26: Appendix - Panola County Cotton Valley – Room to Run
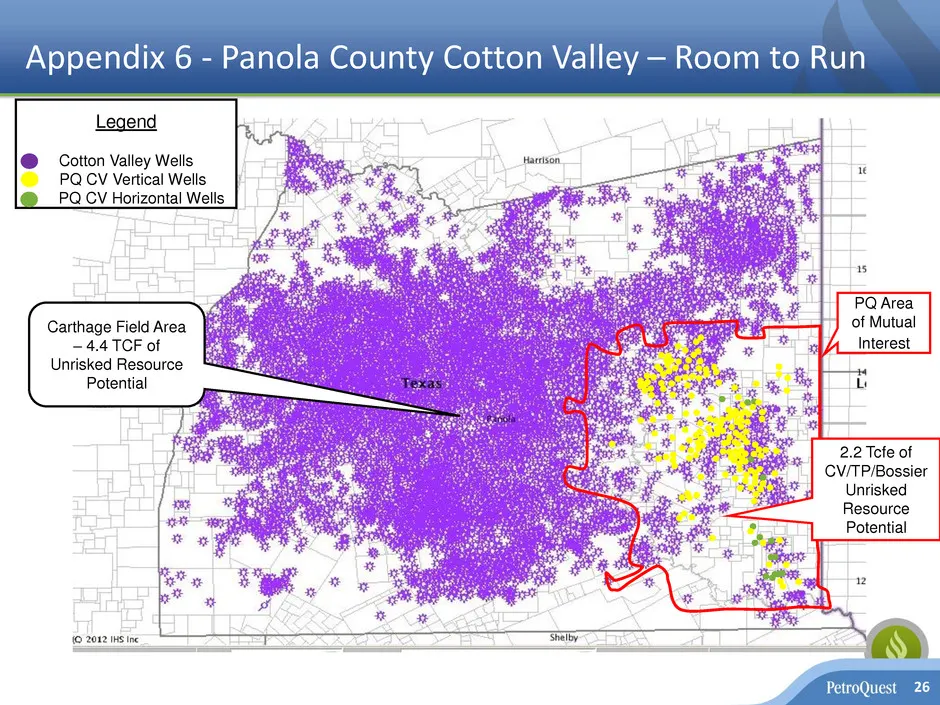
Appendix 6 - Panola County Cotton Valley – Room to Run 26 Legend Cotton Valley Wells PQ CV Vertical Wells PQ CV Horizontal Wells PQ Area of Mutual Interest Carthage Field Area – 4.4 TCF of Unrisked Resource Potential 2.2 Tcfe of CV/TP/Bossier Unrisked Resource Potential
Slide 27: Appendix - Cotton Valley Horizontal – Horizontal Uplift
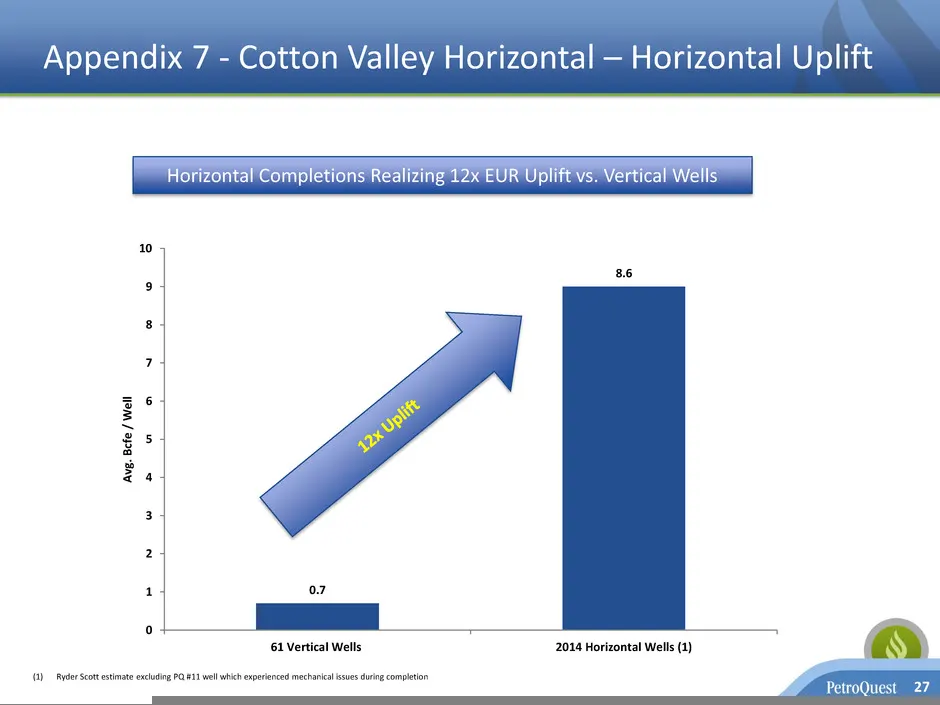
Appendix 7 - Cotton Valley Horizontal – Horizontal Uplift 27 Horizontal Completions Realizing 12x EUR Uplift vs. Vertical Wells (1) Ryder Scott estimate excluding PQ #11 well which experienced mechanical issues during completion 0.7 8.6 0 1 2 3 4 5 6 7 8 9 10 61 Vertical Wells 2014 Horizontal Wells
Slide 28: Appendix - Woodford Position
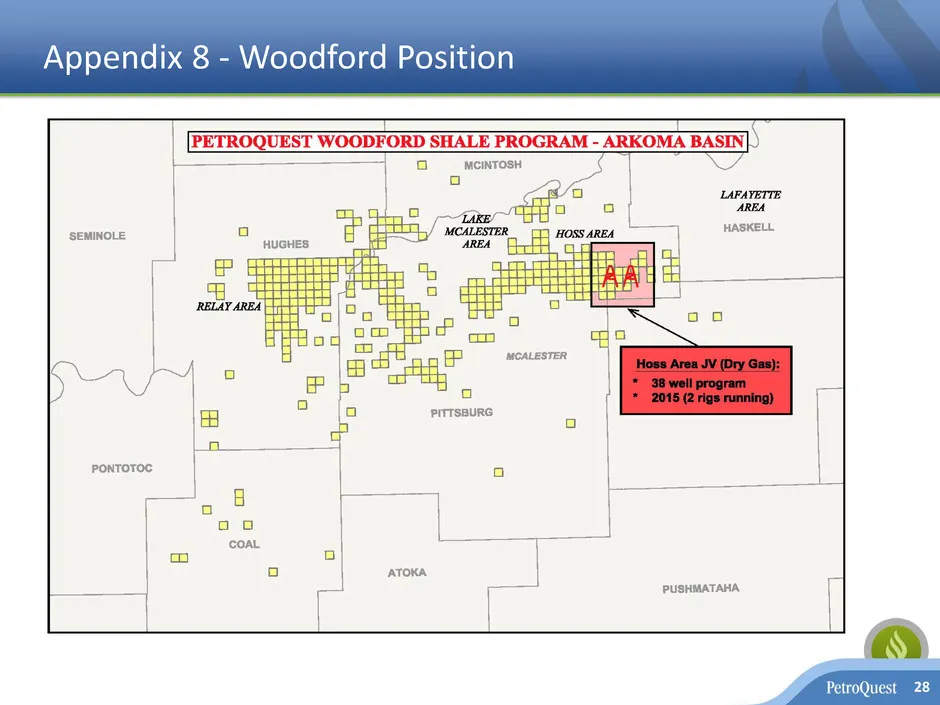
Appendix 8 - Woodford Position 28
Slide 29: Company Information
Company Information 29 400 East Kaliste Saloom Road, Suite 6000 Lafayette, Louisiana 70508 Phone: (337) 232-7028 Fax: (337) 232-0044 www.petroquest.com Version 3 This presentation contains "forward-looking statements" within the meaning of Section 27A of the Securities Act of 1933, as amended, and S
Source: SEC EDGAR · 8-K filed Apr 5, 2016
More decks from PetroQuest Energy Inc
 Corporate Update (June 2019)15 slides · Jun 19, 2019
 Investor Presentation (November 2018)16 slides · Nov 7, 2018
 Investor Presentation (July 2018)29 slides · Jul 10, 2018
 Investor Presentation (December 2017)6 slides · Dec 20, 2017
 Investor Presentation (January 2017)28 slides · Jan 9, 2017
 Investor Presentation (February 2016)28 slides · Feb 24, 2016