Superior Drilling Products Inc
Superior Drilling Products — Q3 2016 Earnings Presentation
14 slides from Superior Drilling Products's earnings presentation, Nov 15, 2016
Slide 1: Third Quarter 2016 Financial Results Conference Call
© 2016 Superior Drilling Products Third Quarter 2016 Financial Results Conference Call November 15, 2016 NYSE MKT: SDPI
Slide 2: Safe Harbor Statement
© 2016 Superior Drilling Products 2 Safe Harbor Statement These slides and the accompanying oral presentation contain “forward - looking statements” within the meaning of the safe harbor provisions, 15 U.S.C. † 78u - 5, of the Private Securities Litigation Reform Act of 1995. All statements, other t
Slide 3: Troy Meier, Chairman and Chief Executive Officer
© 2016 Superior Drilling Products Troy Meier Chairman and Chief Executive Officer
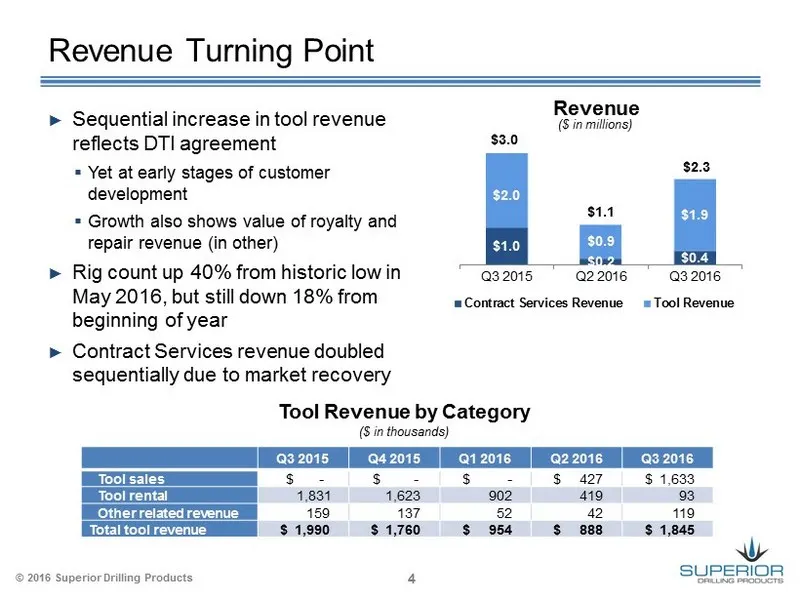
Slide 4: Revenue Turning Point
© 2016 Superior Drilling Products 4 $1.0 $0.2 $0.4 $2.0 $0.9 $1.9 Q3 2015 Q2 2016 Q3 2016 Contract Services Revenue Tool Revenue ($ in millions) Revenue $3.0 $2.3 $ 1.1 ► Sequential increase in tool revenue reflects DTI agreement ▪ Yet at early stages of customer development ▪ Growth also shows valu
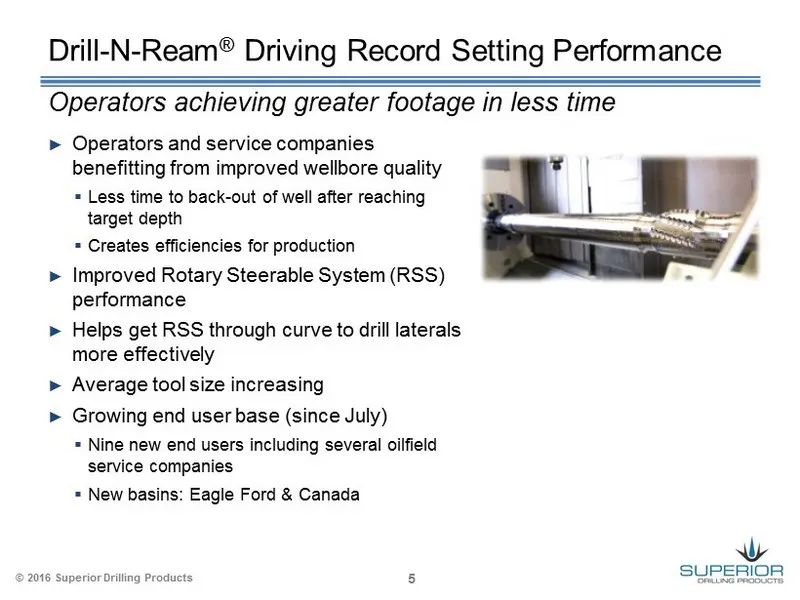
Slide 5: Drill-N-Ream Driving Record Setting Performance
© 2016 Superior Drilling Products 5 ► Operators and service companies benefitting from improved wellbore quality ▪ Less time to back - out of well after reaching target depth ▪ Creates efficiencies for production ► Improved Rotary Steerable System (RSS) performance ► Helps get RSS through curve to d
Slide 6: © 2016 Superior Drilling Products 6
© 2016 Superior Drilling Products 6
Slide 7: Financial Results
© 2016 Superior Drilling Products Financial Results Christopher D. Cashion Chief Financial Officer
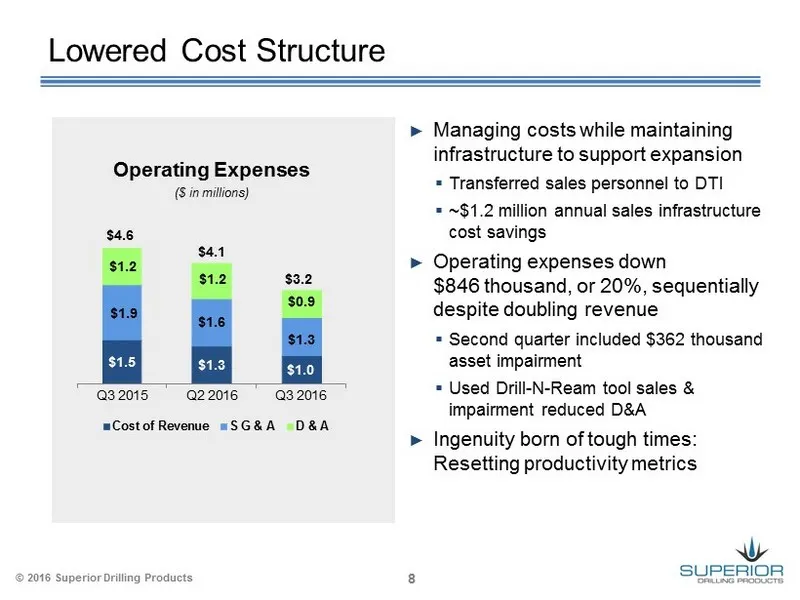
Slide 8: Lowered Cost Structure
© 2016 Superior Drilling Products 8 $1.5 $1.3 $1.0 $1.9 $1.6 $1.3 $1.2 $1.2 $0.9 Q3 2015 Q2 2016 Q3 2016 Cost of Revenue S G & A D & A $ 4.6 $ 3.2 $ 4.1 ($ in millions) Operating Expenses ► Managing costs while maintaining infrastructure to support expansion ▪ Transferred sales personnel to DTI ▪ ~$
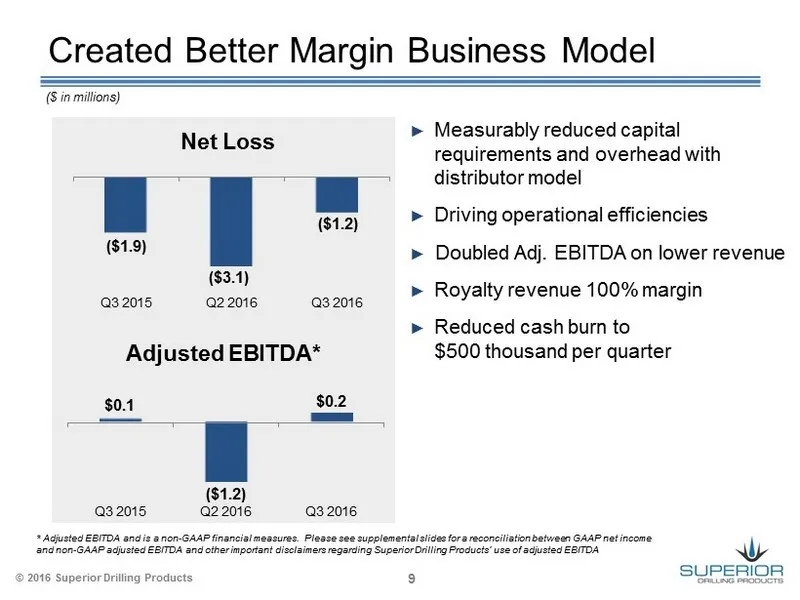
Slide 9: Created Better Margin Business Model
© 2016 Superior Drilling Products 9 Created Better Margin Business Model $0.1 ($1.2) $0.2 Q3 2015 Q2 2016 Q3 2016 Adjusted EBITDA* * Adjusted EBITDA and is a non - GAAP financial measures . Please see supplemental slides for a reconciliation between GAAP net income and non - GAAP adjusted EBITDA and
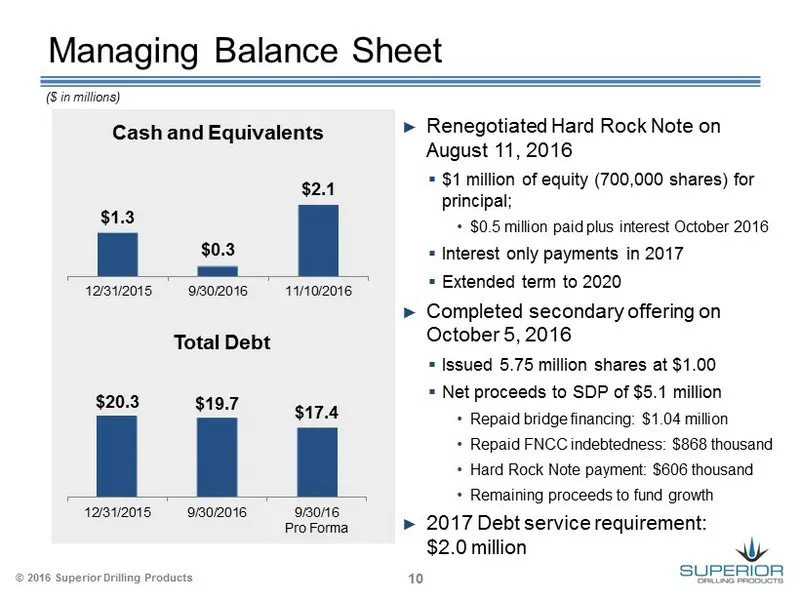
Slide 10: Managing Balance Sheet
© 2016 Superior Drilling Products 10 Managing Balance Sheet Cash and Equivalents Total Debt $20.3 $19.7 $17.4 12/31/2015 9/30/2016 9/30/16 Pro Forma ($ in millions) $1.3 $0.3 $2.1 12/31/2015 9/30/2016 11/10/2016 ► Renegotiated Hard Rock Note on August 11, 2016 ▪ $1 million of equity (700,000 shares)
Slide 11: Overview and Outlook
© 2016 Superior Drilling Products Overview and Outlook Troy Meier Chairman and Chief Executive Officer
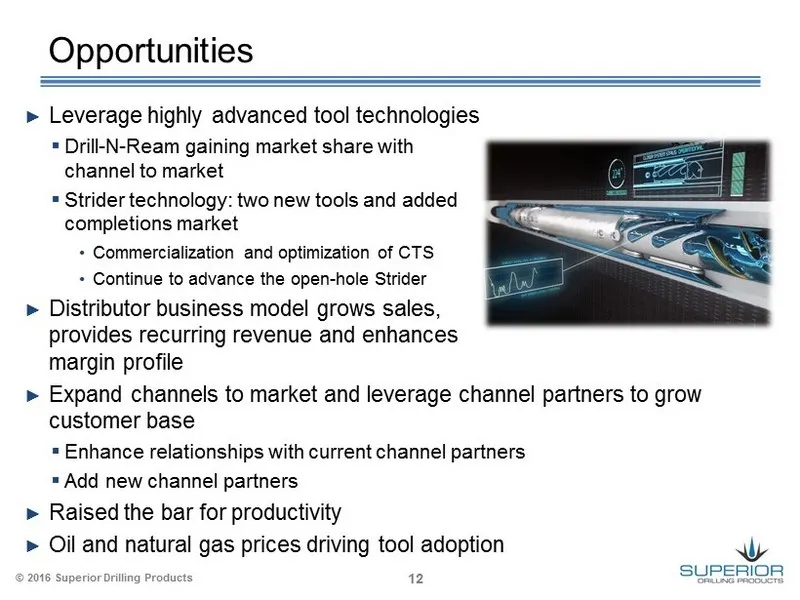
Slide 12: Opportunities
© 2016 Superior Drilling Products 12 Opportunities ► Leverage highly advanced tool technologies ▪ Drill - N - Ream gaining market share with new channel to market ▪ Strider technology: two new tools and added completions market • Commercialization and optimization of CTS • Continue to advance the op
Slide 13: Supplemental Information
© 2016 Superior Drilling Products Supplemental Information
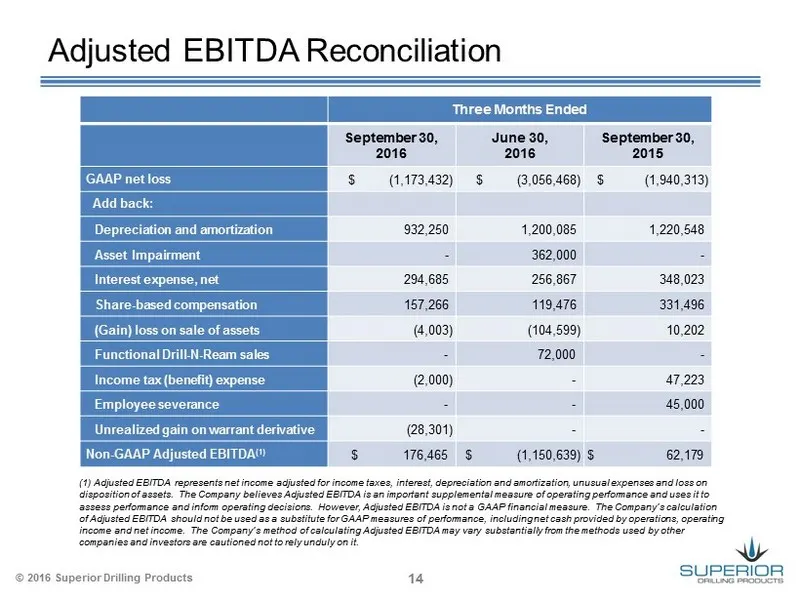
Slide 14: Adjusted EBITDA Reconciliation
© 2016 Superior Drilling Products 14 Adjusted EBITDA Reconciliation (1) Adjusted EBITDA represents net income adjusted for income taxes, interest, depreciation and amortization, unusual expense s a nd loss on disposition of assets. The Company believes Adjusted EBITDA is an important supplemental me
Source: SEC EDGAR · 8-K filed Nov 15, 2016
More decks from Superior Drilling Products Inc
 Q3 2023 Earnings Presentation12 slides · Nov 9, 2023
 Q2 2023 Earnings Presentation12 slides · Aug 14, 2023
 Q1 2023 Earnings Presentation12 slides · May 15, 2023
 FY2022 Earnings Presentation13 slides · Mar 10, 2023
 Q3 2022 Earnings Presentation12 slides · Nov 14, 2022
 MicroCap Rodeo Windy City Roundup 202220 slides · Oct 12, 2022