Superior Drilling Products Inc
Superior Drilling Products — Q2 2019 Earnings Presentation
18 slides from Superior Drilling Products's earnings presentation, Aug 2, 2019

Slide 1: Second Quarter 2019 Preliminary Financial Results Conference Call
Wy SUPERIOR DRILLING PRODUCTS SECOND QUARTER 2019 PRELIMINARY FINANCIAL RESULTS CONFERENCE CALL AueustT 1, 2019 NYSE American: SDPI www.sdpi.com ©2019 Superi
Slide 2: Safe Harbor Statement
SAFE HARBOR STATEMENT These slides and the accompanying oral presentation contain forward-looking statements and information that are subject to a number of risks and uncertainties, many of which are beyond our control. Certain statements in these slides and the accompanying oral presentation may co
Slide 3: Troy Meier, Chairman and Chief Executive Officer
Wy SUPERIOR DRILLING PRODUCTS TROY MEIER CHAIRMAN AND CHIEF EXECUTIVE OFFICER ©2019 Superior Drilling Products
Slide 4: Q2 2019 Operational Highlights
Q2 2019 OPERATIONAL HIGHLIGHTS Made great progress in Middle East * Serving three leading oil field services companies Authorized providers for a national oil company * Strong progress despite religious holiday impact * Added three new staff to the technical team Expanded relationship with Baker Hug
Slide 5: 2H 2019 Progress
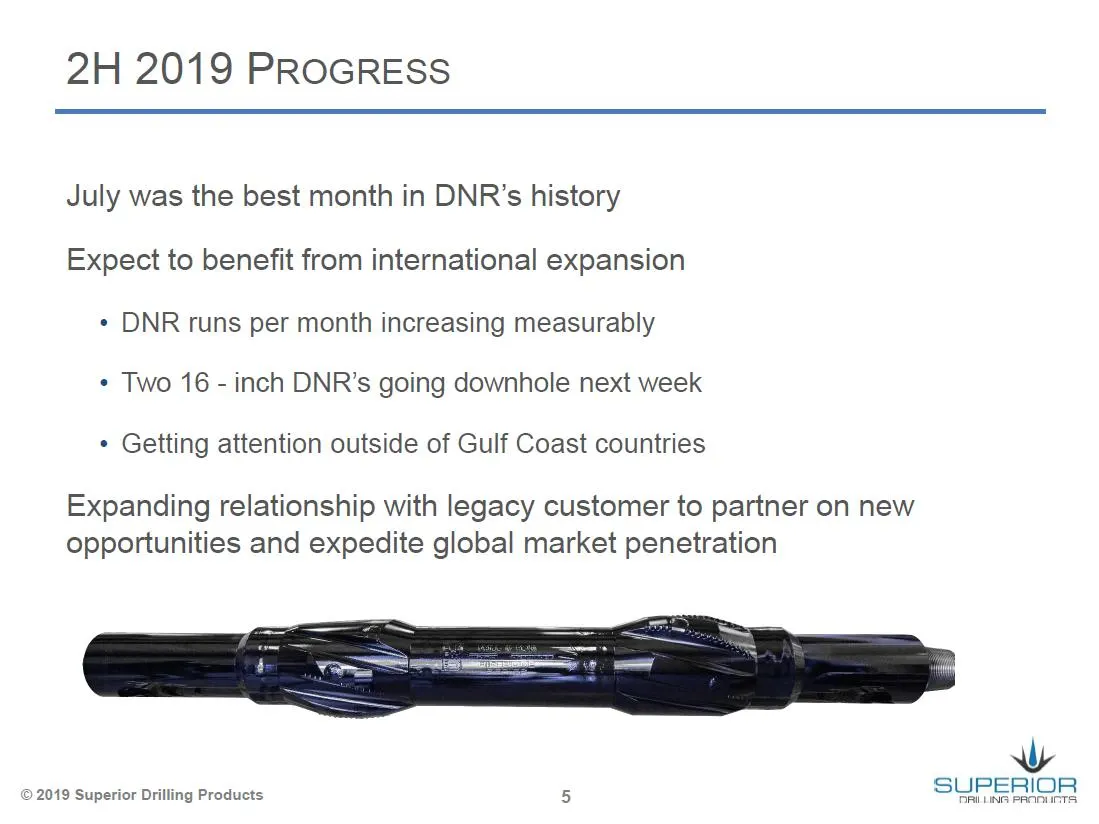
2H 2019 PROGRESS July was the best month in DNR’s history Expect to benefit from international expansion « DNR runs per month increasing measurably * Two 16 - inch DNR’s going downhole next week * Getting attention outside of Gulf Coast countries Expanding relationship with legacy customer to partne
Slide 6: Christopher Cashion, Chief Financial Officer
Wy SUPERIOR DRILLING PRODUCTS CHRISTOPHER CASHION CHIEF FINANCIAL OFFICER
Slide 7: Revenue
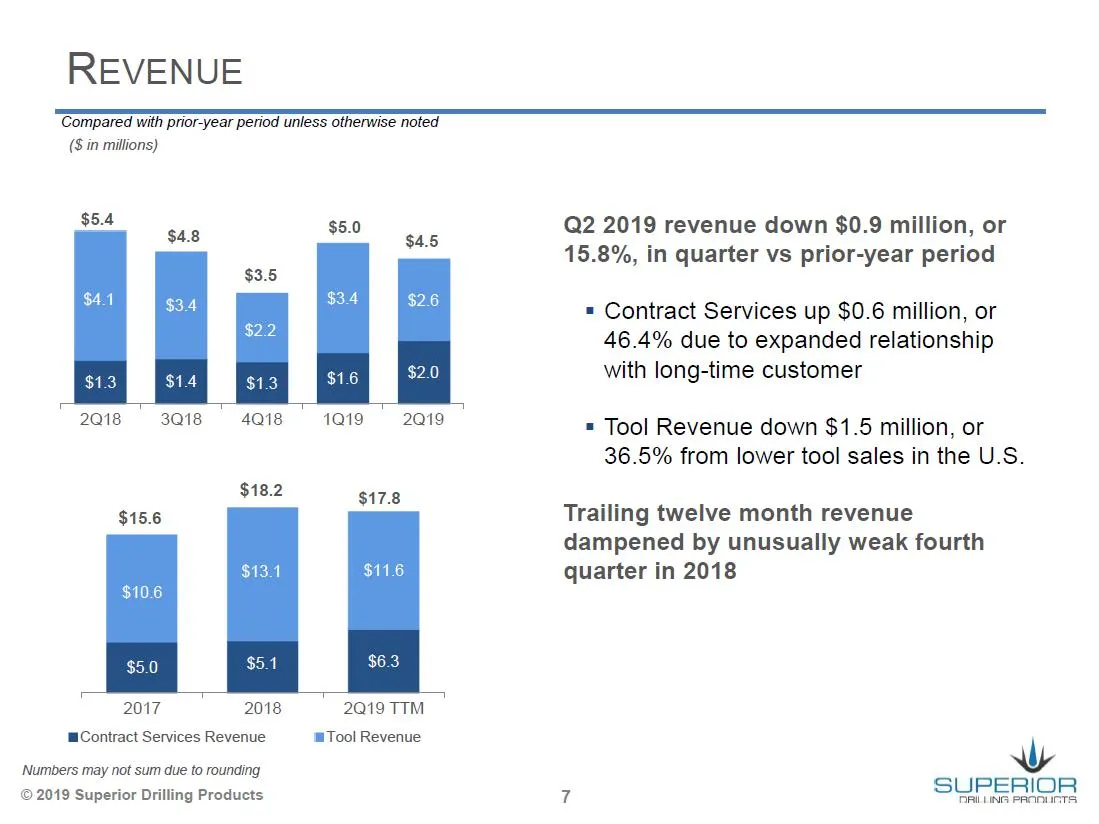
REVENUE ‘Compared with prior-year period unless otherwise noted (8 in millions) $5.4 $5.0 2018 3018 4Q18 1019 2019 $ $17.8 15.6 2017 2018 2Q19 TIM Contract Services Revenue Tool Revenue Numbers may not sum due to rounding © 2019 Superior Drilling Products Q2 2019 revenue down $0.9 million, or 15.8%,
Slide 8: Tool Revenue
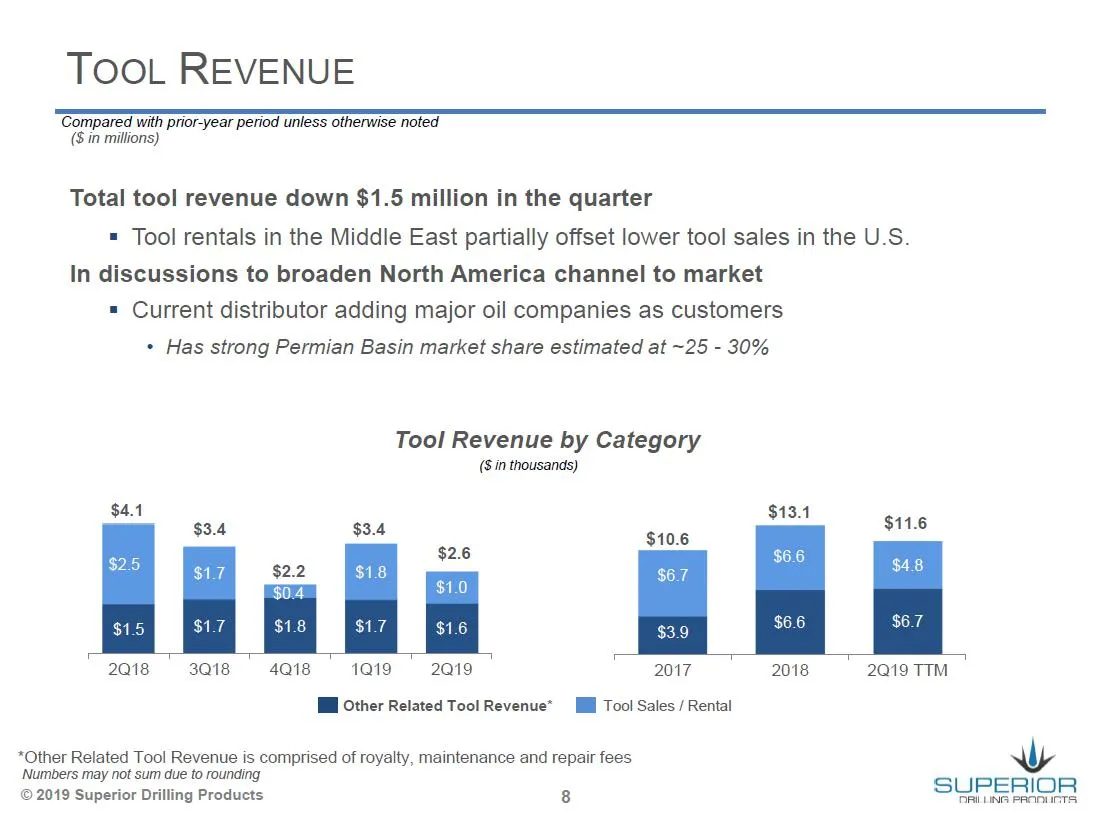
TOOL REVENUE ‘Compared with prior-year period unless otherwise noted ($ in millions) Total tool revenue down $1.5 million in the quarter = Tool rentals in the Middle East partially offset lower tool sales in the U.S. In discussions to broaden North America channel to market = Current distributor add
Slide 9: Investments in Growth
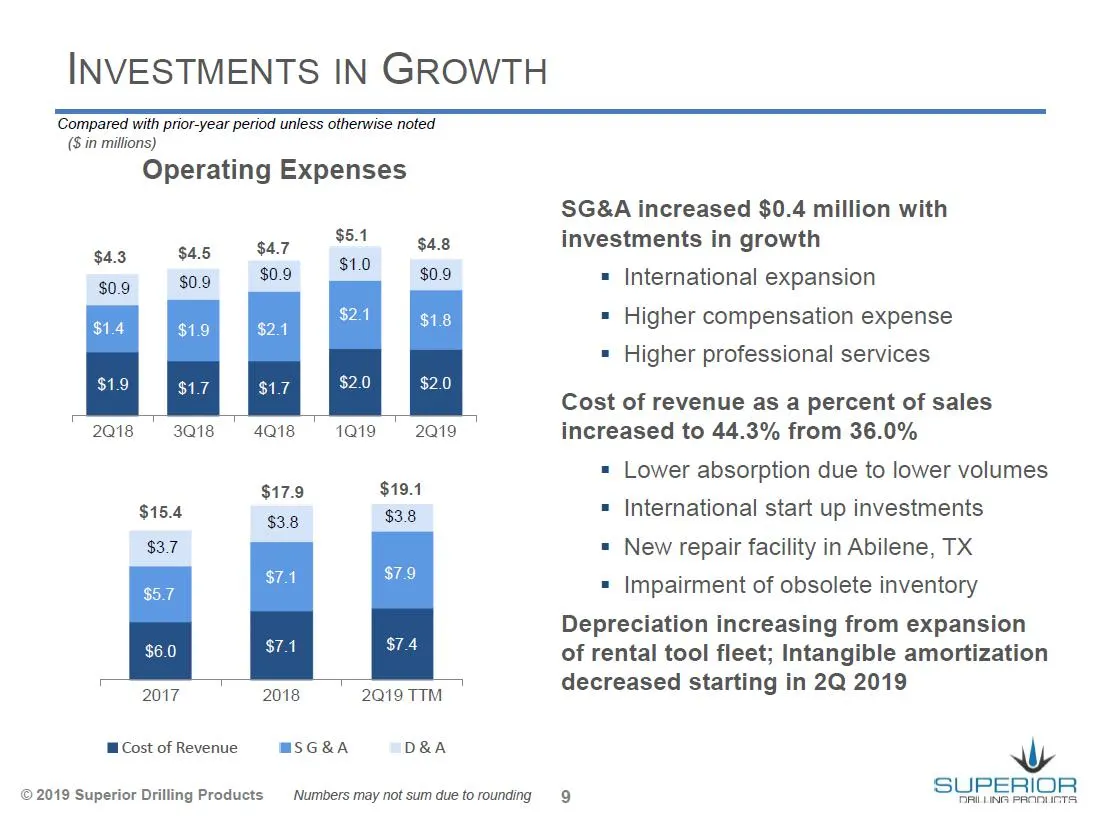
INVESTMENTS IN GROWTH Compared with prior-year period unless otherwise noted (S in millions) Operating Expenses $5.1 $1.0 $4.8 $0.9 $4.7 $0.9 $4.5 $0.9 $4.3 2ais " 3ais " 4ais | 1ai9 * 2019 $19.1 $38 $7.9 $74 “2017 2018 2Q19TTM | Cost of Revenue MSG&A D&A © 2019 Superior Drilling Products Numbers ma
Slide 10: Strong Operating Leverage
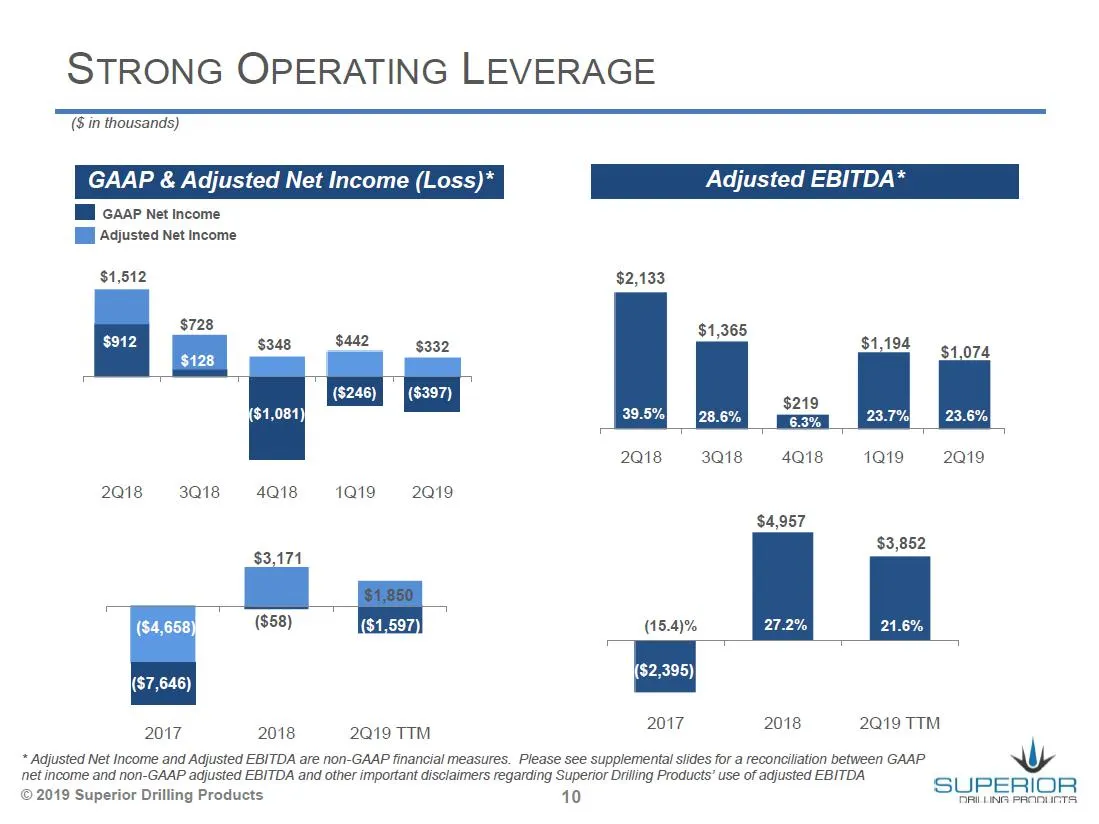
STRONG OPERATING LEVERAGE (Sin thousands) GAAP & Adjusted Net Income (Loss)* Adjusted EBITDA* I caap Net Income [il Adjusted Net Income $1,512 $2,133 ($246) [iI ($397) 2Q18 3018 4Q18 1019 2019 2Q18 3Q18 4Q18 1Q19 2Q19 $4,957 $3,171 Ss852 ($4,658) ($58) (15.4)% 27.2% 21.6% ($7,646) 209 2017 2018 2019
Slide 11: Strengthening Balance Sheet
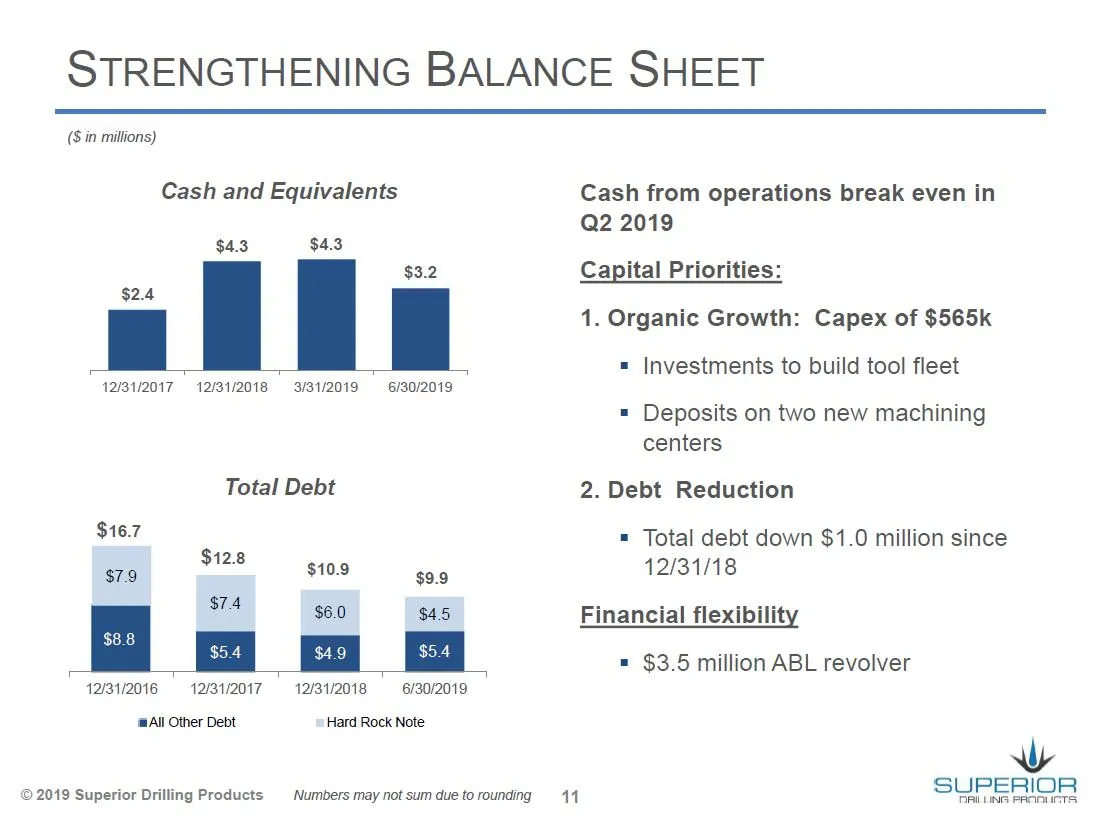
STRENGTHENING BALANCE SHEET (Sin millions) Cash and Equivalents $4.3 $4.3 12/31/2017 12/31/2018 3/31/2019 6/30/2019 Total Debt $16.7 $12.8 $79 $74 12/31/2016 12/31/2017 ‘All Other Debt © 2019 Superior Drilling Products 12/31/2018 6/30/2019 Hard Rock Note ‘Numbers may not sum due to rounding Cash fro
Slide 12: Restatement of Financials
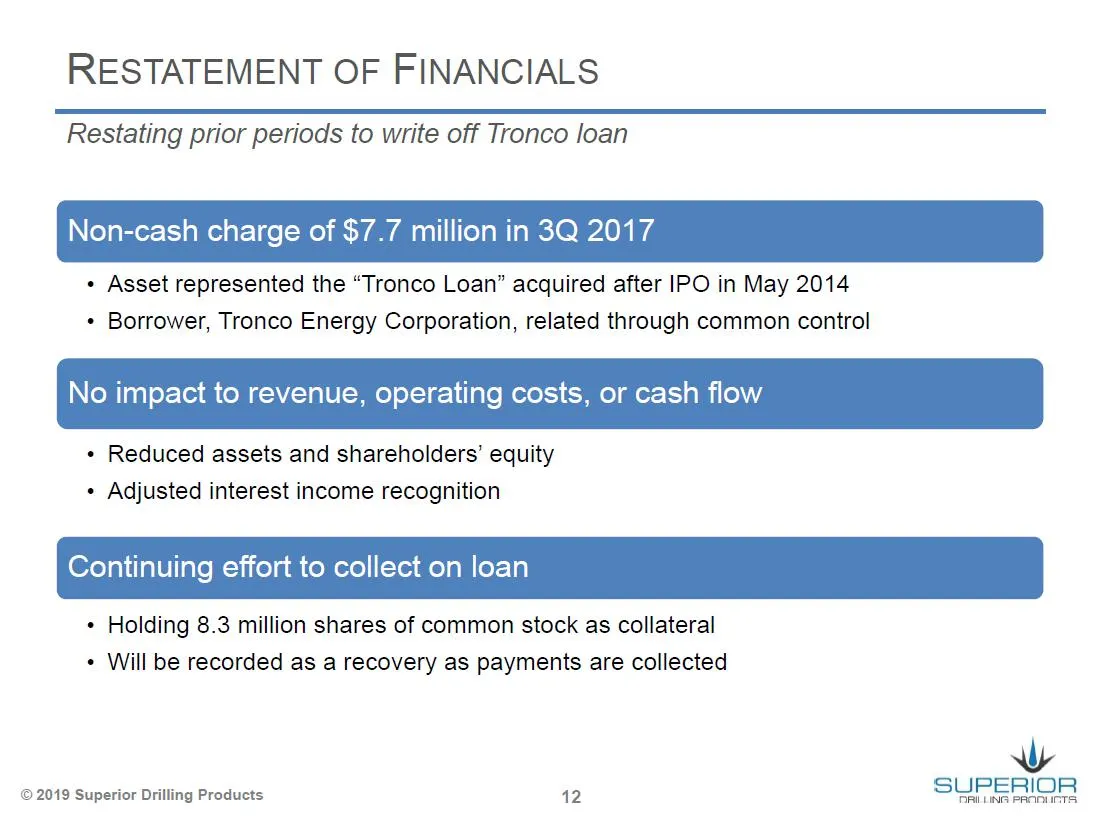
RESTATEMENT OF FINANCIALS Restating prior periods to write off Tronco loan Non-cash charge of $7.7 million in 3Q 2017 + Asset represented the “Tronco Loan” acquired after IPO in May 2014 + Borrower, Tronco Energy Corporation, related through common control No impact to revenue, operating costs, or c
Slide 13: 2019 Updated Guidance
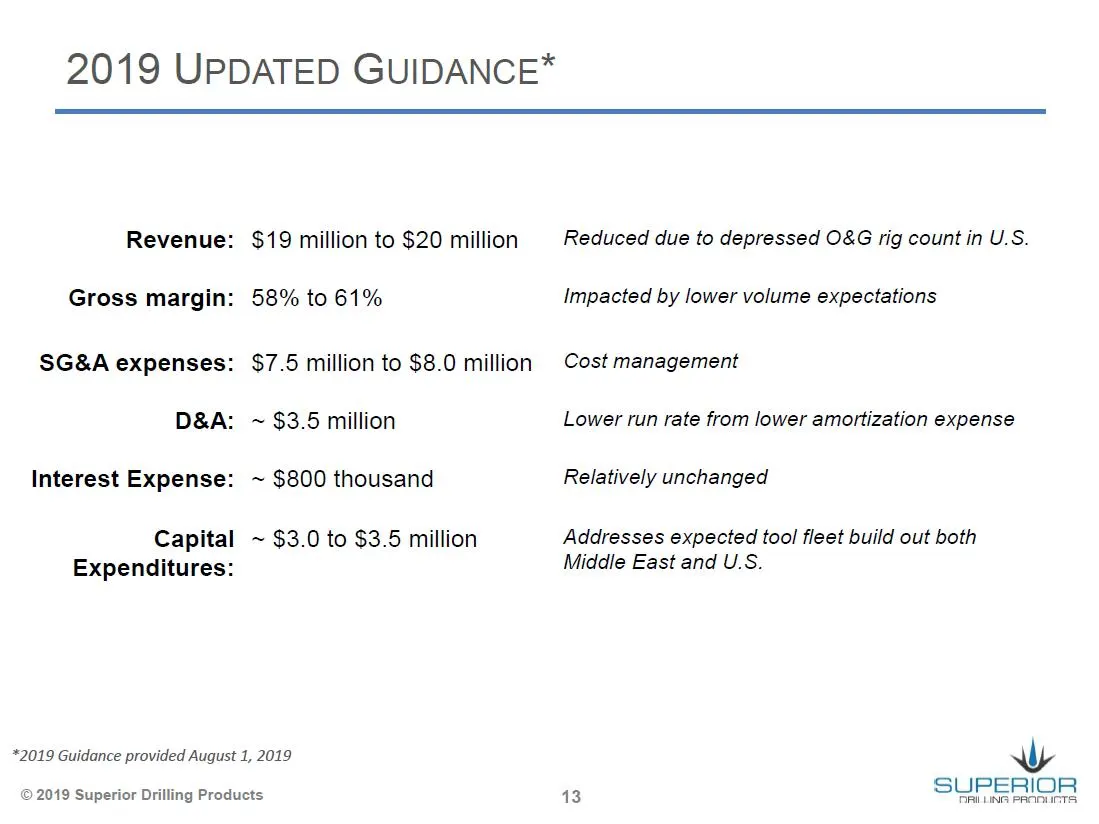
2019 UPDATED GUIDANCE* Revenue: $19 million to $20 million Gross margin: 58% to 61% SG&A expenses: $7.5 million to $8.0 million D&A: ~ $3.5 million Interest Expense: ~ $800 thousand Capital ~ $3.0 to $3.5 million Expenditures: *2019 Guidance provided August 1, 2019 © 2019 Superior Drilling Products
Slide 14: Supplemental Information
Wy SUPERIOR DRILLING PRODUCTS SUPPLEMENTAL INFORMATION
Slide 15: Adjusted Net Income Reconciliation
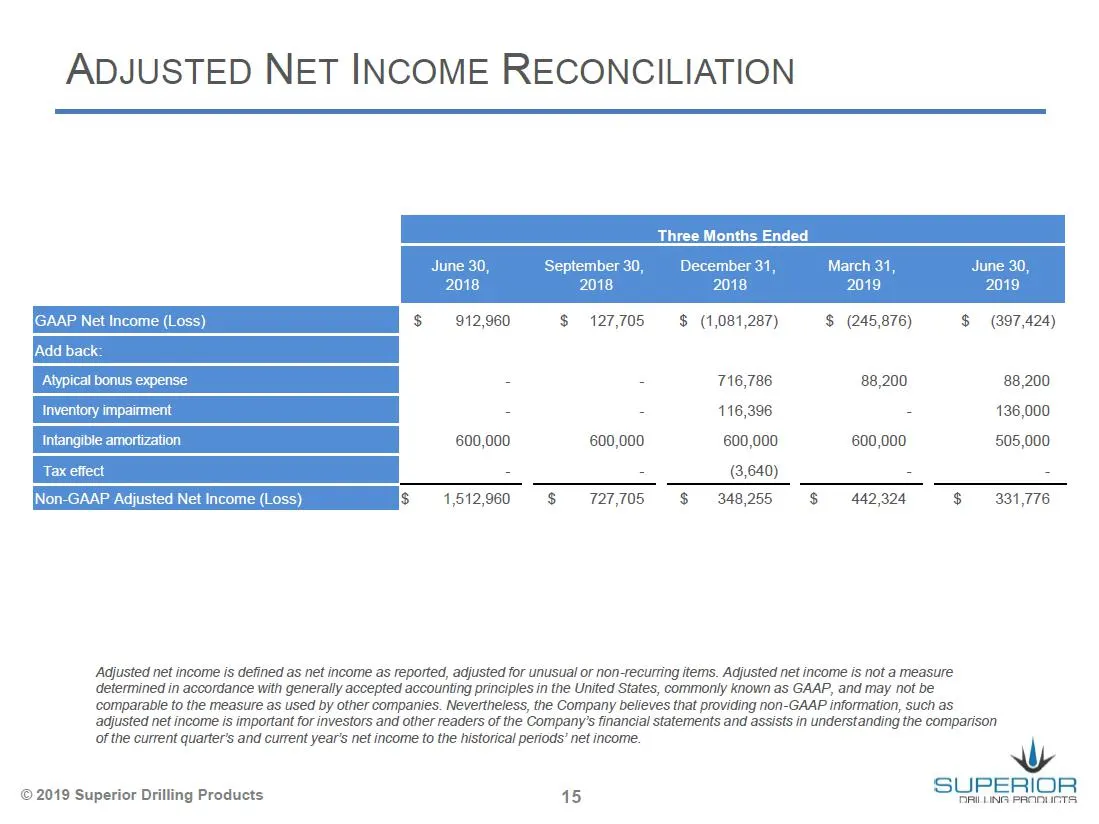
ADJUSTED NET INCOME RECONCILIATION $ 912,960 $ 127,705 — $ (1,081,287) $ (245,876) $ (397,424) T9708 som0 8200 600,000 600,000 600,000 600,000 505,000 x (3,640) z = 1,512,960 $ 727,705 $ 348,255 $ 442,324 $ 331,776 Adjusted net income is defined as net income as reported, adjusted for unusual or non
Slide 16: Adjusted Net Income Reconciliation
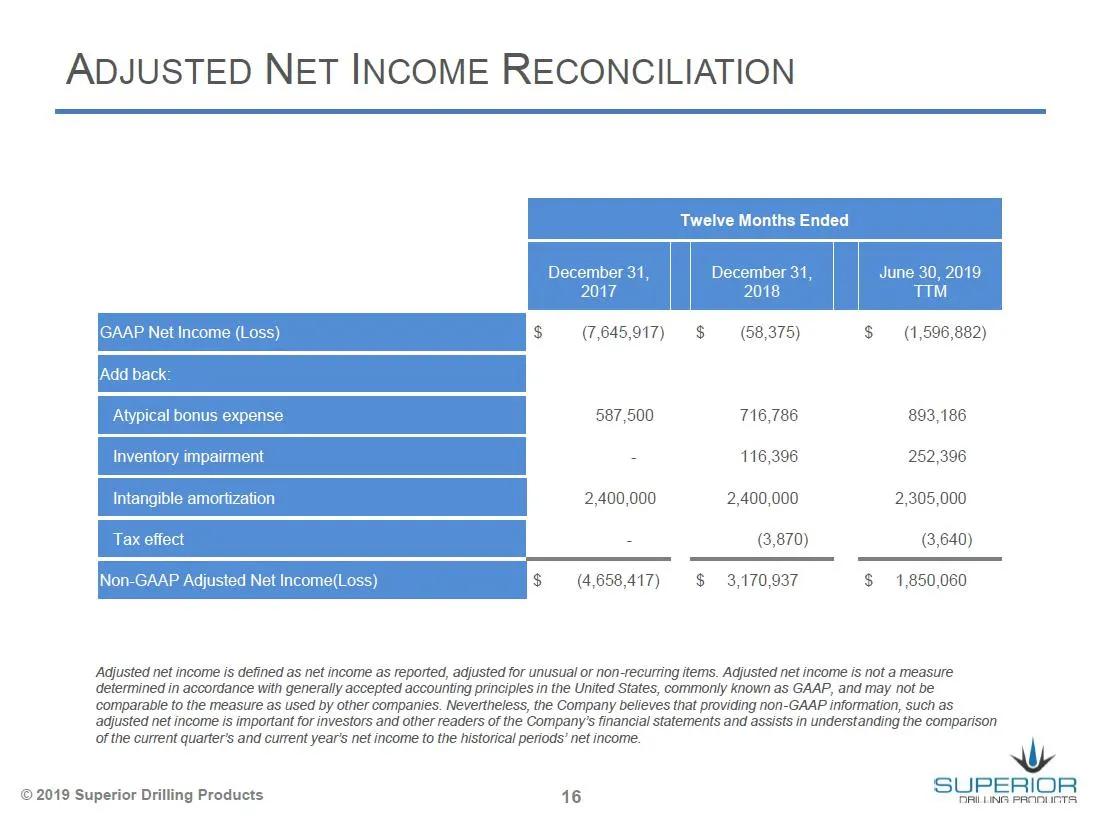
ADJUSTED NET INCOME RECONCILIATION Twelve Months Ended June 30, 2019 TIM $ (7,645,917) $ (58,375) $ (1,596,882) fw Intangi 2,400,000 2,400,000 2,305,000 (3,870) (3,640) $ (4,658,417) $ 3,170,937 $ 1,850,060 Adjusted net income is defined as net income as reported, adjusted for unusual or non-recurri
Slide 17: Adjusted EBITDA Reconciliation
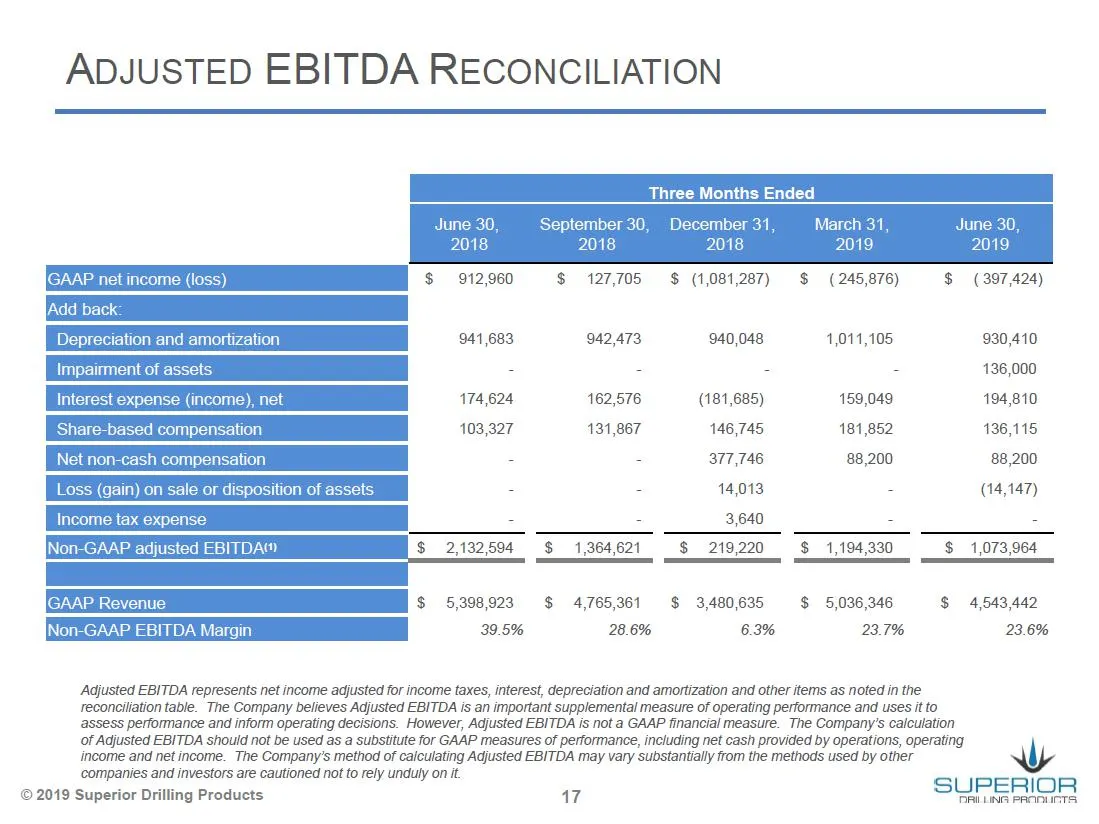
ADJUSTED EBITDA RECONCILIATION Three Months Ended June 30, September 30, or 31, y St, June 30, 2018 2018 2019 |GAAP net income (los: $ 912,960 $ 127,705 $ (1,081,287) $ (245,876) $ (397,424) Add k: D 941 683 942,473 940,048 4,011,105 930,410 - - - - 136,000 174,624 162,578 (181,685) 189,049 194,810
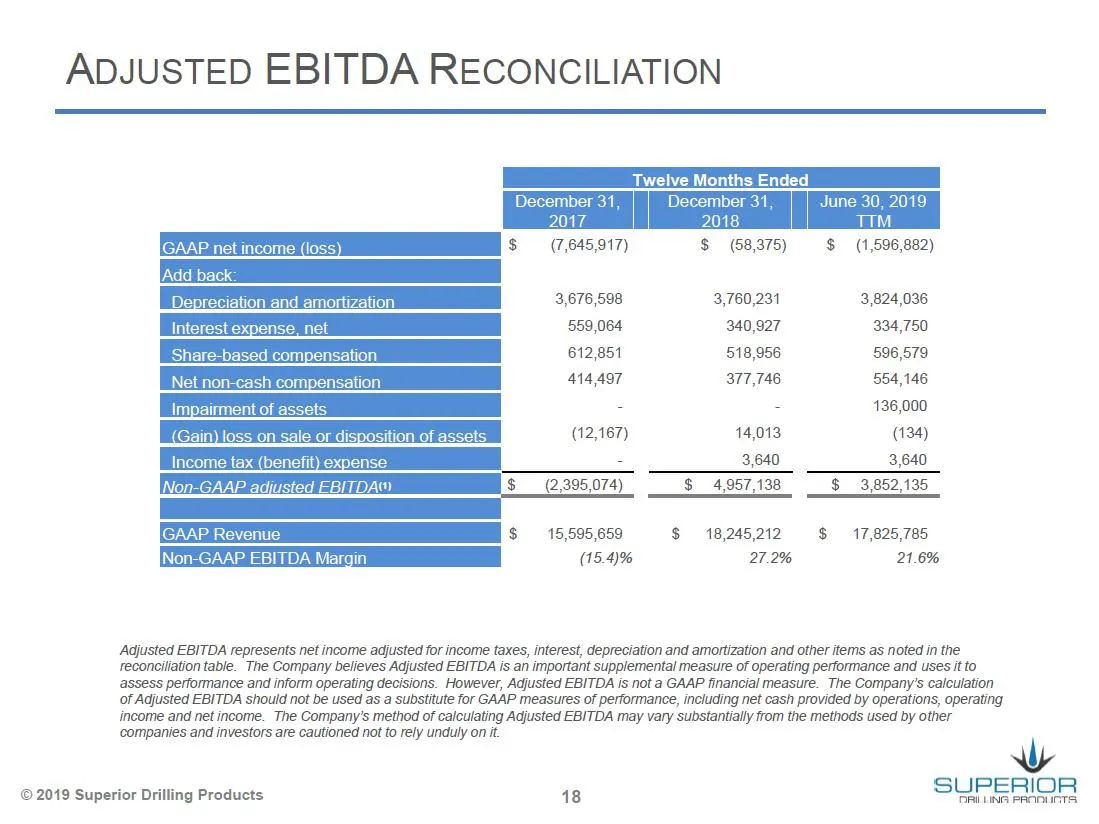
Slide 18: Adjusted EBITDA Reconciliation
ADJUSTED EBITDA RECONCILIATION $ $ (58,375) (1,596,882) 3,676,598 3,760,231 3,824,036 559,064 340,927 334,750 612,851 518,956 596,579 414,497 377,746 554,146 2 2 136,000 (12,167) 14,013 (134) = 3,840 3,640 IGAAP Revenue see $ 18,245,212 $ 17,825,785 (15.49% 27.2% 21.6% Adjusted EBITDA represents net
Source: SEC EDGAR · 8-K filed Aug 2, 2019
More decks from Superior Drilling Products Inc
 Q3 2023 Earnings Presentation12 slides · Nov 9, 2023
 Q2 2023 Earnings Presentation12 slides · Aug 14, 2023
 Q1 2023 Earnings Presentation12 slides · May 15, 2023
 FY2022 Earnings Presentation13 slides · Mar 10, 2023
 Q3 2022 Earnings Presentation12 slides · Nov 14, 2022
 MicroCap Rodeo Windy City Roundup 202220 slides · Oct 12, 2022