Dye & Durham Ltd. · TSX:DND
Dye & Durham — Investor Presentation (March 2021)
10 slides from Dye & Durham's investor presentation, March 2021

Slide 1: Investor Presentation March 2021
Investor Presentation March 2021
Slide 2: Disclaimer
Disclaimer Forward-Looking Statements This presentation contains forward-looking statements that relate to the Company’s current expectations and views of future events. In some cases, these forward-looking statements can be identified by words or phrases such as ‘‘forecast’’, ‘‘target’’, ‘‘goal’’,
Slide 3: Dye & Durham's Platform is a one-stop legal gateway to public records data
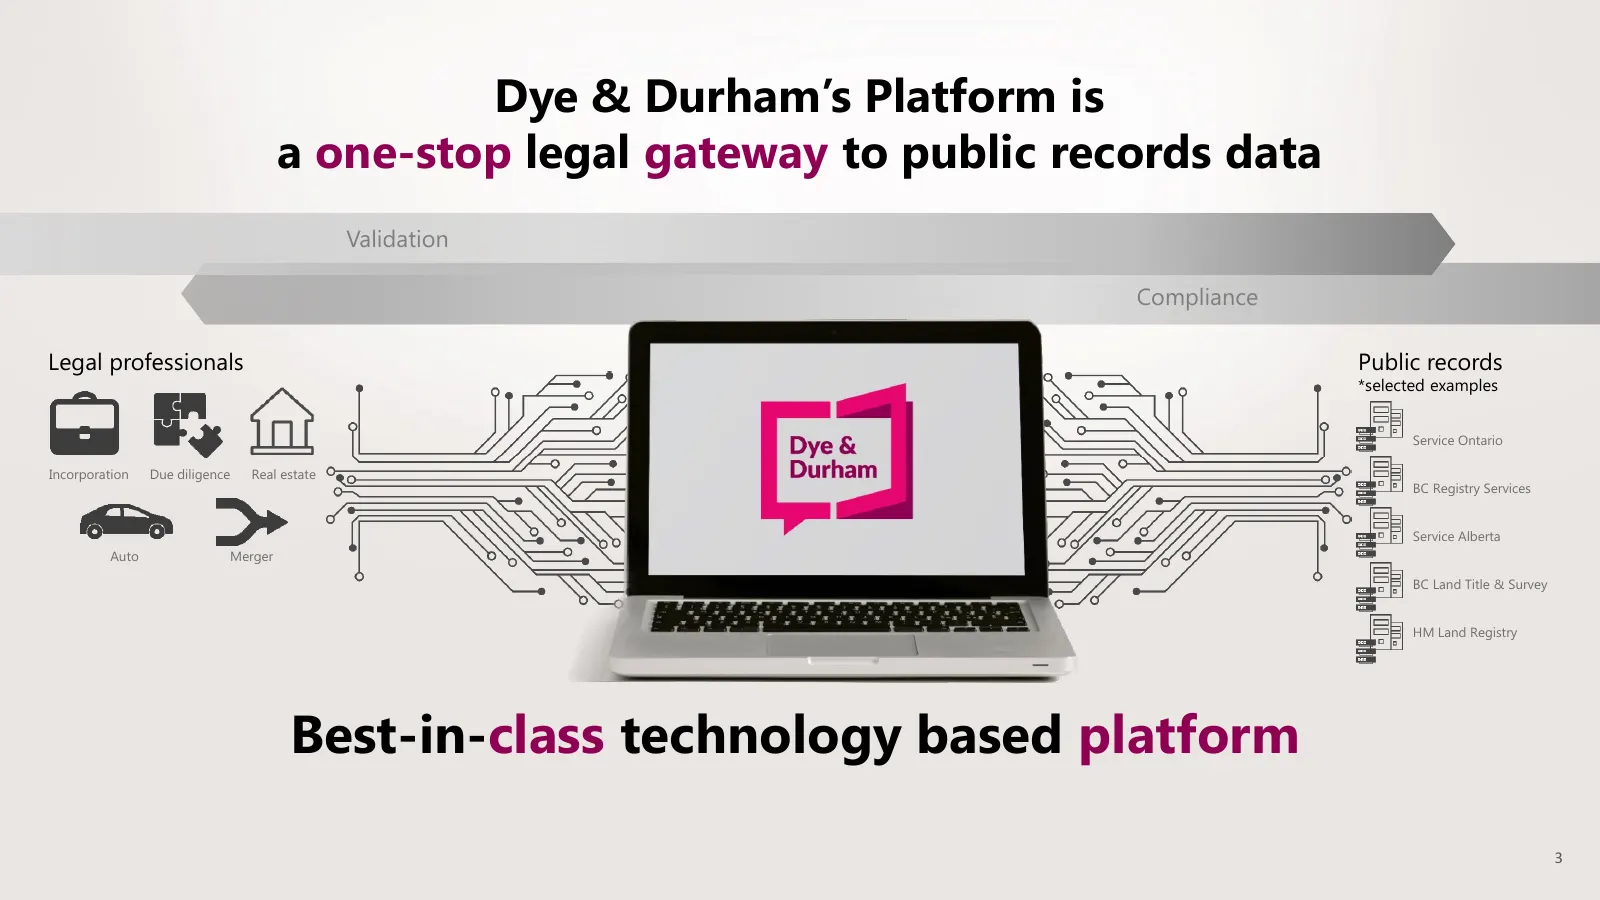
Dye & Durham’s Platform is a one-stop legal gateway to public records data Validation Compliance Legal professionals Public records *selected examples Service Ontario Incorporation Due diligence Real estate BC Registry Services Service Alberta Auto Merger BC Land Title & Survey HM Land Registry Best
Slide 4: Large & Diverse Customer Base with Significant Room for Growth
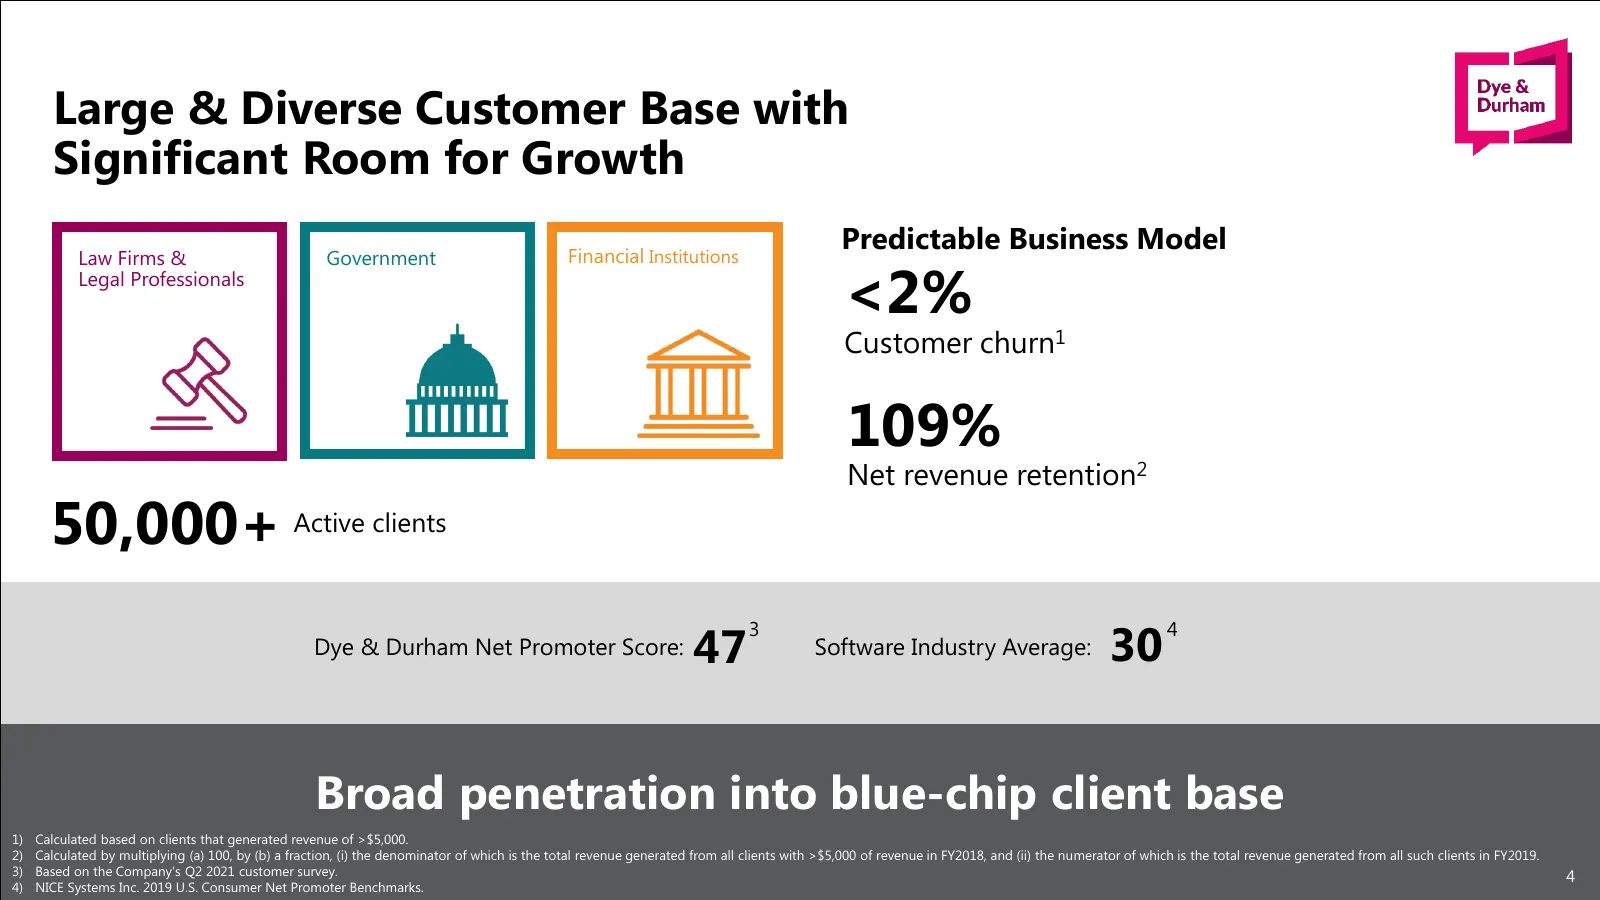
Large & Diverse Customer Base with Significant Room for Growth Financial Institutions Predictable Business Model Law Firms & Government Legal Professionals <2% Customer churn1 109% Net revenue retention2 50,000+ Active clients 47 30 3 4 Dye & Durham Net Promoter Score: Software Industry Average: Bro
Slide 5: Essential Service to Our Customers
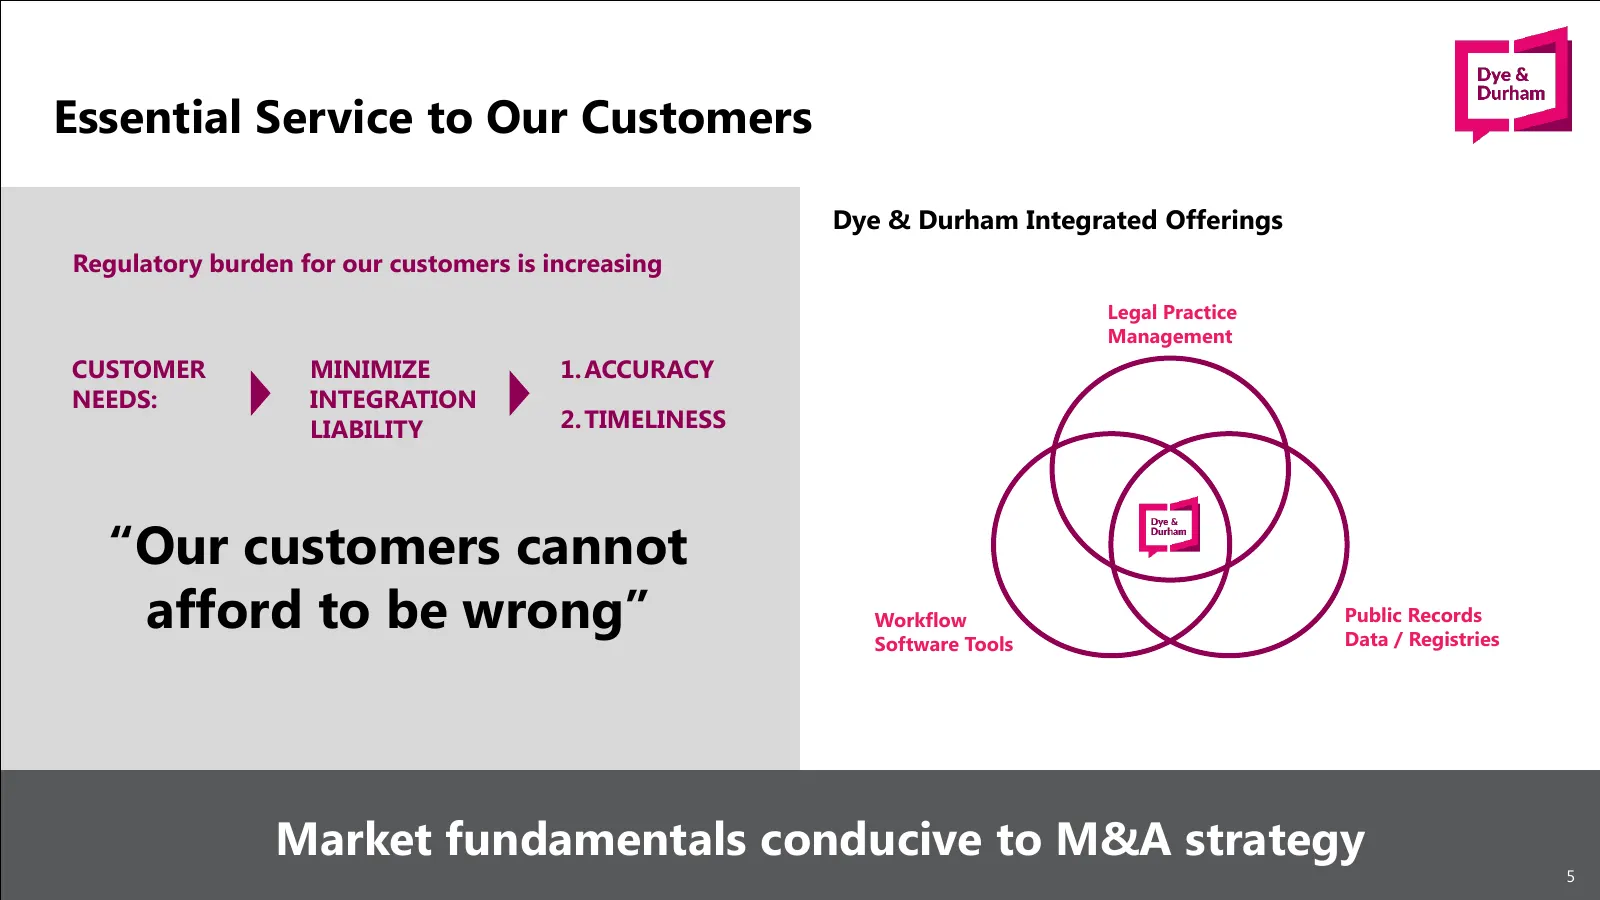
Essential Service to Our Customers Dye & Durham Integrated Offerings Regulatory burden for our customers is increasing Legal Practice Management CUSTOMER MINIMIZE 1. ACCURACY NEEDS: INTEGRATION LIABILITY 2. TIMELINESS “Our customers cannot afford to be wrong” Workflow Software Tools Public Records D
Slide 6: Attractive Consolidation Platform
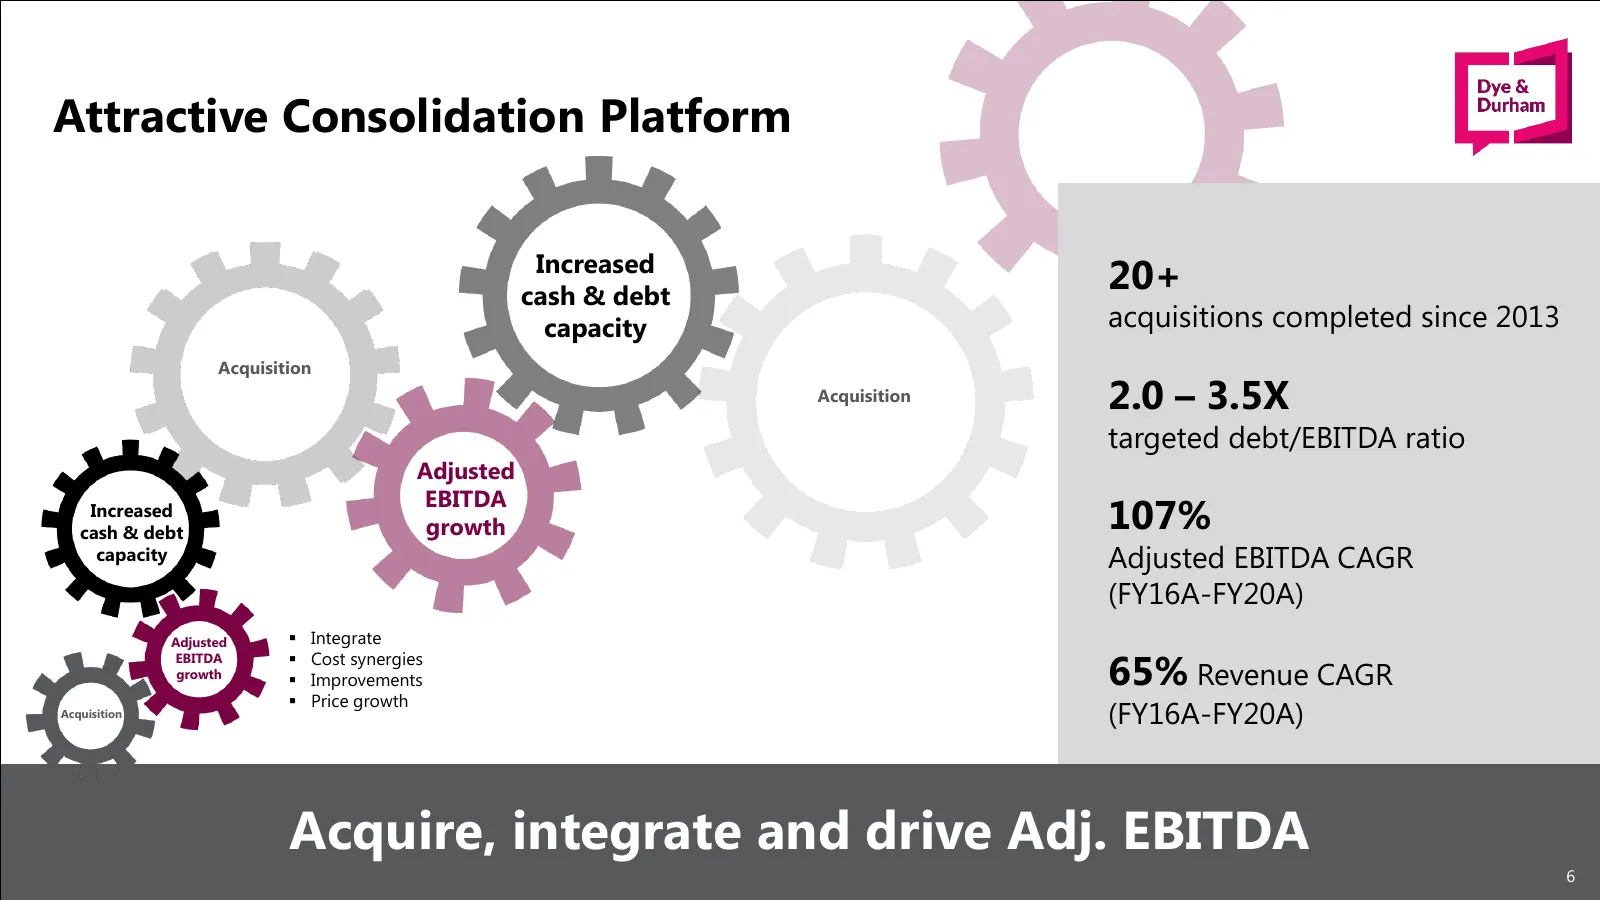
Attractive Consolidation Platform Increased cash & debt 20+ capacity acquisitions completed since 2013 Acquisition Acquisition 2.0 – 3.5X targeted debt/EBITDA ratio Adjusted EBITDA Increased cash & debt growth 107% capacity Adjusted EBITDA CAGR (FY16A-FY20A) Adjusted ▪ Integrate 65% Revenue CAGR EBI
Slide 7: High Growth, High-margin Business
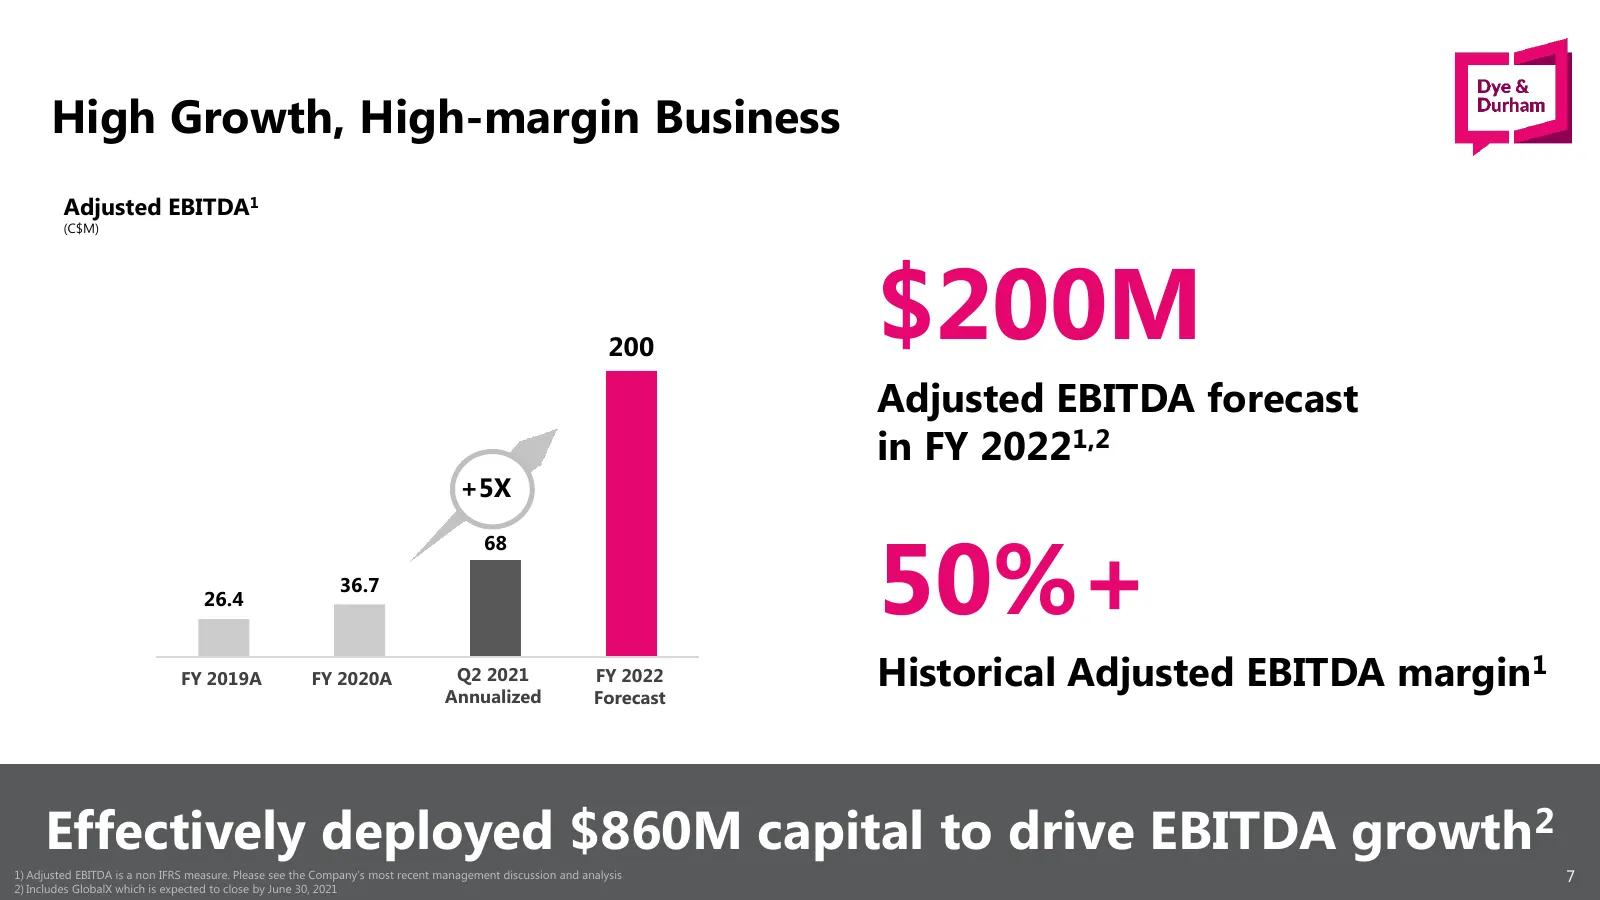
High Growth, High-margin Business Adjusted EBITDA1 (C$M) 200 $200M Adjusted EBITDA forecast in FY 20221,2 +5X 50%+ 68 36.7 26.4 FY 2019A FY 19 FY 2020A FY 20 Q2 Q2 FY 212021 Annualized Annualized FY FY 20222022 Forecast Forecast Historical Adjusted EBITDA margin1 Effectively deployed $860M capital t
Slide 8: Delivering on our Commitments
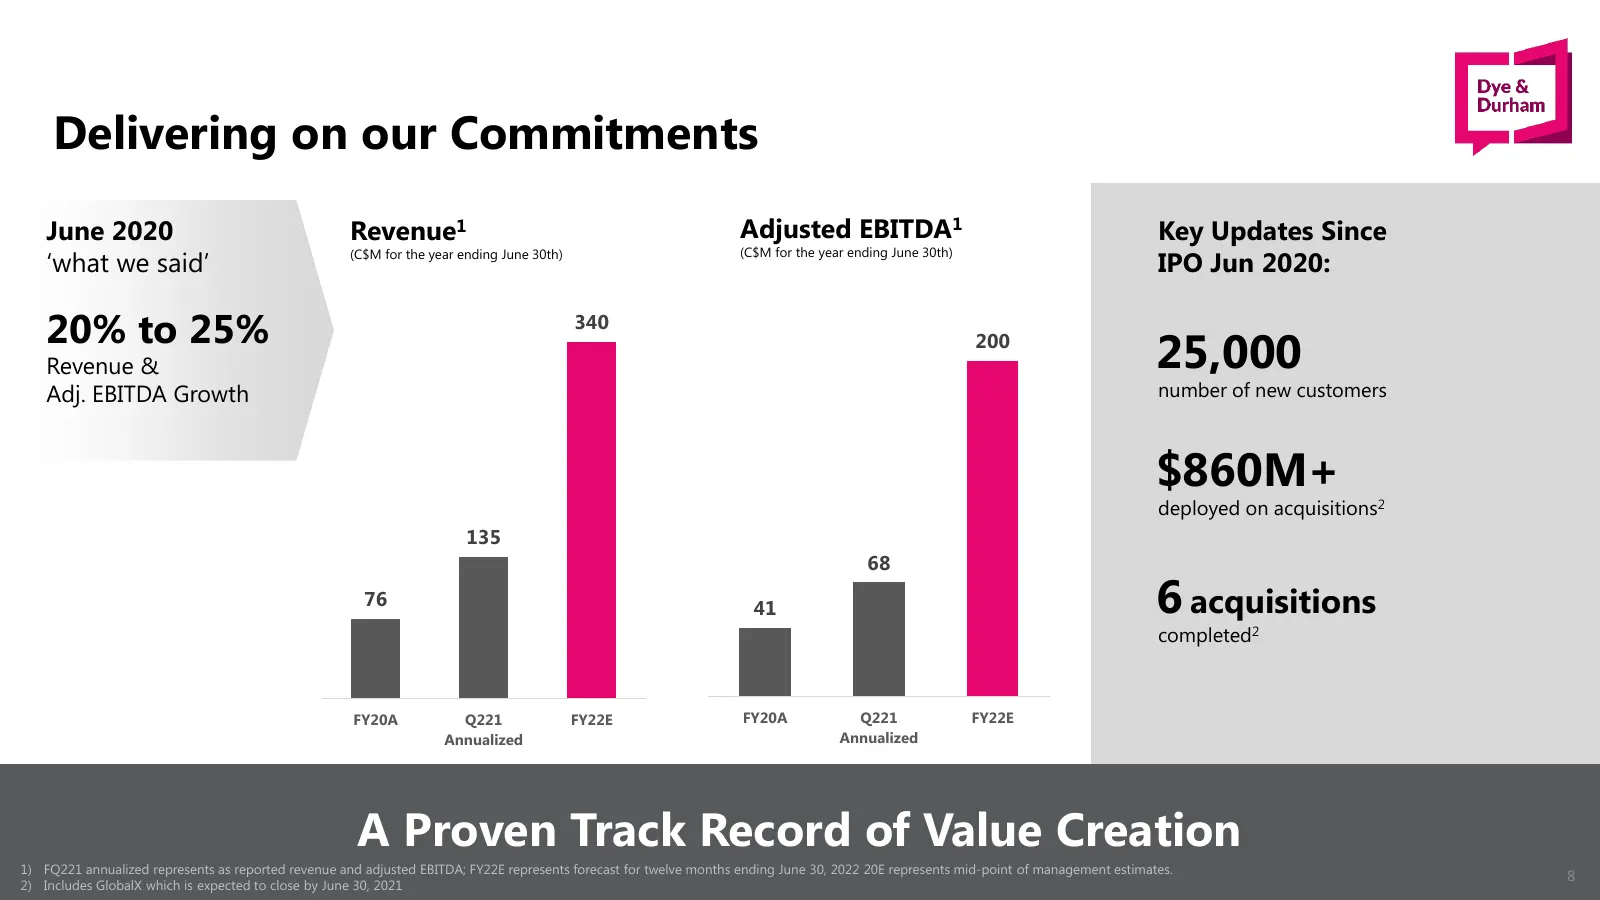
Delivering on our Commitments June 2020 Revenue1 Adjusted EBITDA1 Key Updates Since (C$M for the year ending June 30th) ‘what we said’ (C$M for the year ending June 30th) IPO Jun 2020: 20% to 25% 340 Revenue & 200 25,000 Adj. EBITDA Growth number of new customers $860M+ deployed on acquisitions2 135
Slide 9: Geographic Overview
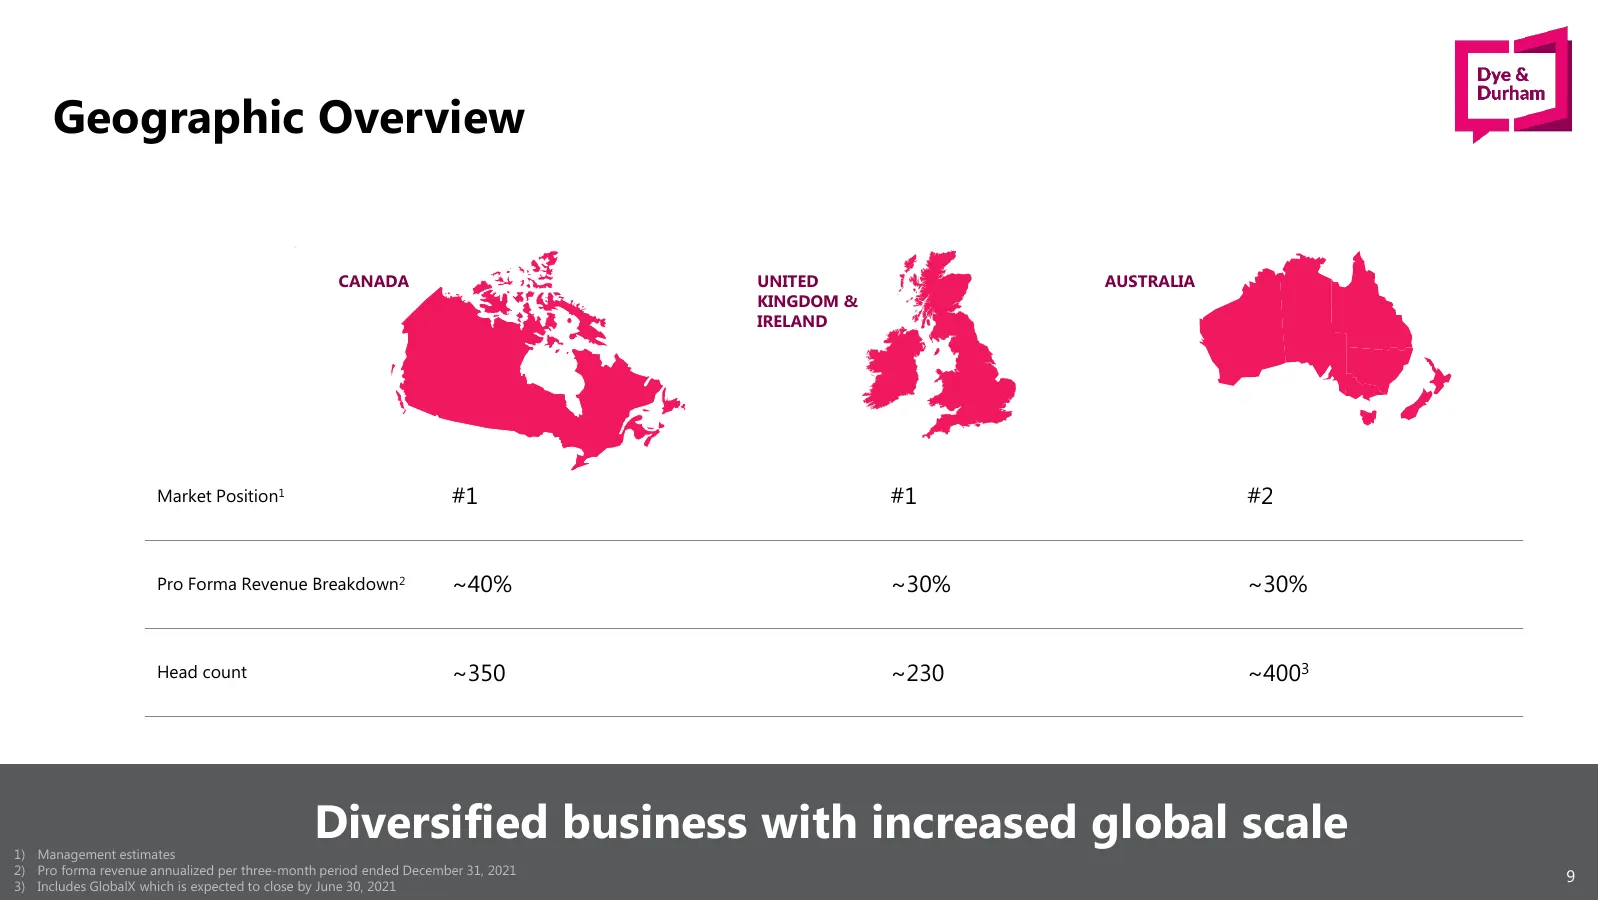
Geographic Overview CANADA UNITED AUSTRALIA KINGDOM & IRELAND Market Position1 #1 #1 #2 Pro Forma Revenue Breakdown2 ~40% ~30% ~30% Head count ~350 ~230 ~4003 1) Management estimates Diversified business with increased global scale 2) Pro forma revenue annualized per three-month period ended Decembe
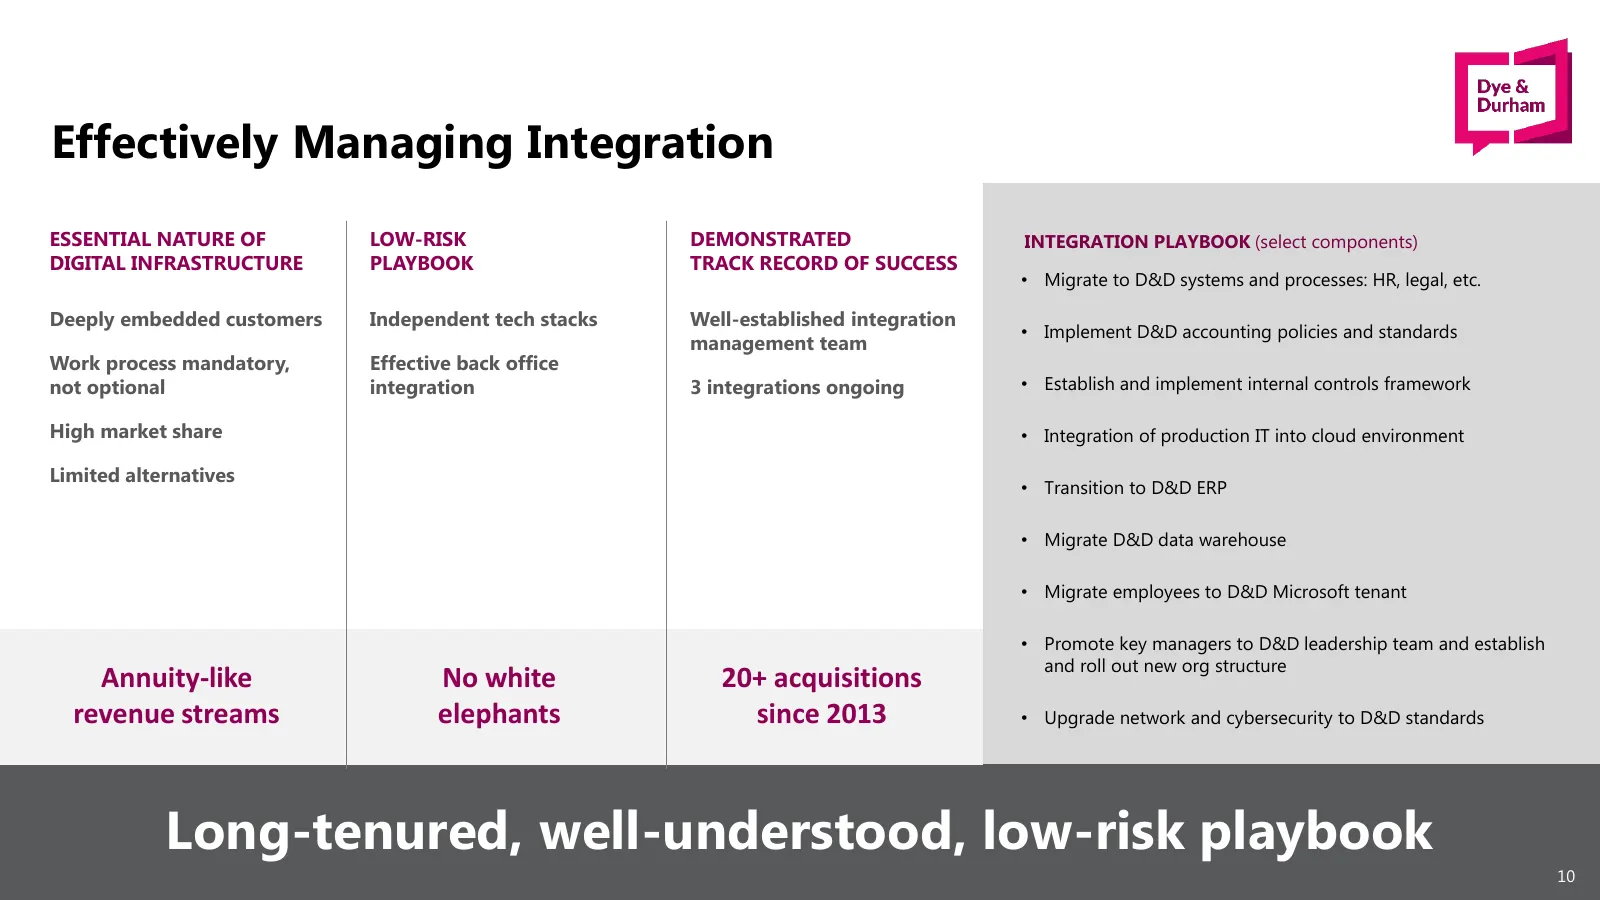
Slide 10: Effectively Managing Integration
Effectively Managing Integration ESSENTIAL NATURE OF LOW-RISK DEMONSTRATED INTEGRATION PLAYBOOK (select components) DIGITAL INFRASTRUCTURE PLAYBOOK TRACK RECORD OF SUCCESS • Migrate to D&D systems and processes: HR, legal, etc. Deeply embedded customers Independent tech stacks Well-established integ
Source: Internet Archive copy of dyedurham.com
More decks from Dye & Durham Ltd.
 Q4 2026 Earnings Presentation11 slides · Sep 30, 2026
 Q3 FY2026 Earnings Presentation12 slides · May 19, 2026
 Q2 2026 Earnings Presentation18 slides · Feb 17, 2026
 Q3 2025 Earnings Presentation17 slides · May 13, 2025
 Q2 FY2025 Earnings Presentation15 slides · Feb 13, 2025
 Proxy Contest (December 2024)85 slides · Dec 10, 2024