Smu SA · BCS:SMU
Smu SA — Investor Presentation (May 2025)
30 slides from Smu SA's investor presentation, May 2025
Slide 1: Corporate Presentation May 2025
Corporate Presentation May 2025
Slide 2: Caution Regarding Forward-Looking Statements
CAUTION REGARDING FORWARD-LOOKING STATEMENTS This presentation contains forward-looking statements. We have By their very nature, forward-looking statements involve inherent based all forward-looking statements largely on our current beliefs, risks and uncertainties, both general and specific, and r
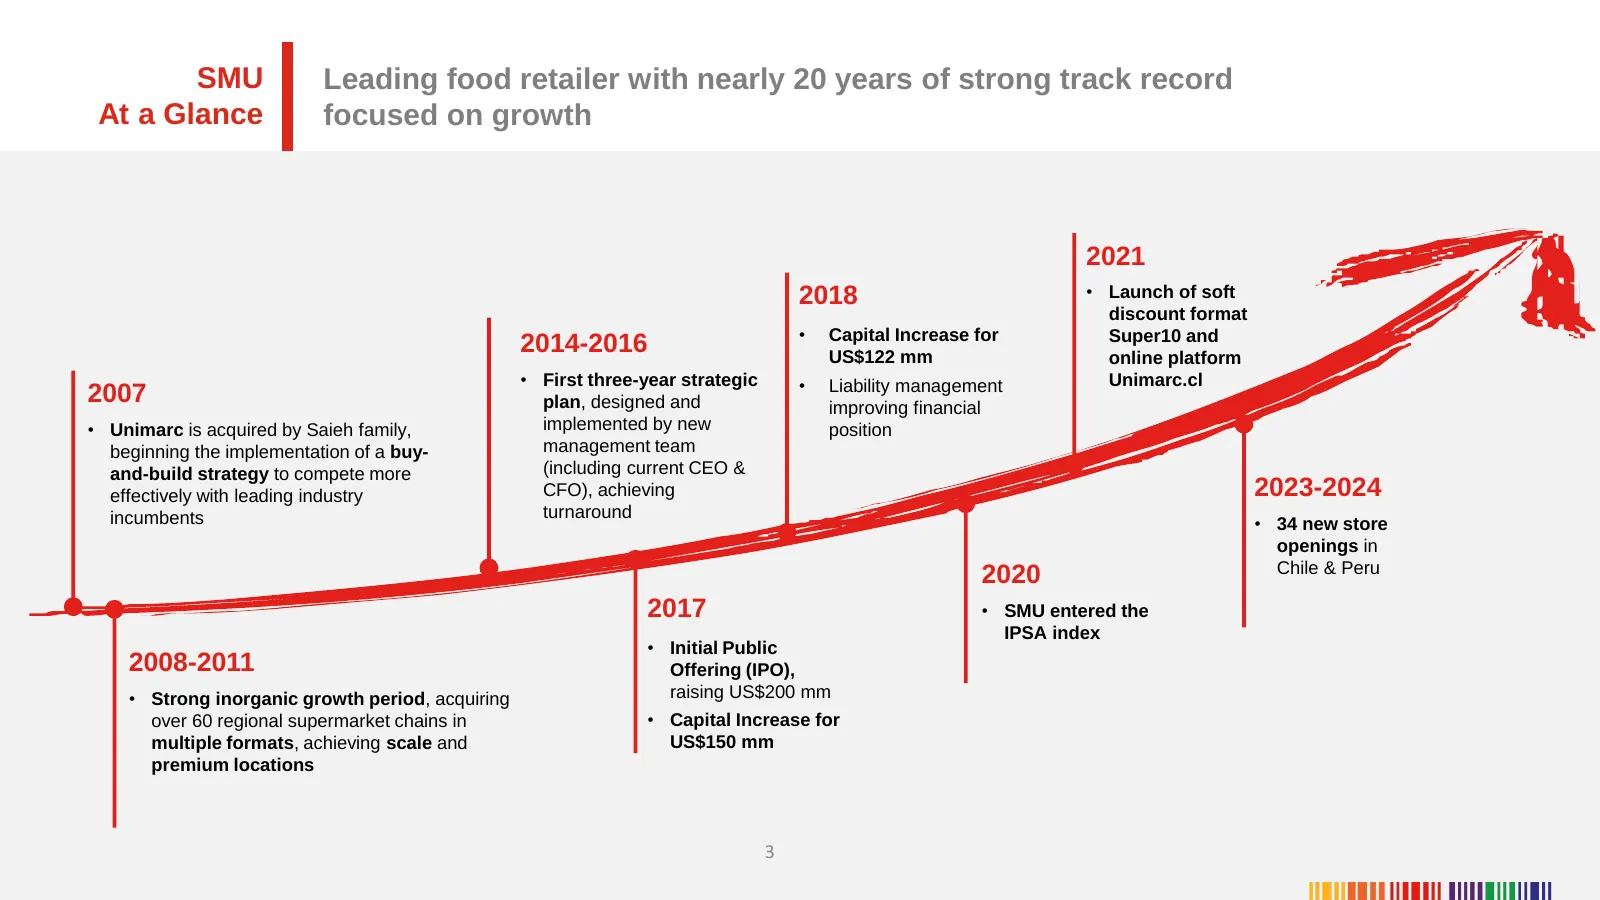
Slide 3: SMU At a Glance: Leading food retailer with nearly 20 years of track record
SMU Leading food retailer with nearly 20 years of strong track record At a Glance focused on growth 2021 2018 • Launch of soft discount format • Capital Increase for Super10 and 2014-2016 US$122 mm online platform • First three-year strategic • Liability management Unimarc.cl 2007 plan, designed and
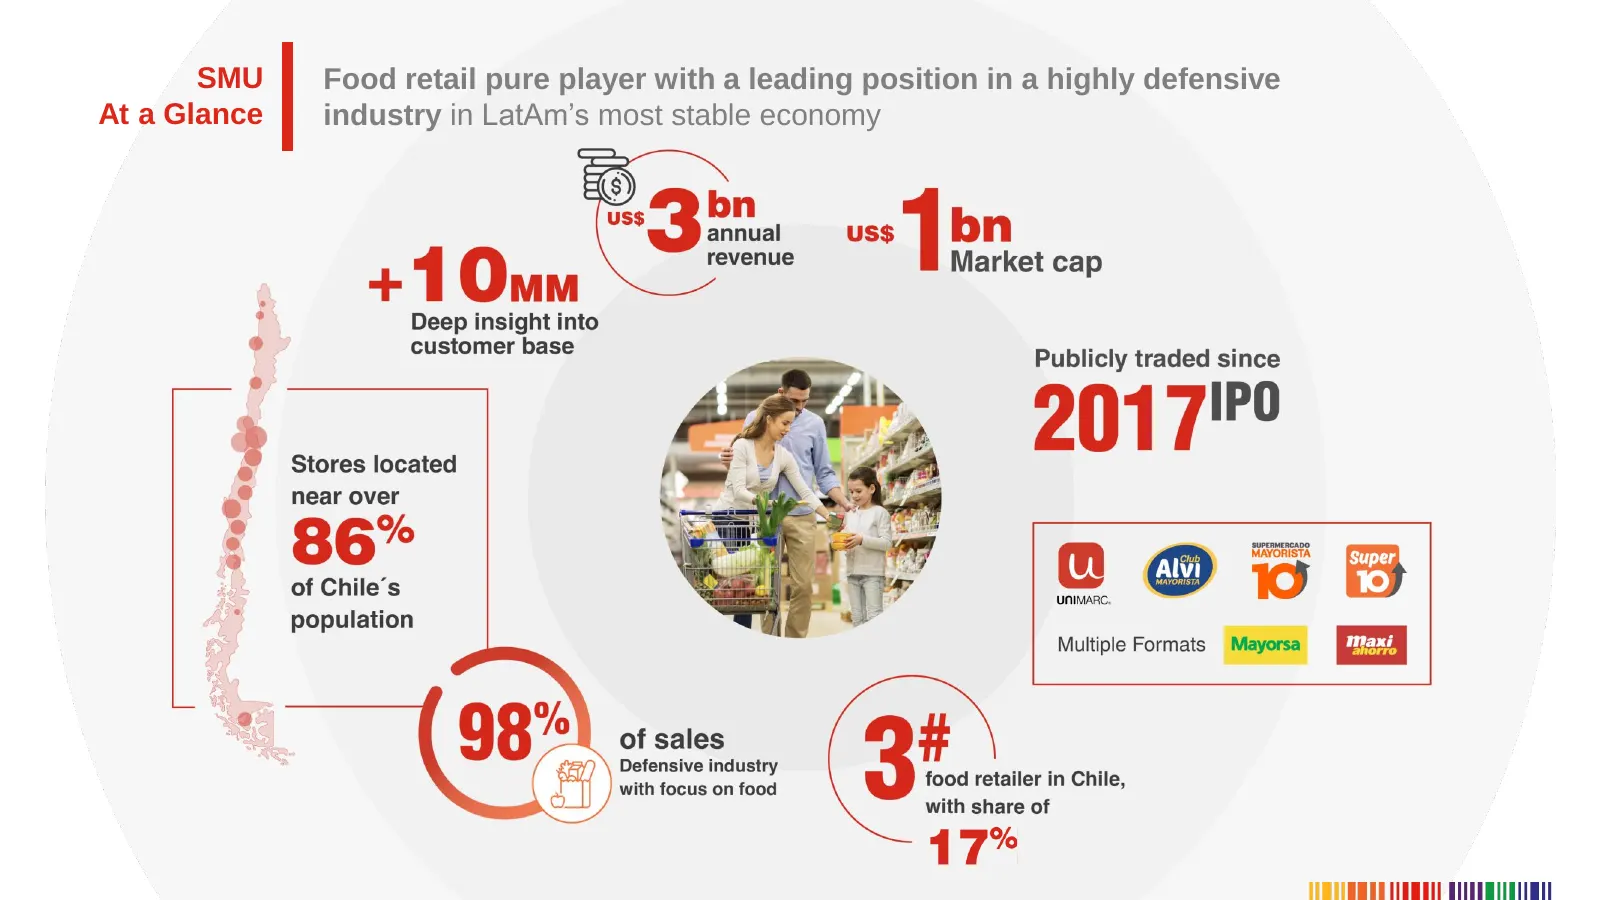
Slide 4: Food retail pure player in LatAm's most stable economy
SMU Food retail pure player with a leading position in a highly defensive At a Glance industry in LatAm’s most stable economy
Slide 5: Investment Highlights
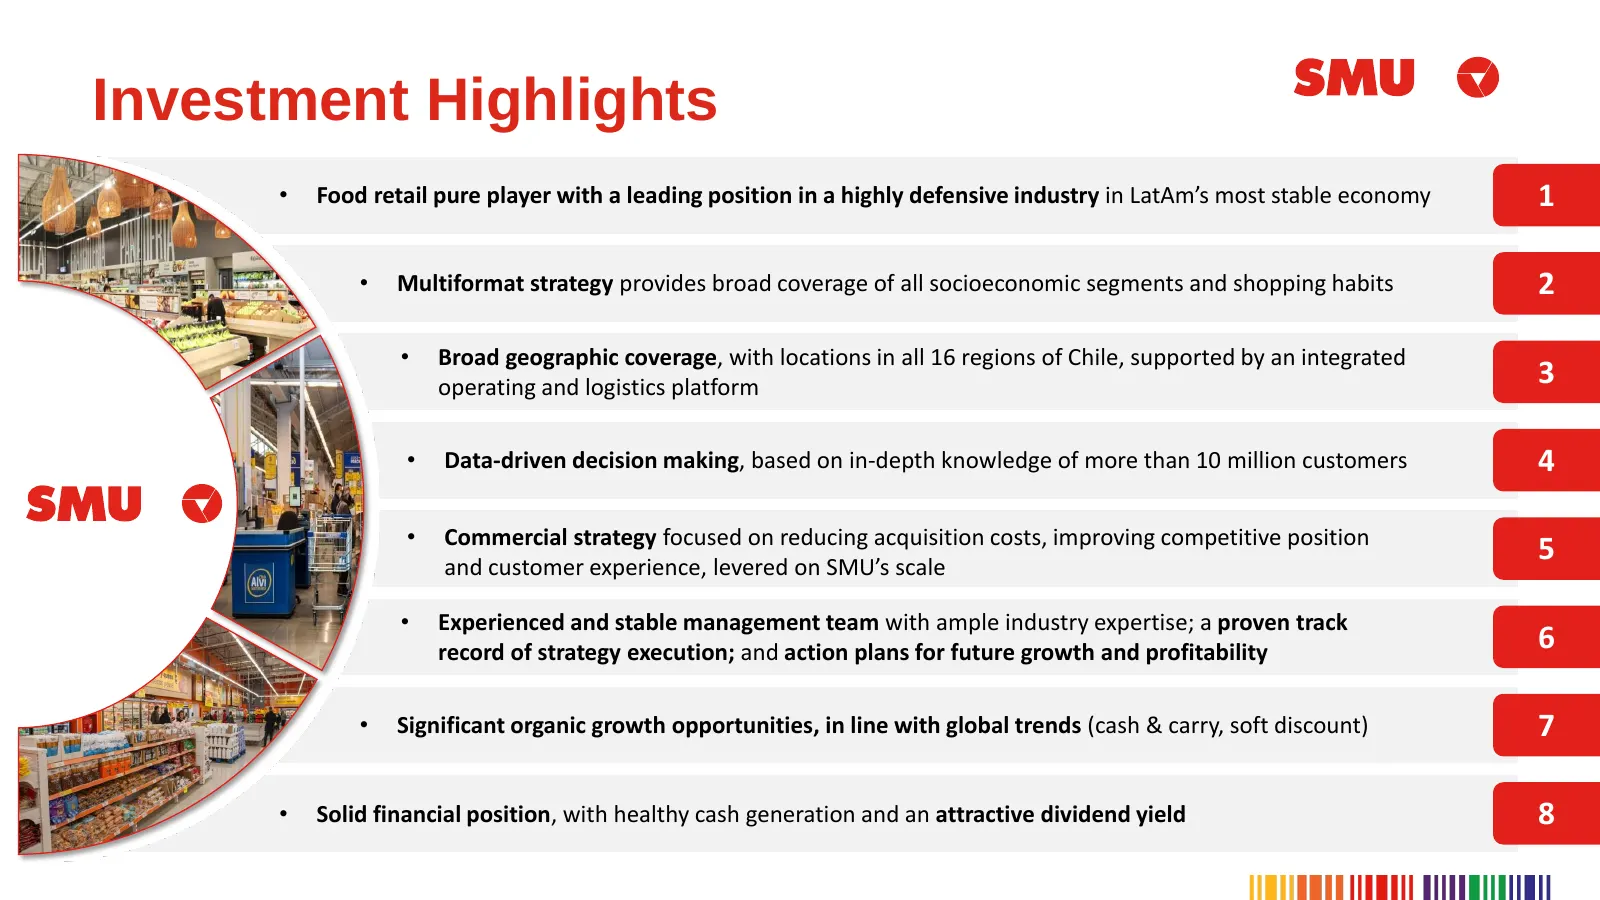
Investment Highlights • Food retail pure player with a leading position in a highly defensive industry in LatAm’s most stable economy 1 • Multiformat strategy provides broad coverage of all socioeconomic segments and shopping habits 2 • Broad geographic coverage, with locations in all 16 regions of
Slide 6: Defensive Industry: Revenues by Business Segment and Country
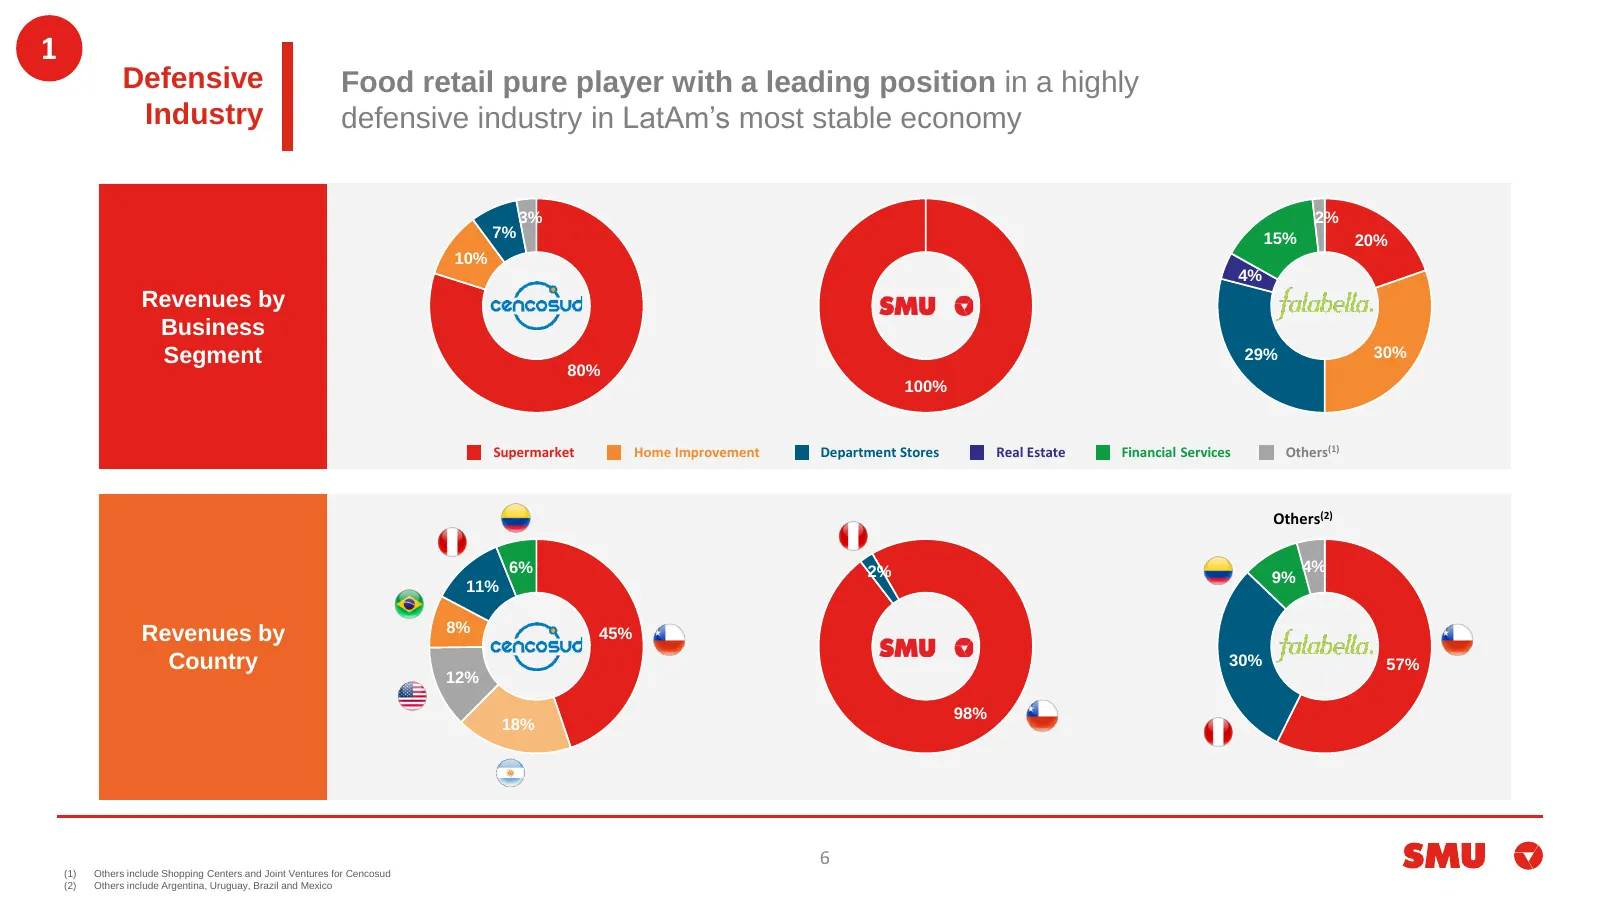
1 Defensive Food retail pure player with a leading position in a highly Industry defensive industry in LatAm’s most stable economy 3% 2% 7% 15% 20% 10% 4% Revenues by Business Segment 29% 30% 80% 100% Supermarket Home Improvement Department Stores Real Estate Financial Services Others(1) Others(2) 6
Slide 7: Defensive industry in Latam's most stable economy
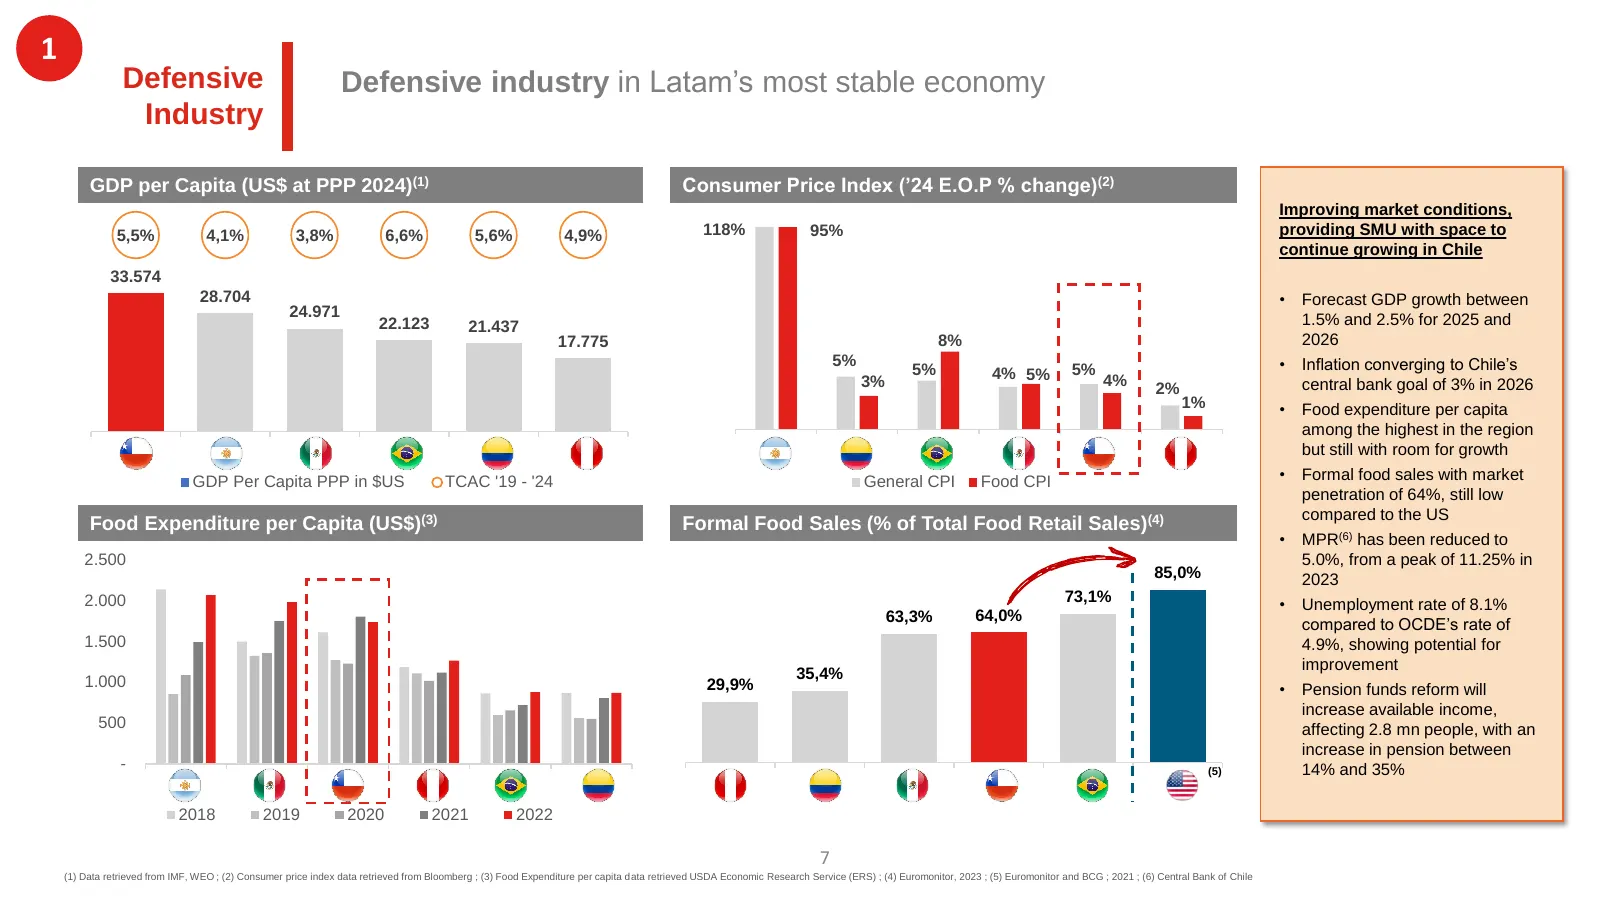
1 Defensive Defensive industry in Latam’s most stable economy Industry GDP per Capita (US$ at PPP 2024)(1) Consumer Price Index (’24 E.O.P % change)(2) Improving market conditions, 5,5% 4,1% 3,8% 6,6% 5,6% 4,9% 118% 95% providing SMU with space to continue growing in Chile 33.574 28.704 • Forecast G
Slide 8: Our Formats: Multiformat strategy
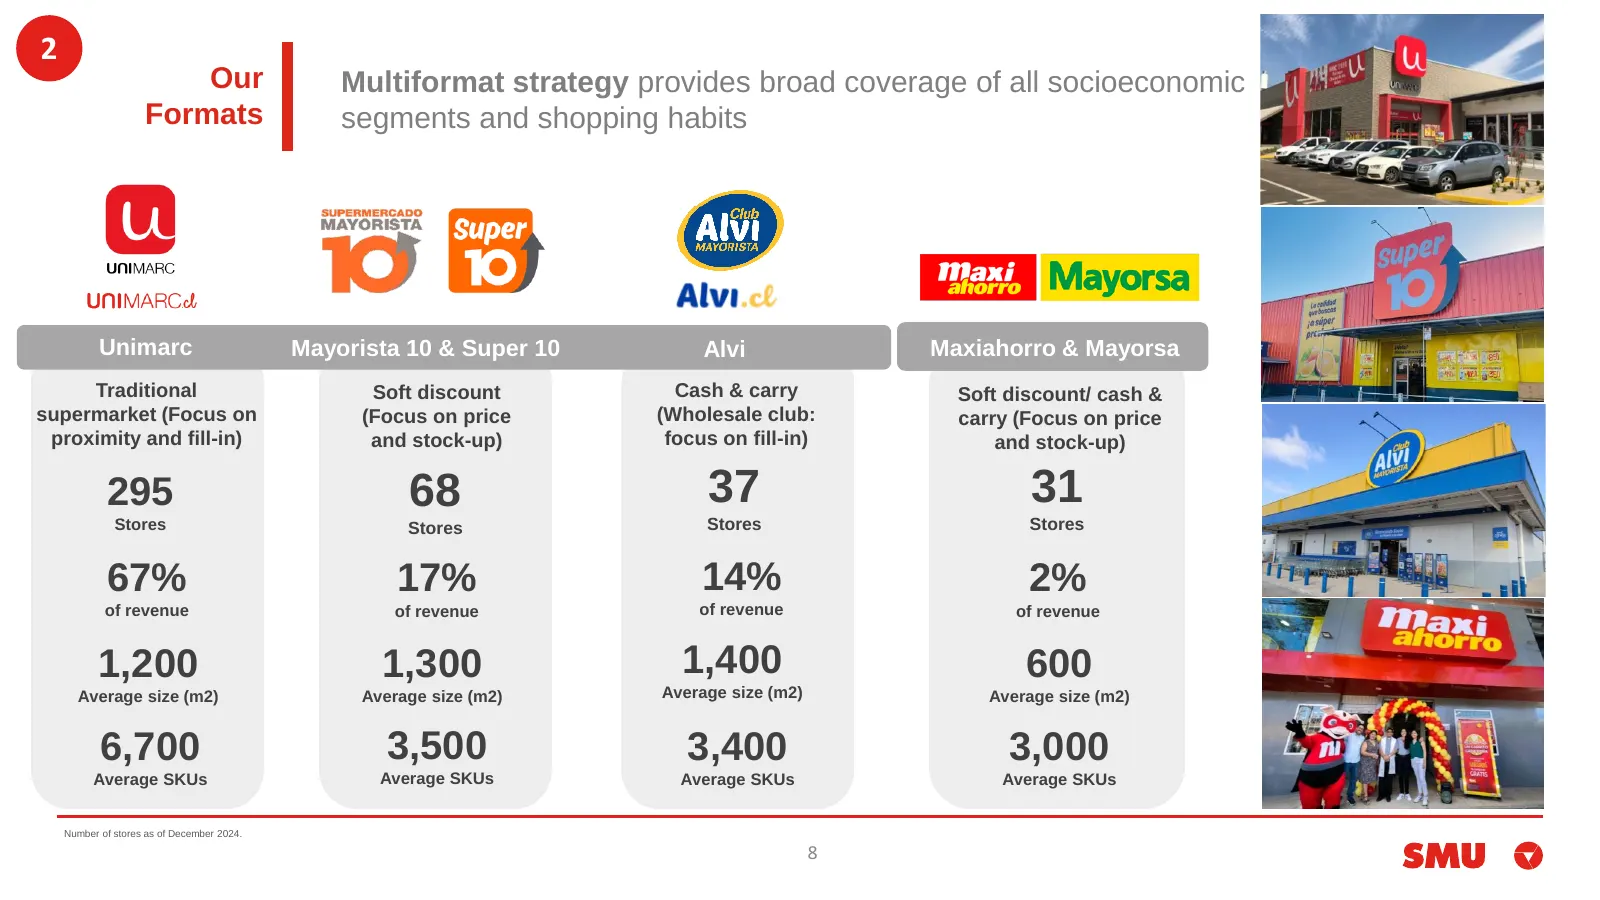
2 Our Multiformat strategy provides broad coverage of all socioeconomic Formats segments and shopping habits Unimarc Mayorista 10 & Super 10 Alvi Maxiahorro & Mayorsa Traditional Soft discount Cash & carry Soft discount/ cash & supermarket (Focus on (Focus on price (Wholesale club: carry (Focus on p
Slide 9: Geographic Coverage
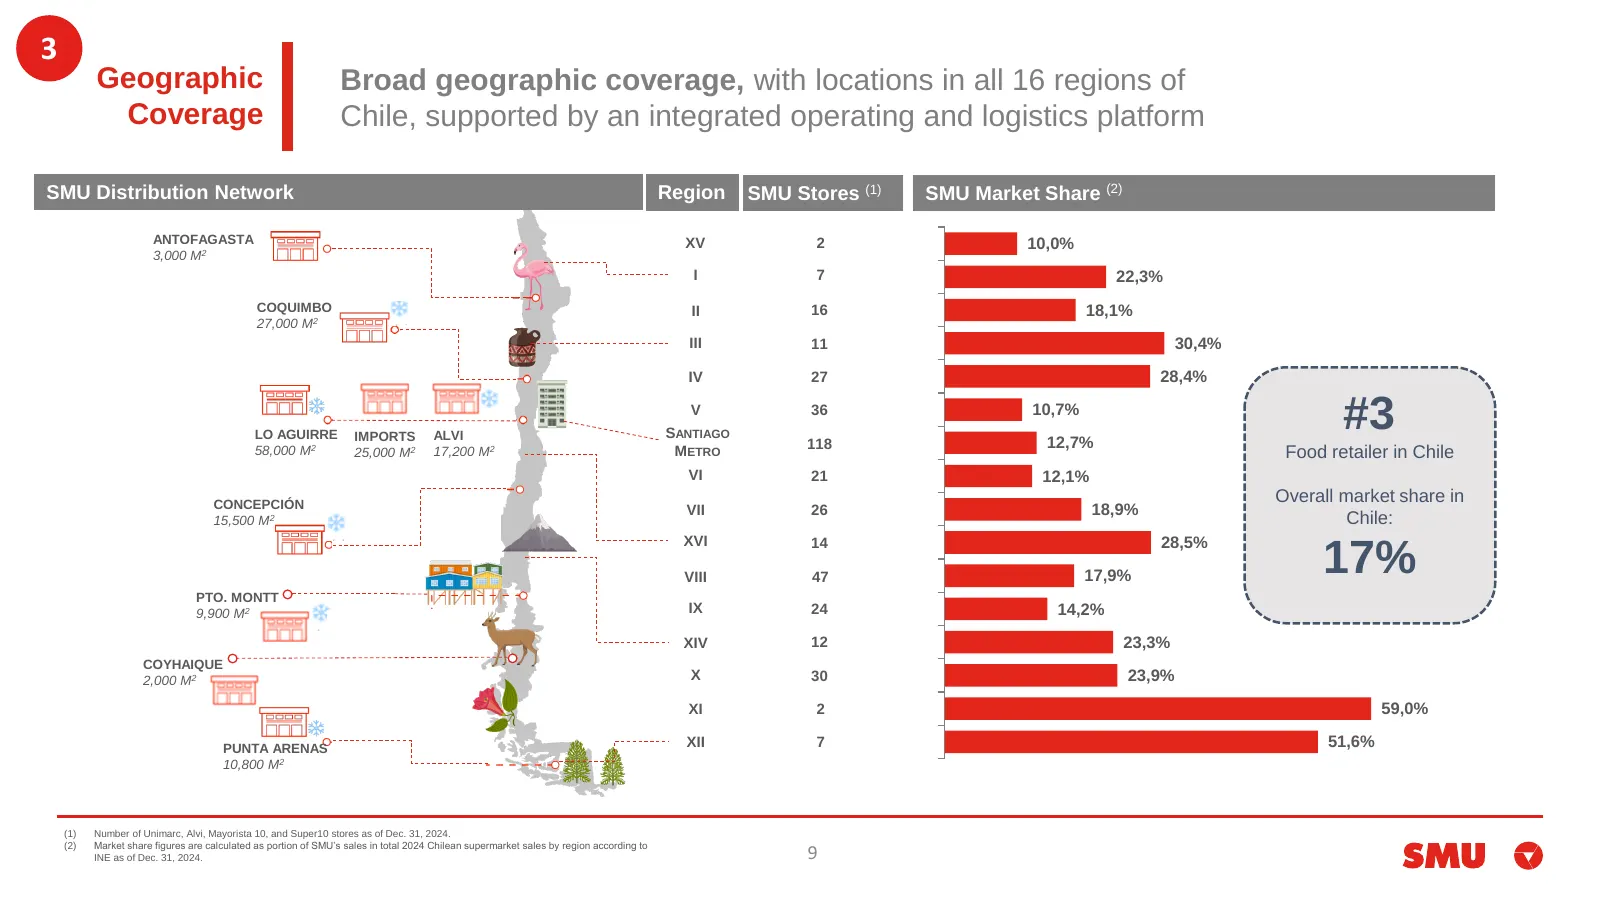
3 Geographic Broad geographic coverage, with locations in all 16 regions of Coverage Chile, supported by an integrated operating and logistics platform SMU Distribution Network Region SMU Stores (1) SMU Market Share (2) ANTOFAGASTA XV 2 10,0% 3,000 M2 I 7 22,3% COQUIMBO II 16 18,1% 27,000 M2 III 11
Slide 10: Customers: data-driven decision making
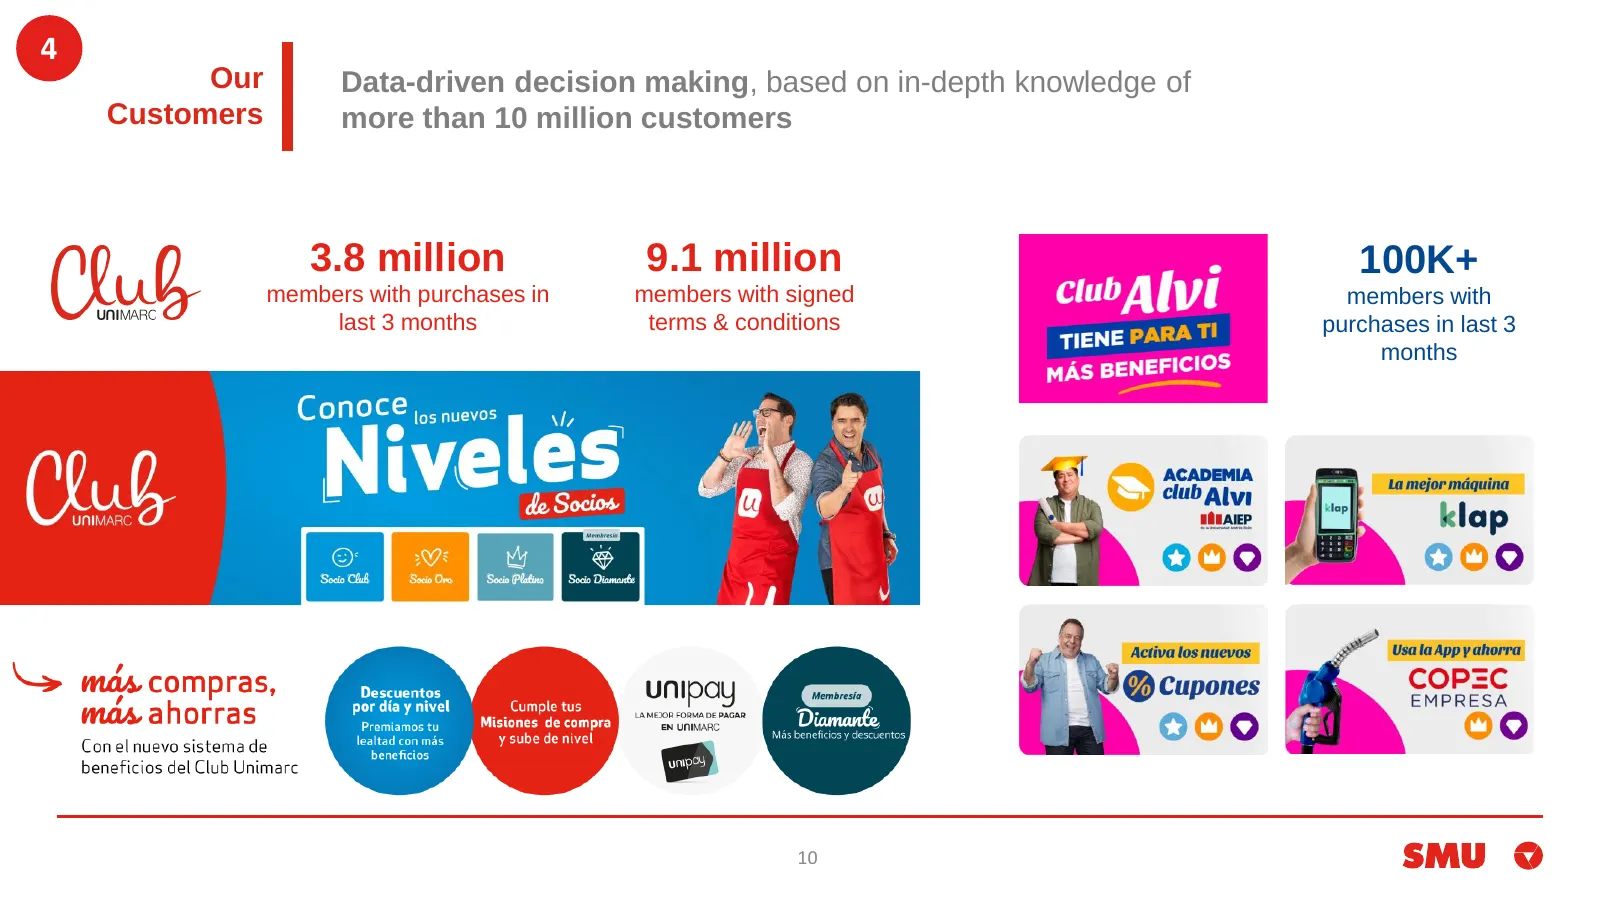
4 Our Data-driven decision making, based on in-depth knowledge of Customers more than 10 million customers 3.8 million 9.1 million 100K+ members with purchases in members with signed members with last 3 months terms & conditions purchases in last 3 months 10
Slide 11: Commercial Strategy: Key Drivers
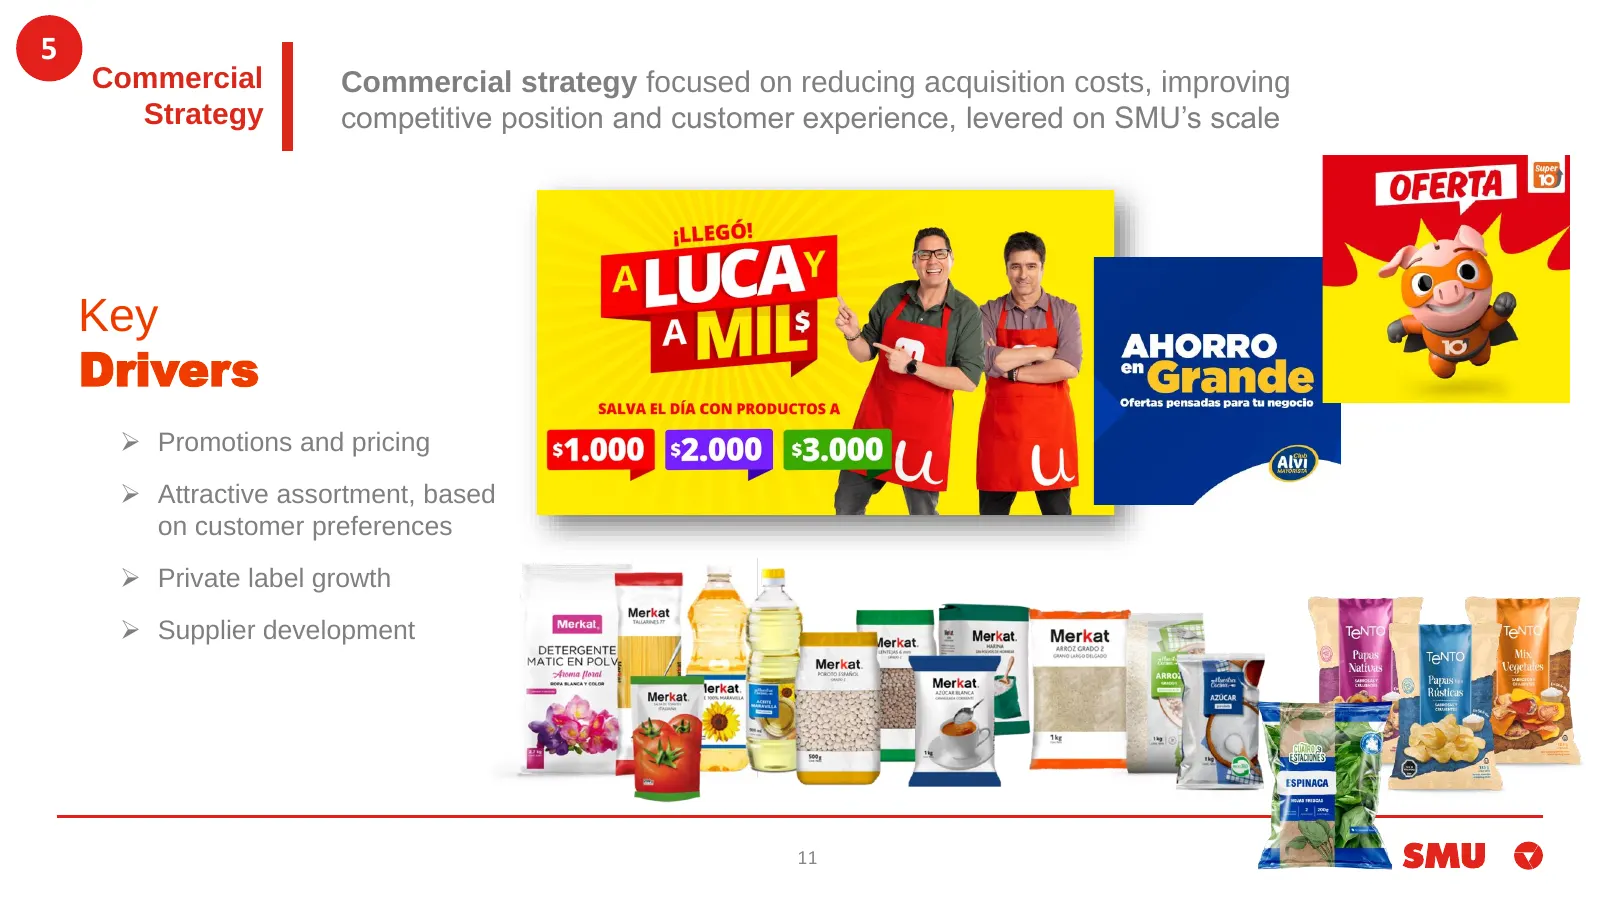
5 Commercial Commercial strategy focused on reducing acquisition costs, improving Strategy competitive position and customer experience, levered on SMU’s scale Key Drivers ➢ Promotions and pricing ➢ Attractive assortment, based on customer preferences ➢ Private label growth ➢ Supplier development 11
Slide 12: Corporate Governance
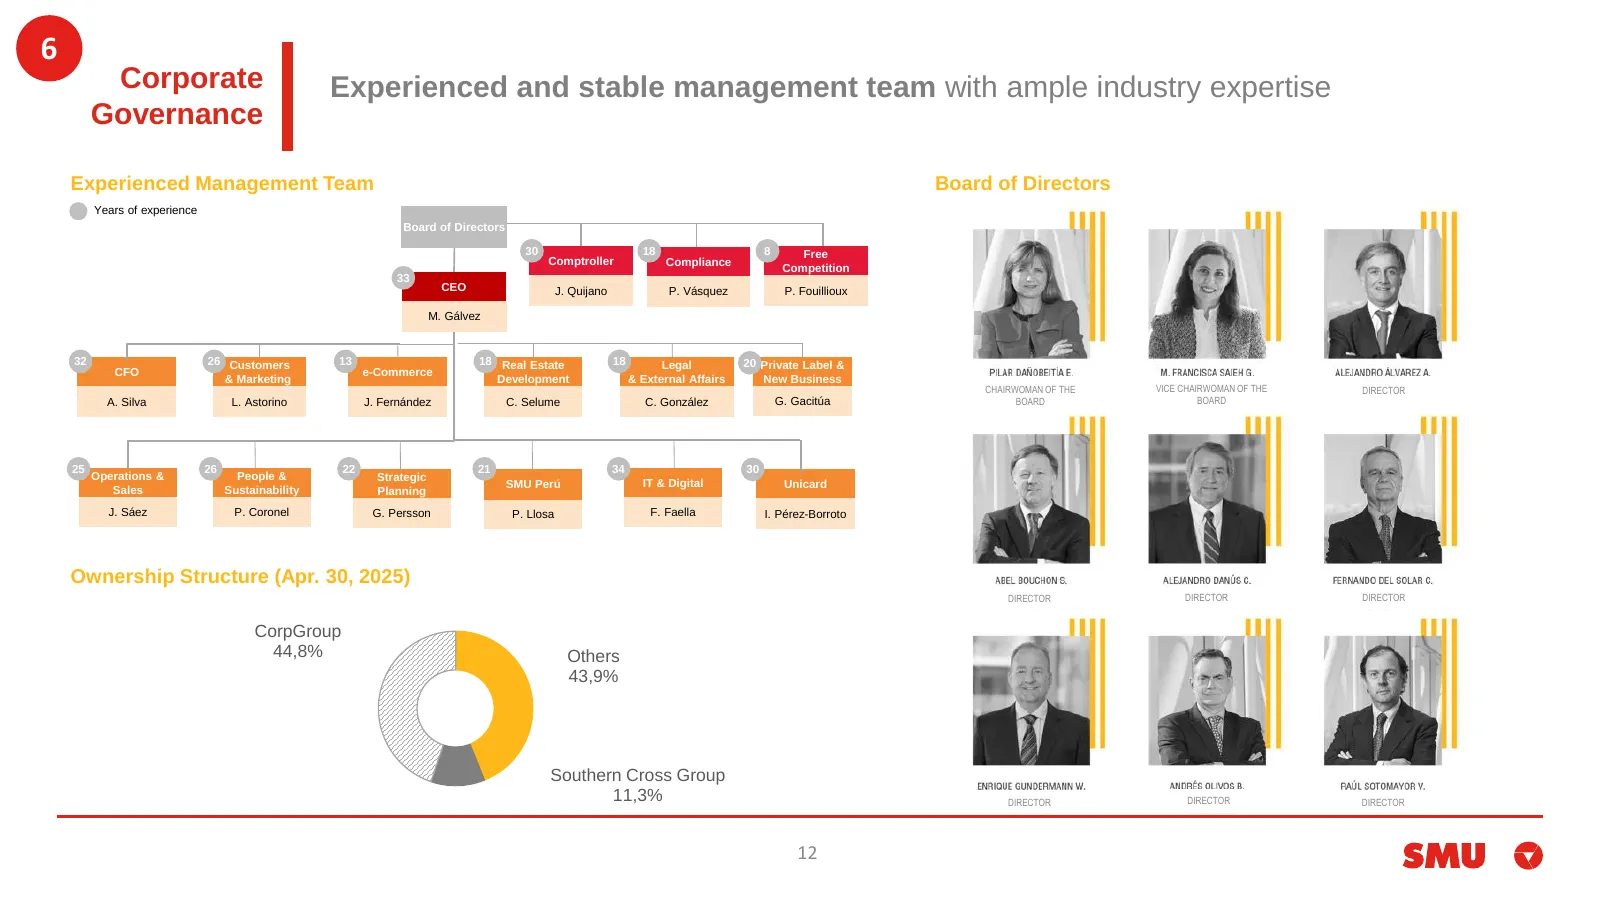
6 Corporate Experienced and stable management team with ample industry expertise Governance Experienced Management Team Board of Directors Years of experience Board of Directors 30 18 8 Free Comptroller Compliance Competition 33 CEO J. Quijano P. Vásquez P. Fouillioux M. Gálvez 32 26 Customers 13 18
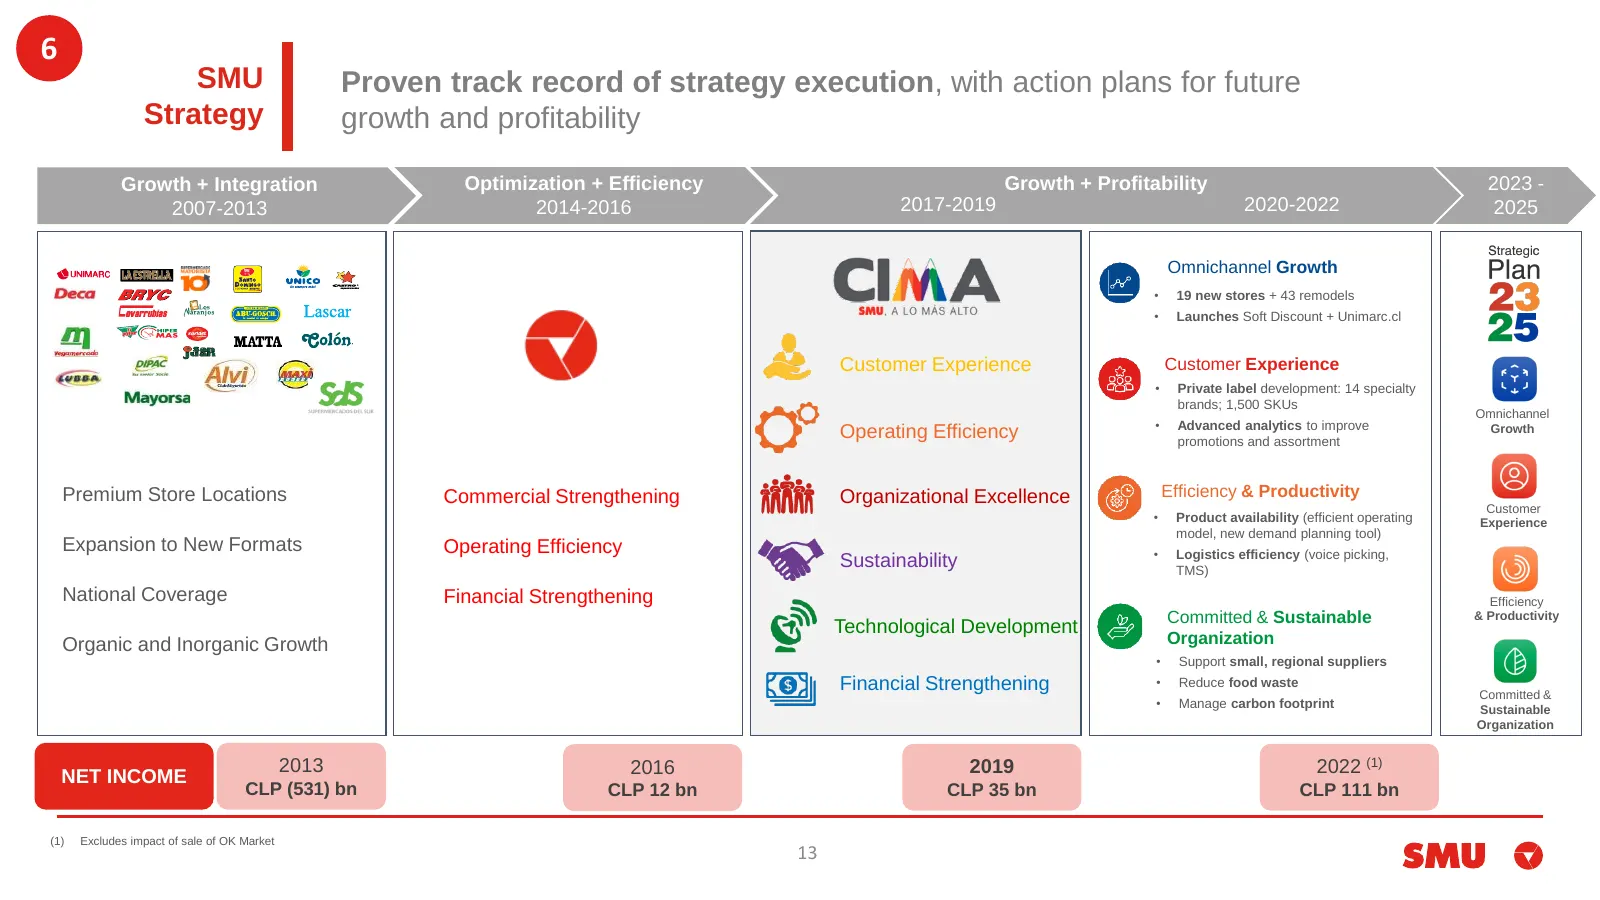
Slide 13: SMU Strategy: Proven track record of strategy execution
6 SMU Proven track record of strategy execution, with action plans for future Strategy growth and profitability Growth + Integration Optimization + Efficiency Growth + Profitability 2023 - 2007-2013 2014-2016 2017-2019 2020-2022 2025 Omnichannel Growth • 19 new stores + 43 remodels • Launches Soft D
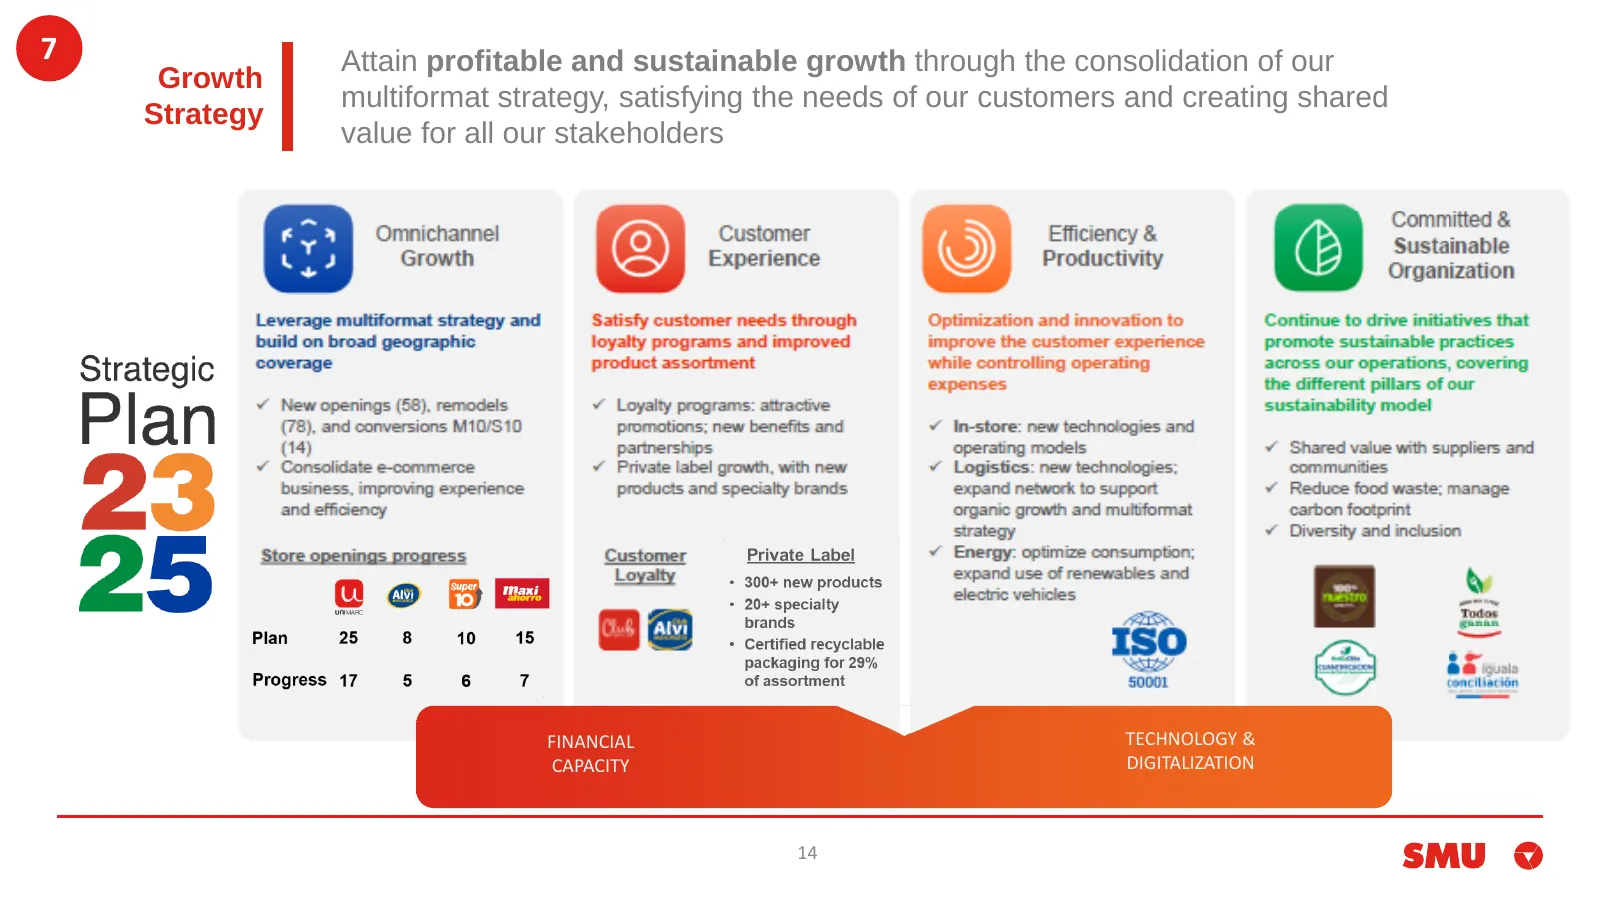
Slide 14: Growth Strategy
7 Attain profitable and sustainable growth through the consolidation of our Growth multiformat strategy, satisfying the needs of our customers and creating shared Strategy value for all our stakeholders FINANCIAL TECHNOLOGY & CAPACITY DIGITALIZATION 14
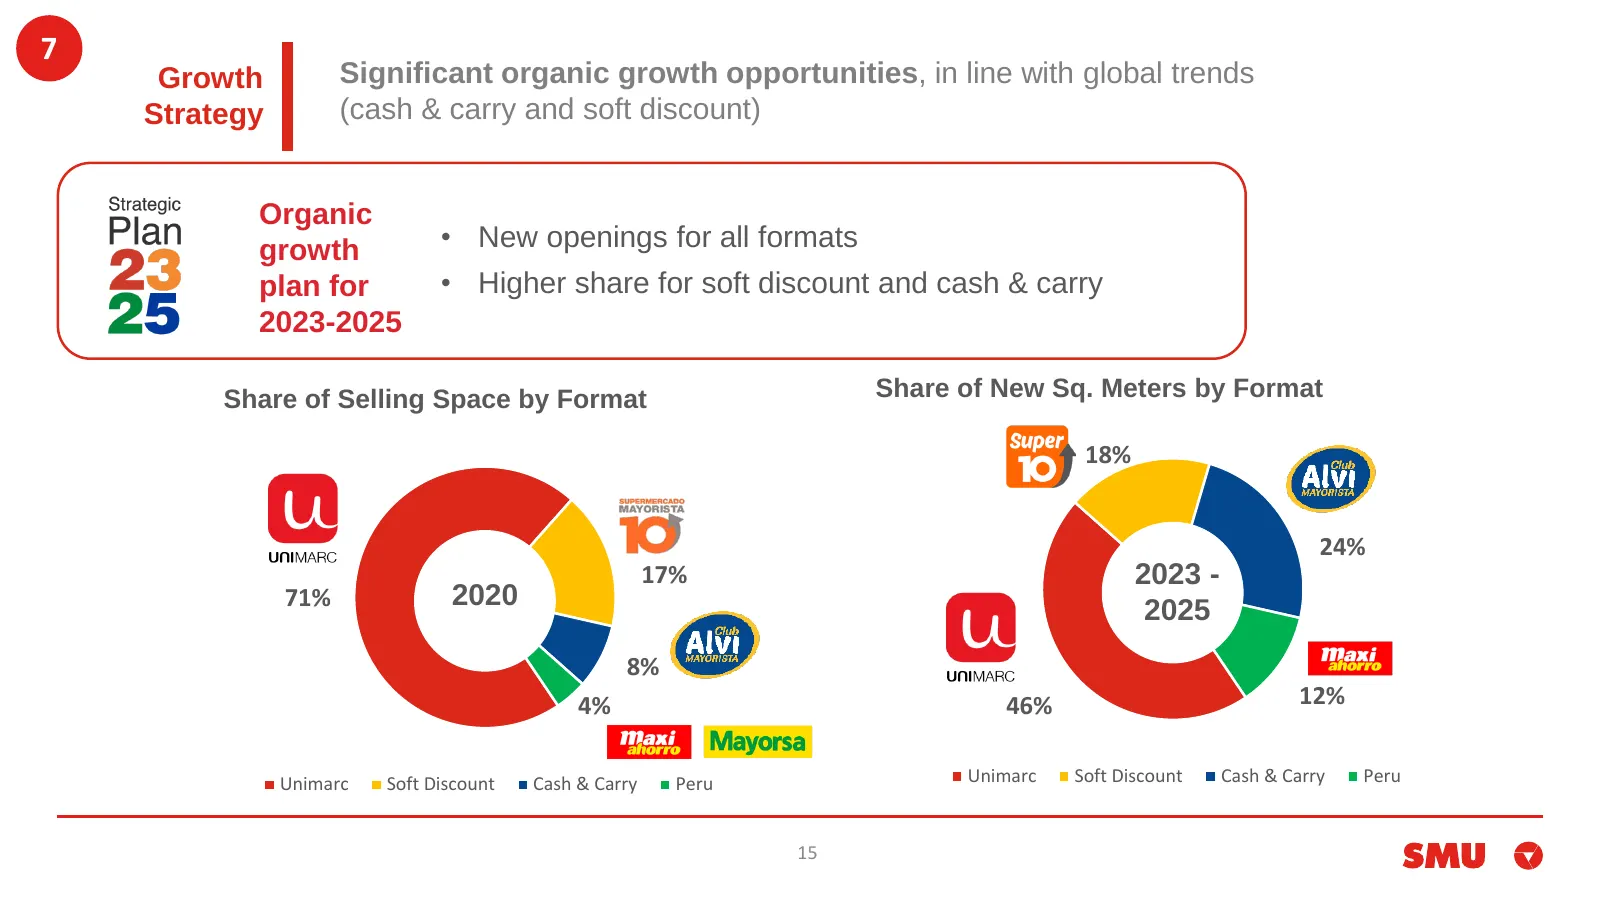
Slide 15: Significant organic growth opportunities
7 Growth Significant organic growth opportunities, in line with global trends Strategy (cash & carry and soft discount) Organic growth • New openings for all formats plan for • Higher share for soft discount and cash & carry 2023-2025 Share of Selling Space by Format Share of New Sq. Meters by Forma
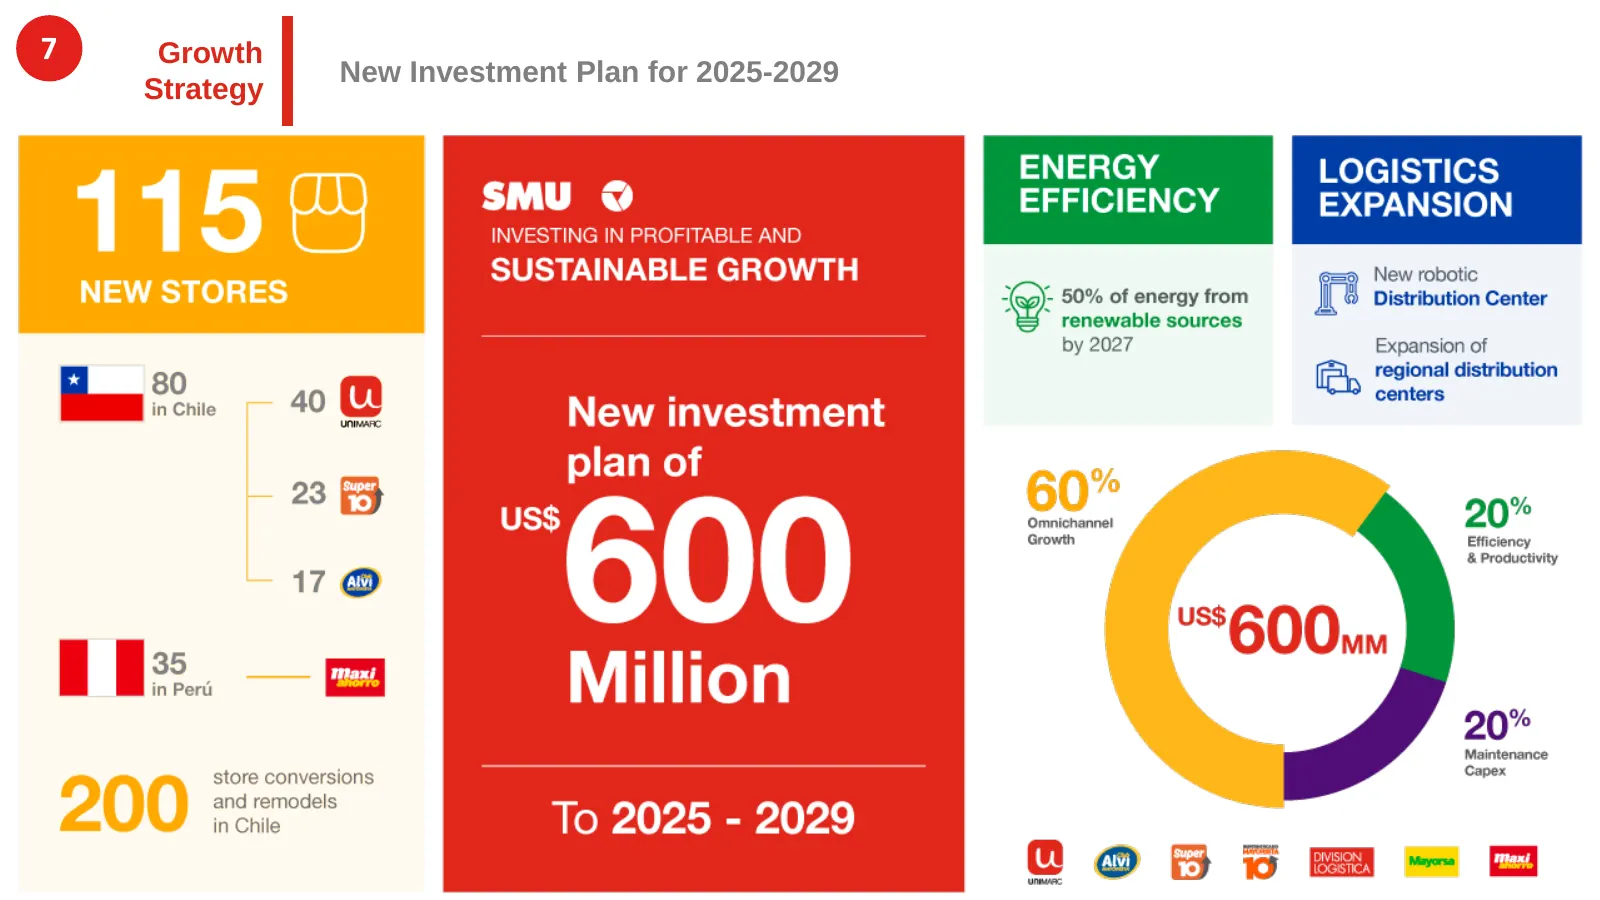
Slide 16: New Investment Plan for 2025-2029
7 Growth New Investment Plan for 2025-2029 Strategy
Slide 17: Financial Position: Solid financial position
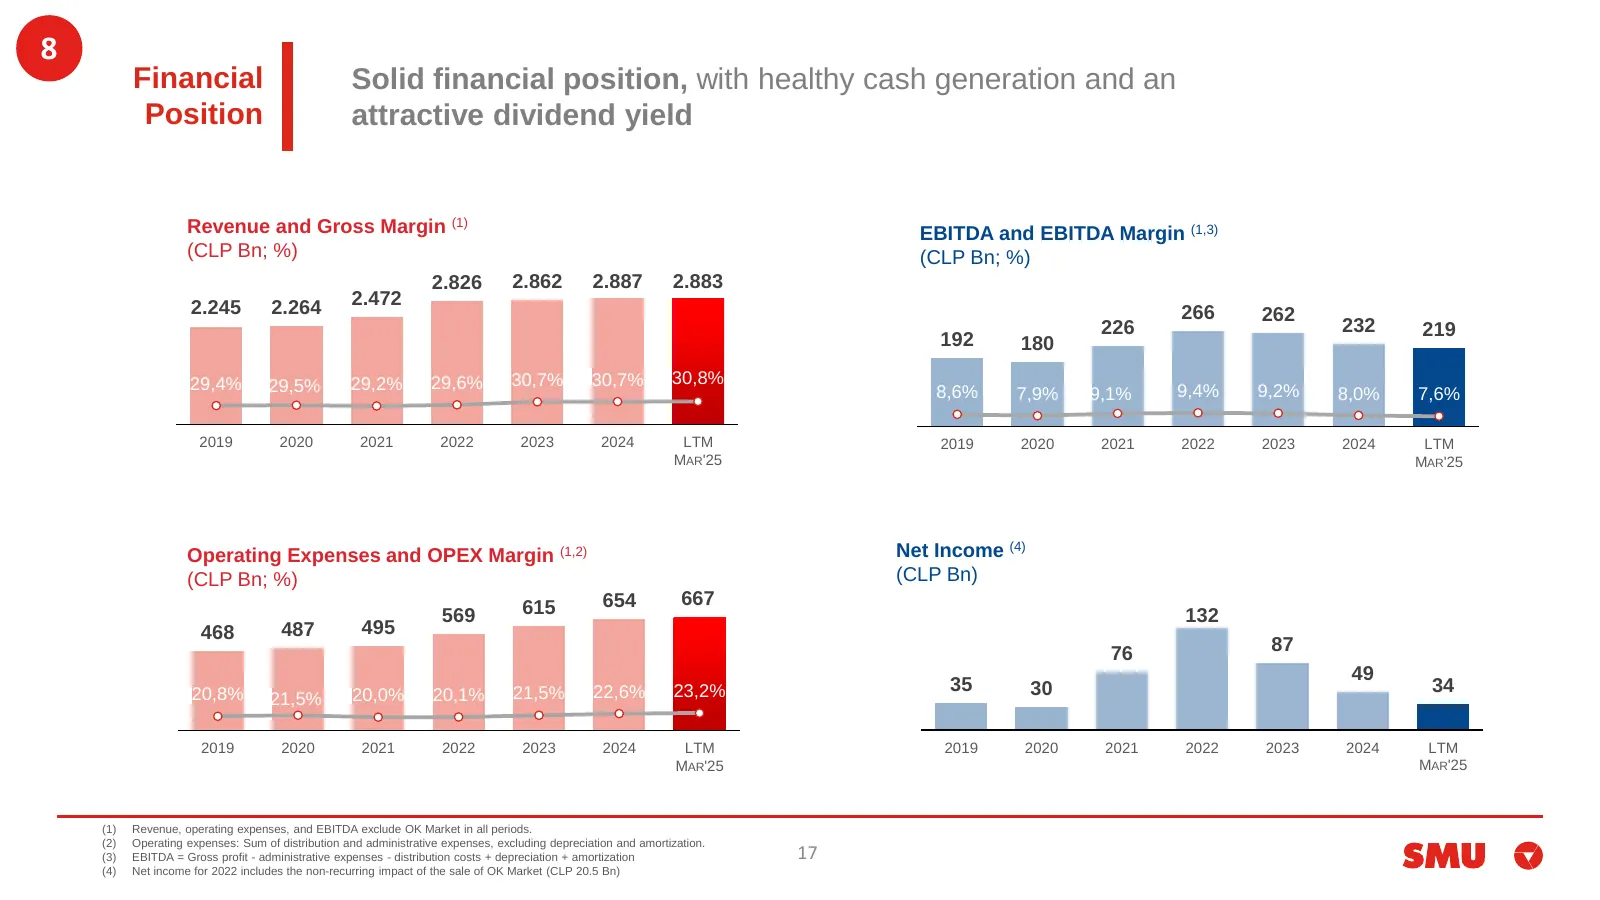
8 Financial Solid financial position, with healthy cash generation and an Position attractive dividend yield Revenue and Gross Margin (1) EBITDA and EBITDA Margin (1,3) (CLP Bn; %) (CLP Bn; %) 2.826 2.862 2.887 2.883 2.245 2.264 2.472 266 262 226 232 219 192 180 29,4% 29,5% 29,2% 29,6% 30,7% 30,7% 3
Slide 18: Financial Position: Dividend Yield and Share Price
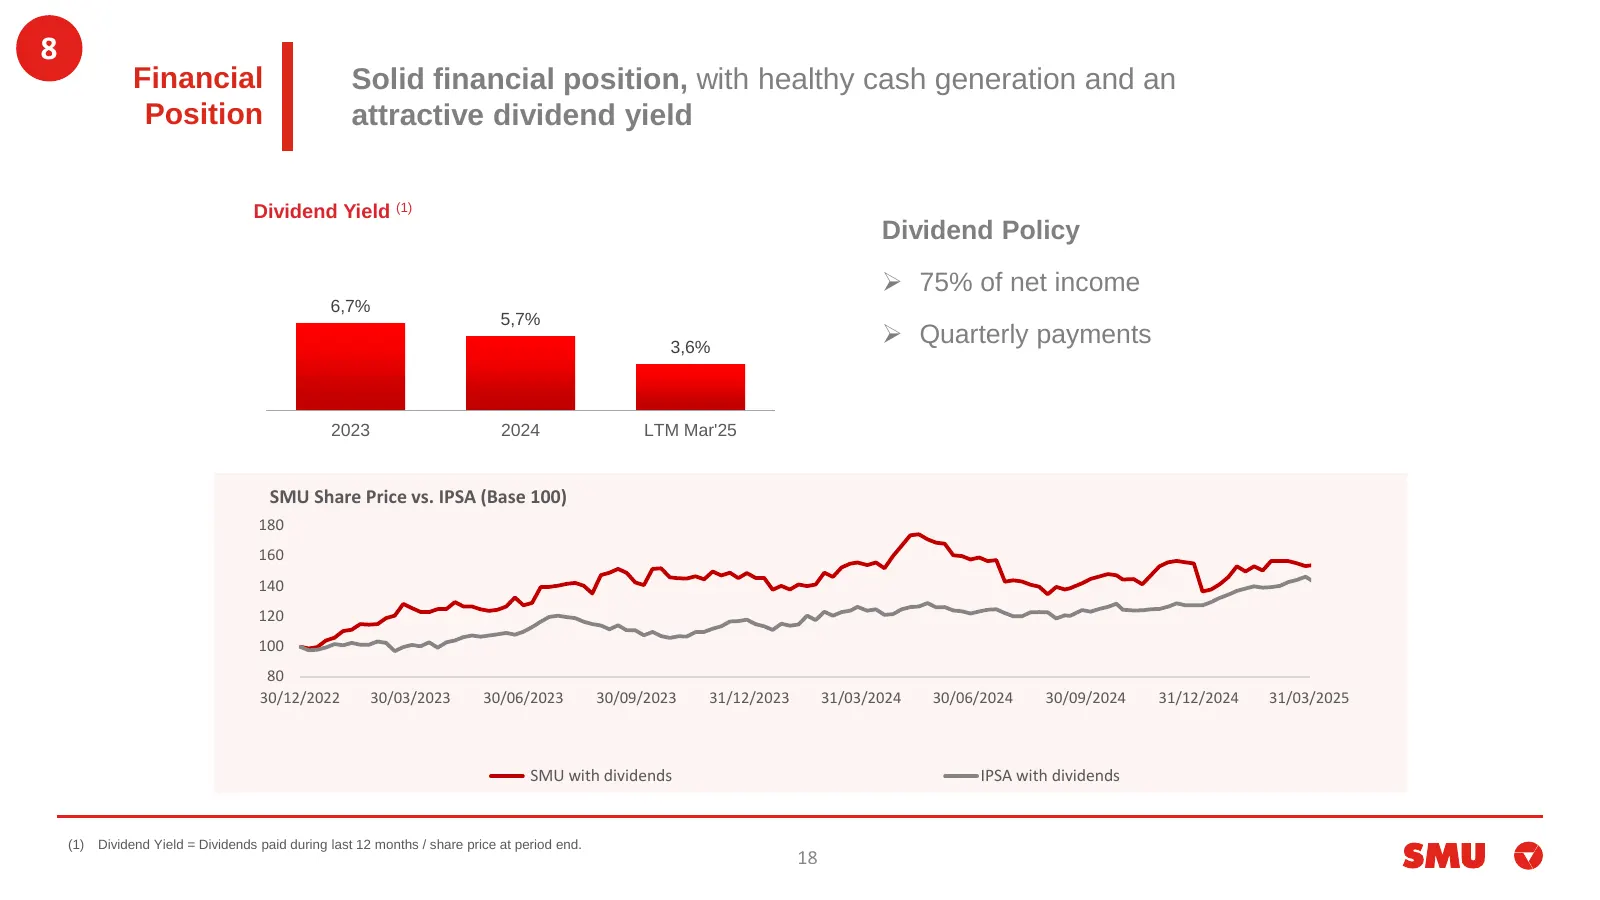
8 Financial Solid financial position, with healthy cash generation and an Position attractive dividend yield Dividend Yield (1) Dividend Policy ➢ 75% of net income 6,7% 5,7% 3,6% ➢ Quarterly payments 2023 2024 LTM Mar'25 SMU Share Price vs. IPSA (Base 100) 180 160 140 120 100 80 30/12/2022 30/03/202
Slide 19: Appendix 1: Financial Position
Appendix 1: Financial Position 19
Slide 20: Cash Flow and Debt Maturity Profile
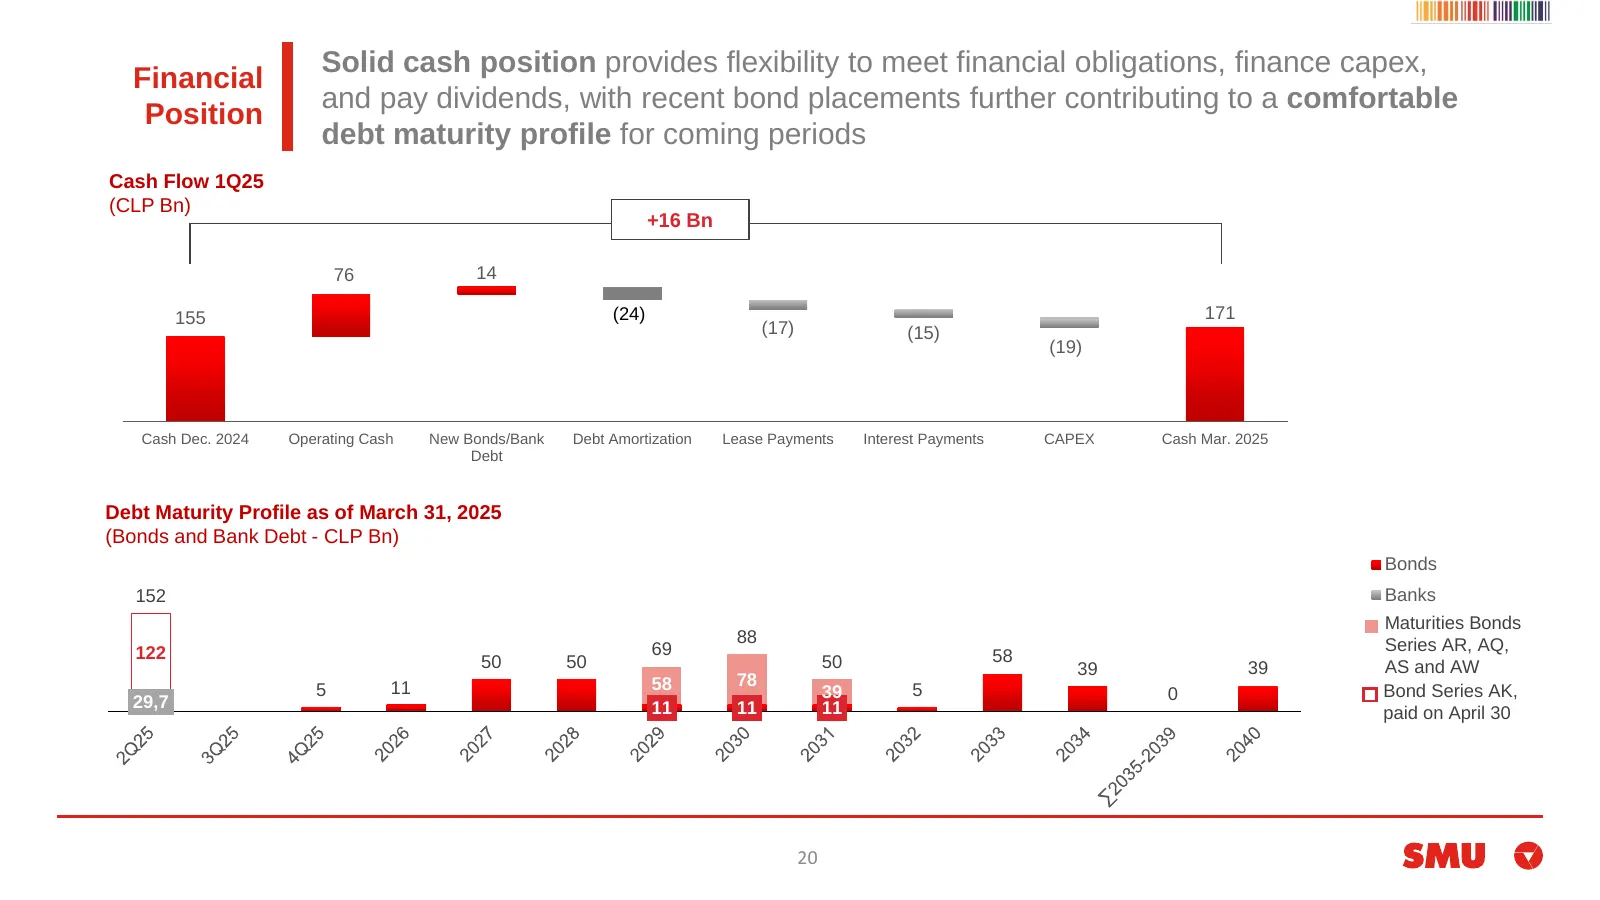
Solid cash position provides flexibility to meet financial obligations, finance capex, Financial and pay dividends, with recent bond placements further contributing to a comfortable Position debt maturity profile for coming periods Cash Flow 1Q25 (CLP Bn) +16 Bn 76 14 155 (24) 171 (17) (15) (19) Cas
Slide 21: Leverage and Interest Coverage
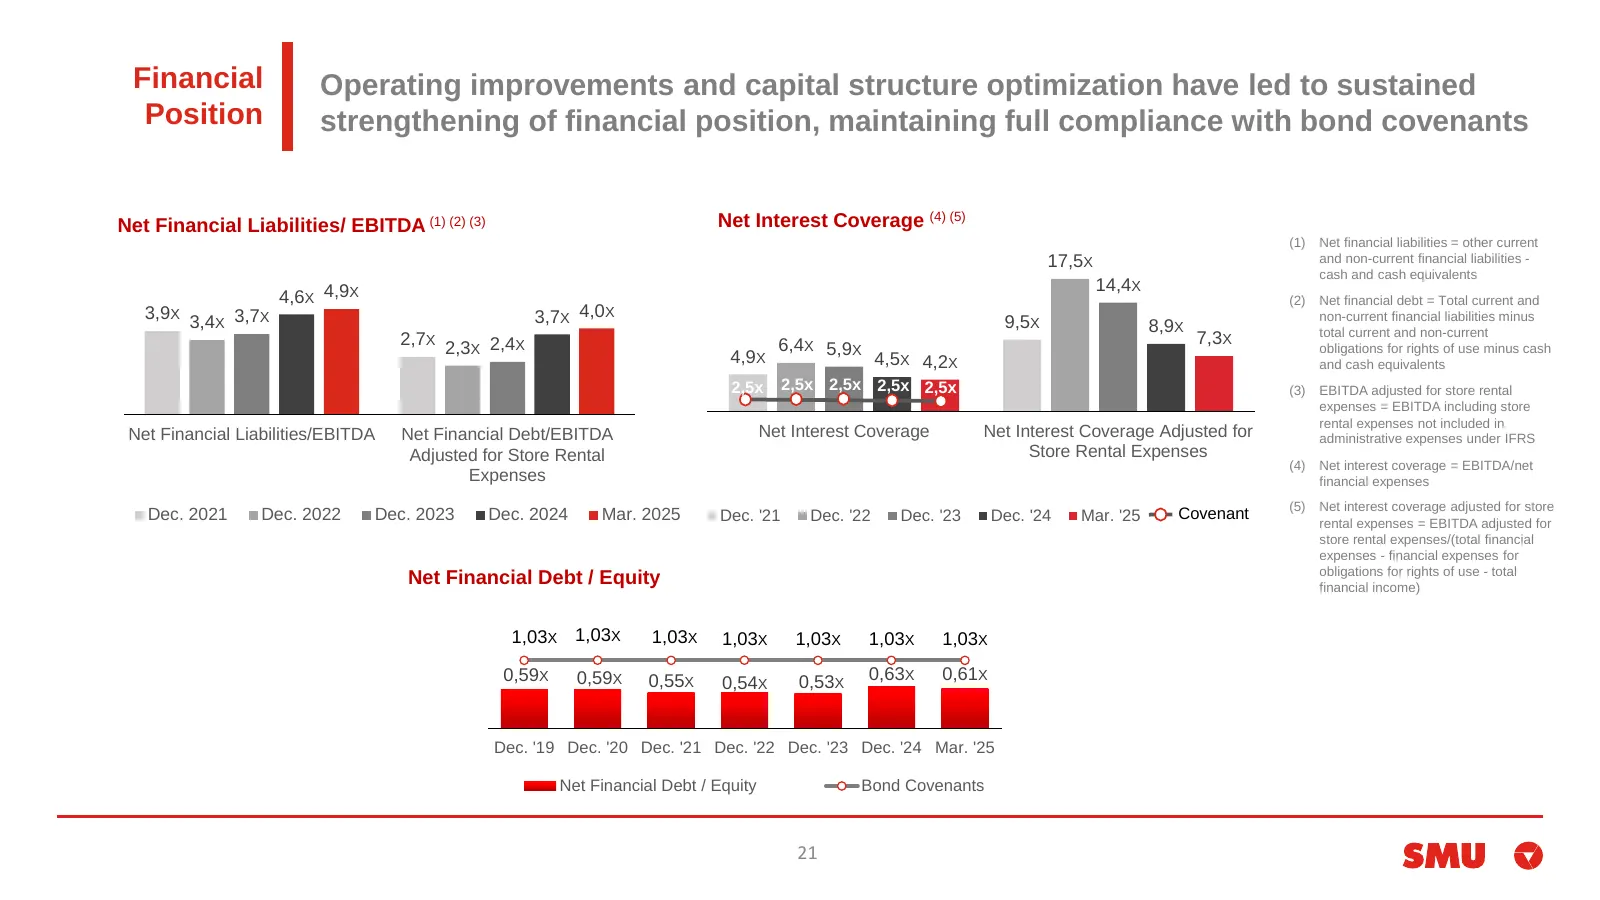
Financial Operating improvements and capital structure optimization have led to sustained Position strengthening of financial position, maintaining full compliance with bond covenants Net Financial Liabilities/ EBITDA (1) (2) (3) Net Interest Coverage (4) (5) (1) Net financial liabilities = other cu
Slide 22: Cash position flexibility and accumulated NOLs
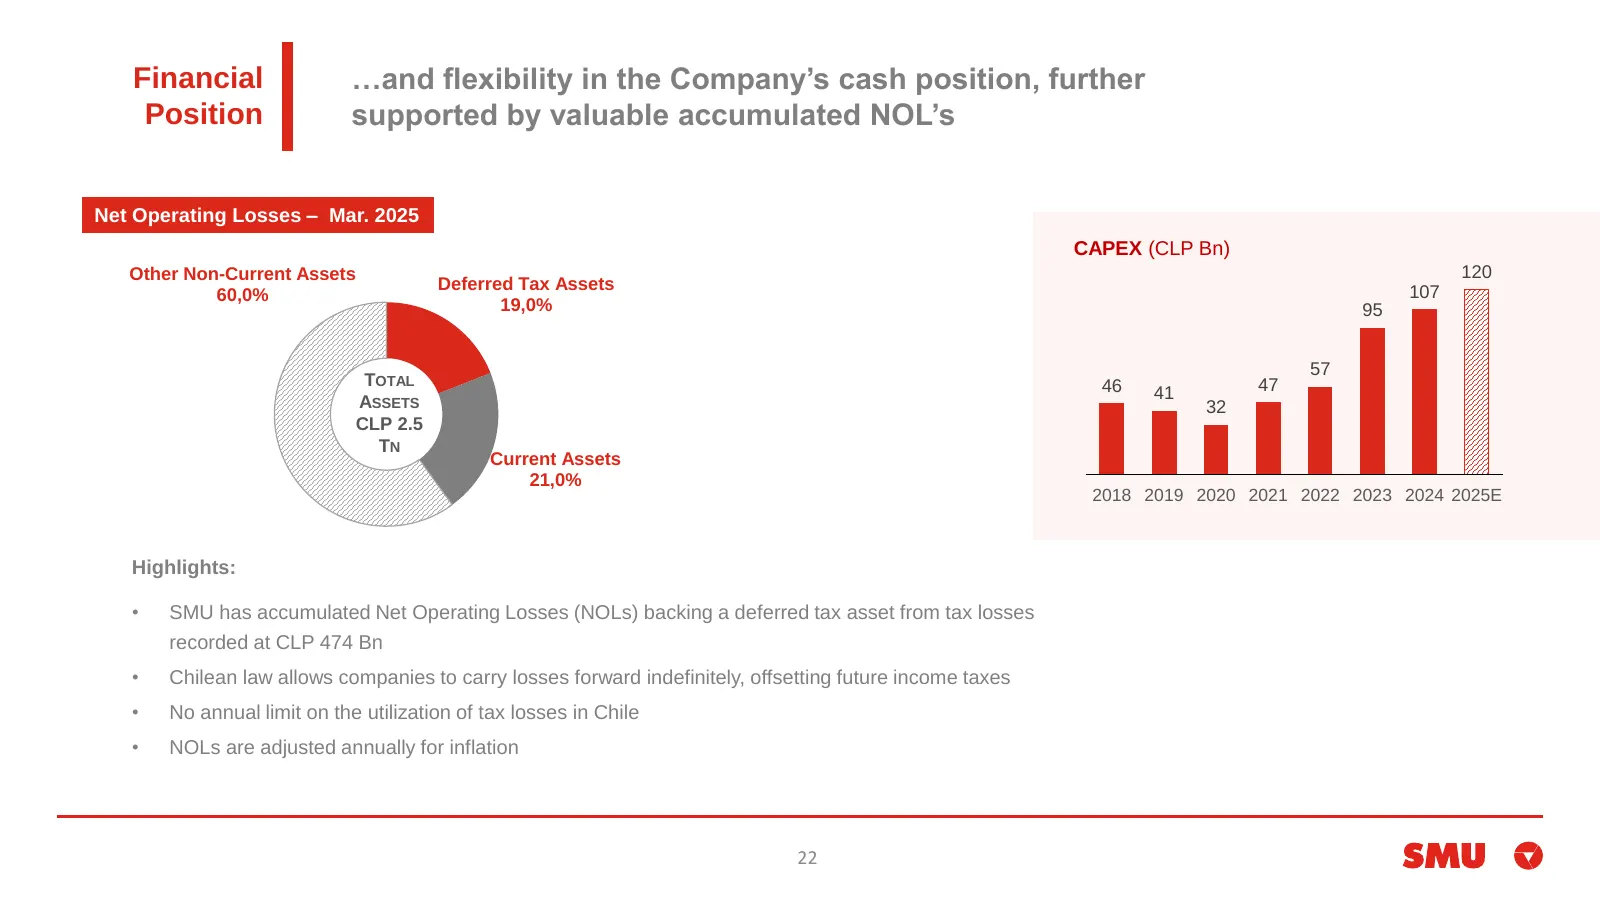
Financial …and flexibility in the Company’s cash position, further Position supported by valuable accumulated NOL’s Net Operating Losses – Mar. 2025 CAPEX (CLP Bn) Other Non-Current Assets 120 Deferred Tax Assets 107 60,0% 19,0% 95 57 TOTAL 46 47 ASSETS 41 32 CLP 2.5 TN Current Assets 21,0% 2018 201
Slide 23: Credit rating upgraded to AA-
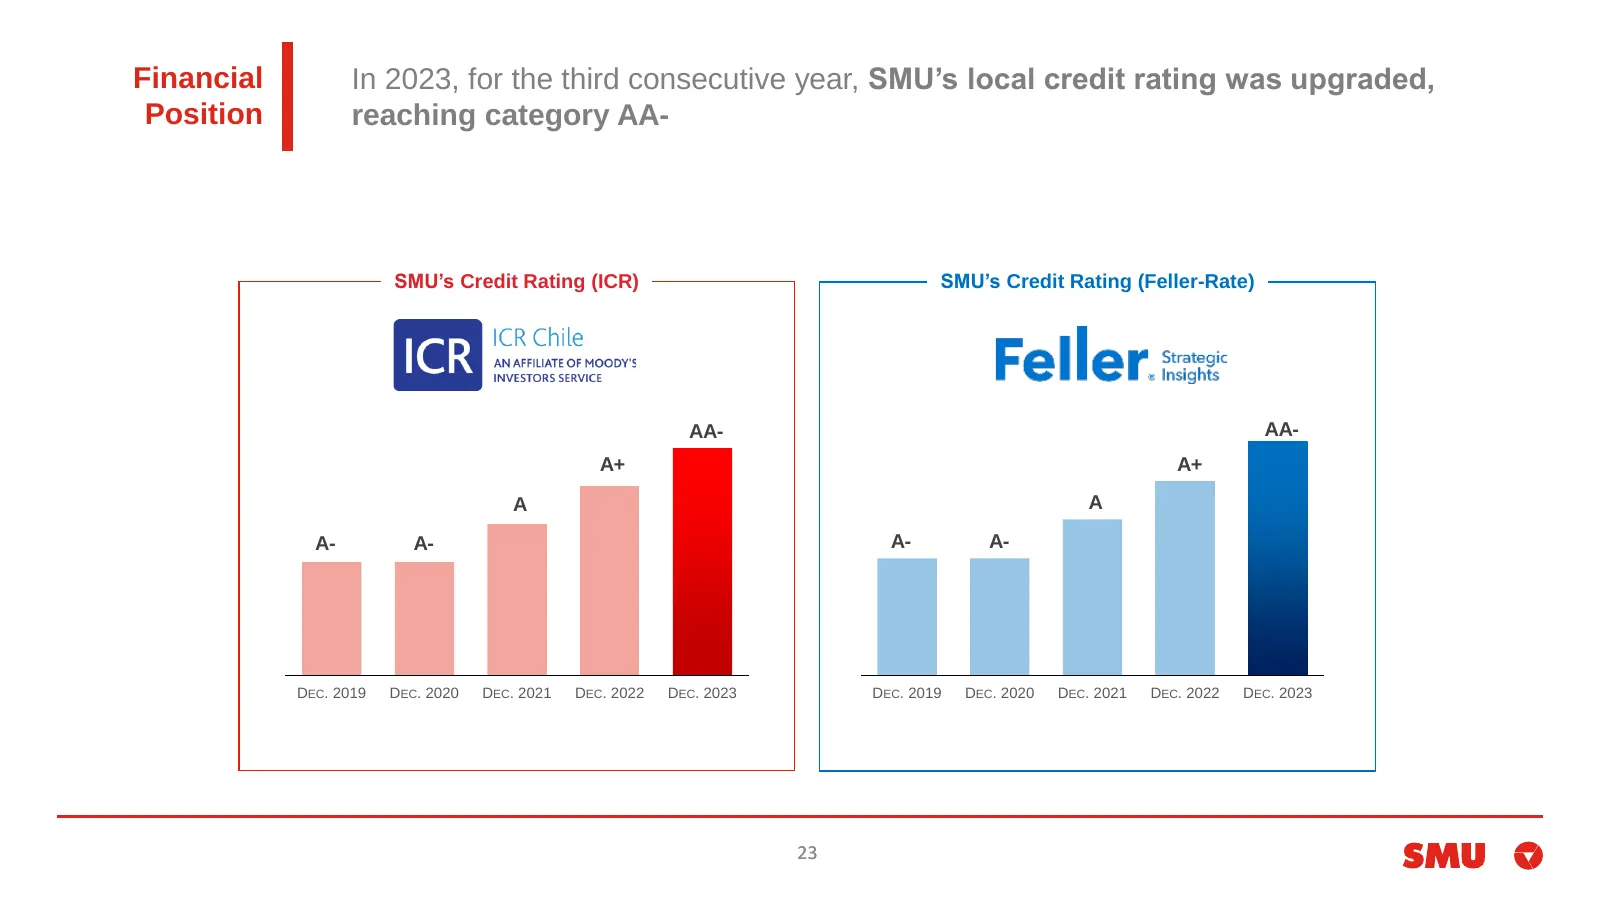
Financial In 2023, for the third consecutive year, SMU’s local credit rating was upgraded, Position reaching category AA- SMU’s Credit Rating (ICR) SMU’s Credit Rating (Feller-Rate) AA- AA- A+ A+ A A A- A- A- A- DEC. 2019 DEC. 2020 DEC. 2021 DEC. 2022 DEC. 2023 DEC. 2019 DEC. 2020 DEC. 2021 DEC. 202
Slide 24: Sustainability: ESG scores and indices
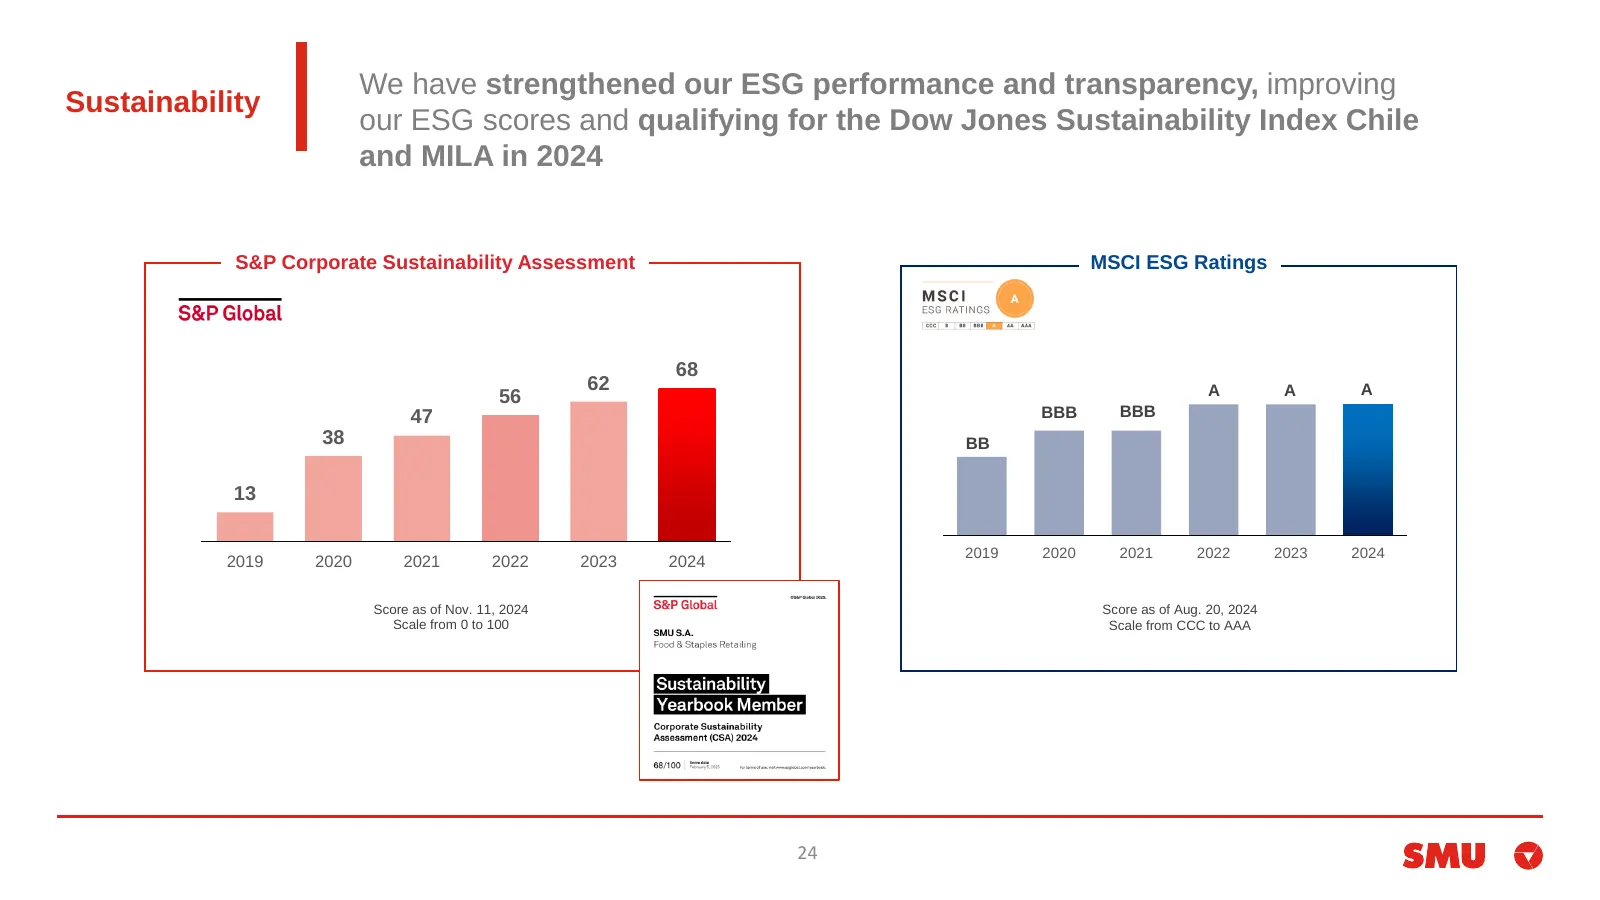
We have strengthened our ESG performance and transparency, improving Sustainability our ESG scores and qualifying for the Dow Jones Sustainability Index Chile and MILA in 2024 S&P Corporate Sustainability Assessment MSCI ESG Ratings 68 62 A A A 56 47 BBB BBB 38 BB 13 2019 2020 2021 2022 2023 2024 20
Slide 25: Appendix 2: Detailed Growth Plan 2023-2025
Appendix 2: Detailed Growth Plan 2023-2025 25
Slide 26: Strategy 2023-2025: Omnichannel Growth
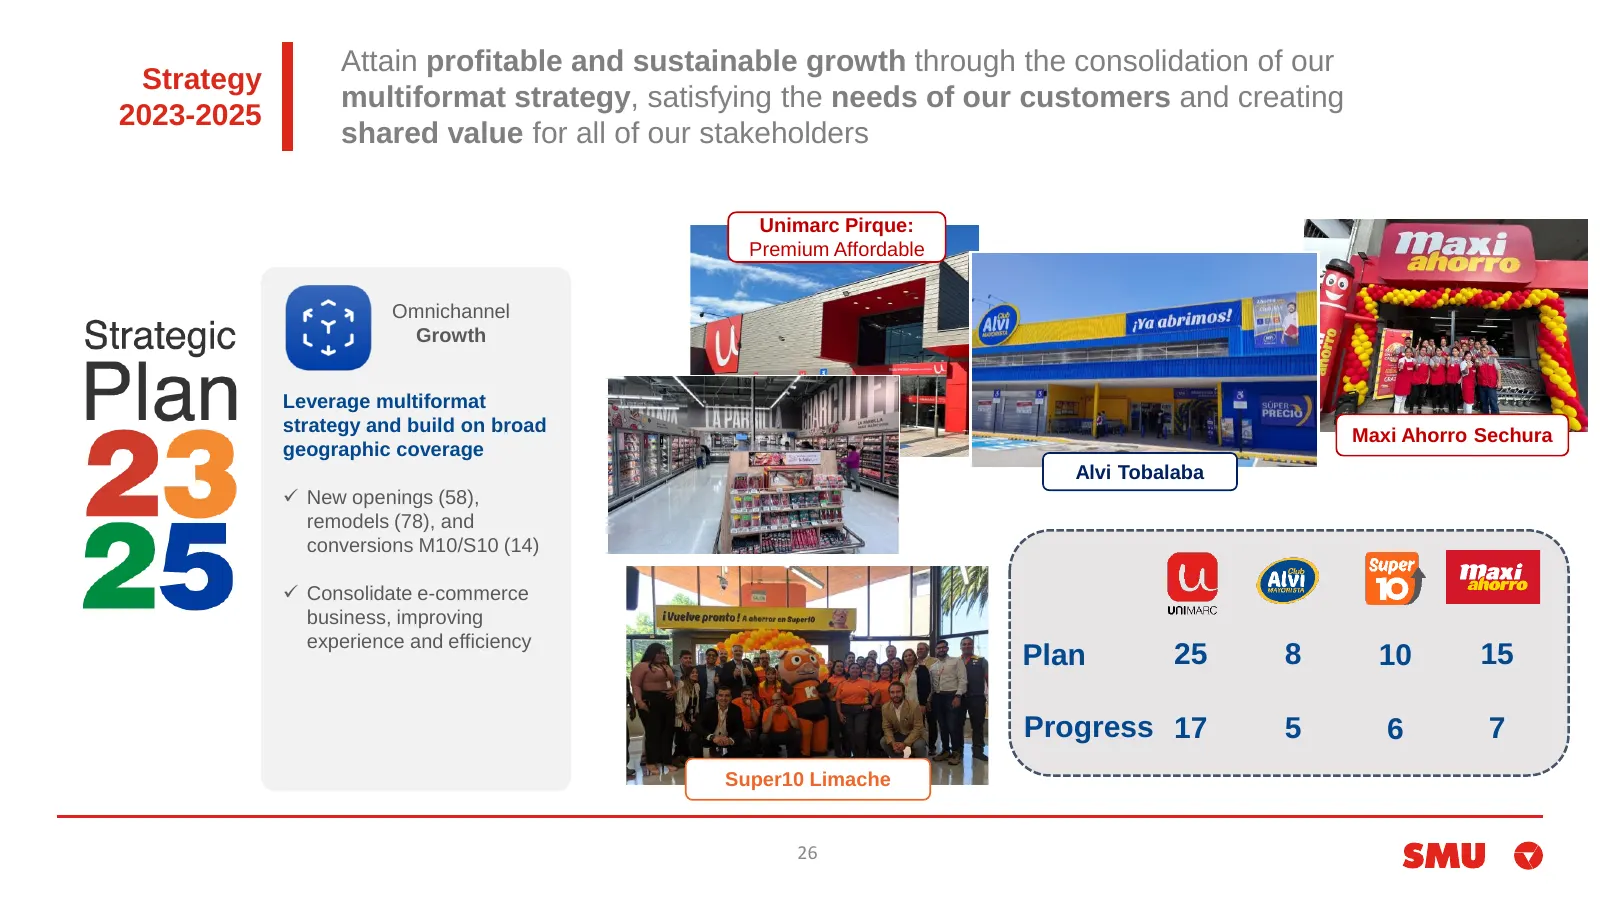
Attain profitable and sustainable growth through the consolidation of our Strategy multiformat strategy, satisfying the needs of our customers and creating 2023-2025 shared value for all of our stakeholders Unimarc Pirque: Premium Affordable Omnichannel Growth Leverage multiformat strategy and build
Slide 27: Strategy 2023-2025: Customer Experience
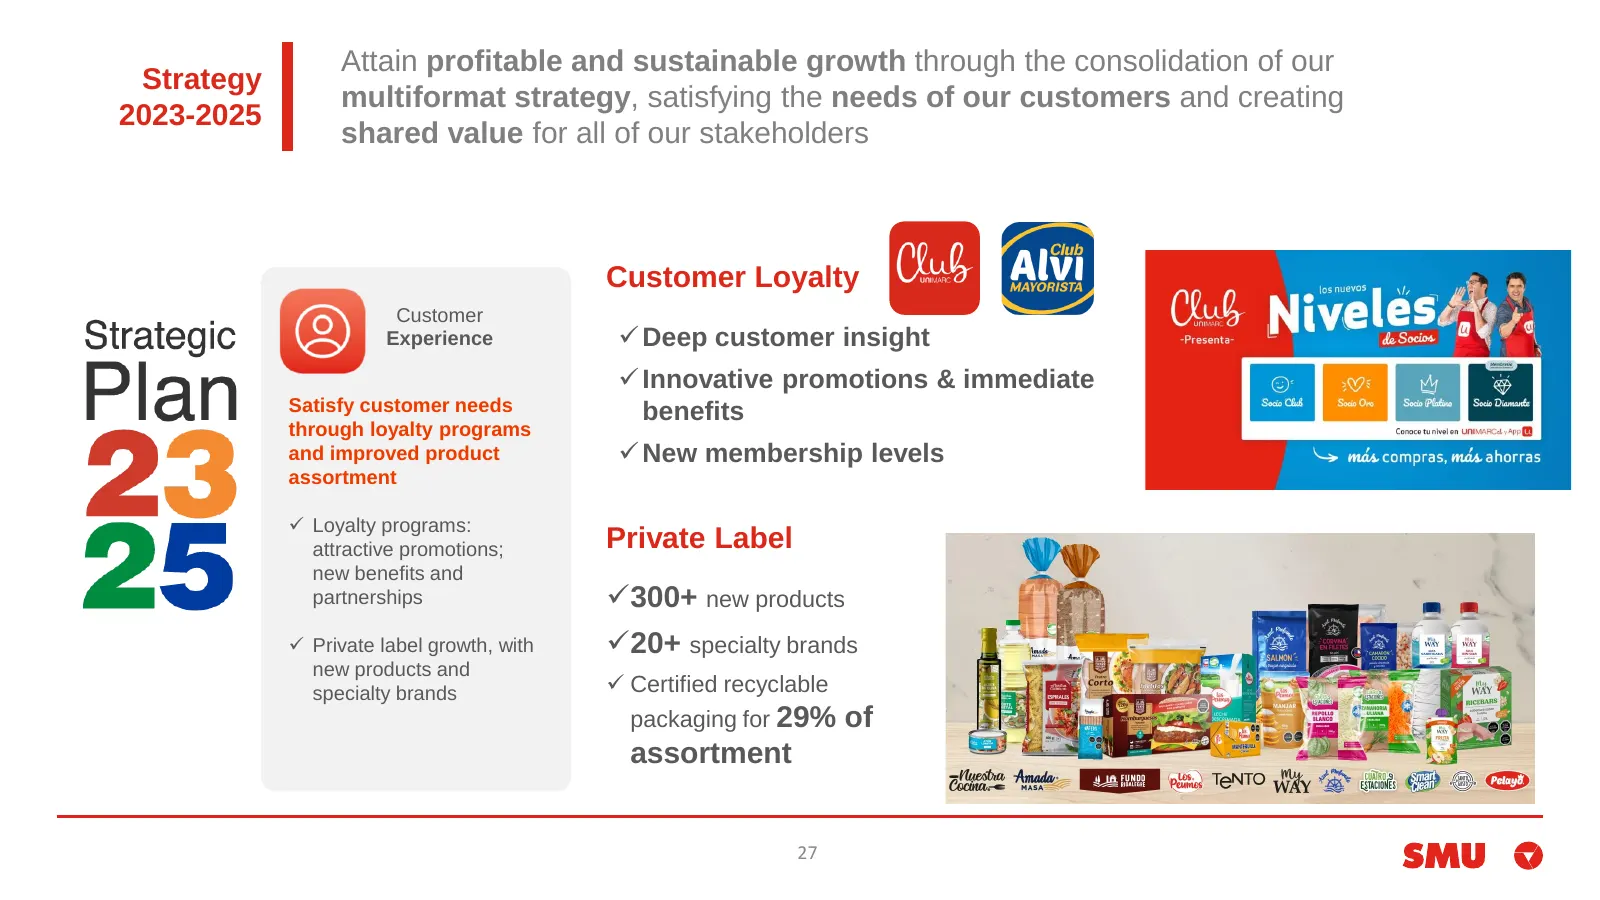
Attain profitable and sustainable growth through the consolidation of our Strategy multiformat strategy, satisfying the needs of our customers and creating 2023-2025 shared value for all of our stakeholders Customer Loyalty Customer Experience ✓ Deep customer insight ✓ Innovative promotions & immedi
Slide 28: Strategy 2023-2025: Efficiency & Productivity
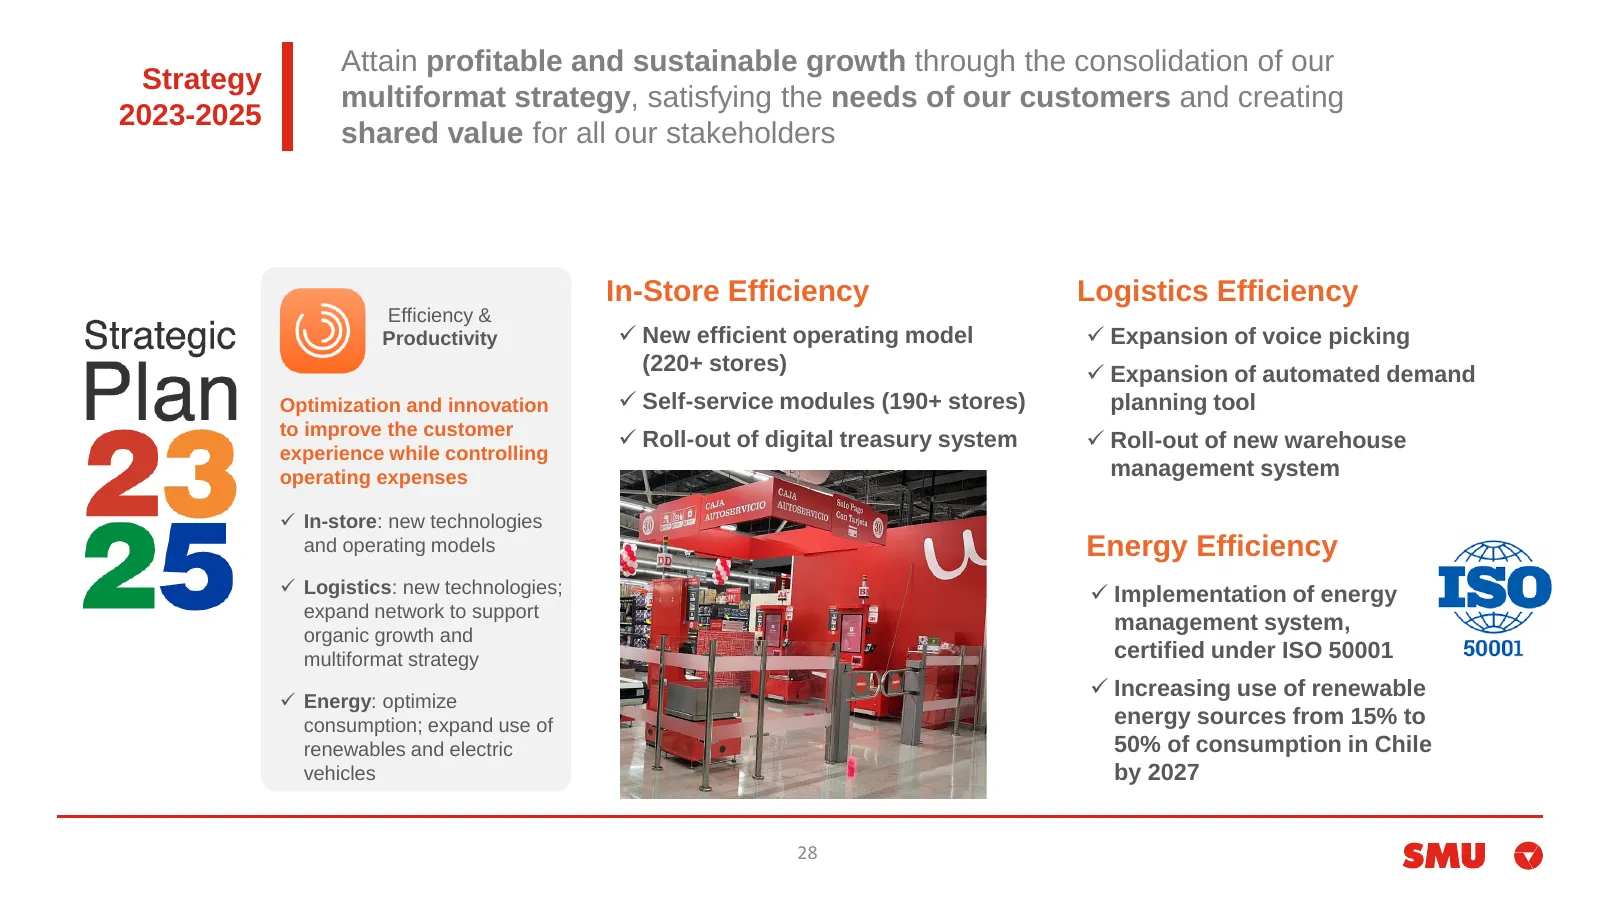
Attain profitable and sustainable growth through the consolidation of our Strategy multiformat strategy, satisfying the needs of our customers and creating 2023-2025 shared value for all our stakeholders In-Store Efficiency Logistics Efficiency Efficiency & Productivity ✓ New efficient operating mod
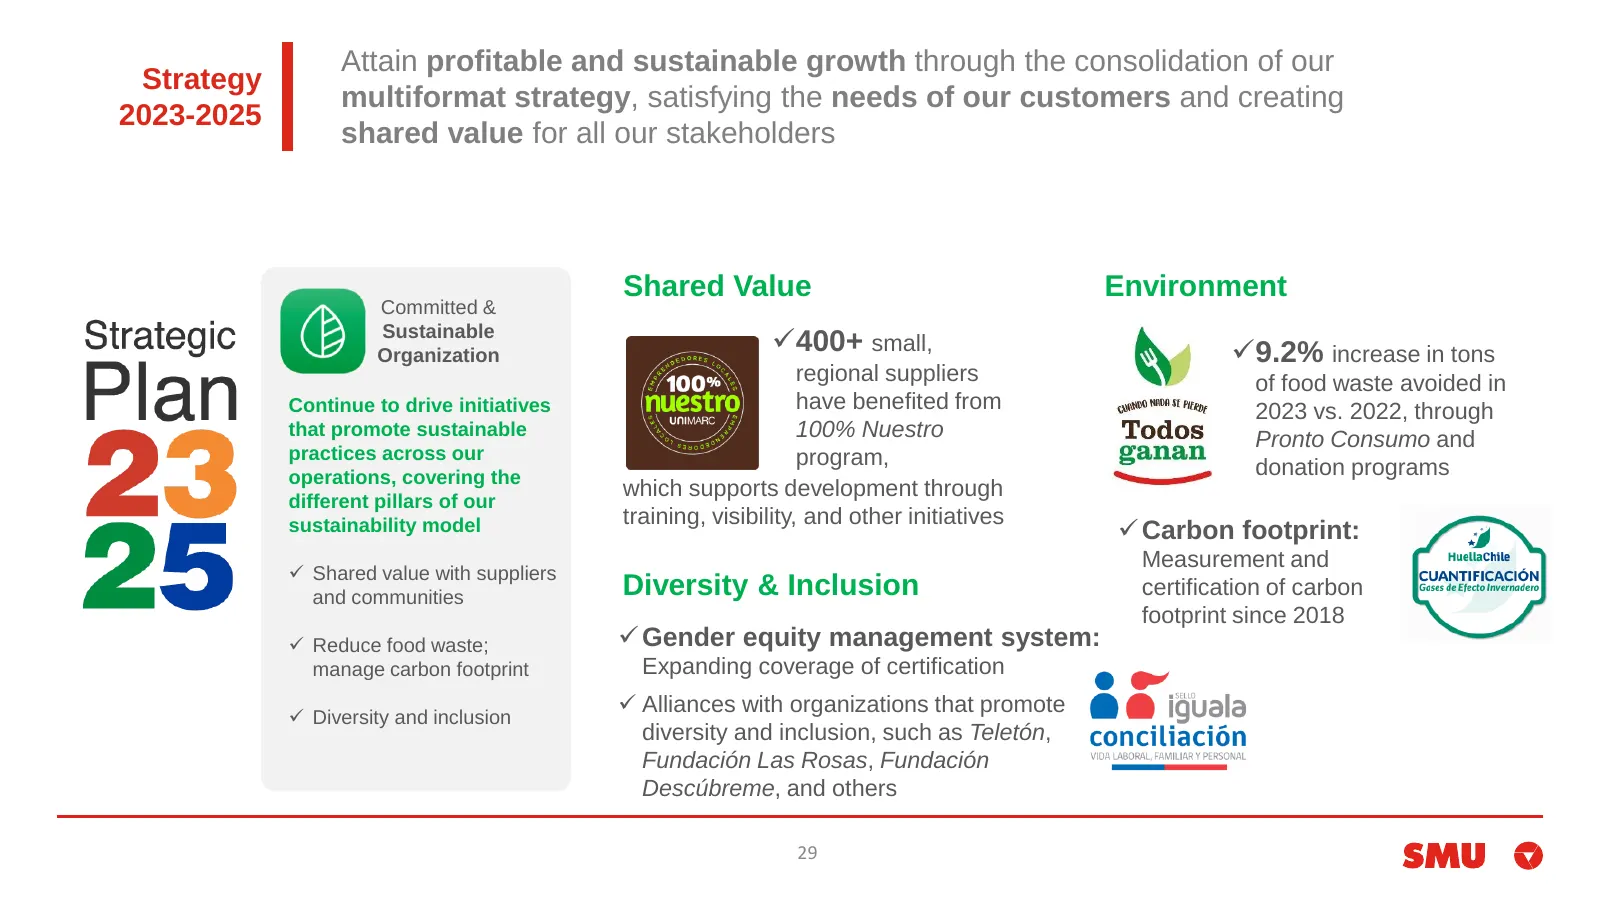
Slide 29: Strategy 2023-2025: Committed & Sustainable Organization
Attain profitable and sustainable growth through the consolidation of our Strategy multiformat strategy, satisfying the needs of our customers and creating 2023-2025 shared value for all our stakeholders Shared Value Environment Committed & Sustainable Organization ✓400+ small, ✓9.2% increase in ton
Slide 30: Corporate Presentation
Corporate Presentation May 2025
Source: Internet Archive copy of assets.ctfassets.net
More decks from Smu SA
 Q3 2026 Earnings Presentation24 slides · Nov 11, 2026
 Q3 2026 Earnings Presentation24 slides · November 2026
 Investor Presentation (September 2026)20 slides · September 2026
 Q2 2026 Earnings Presentation23 slides · August 2026
 Debt Investor Presentation (May 2026)27 slides · May 2026
 Q1 2026 Earnings Presentation26 slides · May 2026