Smu SA · BCS:SMU
Smu SA — Q3 2026 Earnings Presentation
24 slides from Smu SA's earnings presentation, Nov 11, 2026
Slide 1: Earnings Conference Call 3Q26
Earnings Conference Call 3Q26 November 11, 2026 9:00 am ET / 11:00 am Chile
Slide 2: Caution Regarding Forward-Looking Statements
Caution Regarding Forward-Looking Statements This presentation contains forward-looking statements. We have based all forward-looking statements largely on our current beliefs, expectations and projections about future events and financial trends affecting our business. Although management considers
Slide 3: Strategic Plan 2026-2028: Growth + Competitiveness + Efficiency
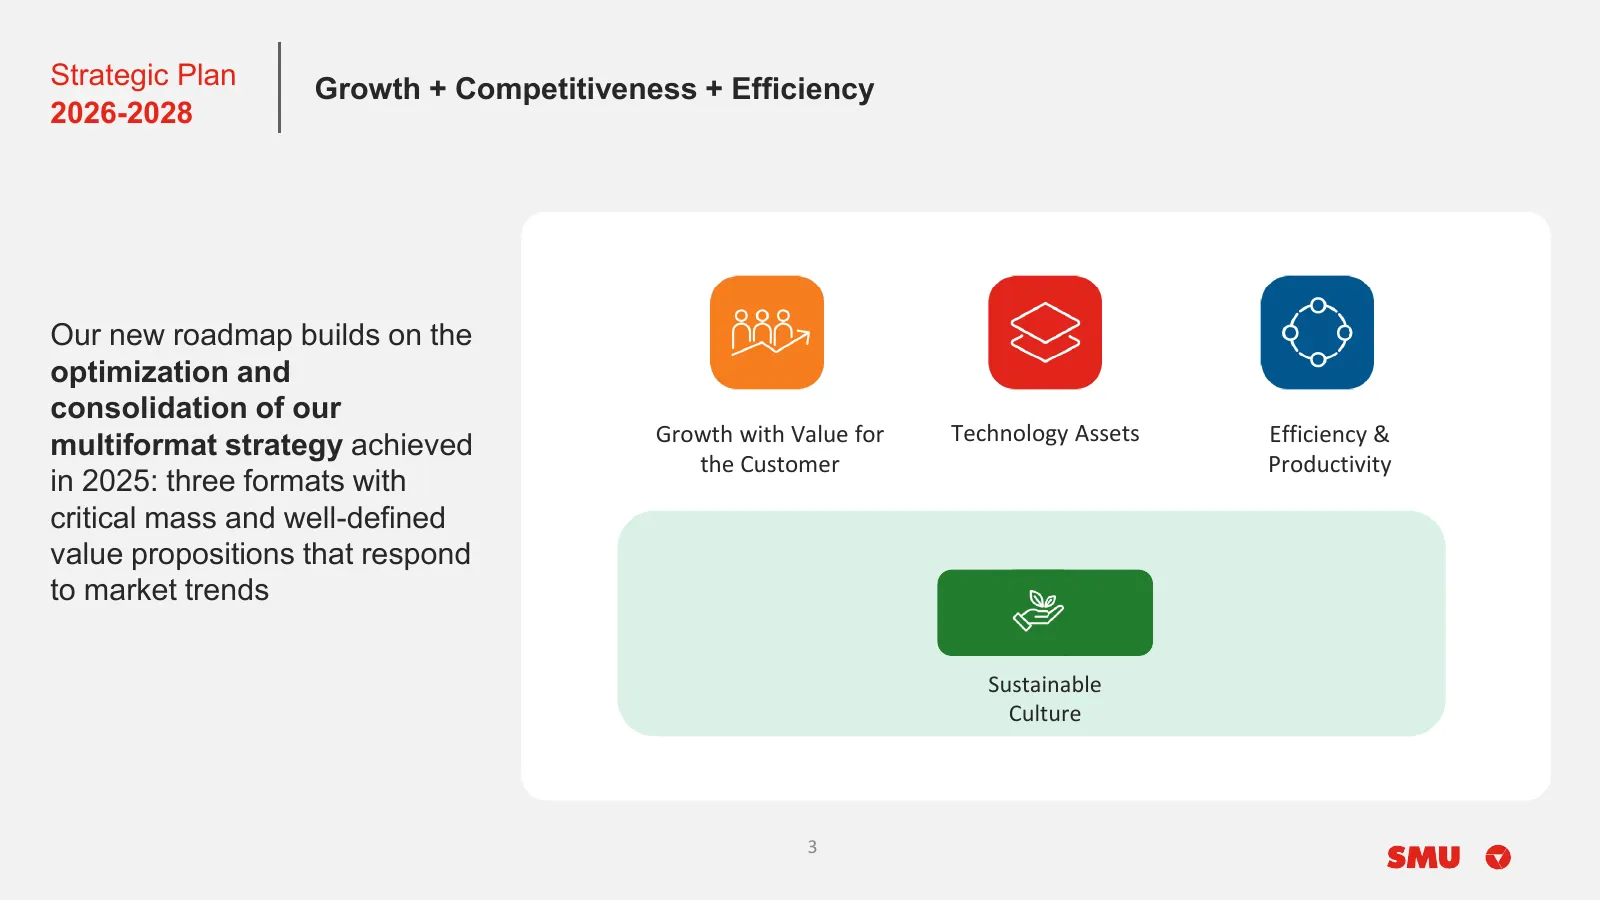
Strategic Plan Growth + Competitiveness + Efficiency 2026-2028 Our new roadmap builds on the optimization and consolidation of our Growth with Value for Technology Assets Efficiency & multiformat strategy achieved the Customer Productivity in 2025: three formats with critical mass and well-defined v
Slide 4: Store Openings & Upgrades
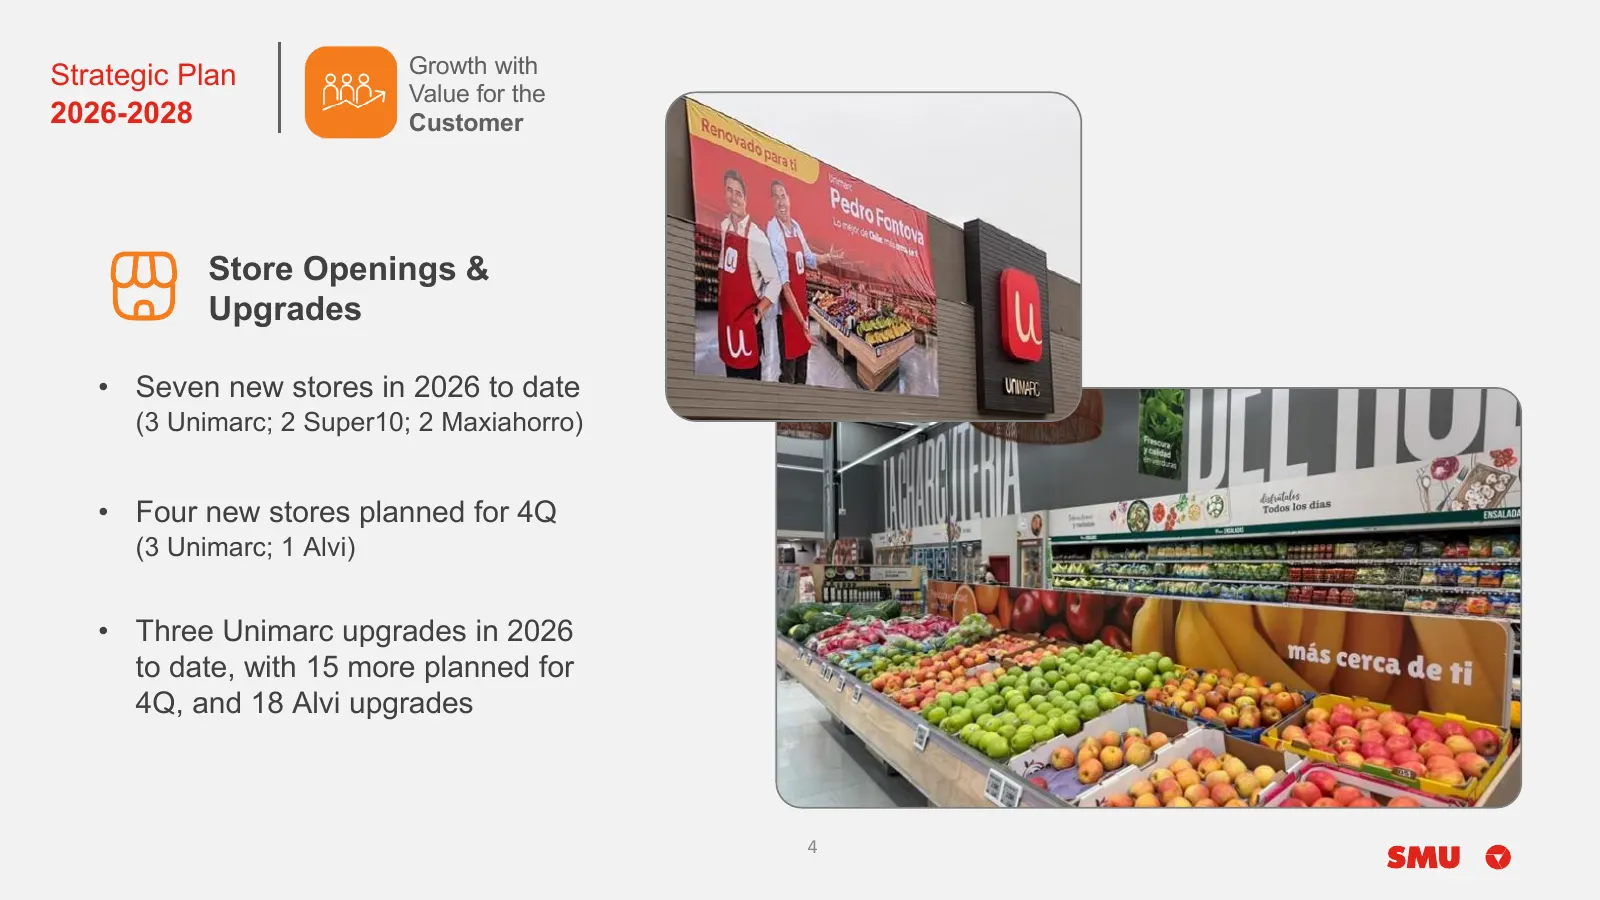
Strategic Plan Growth with Value for the 2026-2028 Customer Store Openings & Upgrades • Seven new stores in 2026 to date (3 Unimarc; 2 Super10; 2 Maxiahorro) • Four new stores planned for 4Q (3 Unimarc; 1 Alvi) • Three Unimarc upgrades in 2026 to date, with 15 more planned for 4Q, and 18 Alvi upgrad
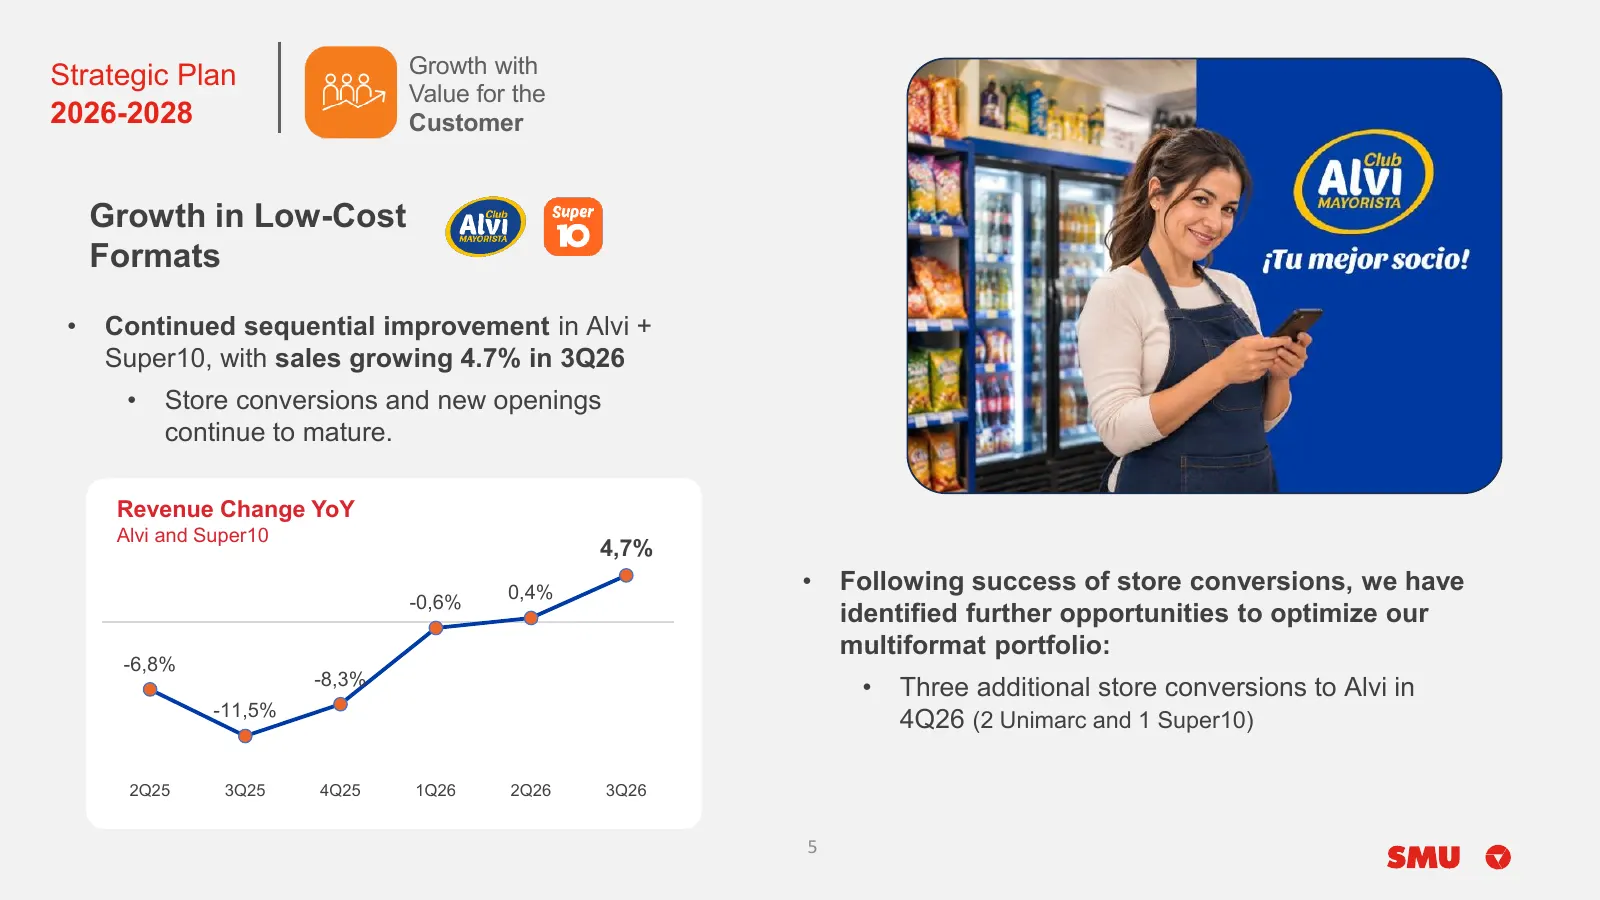
Slide 5: Growth in Low-Cost Formats
Strategic Plan Growth with Value for the 2026-2028 Customer Growth in Low-Cost Formats • Continued sequential improvement in Alvi + Super10, with sales growing 4.7% in 3Q26 • Store conversions and new openings continue to mature. Revenue Change YoY Alvi and Super10 4,7% 0,4% • Following success of s
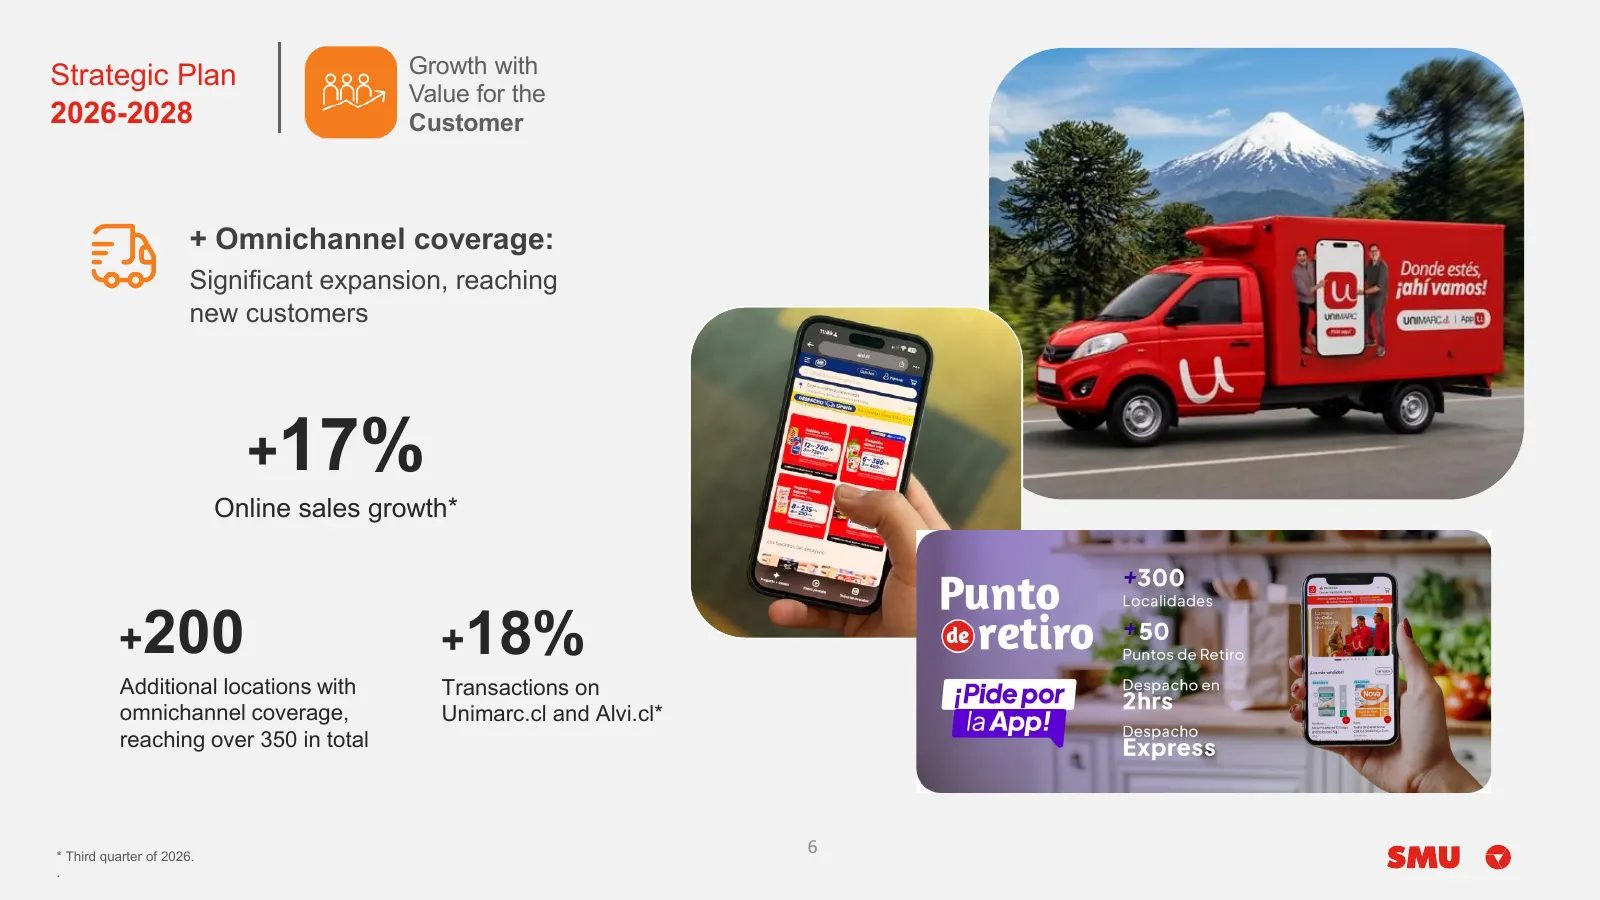
Slide 6: Omnichannel coverage
Strategic Plan Growth with Value for the 2026-2028 Customer + Omnichannel coverage: Significant expansion, reaching new customers +17% Online sales growth* +200 +18% Additional locations with Transactions on omnichannel coverage, Unimarc.cl and Alvi.cl* reaching over 350 in total * Third quarter of
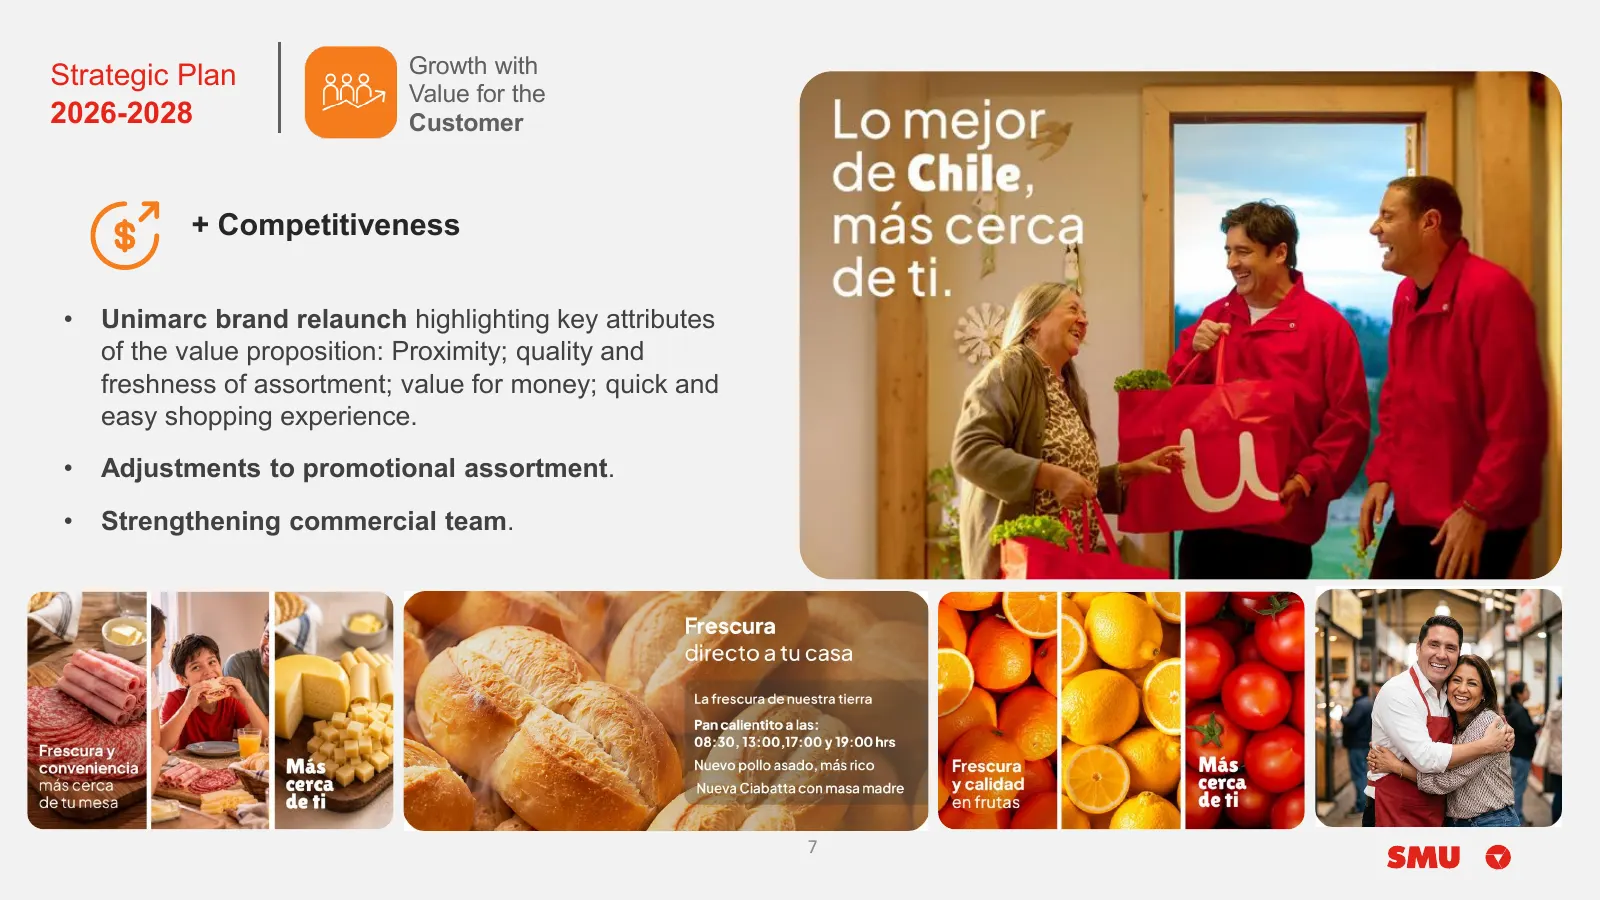
Slide 7: Competitiveness
Strategic Plan Growth with Value for the 2026-2028 Customer + Competitiveness • Unimarc brand relaunch highlighting key attributes of the value proposition: Proximity; quality and freshness of assortment; value for money; quick and easy shopping experience. • Adjustments to promotional assortment. •
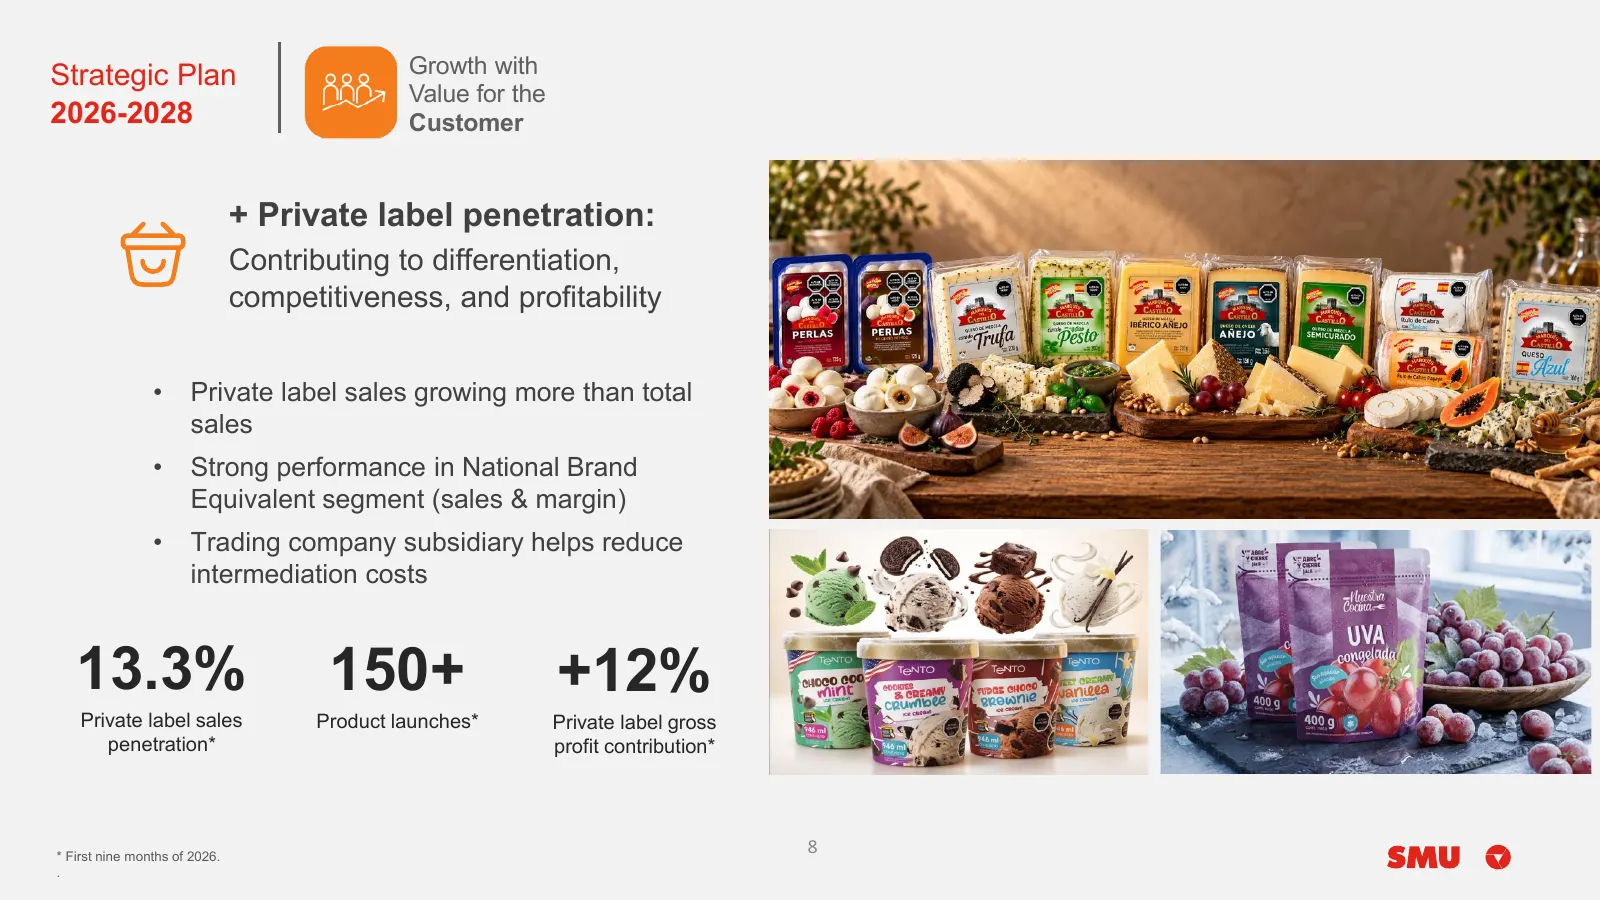
Slide 8: Private label penetration
Strategic Plan Growth with Value for the 2026-2028 Customer + Private label penetration: Contributing to differentiation, competitiveness, and profitability • Private label sales growing more than total sales • Strong performance in National Brand Equivalent segment (sales & margin) • Trading compan
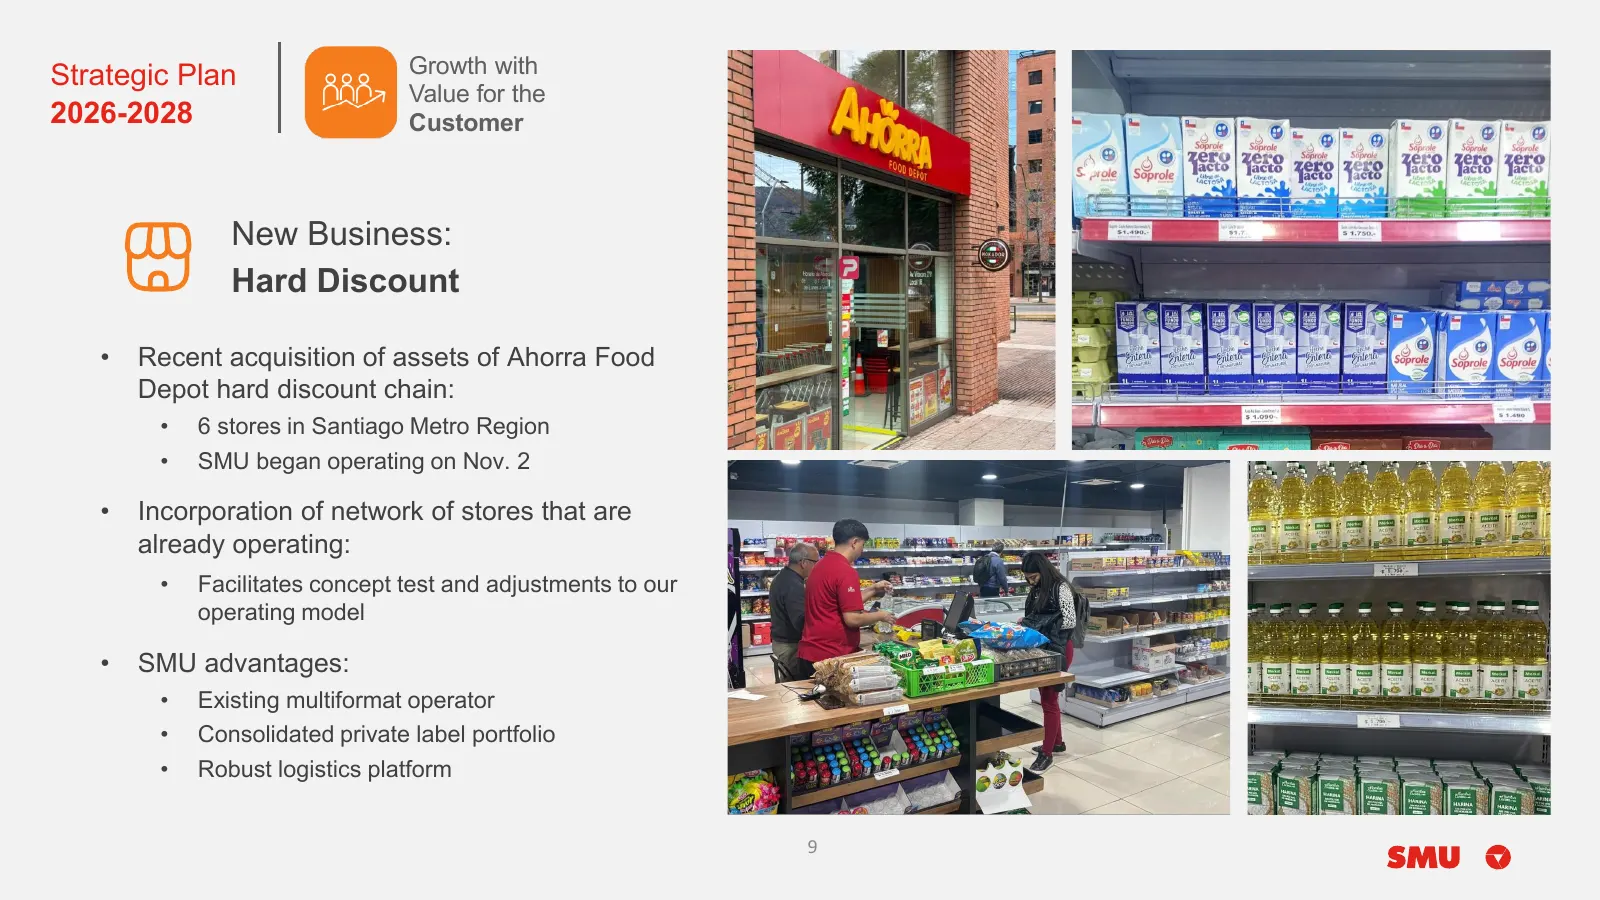
Slide 9: New Business: Hard Discount
Strategic Plan Growth with Value for the 2026-2028 Customer New Business: Hard Discount • Recent acquisition of assets of Ahorra Food Depot hard discount chain: • 6 stores in Santiago Metro Region • SMU began operating on Nov. 2 • Incorporation of network of stores that are already operating: • Faci
Slide 10: Cloud First and New Technologies
Strategic Plan Technology 2026-2028 Assets Cloud First New Technologies ✓ Data warehouse migrated New AI platform (Gemini to cloud. Enterprise): ✓ Implementation process ✓ Training for increased under way: connections to productivity at individual level Google Cloud Platform ✓ Analyzing potential op
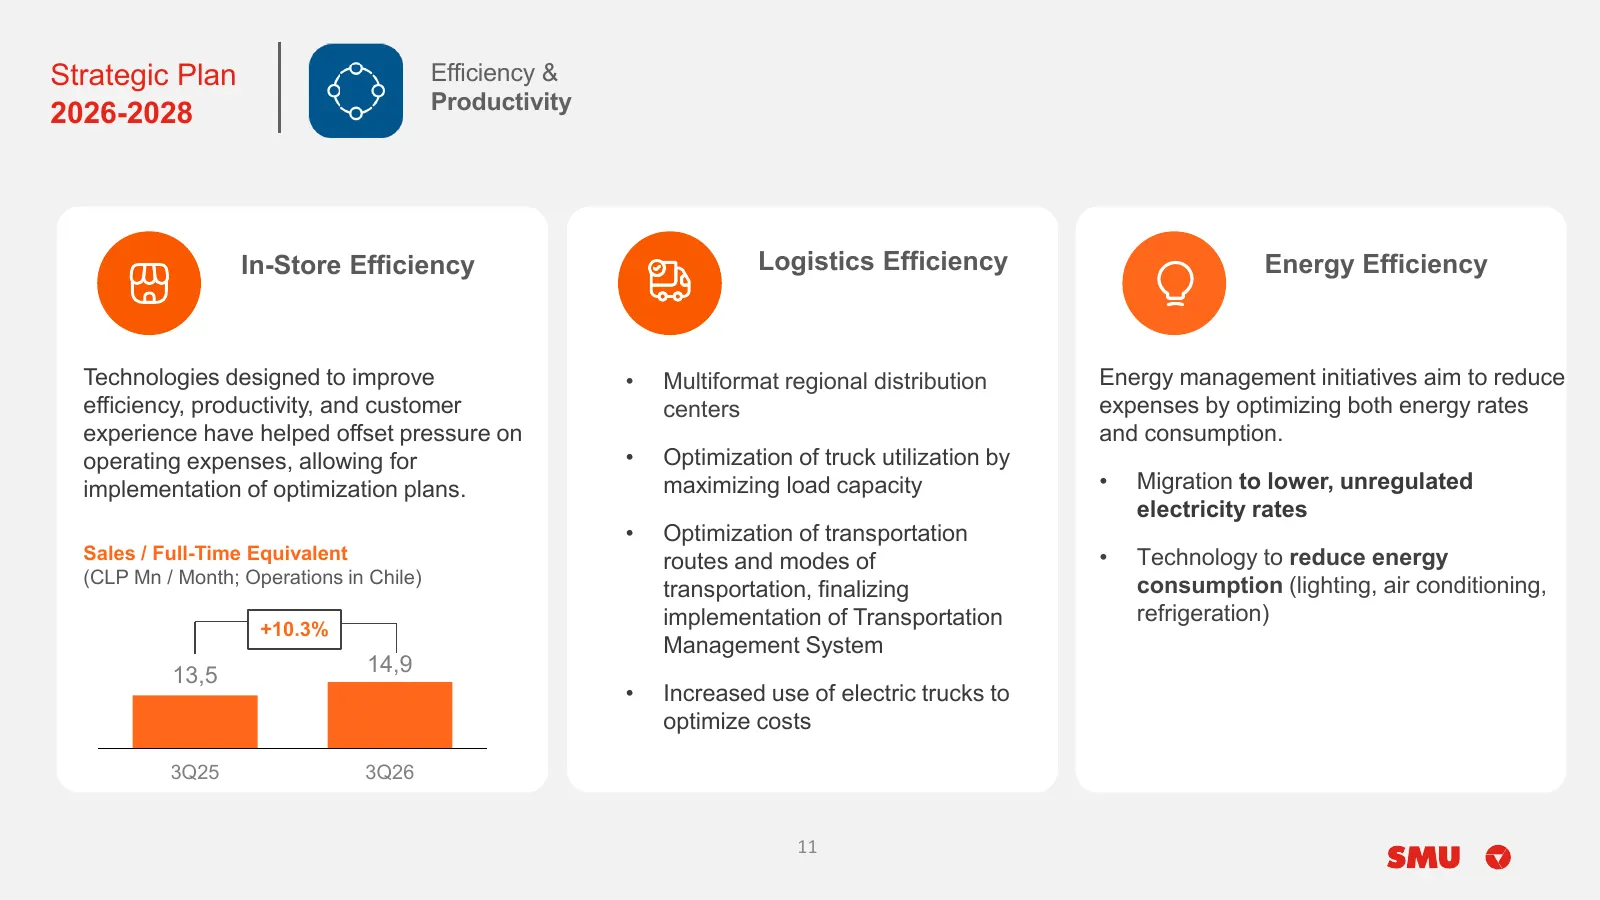
Slide 11: Efficiency & Productivity
Strategic Plan Efficiency & Productivity 2026-2028 In-Store Efficiency Logistics Efficiency Energy Efficiency Technologies designed to improve • Multiformat regional distribution Energy management initiatives aim to reduce efficiency, productivity, and customer centers expenses by optimizing both en
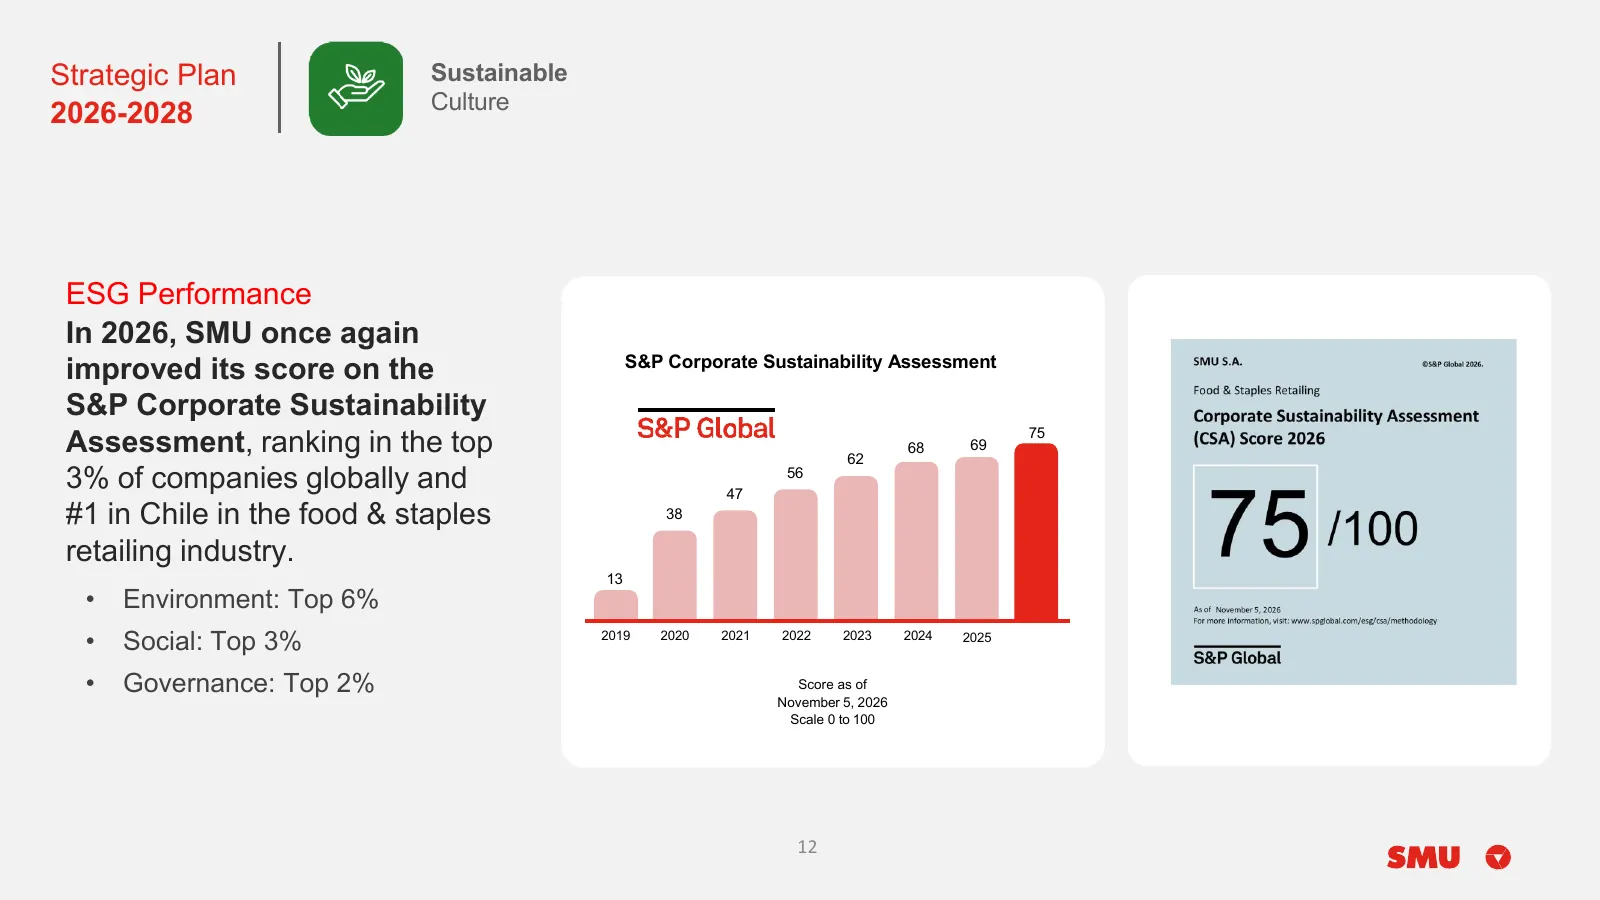
Slide 12: ESG Performance
Strategic Plan Sustainable Culture 2026-2028 ESG Performance In 2026, SMU once again S&P Corporate Sustainability Assessment improved its score on the S&P Corporate Sustainability Assessment, ranking in the top 62 68 69 75 3% of companies globally and 47 56 #1 in Chile in the food & staples 38 retai
Slide 13: Revenue and Gross Profit
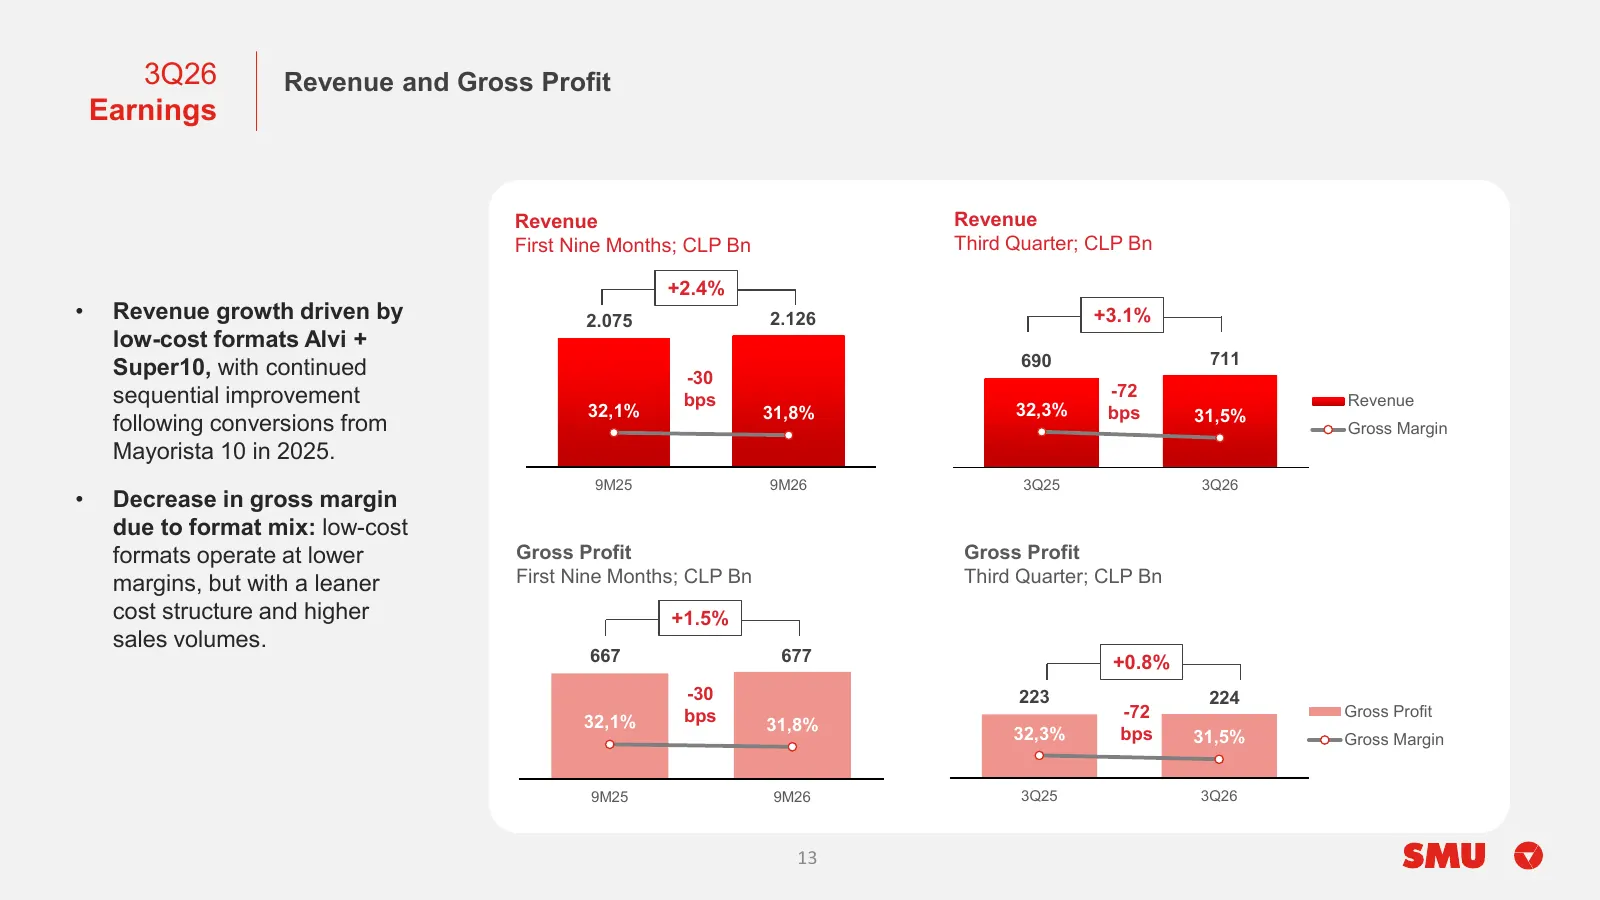
3Q26 Revenue and Gross Profit Earnings Revenue Revenue First Nine Months; CLP Bn Third Quarter; CLP Bn +2.4% • Revenue growth driven by 2.075 2.126 +3.1% low-cost formats Alvi + 690 711 Super10, with continued -30 sequential improvement -72 bps Revenue 32,1% 31,8% 32,3% bps 31,5% following conversio
Slide 14: Revenue Change by Format
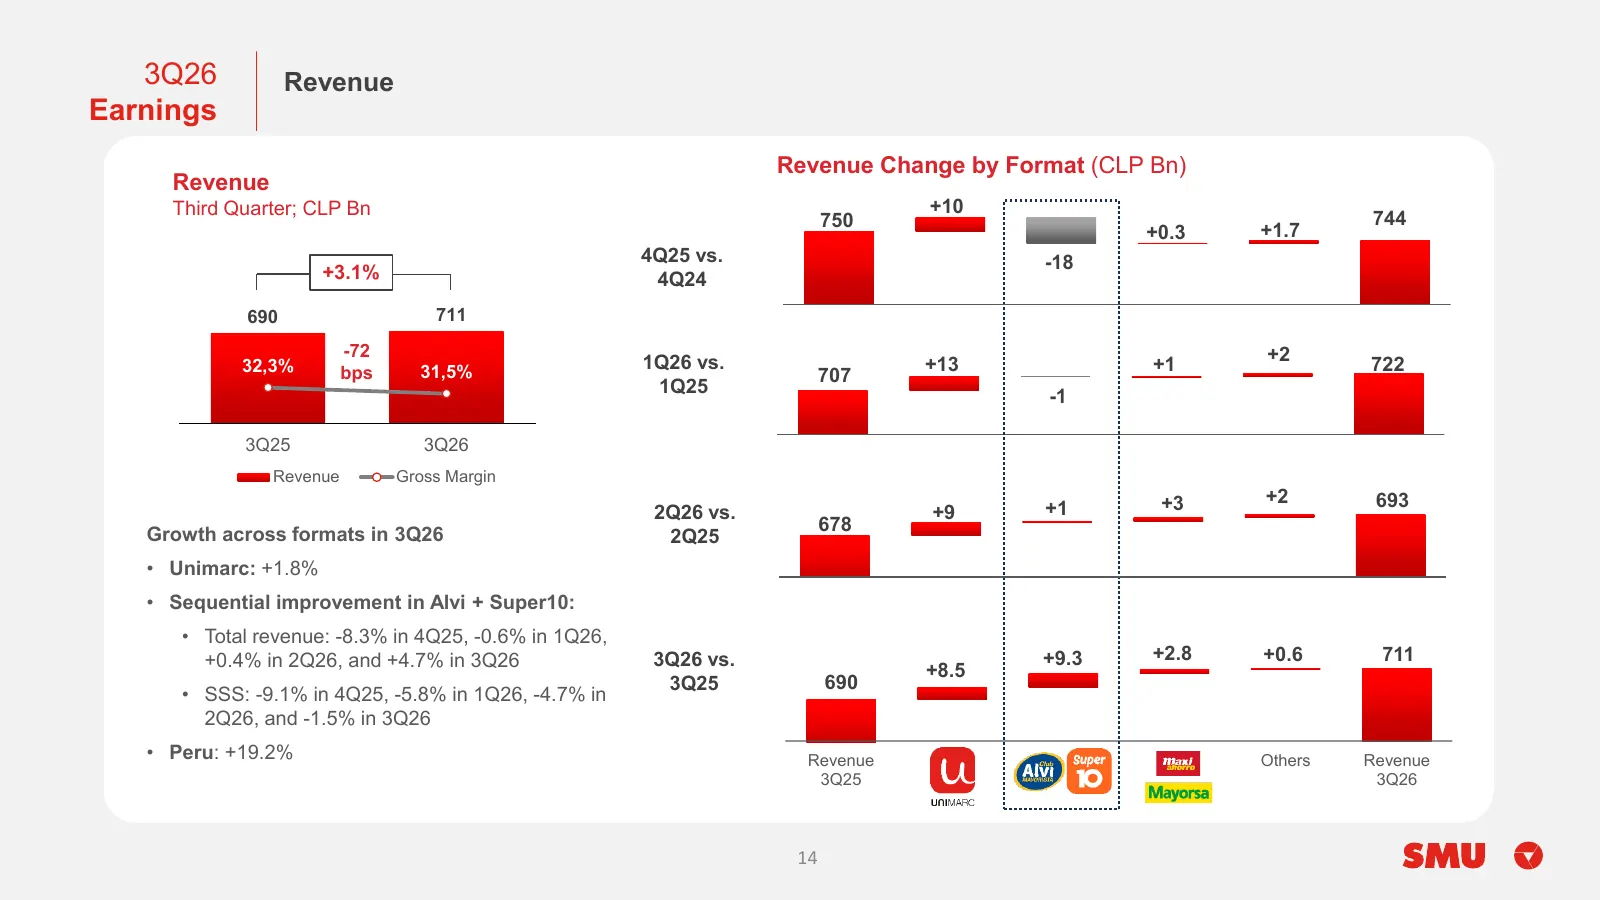
3Q26 Revenue Earnings Revenue Change by Format (CLP Bn) Revenue Third Quarter; CLP Bn +10 750 744 +0.3 +1.7 4Q25 vs. -18 +3.1% 4Q24 690 711 -72 +2 32,3% 31,5% 1Q26 vs. +13 +1 722 bps 707 1Q25 -1 3Q25 3Q26 Revenue Gross Margin +3 +2 693 2Q26 vs. +9 +1 678 Growth across formats in 3Q26 2Q25 • Unimarc:
Slide 15: Operating Expenses
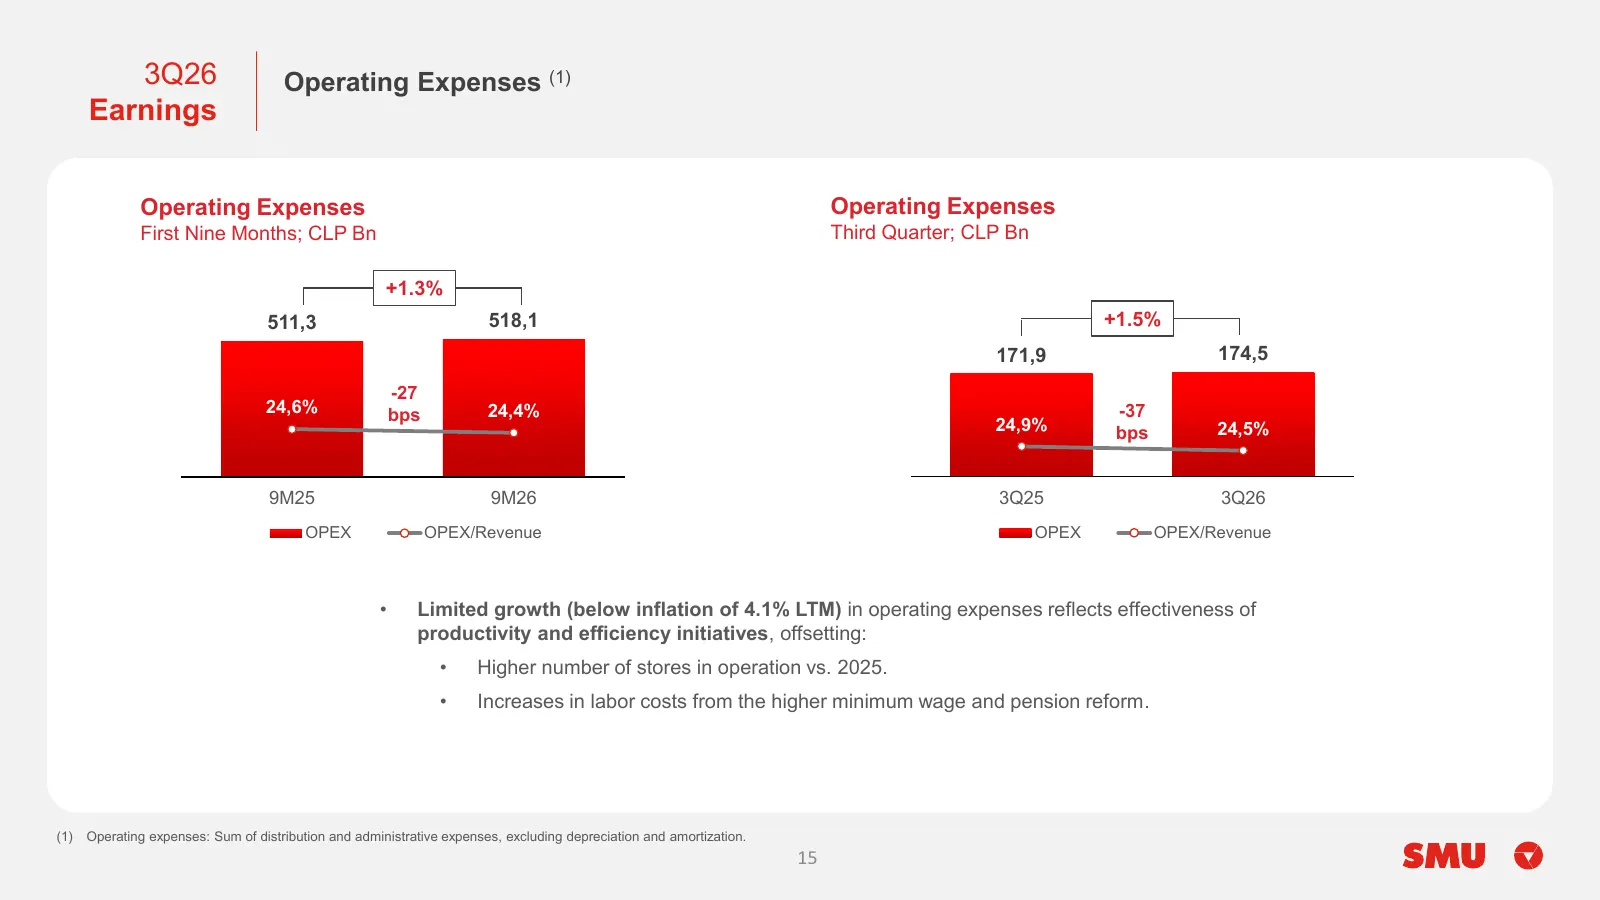
3Q26 Operating Expenses (1) Earnings Operating Expenses Operating Expenses First Nine Months; CLP Bn Third Quarter; CLP Bn +1.3% 511,3 518,1 +1.5% 171,9 174,5 -27 24,6% bps 24,4% -37 24,9% bps 24,5% 9M25 9M26 3Q25 3Q26 OPEX OPEX/Revenue OPEX OPEX/Revenue • Limited growth (below inflation of 4.1% LTM
Slide 16: Operating Expenses Breakdown
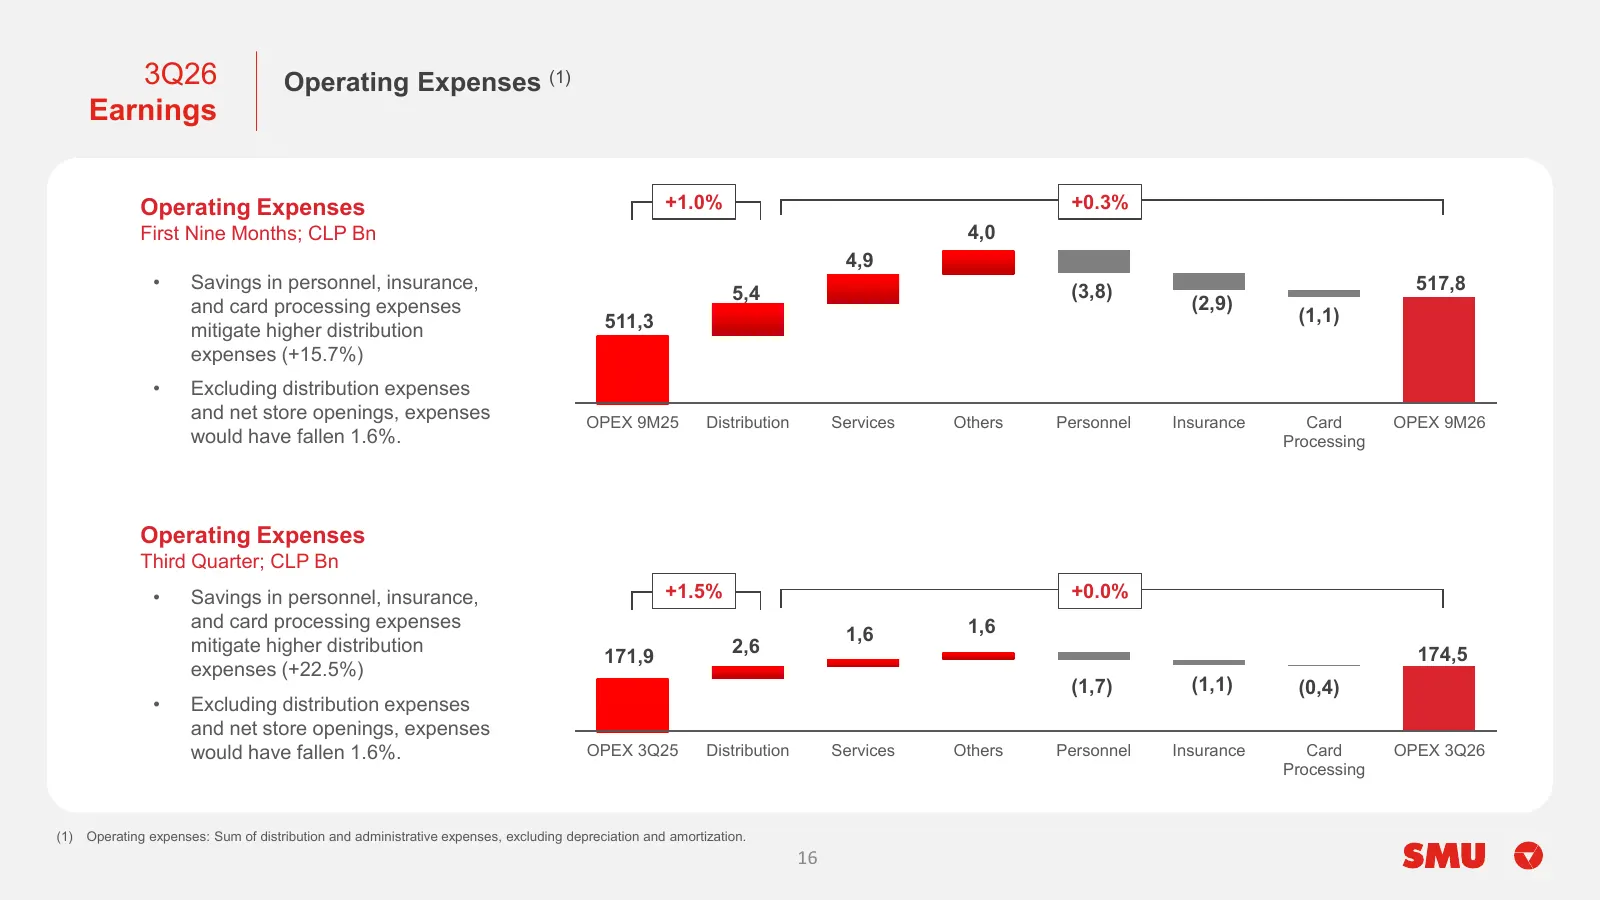
3Q26 Operating Expenses (1) Earnings Operating Expenses +1.0% +0.3% First Nine Months; CLP Bn 4,0 4,9 • Savings in personnel, insurance, (3,8) 517,8 5,4 and card processing expenses (2,9) 511,3 (1,1) mitigate higher distribution expenses (+15.7%) • Excluding distribution expenses and net store openi
Slide 17: EBITDA
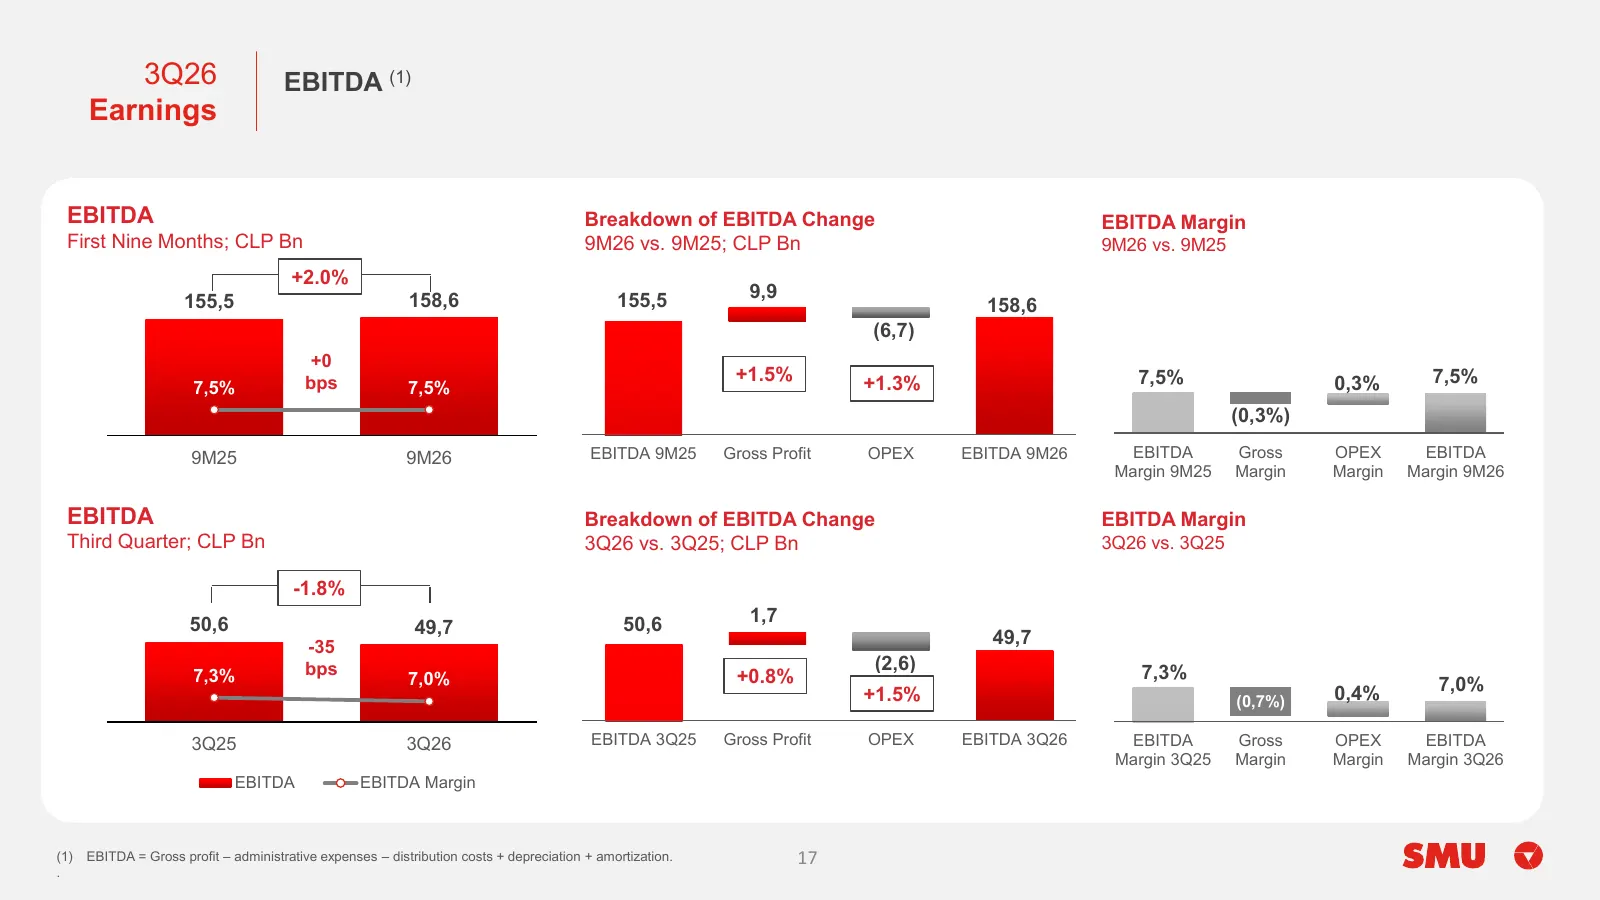
3Q26 EBITDA (1) Earnings EBITDA Breakdown of EBITDA Change EBITDA Margin First Nine Months; CLP Bn 9M26 vs. 9M25; CLP Bn 9M26 vs. 9M25 +2.0% 158,6 155,5 9,9 155,5 158,6 (6,7) +0 bps +1.5% +1.3% 7,5% 0,3% 7,5% 7,5% 7,5% (0,3%) 9M25 9M26 EBITDA 9M25 Gross Profit OPEX EBITDA 9M26 EBITDA Gross OPEX EBIT
Slide 18: Non-operating Income
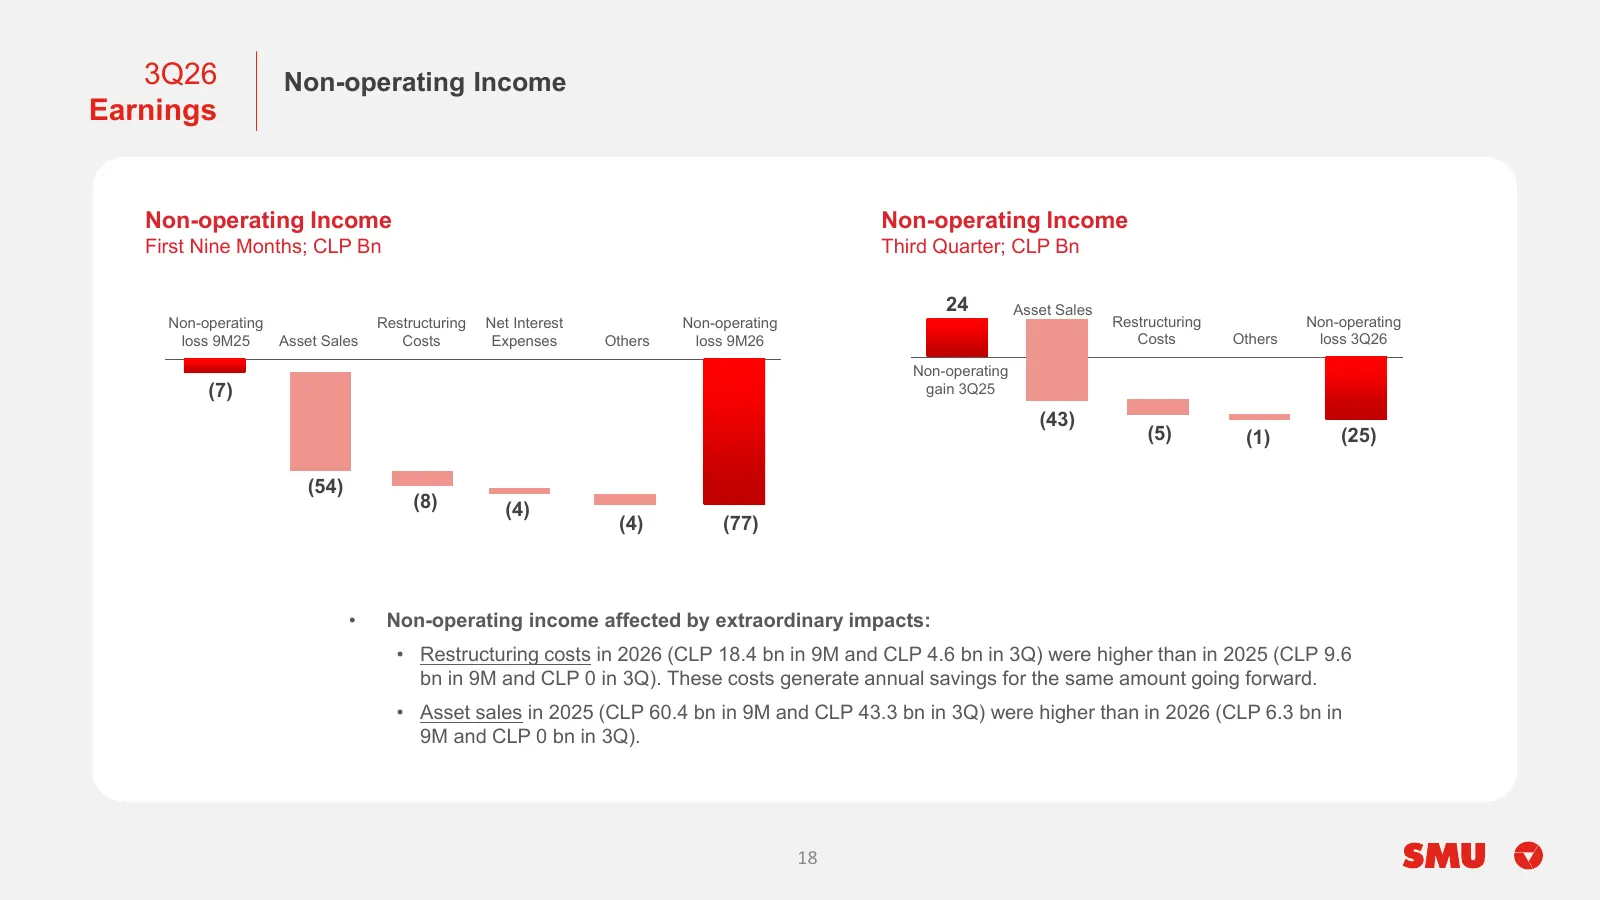
3Q26 Non-operating Income Earnings Non-operating Income Non-operating Income First Nine Months; CLP Bn Third Quarter; CLP Bn 24 Asset Sales Non-operating Restructuring Net Interest Non-operating Restructuring Non-operating loss 9M25 Asset Sales Costs Expenses Others loss 9M26 Costs Others loss 3Q26
Slide 19: Net Income
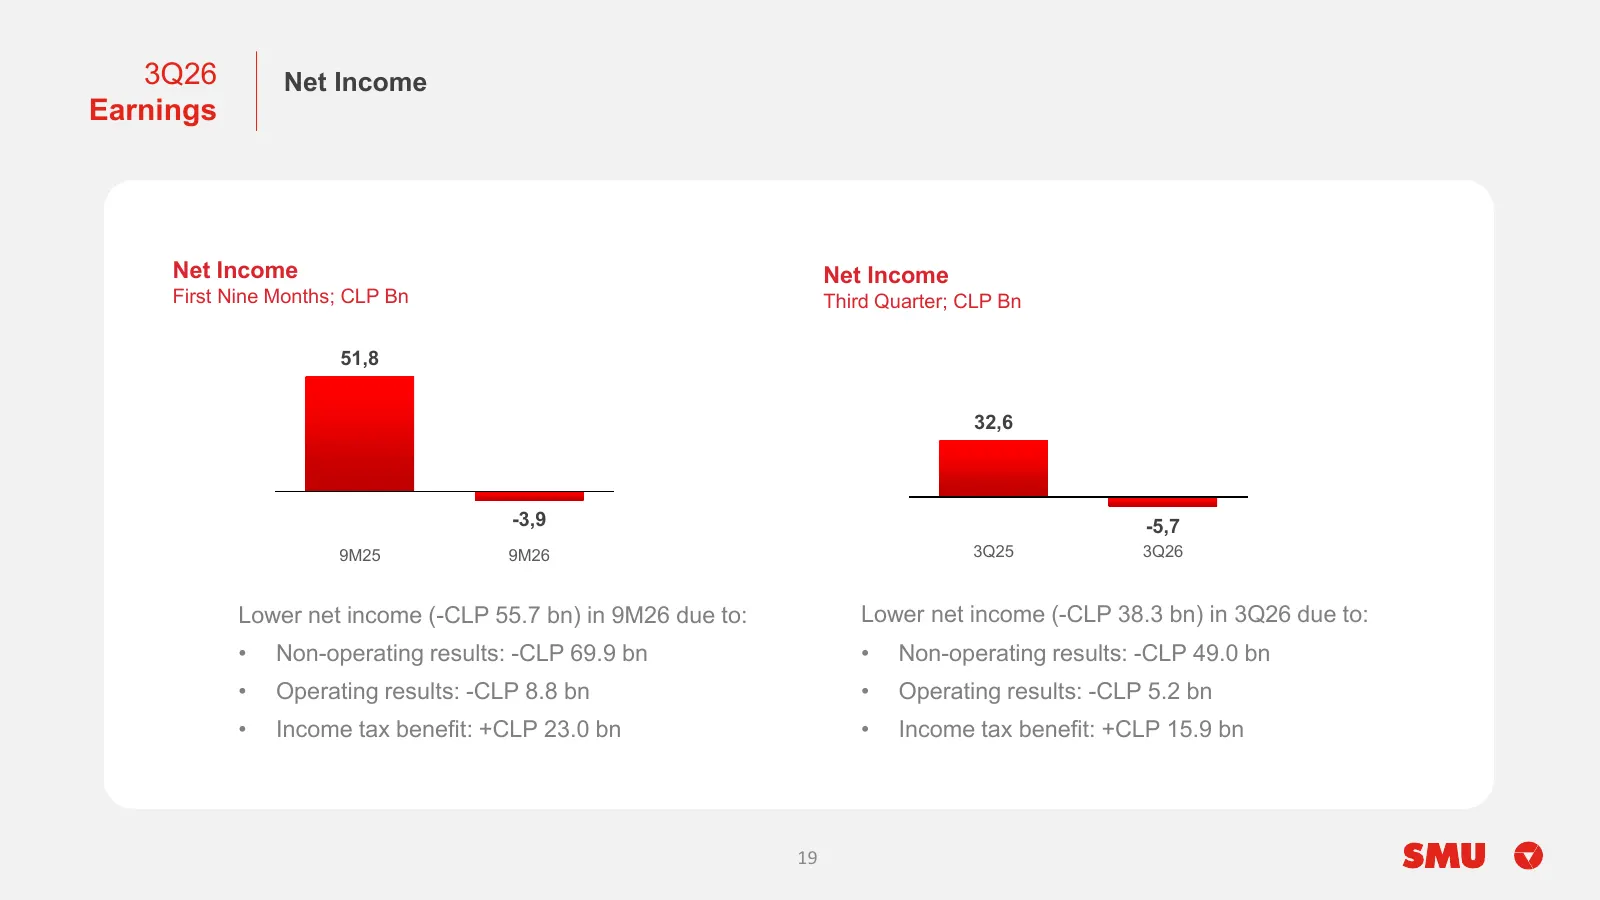
3Q26 Net Income Earnings Net Income Net Income First Nine Months; CLP Bn Third Quarter; CLP Bn 51,8 32,6 -3,9 -5,7 9M25 9M26 3Q25 3Q26 Lower net income (-CLP 55.7 bn) in 9M26 due to: Lower net income (-CLP 38.3 bn) in 3Q26 due to: • Non-operating results: -CLP 69.9 bn • Non-operating results: -CLP 4
Slide 20: Financial Ratios
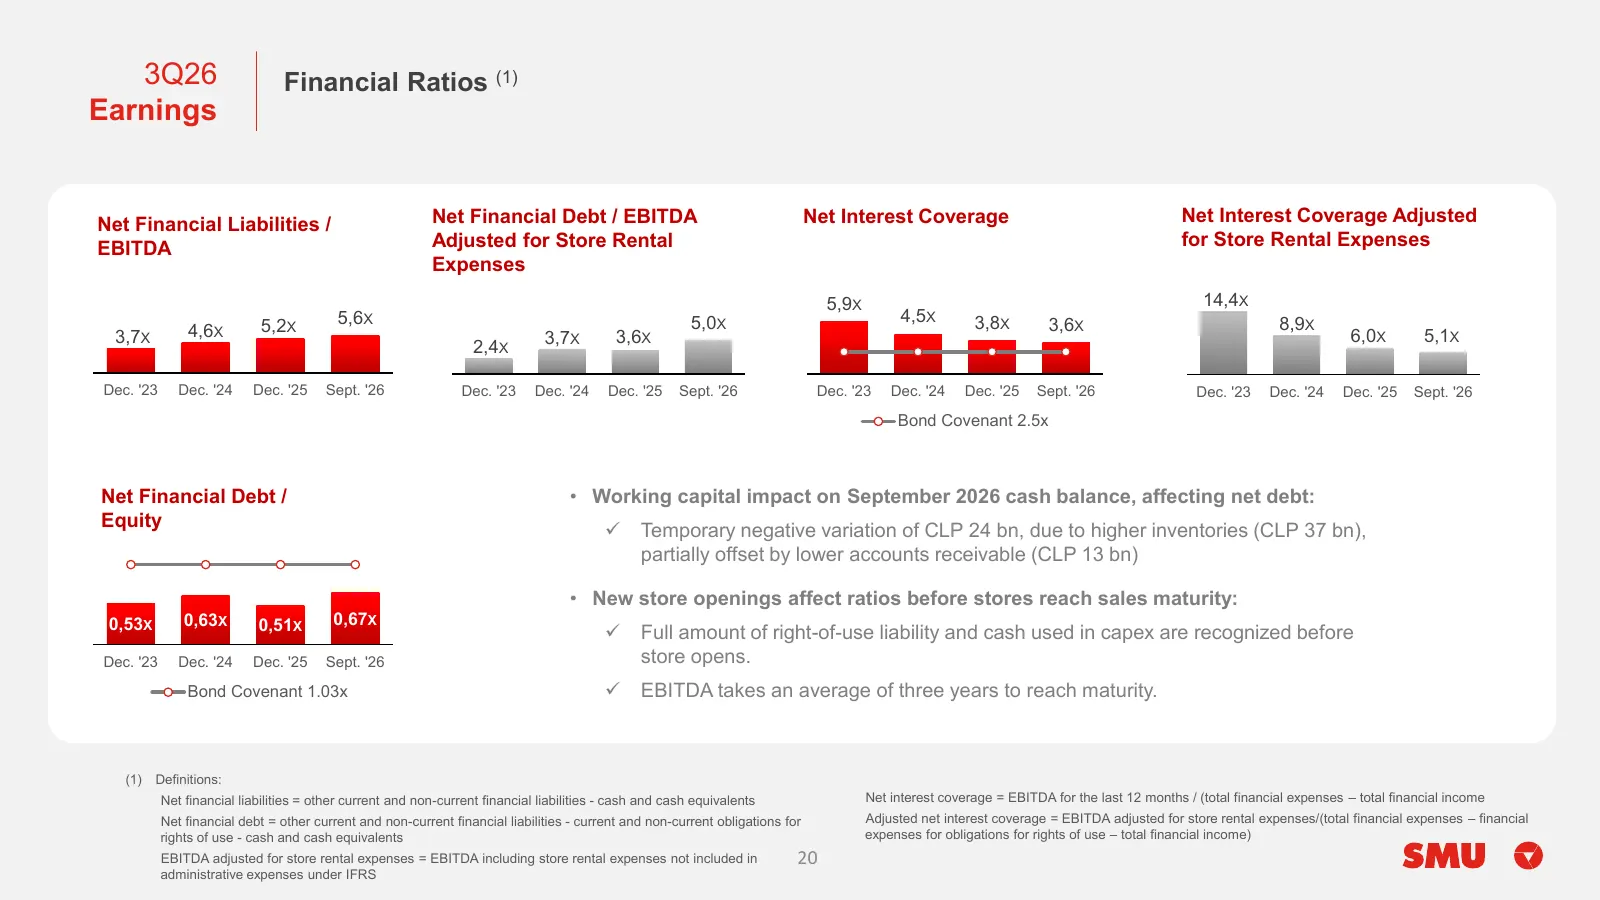
3Q26 Financial Ratios (1) Earnings Net Financial Liabilities / Net Financial Debt / EBITDA Net Interest Coverage Net Interest Coverage Adjusted EBITDA Adjusted for Store Rental for Store Rental Expenses Expenses 5,9X 14,4X 5,6X 5,0X 4,5X 3,8X 3,6X 8,9X 4,6X 5,2X 3,7X 3,7X 3,6X 6,0X 5,1X 2,4X Dec. '2
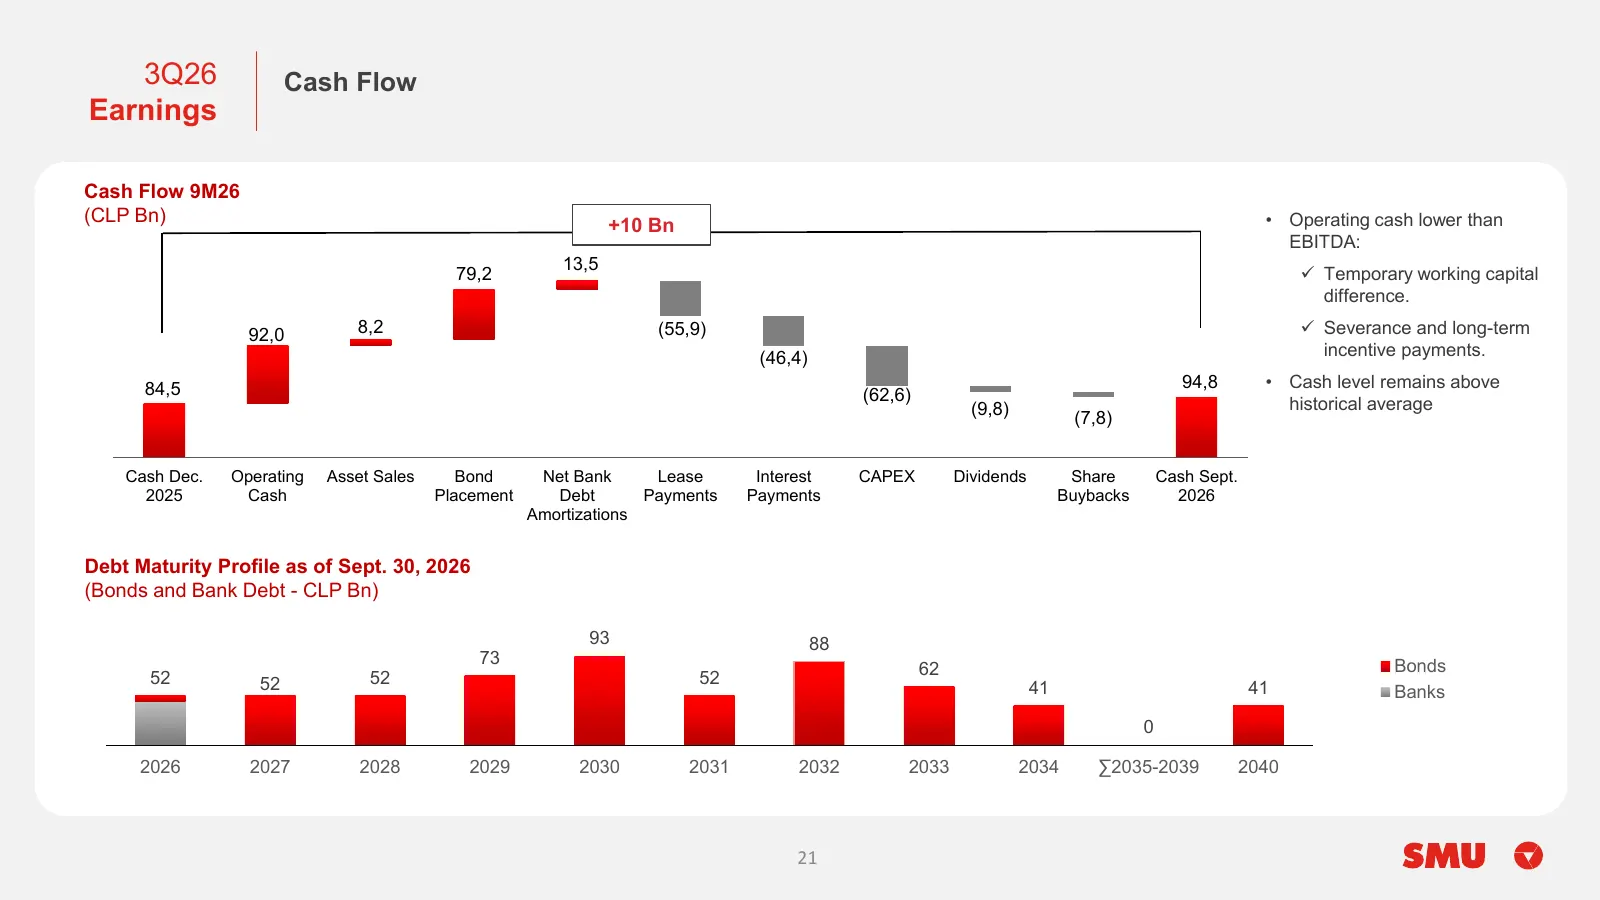
Slide 21: Cash Flow and Debt Maturity Profile
3Q26 Cash Flow Earnings Cash Flow 9M26 (CLP Bn) • Operating cash lower than +10 Bn EBITDA: 13,5 79,2 ✓ Temporary working capital difference. 92,0 8,2 (55,9) ✓ Severance and long-term (46,4) incentive payments. 84,5 94,8 • Cash level remains above (62,6) historical average (9,8) (7,8) Cash Dec. Opera
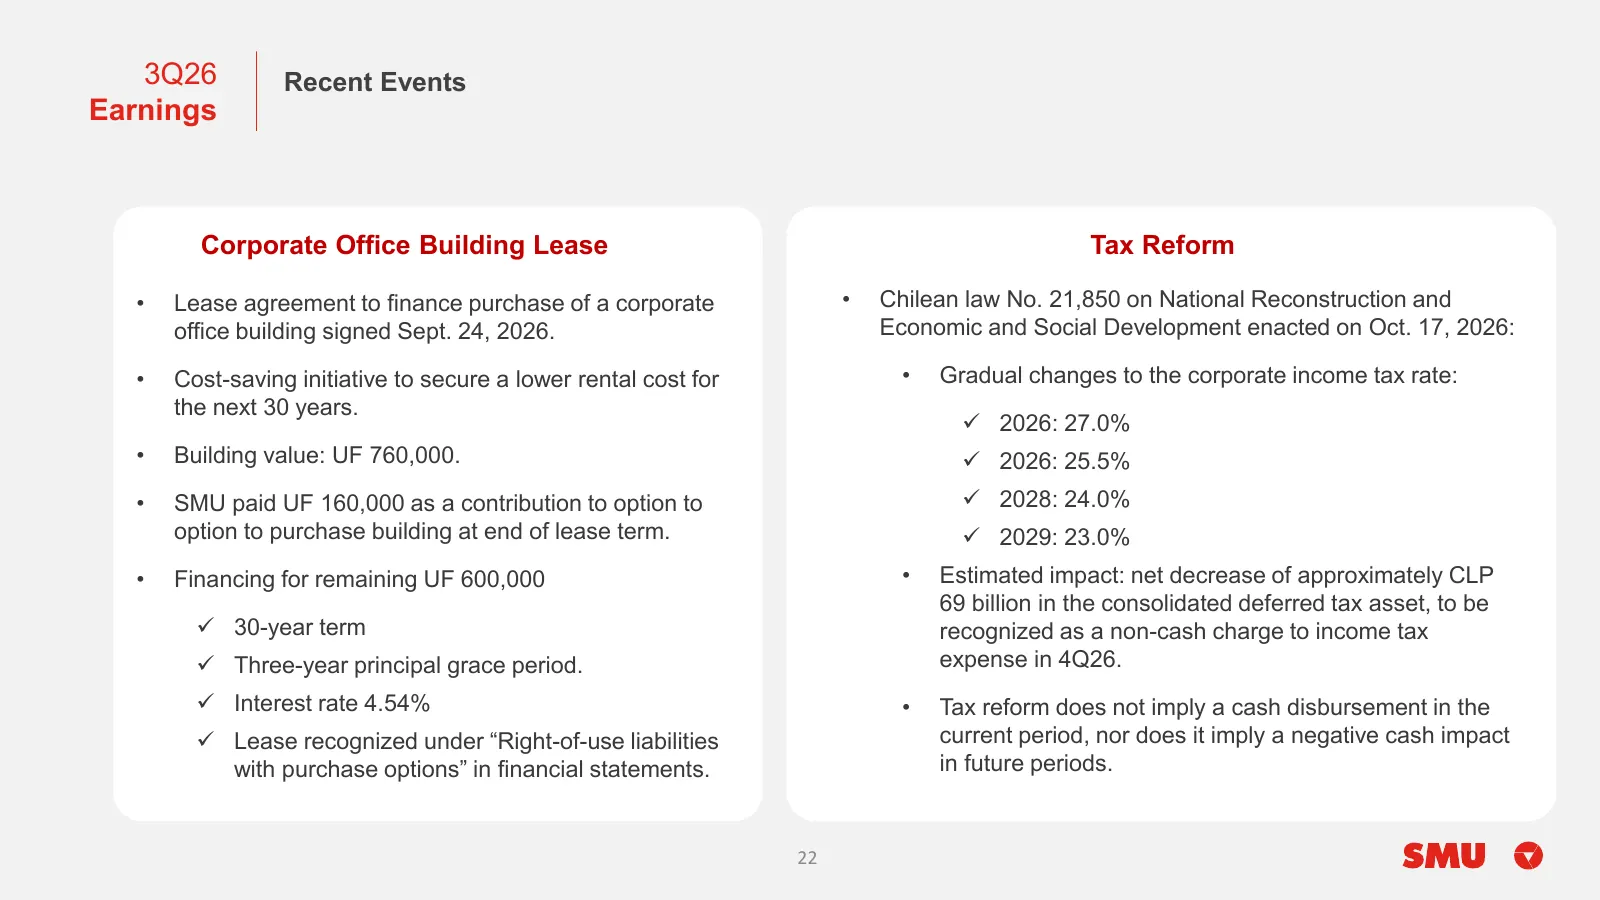
Slide 22: Recent Events
3Q26 Recent Events Earnings Corporate Office Building Lease Tax Reform • Lease agreement to finance purchase of a corporate • Chilean law No. 21,850 on National Reconstruction and office building signed Sept. 24, 2026. Economic and Social Development enacted on Oct. 17, 2026: • Cost-saving initiativ
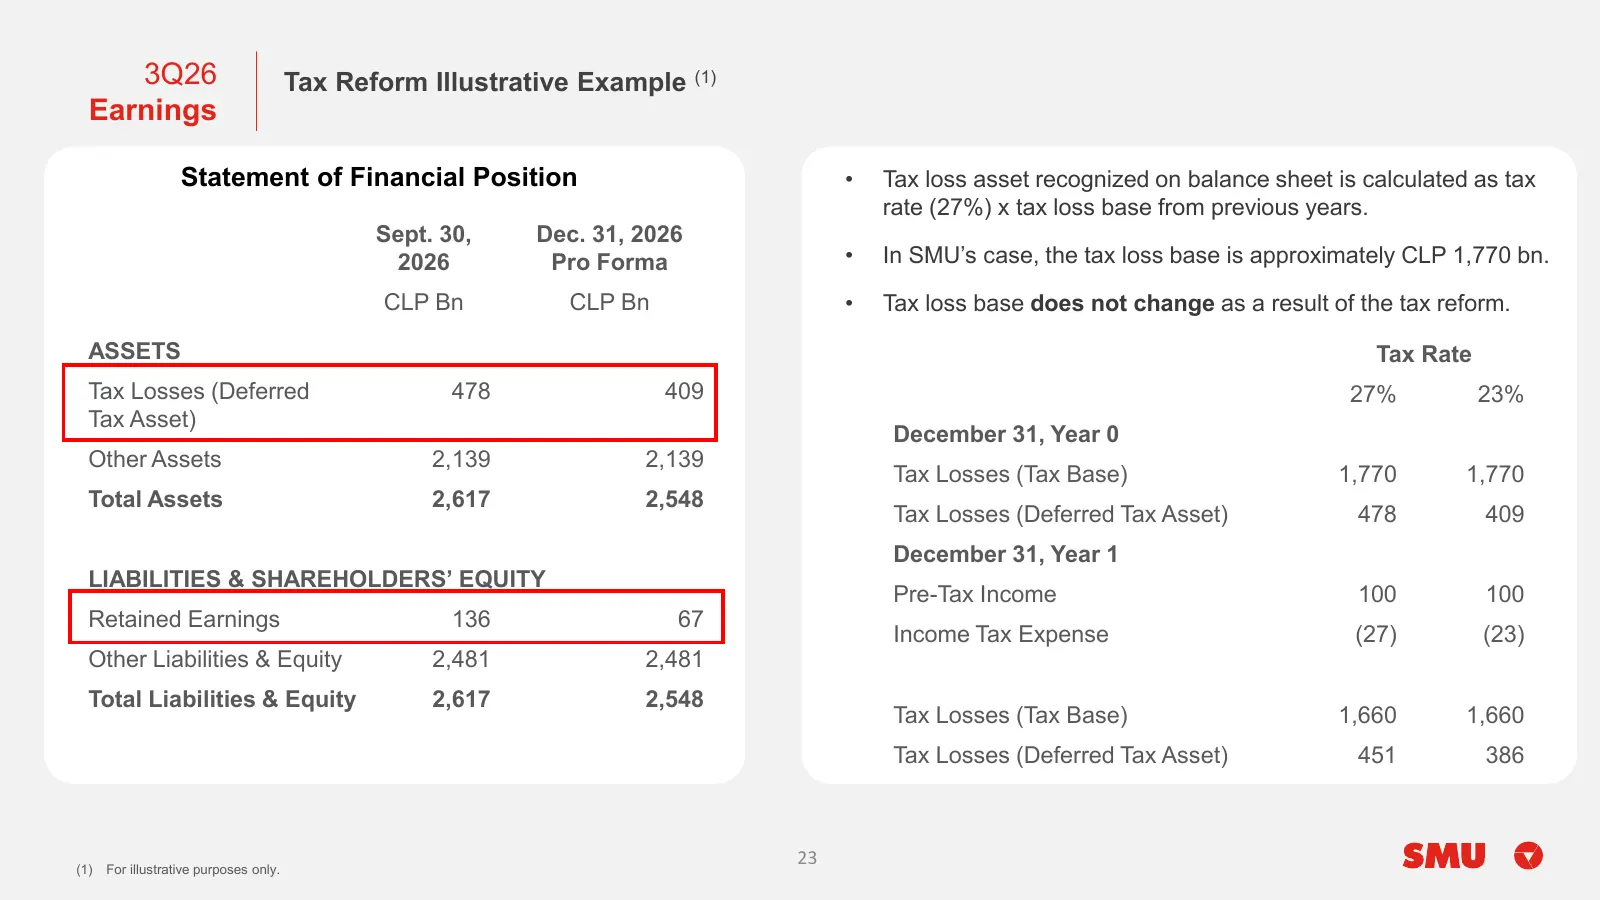
Slide 23: Tax Reform Illustrative Example
3Q26 Tax Reform Illustrative Example (1) Earnings Statement of Financial Position • Tax loss asset recognized on balance sheet is calculated as tax rate (27%) x tax loss base from previous years. Sept. 30, Dec. 31, 2026 2026 Pro Forma • In SMU’s case, the tax loss base is approximately CLP 1,770 bn.
Slide 24: Earnings Conference Call 3Q26
Earnings Conference Call 3Q26 November 11, 2026 9:00 am ET / 11:00 am Chile
Source: company website
More decks from Smu SA
 Q3 2026 Earnings Presentation24 slides · November 2026
 Investor Presentation (September 2026)20 slides · September 2026
 Q2 2026 Earnings Presentation23 slides · August 2026
 Debt Investor Presentation (May 2026)27 slides · May 2026
 Q1 2026 Earnings Presentation26 slides · May 2026
 Q4 2025 Earnings Presentation28 slides · March 2026