Superior Drilling Products Inc
Superior Drilling Products — Q2 2018 Earnings Presentation
19 slides from Superior Drilling Products's earnings presentation, Aug 2, 2018
Slide 1: Second Quarter 2018 Financial Results Conference Call
Wy SUPERIOR DRILLING PRODUCTS SECOND QUARTER 2018 FINANCIAL RESULTS CONFERENCE CALL AuGusT 2, 2018 NYSE American: SDPI www.sdpi.com
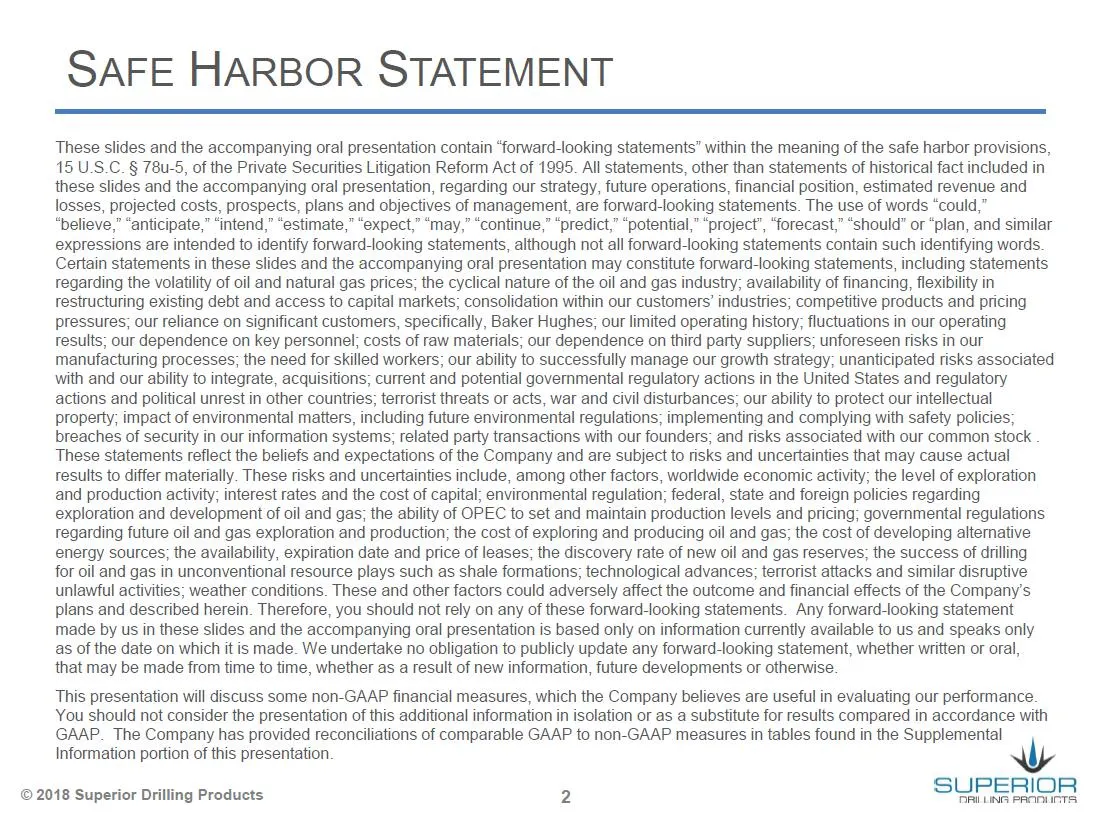
Slide 2: Safe Harbor Statement
SAFE HARBOR STATEMENT These slides and the accompanying oral presentation contain “forward-looking statements’ within the meaning of the safe harbor provisions, 15 U.S.C. § 78u-5, of the Private Securities Litigation Reform Act of 1995. Alll statements, other than statements of historical fact inclu
Slide 3: Troy Meier, Chairman and Chief Executive Officer
Wy SUPERIOR DRILLING PRODUCTS TROY MEIER CHAIRMAN AND CHIEF EXECUTIVE OFFICER © 2018 Superior Drilling Products
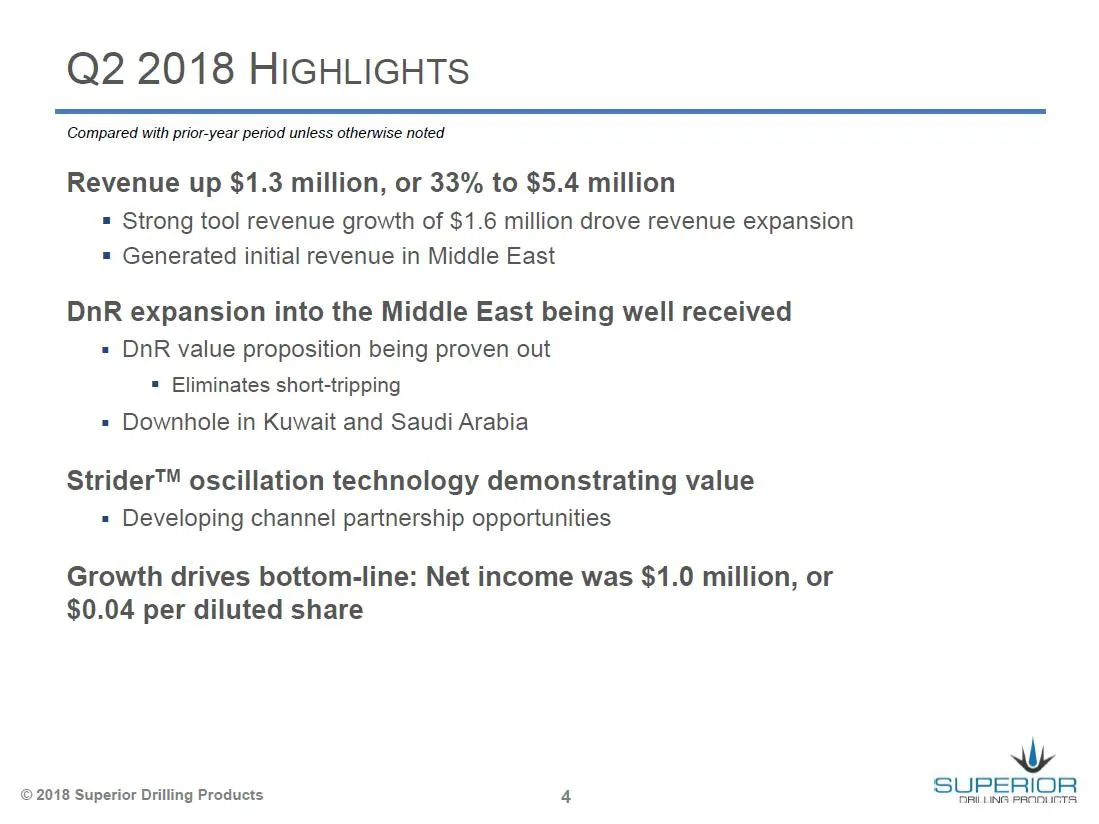
Slide 4: Q2 2018 Highlights
Q2 2018 HIGHLIGHTS Compared with prior-year period unless otherwise noted Revenue up $1.3 million, or 33% to $5.4 million = Strong tool revenue growth of $1.6 million drove revenue expansion = Generated initial revenue in Middle East DnR expansion into the Middle East being well received = DnR value
Slide 5: Christopher Cashion, Chief Financial Officer
Wy SUPERIOR DRILLING PRODUCTS CHRISTOPHER CASHION CHIEF FINANCIAL OFFICER
Slide 6: Significant Revenue Growth
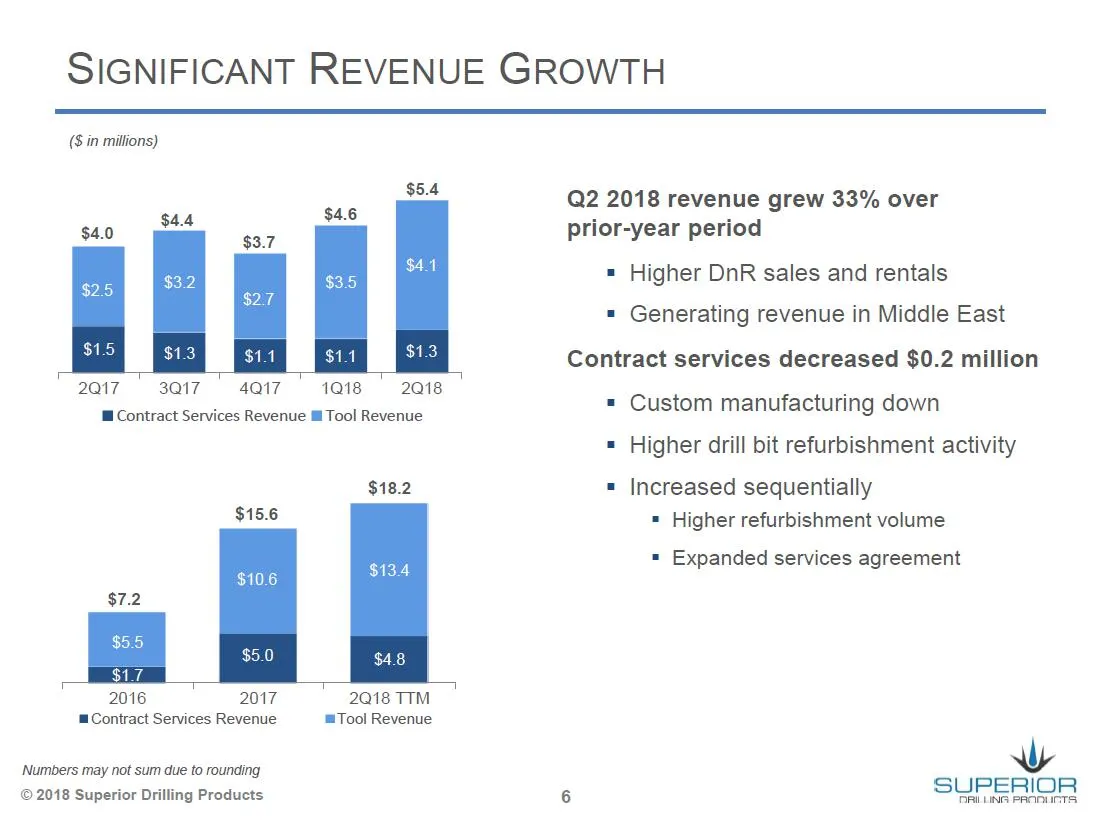
SIGNIFICANT REVENUE GROWTH (8 in millions) sot Q2 2018 revenue grew 33% over prior-year period = Higher DnR sales and rentals = Generating revenue in Middle East Contract services decreased $0.2 million 2Q17 3Q17 4Q17 1018 2018 ™ Contract Services Revenue ll Tool Revenue = Custom manufacturing down
Slide 7: Strong Tool Revenue
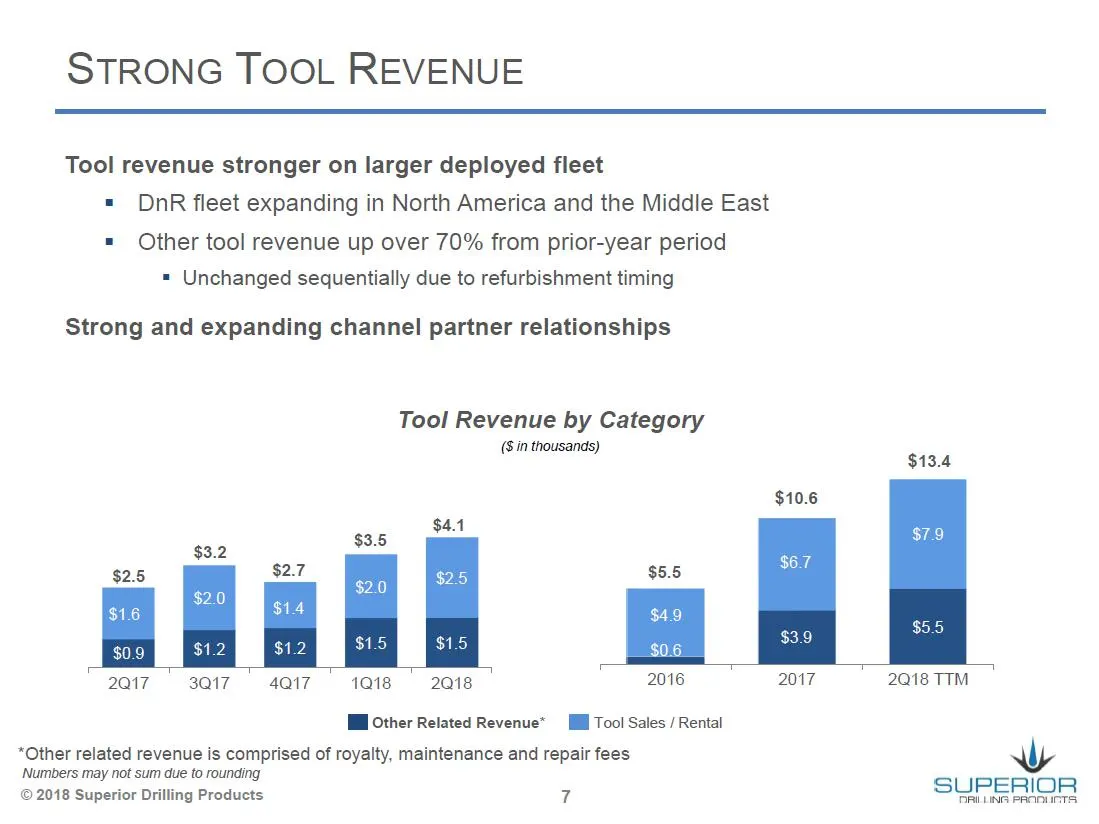
STRONG TOOL REVENUE Tool revenue stronger on larger deployed fleet = Dn fleet expanding in North America and the Middle East = Other tool revenue up over 70% from prior-year period = Unchanged sequentially due to refurbishment timing Strong and expanding channel partner relationships Tool Revenue by
Slide 8: Managing Costs
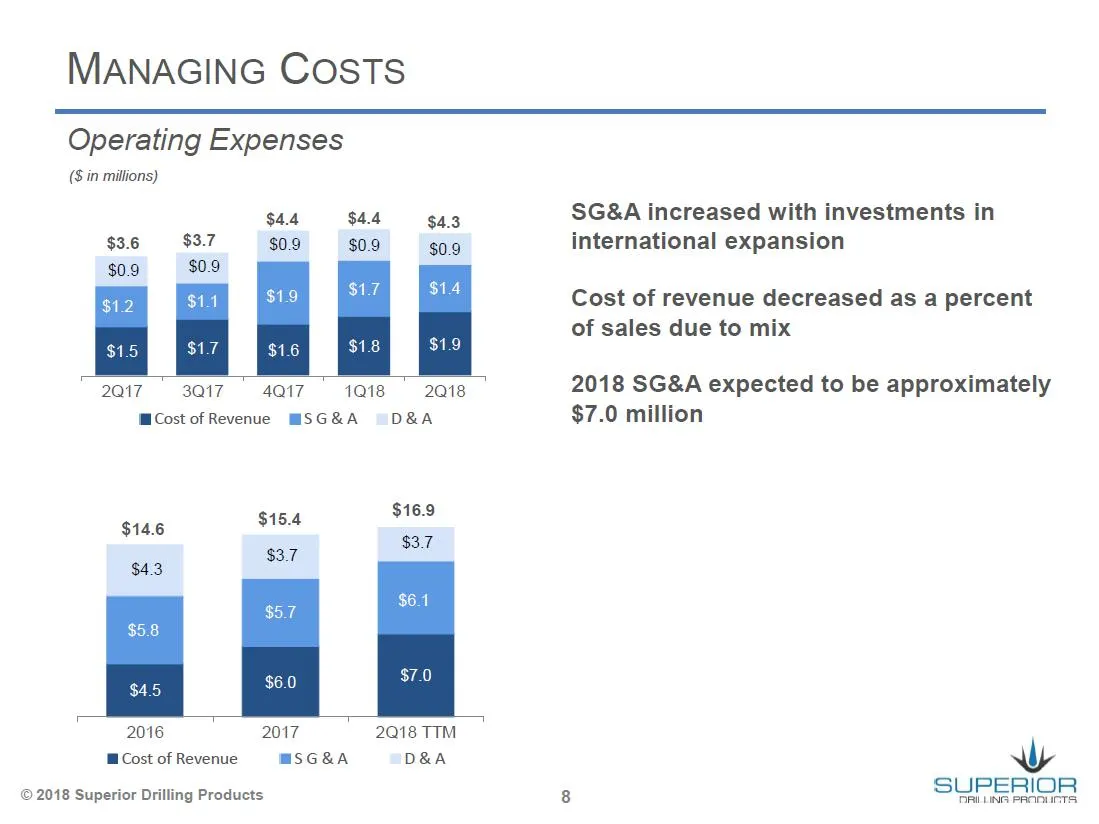
MANAGING COsTSs Operating Expenses (8 in millions) $4.4 $4.4 $4.3 SG&A increased with investments in $36 © $3.7 $0.9 $0.9 $0.9 international expansion $0.9 $1.9 Cost of revenue decreased as a percent of sales due to mix $1.6 2017 | 3Q17 1018 2018 SG&A expected to be approximately MCost of Revenue MS
Slide 9: Positive Operating Income
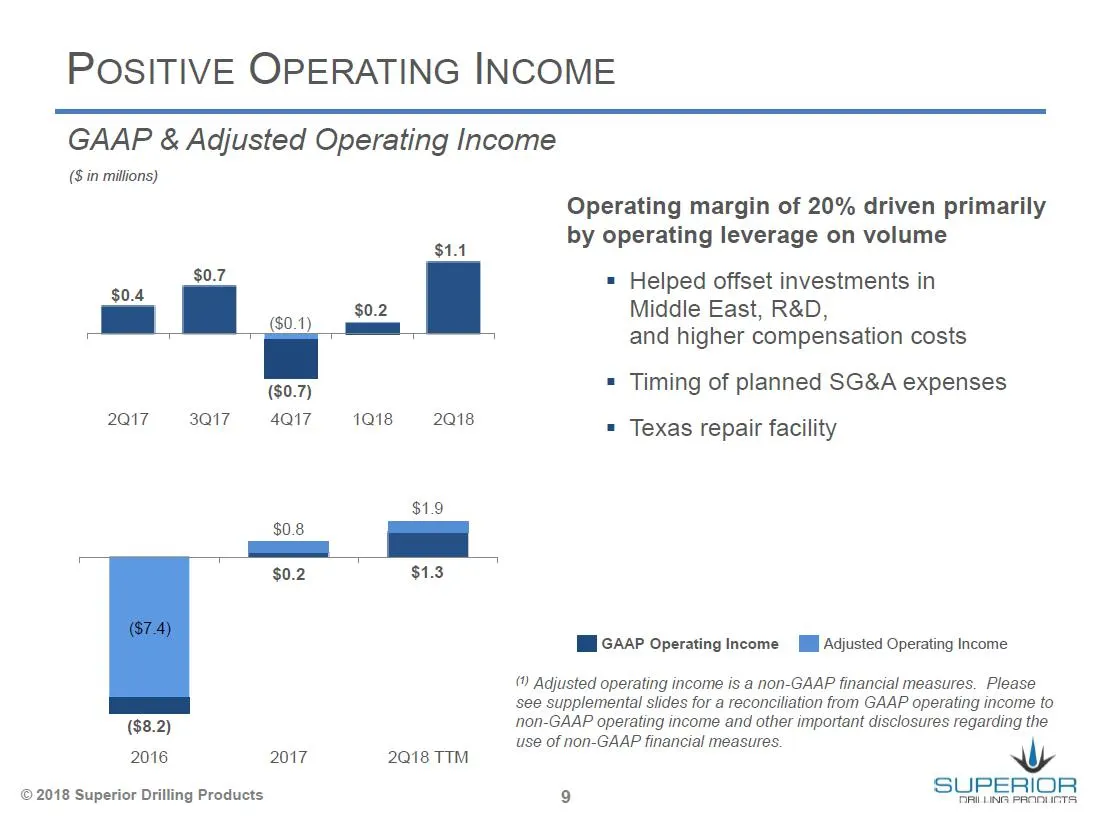
POSITIVE OPERATING INCOME GAAP & Adjusted Operating Income (8 in millions) $1.1 ($0.7) 2017, 33Q17,- ss 4Q17,— ss 1Q18—_ 2018 $1.9 — i | $0.2 $1.3 ($8.2) 2016 2017 2018 TTM © 2018 Superior Drilling Products Operating margin of 20% driven primarily by operating leverage on volume = Helped offset inve
Slide 10: Strong Business Model Driven by Technology
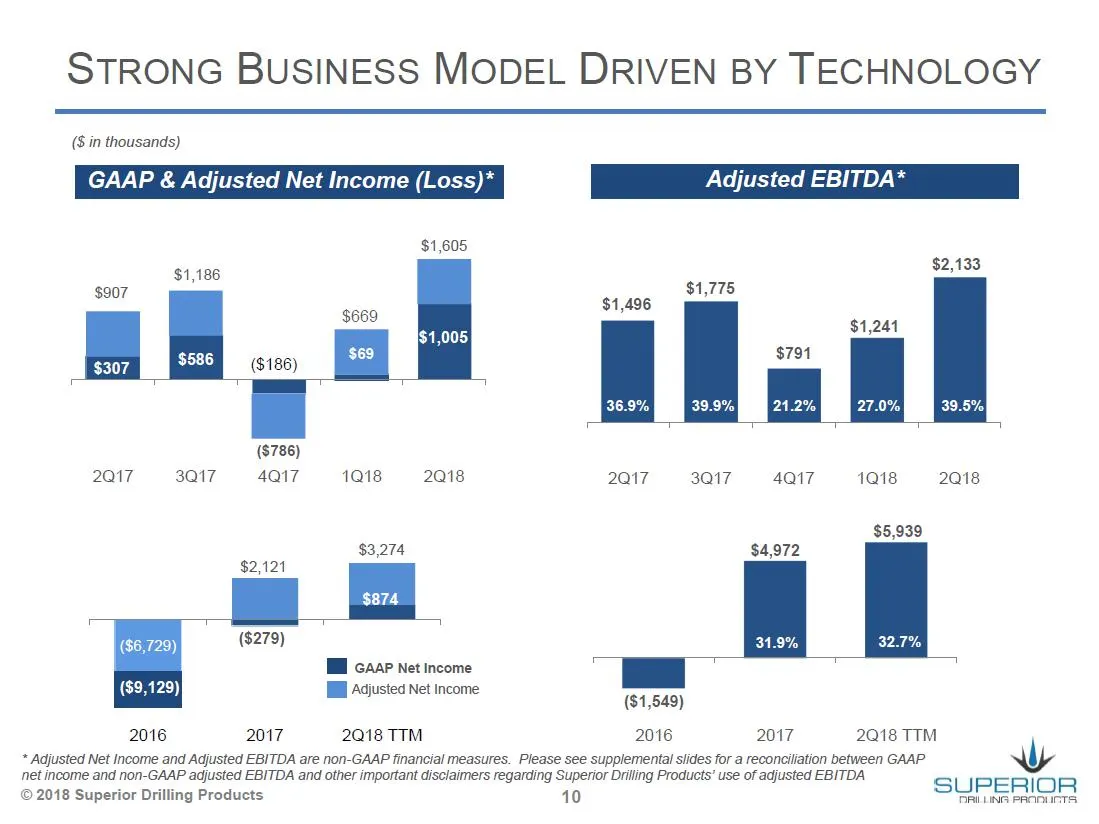
STRONG BUSINESS MODEL DRIVEN BY TECHNOLOGY (Sin thousands) GAAP & Adjusted Net Income (Loss)* Adjusted EBITDA* $1,605 $2,133 ($186) ($786) 2017 3017) 4Q17-—s 1018 ~— 2018 2017, 3017, 4Q17_—s«1018— 2018 $5,939 $3,274 $4,972 $2,121 ($6,729) ($279) 31.9% 32.7% Tl cas Net Income ($9,129)] Hl Agjustea Ne
Slide 11: Stronger Balance Sheet
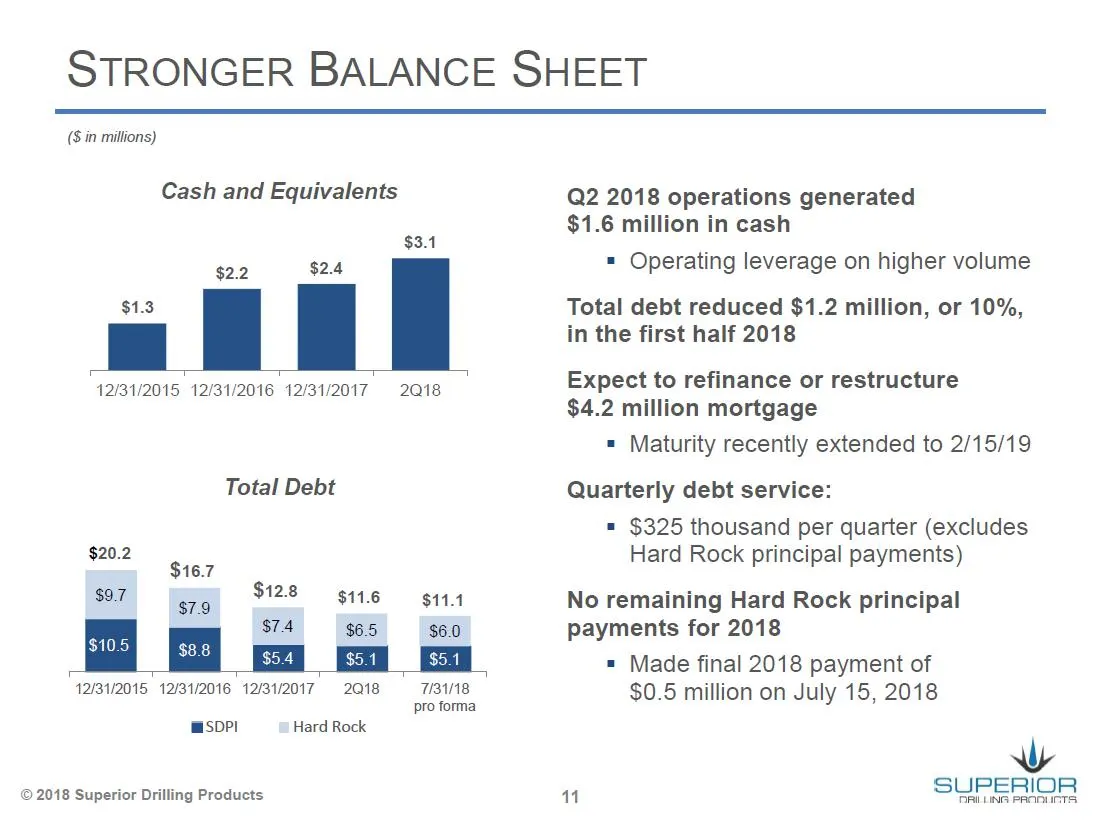
STRONGER BALANCE SHEET (Sin millions) Cash and Equivalents $2.4 $3.1 12/31/2015 12/31/2016 12/31/2017 Total Debt 12/31/2015 12/31/2016 12/31/2017 2018 mSDPI © 2018 Superior Drilling Products Hard Rock 2Q18 $11.1 7/3118 pro forma Q2 2018 operations generated $1.6 million in cash = Operating leverage
Slide 12: 2018 Guidance
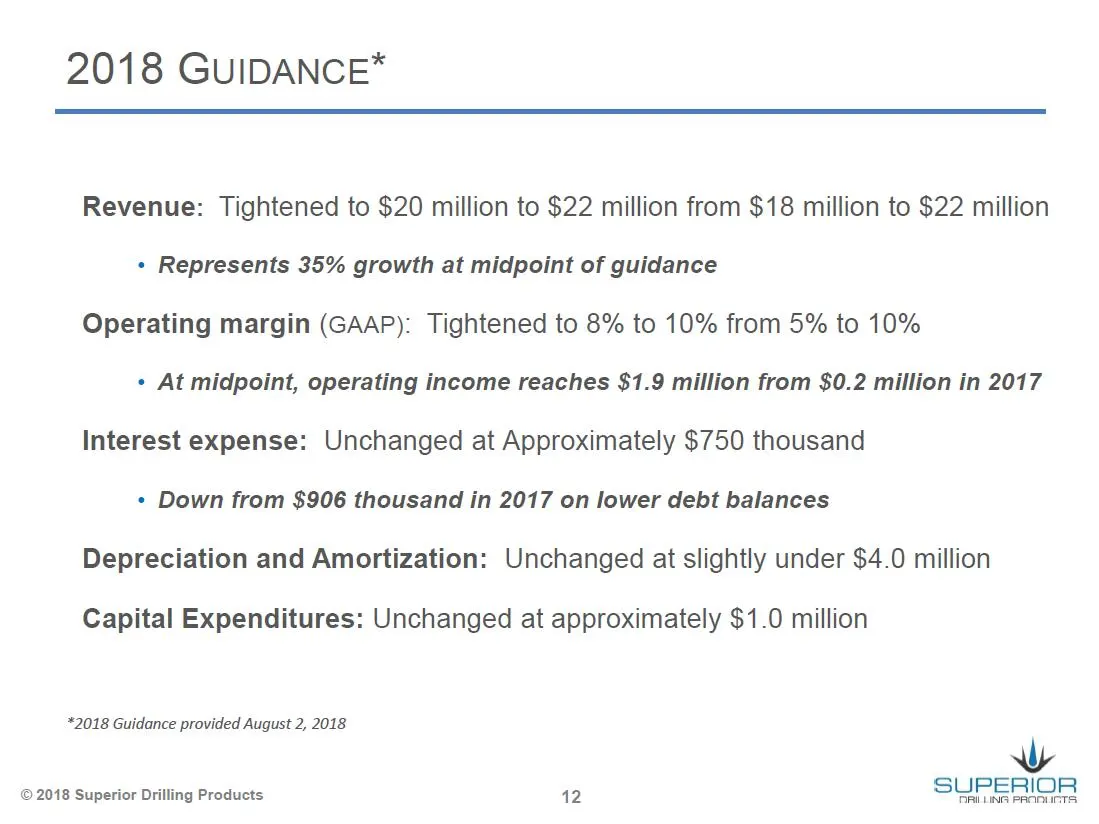
2018 GUIDANCE* Revenue: Tightened to $20 million to $22 million from $18 million to $22 million + Represents 35% growth at midpoint of guidance Operating margin (GAAP): Tightened to 8% to 10% from 5% to 10% + At midpoint, operating income reaches $1.9 million from $0.2 million in 2017 Interest expen
Slide 13: Supplemental Information
Wy SUPERIOR DRILLING PRODUCTS SUPPLEMENTAL INFORMATION
Slide 14: Adjusted Income from Operations Reconciliation
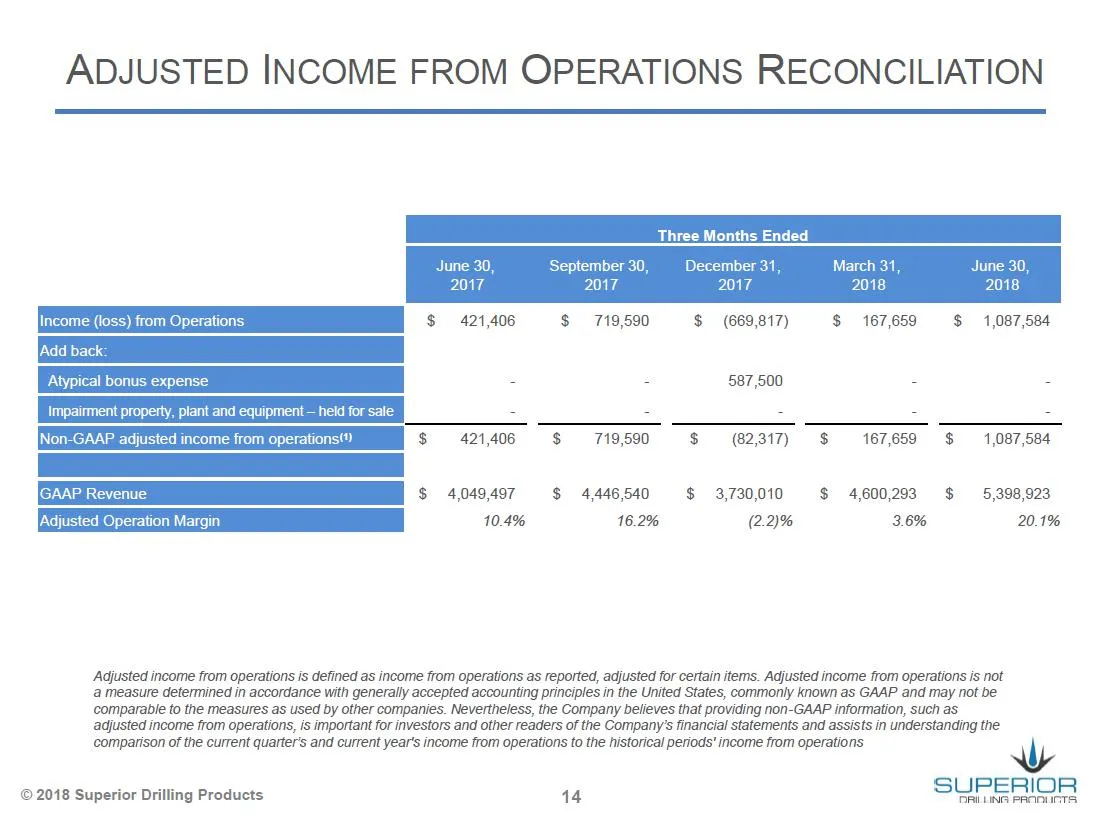
ADJUSTED INCOME FROM OPERATIONS RECONCILIATION December 3 March 31 1017 ) from Operations $ 421,406 $ 719590 $ (669817) $ 167,659 $ 1,087,584 |Add back Atypical bonus expense a s 587,500 7 = Impairment property, plant and equipment — held for sale Non-GAAP adjusted income from operations”) $ 421406
Slide 15: Adjusted Income from Operations Reconciliation
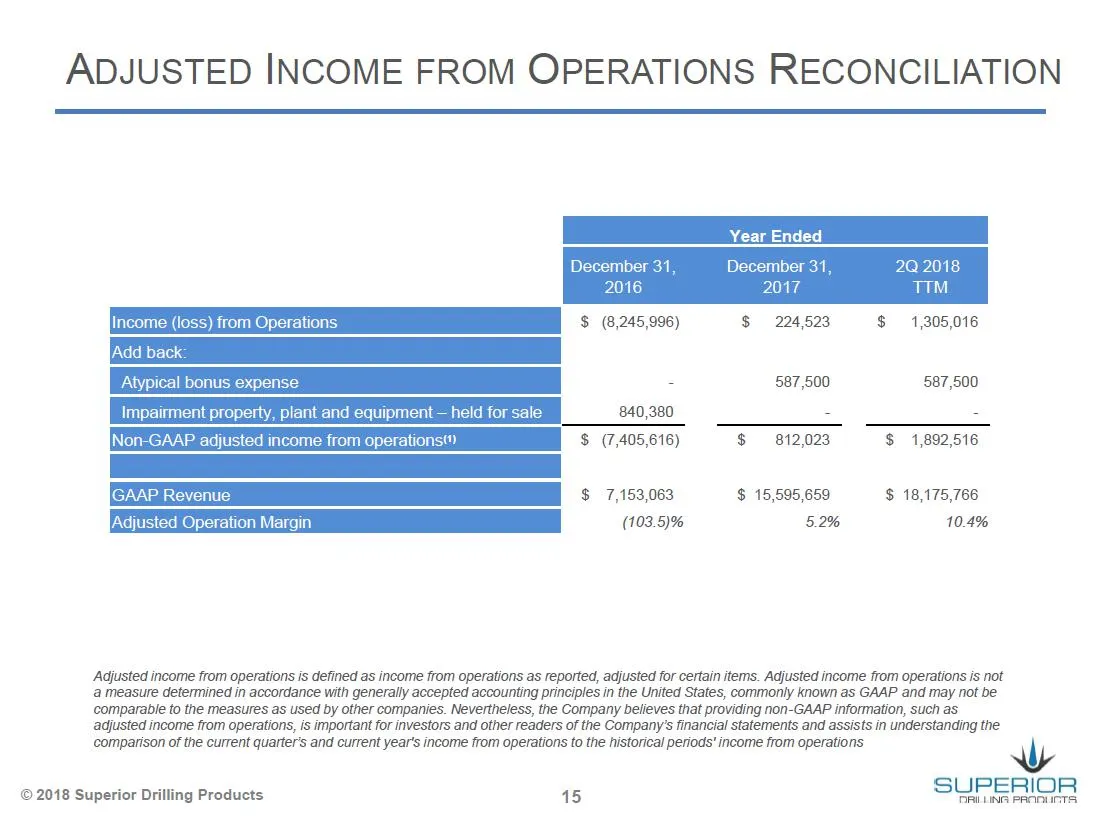
ADJUSTED INCOME FROM OPERATIONS RECONCILIATION 2Q 2018 TIM $ (8,245,996) $ 224,523 $ = 1,305,016 - 887 600 887,500 240,380 : : Non-GAAP adjusted income from operations $ (7,405,616) $ 812,023 $ 1,892,516 IGAAP Revenue $ 7,153,063 $ 15,595,659 $ 18,175,766 Adjusted Operation Margin (103.5)% 5.2% 10.4
Slide 16: Adjusted Net Income Reconciliation
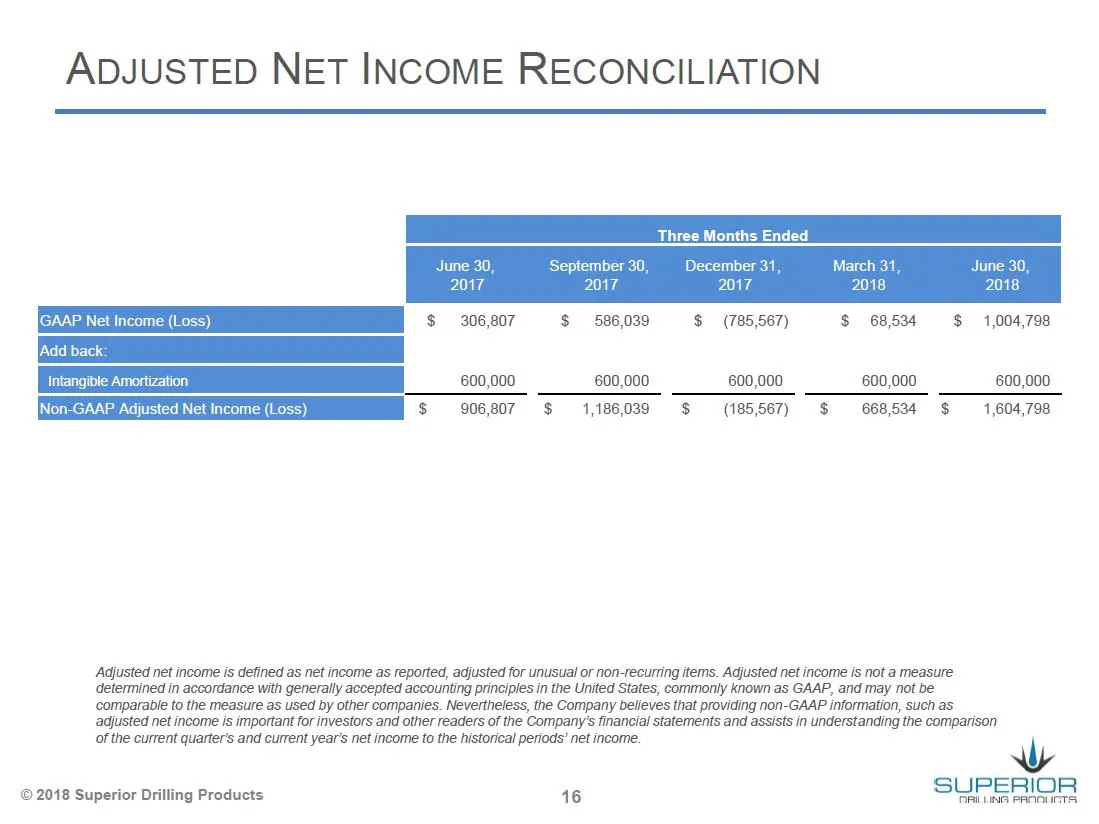
ADJUSTED NET INCOME RECONCILIATION December 3: March 31 1017 $ 306,807 $ 586,039 $ (785,567) $ 68534 $ 1,004,798 600,000 600,000 600,000 600,000 600,000 ;AAP Adi Income (Loss $ 906,807 $ 1,186,039 $ (185,567) $ 668,534 $ 1,604,798 ‘Adjusted net income is defined as net income as reported, adjusted f
Slide 17: Adjusted Net Income Reconciliation
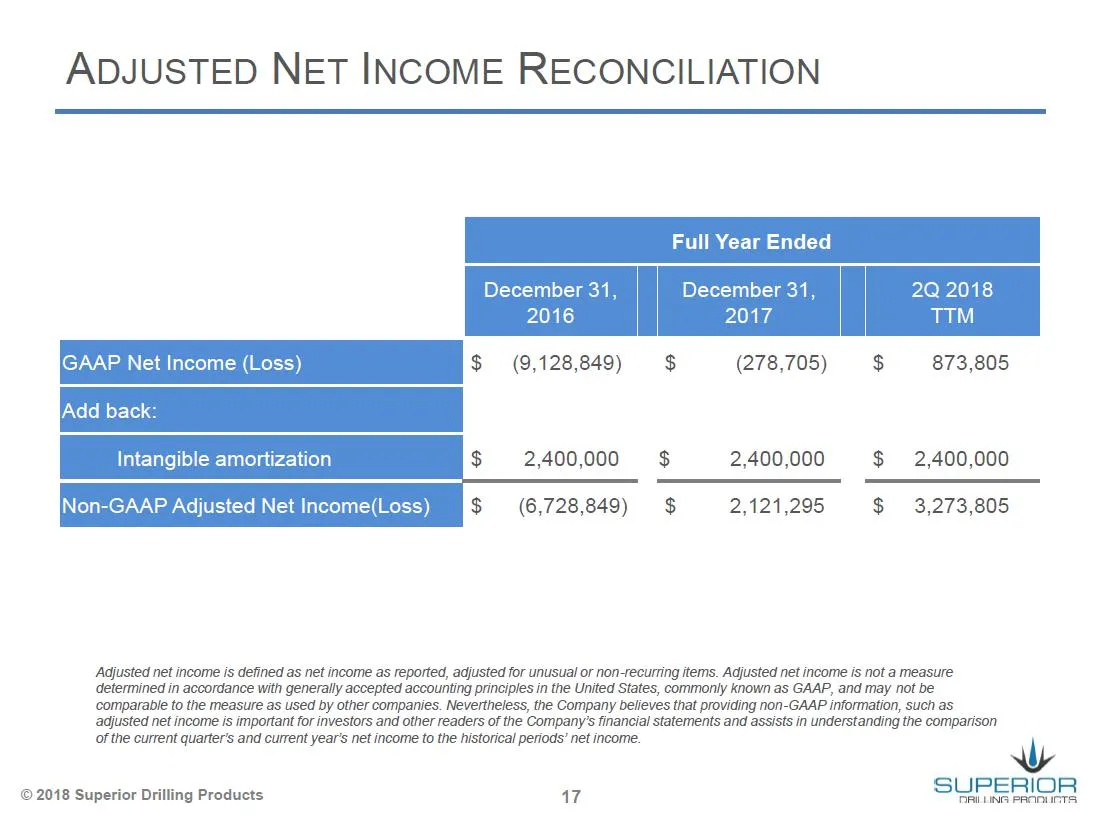
ADJUSTED NET INCOME RECONCILIATION Full Year Ended December December 31, 2Q 20 2016 2017 TIM GAAP Net Income (Loss) $ (9,128,849) $ (278,705) $ 873,805 Add back Intangible amortization $ 2,400,000 $ 2,400,000 $ 2,400,000 Non-GAAP Adjusted Net Income(Loss) $ (6,728,849) $ 2,121,295 $ 3,273,805 Adjust
Slide 18: Adjusted EBITDA Reconciliation
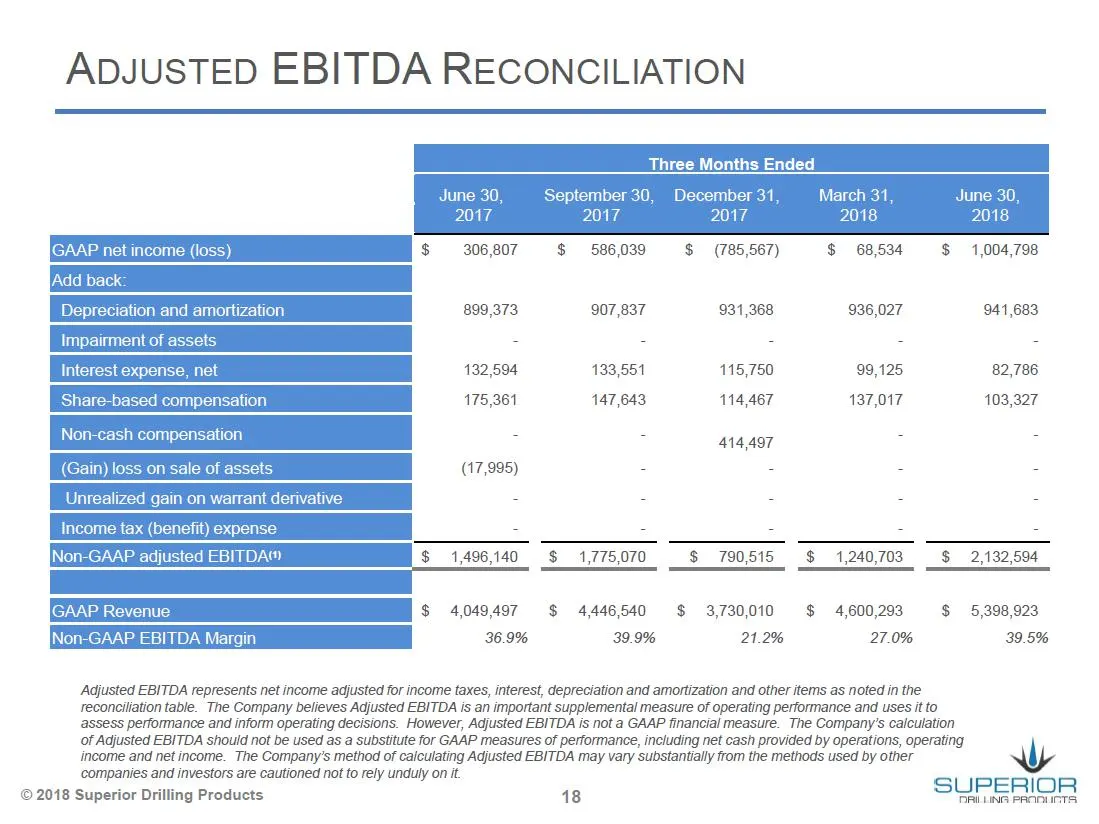
ADJUSTED EBITDA RECONCILIATION Three Months Ended 936,027 132,594 133,551 115,750 99,125 82,786 175,361 147,643 114,467 137,017 103,327 - 7 414,497 - - (Gain) loss on sale of assets (17,995) 2 s « = Unrealized gain on warrant derivative 2 2 s . . Income tax (benefit) expense - - - - - Non-GAAP adjus
Slide 19: Adjusted EBITDA Reconciliation
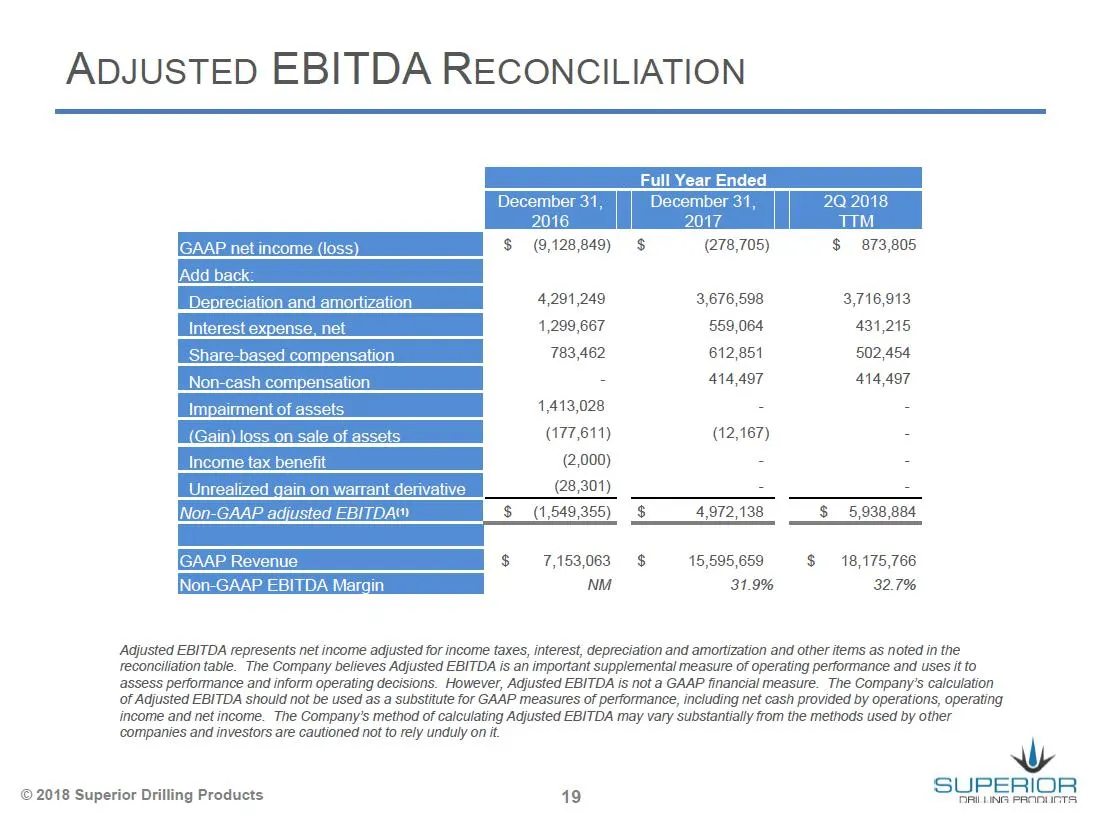
ADJUSTED EBITDA RECONCILIATION $ (9,128,849) $ (278,705) $ 873,805 4,291,249 3,676,598 3,716,913 4,299,667 559,064 431,215 783,462 612,851 502,454 : 414,497 414,497 4_Impairment of assets 1,413,028 = 2 (177,611) (12,167) 7 (2,000) = 4 (28,301) = - (1,549,355) $ 4,972,138 $ 5,938,884 7,153,063 $ 15,5
Source: SEC EDGAR · 8-K filed Aug 2, 2018
More decks from Superior Drilling Products Inc
 Q3 2023 Earnings Presentation12 slides · Nov 9, 2023
 Q2 2023 Earnings Presentation12 slides · Aug 14, 2023
 Q1 2023 Earnings Presentation12 slides · May 15, 2023
 FY2022 Earnings Presentation13 slides · Mar 10, 2023
 Q3 2022 Earnings Presentation12 slides · Nov 14, 2022
 MicroCap Rodeo Windy City Roundup 202220 slides · Oct 12, 2022