M3, Inc. · TSE:2413
M3 — FY2021 Earnings Presentation
39 slides from M3's earnings presentation, Apr 27, 2022
Slide 1: M3, Inc. Presentation Material April 2022
M3, Inc. Presentation Material Ap r i l 2 0 2 2 Copyright © 2022 M3, Inc. All rights reserved.
Slide 2: Forward-looking statements disclaimer
The following presentation contains forecasts, future plans, management targets and other forward-looking projections relating to M3, Inc. and/or its group. These statements are drawn from assumptions of future events based on data currently available to us, and there exist possibilities that such a
Slide 3: Annual Results
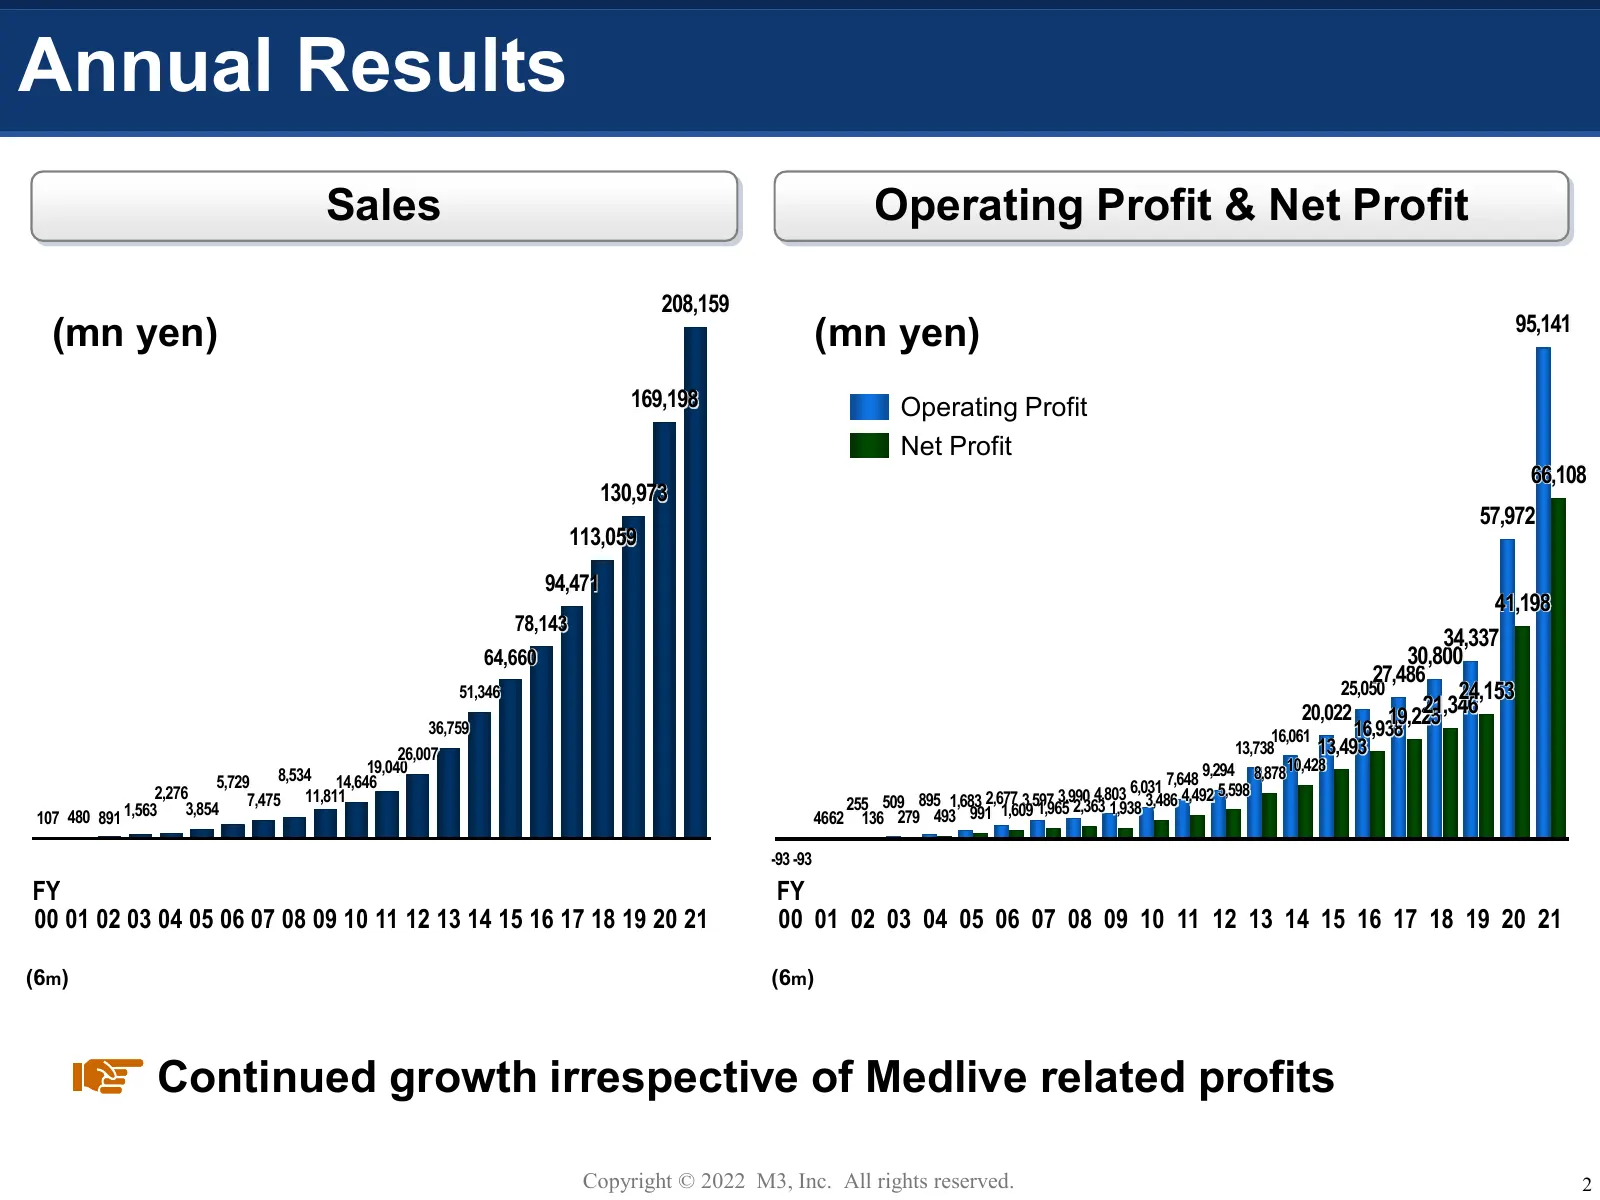
Annual Results Sales Operating Profit & Net Profit 208,159 (mn yen) (mn yen) 95,141 169,198 Operating Profit Net Profit 66,108 130,973 57,972 113,059 94,471 41,198 78,143 34,337 64,660 30,800 27,486 51,346 25,050 24,153 20,022 21,346 19,225 36,759 16,061 16,938 26,007 13,738 13,493 19,040 10,428 5,7
Slide 4: FY2021 Consolidated Results
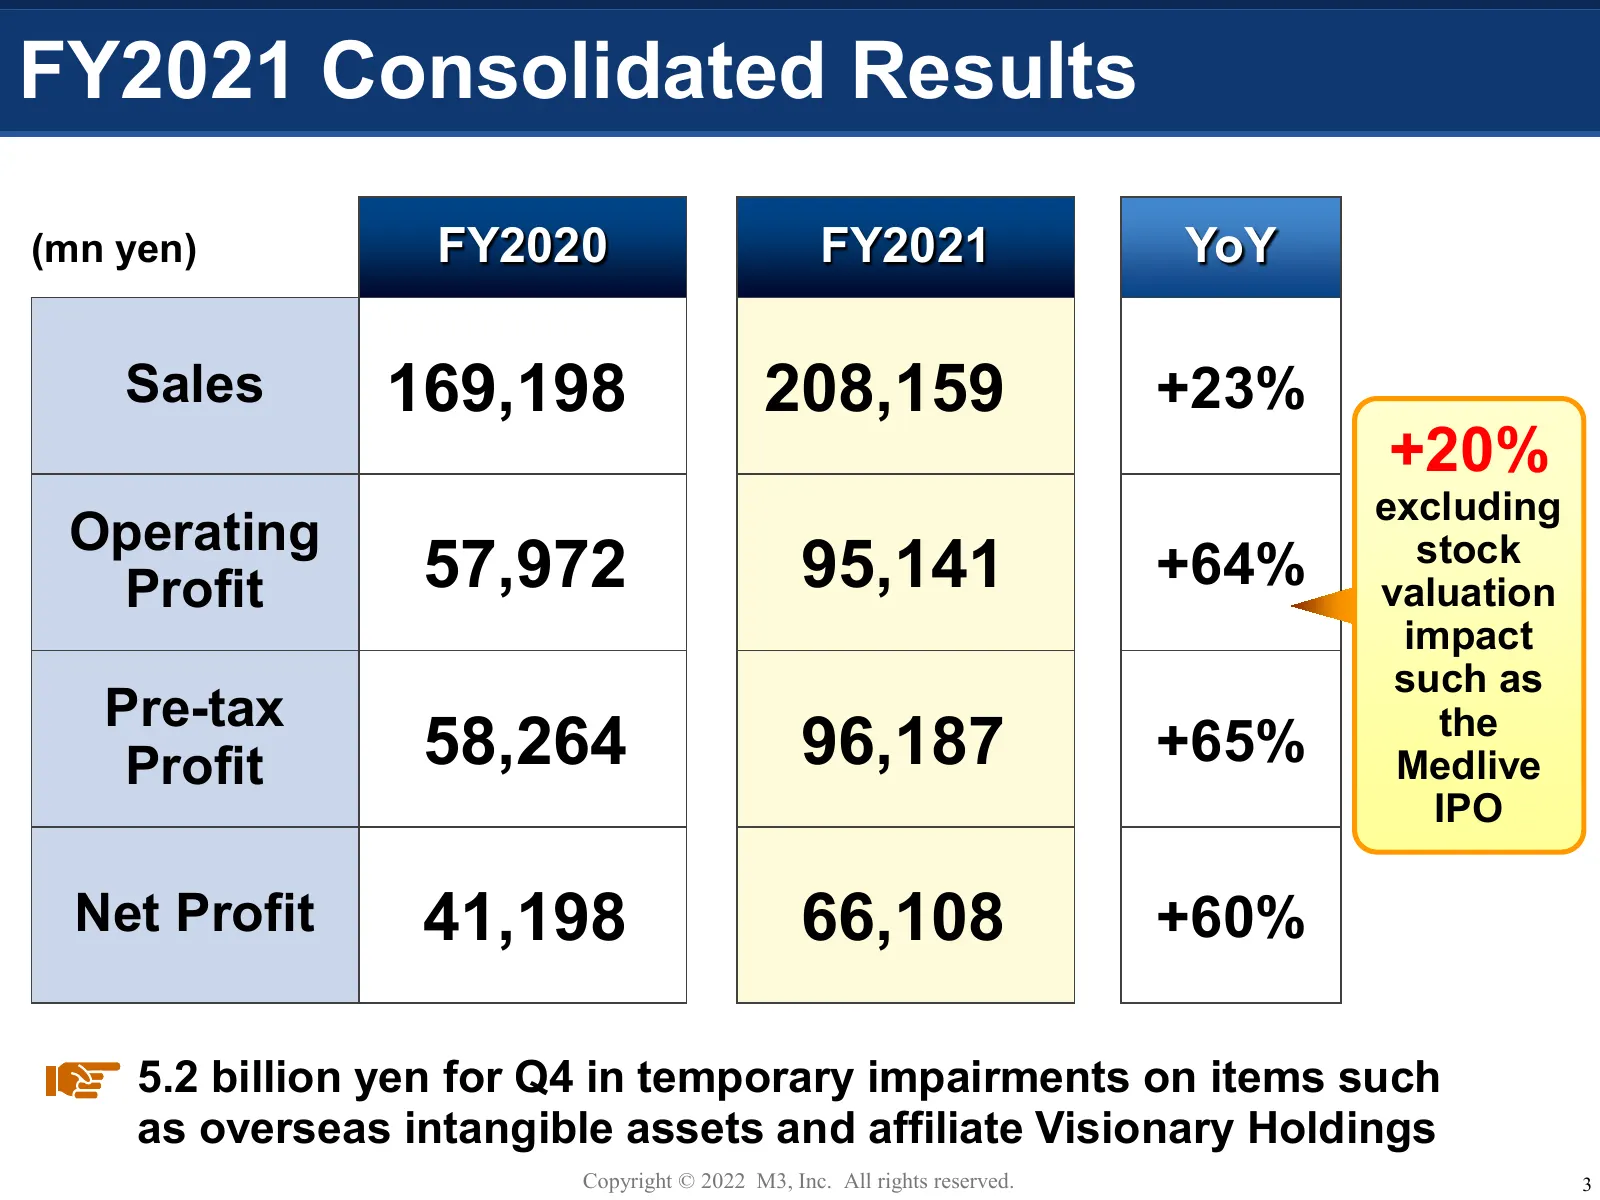
FY2021 Consolidated Results (mn yen) FY2020 FY2021 YoY Sales 169,198 208,159 +23% +20% excluding Operating Profit 57,972 95,141 +64% stock valuation impact such as Pre-tax Profit 58,264 96,187 +65% the Medlive IPO Net Profit 41,198 66,108 +60% 5.2 billion yen for Q4 in temporary impairments on items
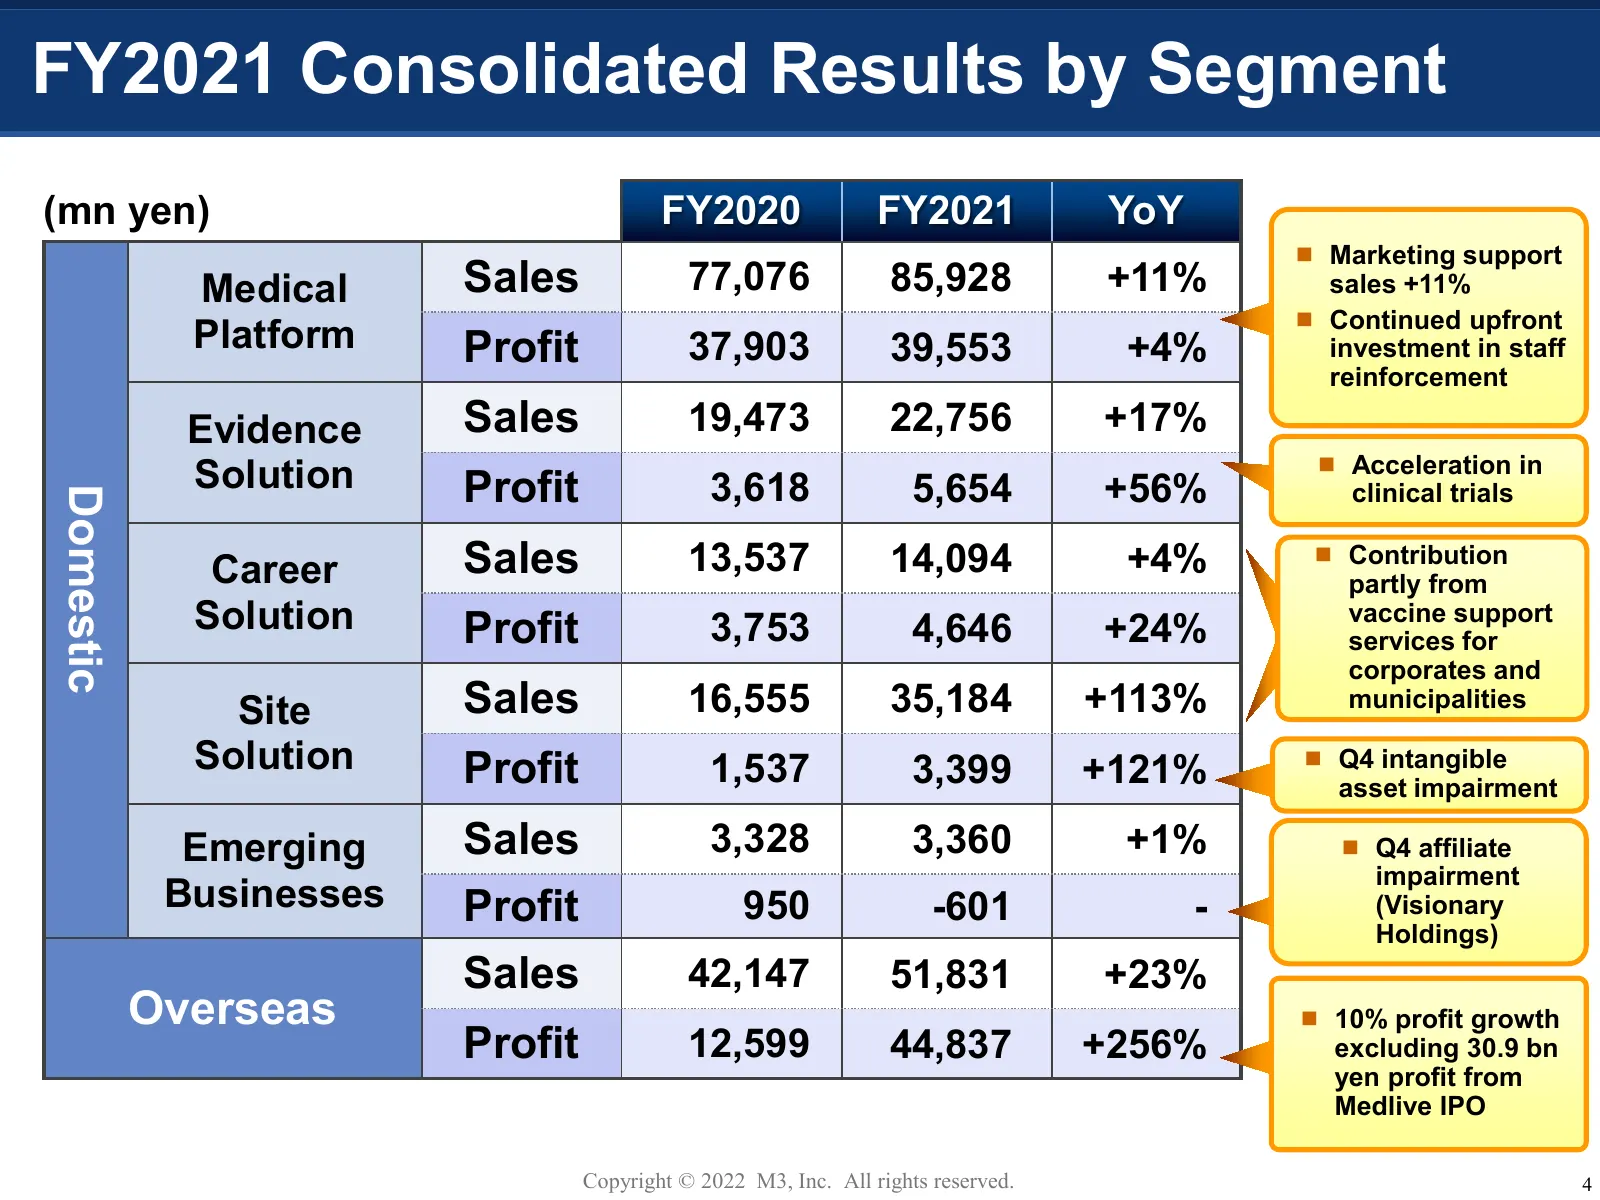
Slide 5: FY2021 Consolidated Results by Segment
FY2021 Consolidated Results by Segment (mn yen) FY2020 FY2021 YoY Marketing support Medical Sales 77,076 85,928 +11% sales +11% Continued upfront Platform Profit 37,903 39,553 +4% investment in staff reinforcement Evidence Sales 19,473 22,756 +17% Acceleration in Solution Profit 3,618 5,654 +5
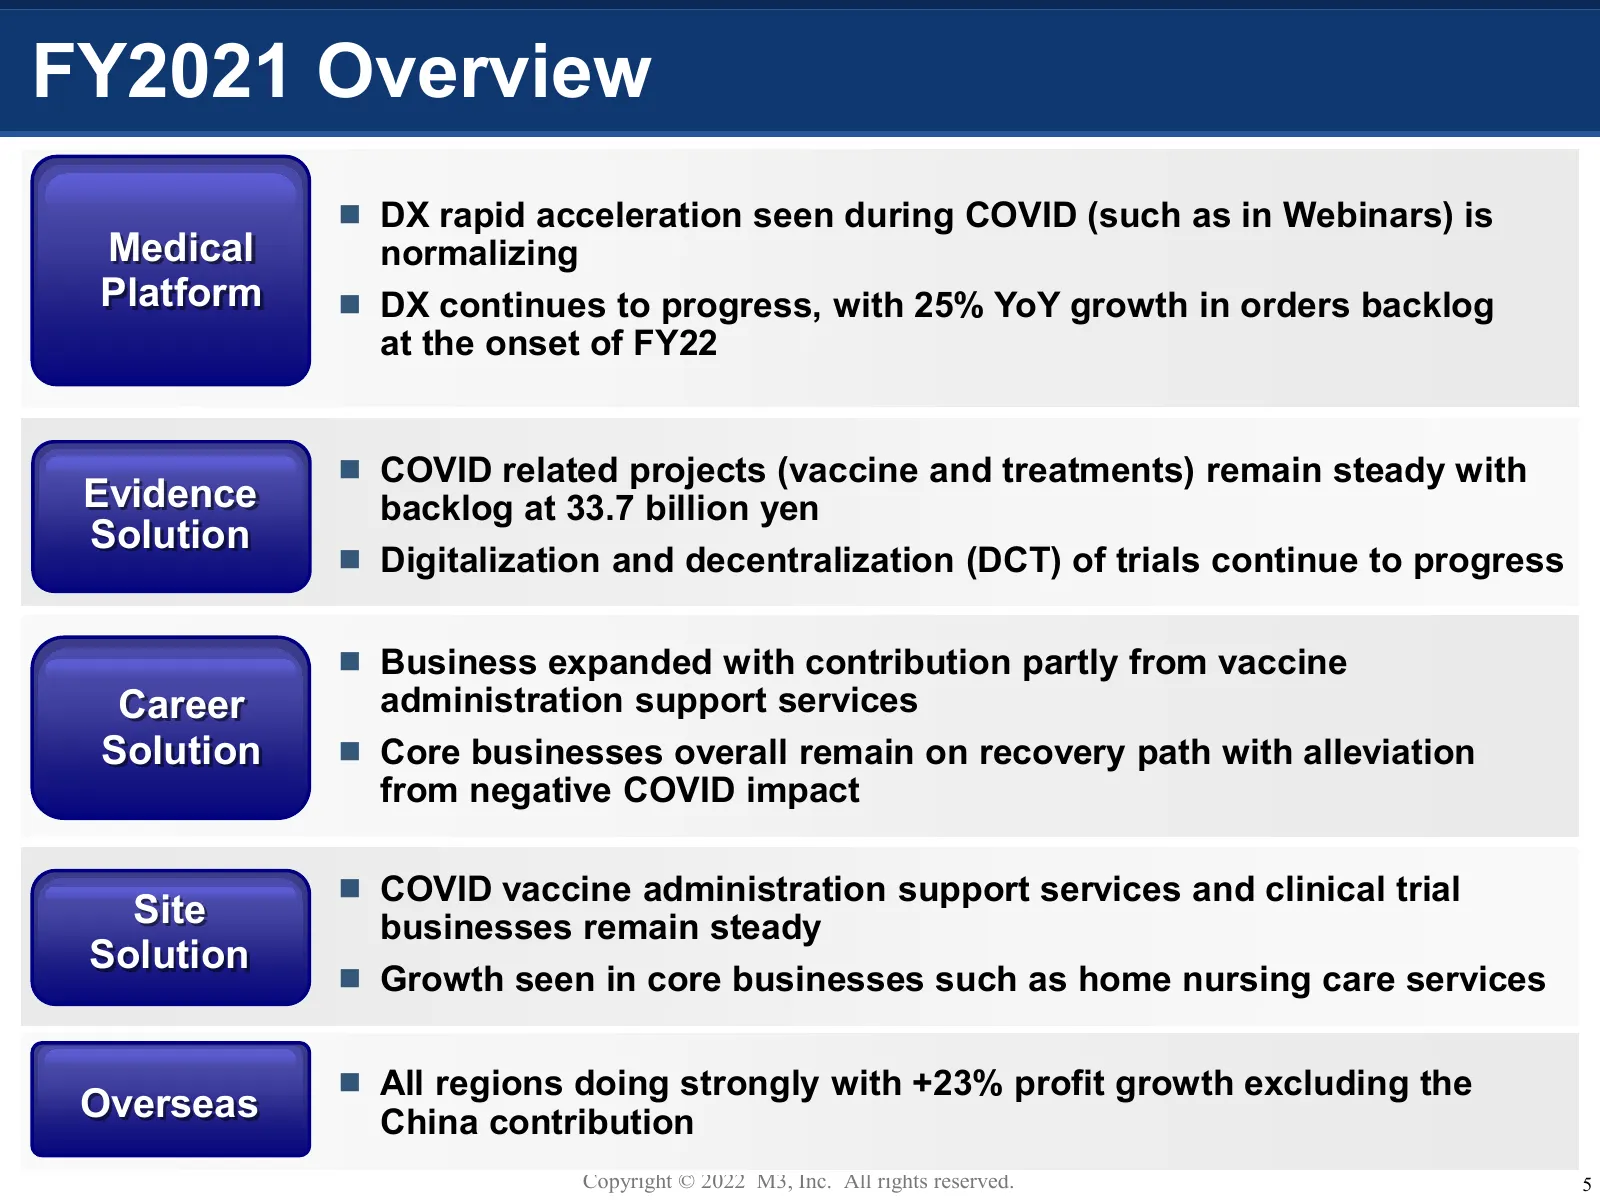
Slide 6: FY2021 Overview
FY2021 Overview DX rapid acceleration seen during COVID (such as in Webinars) is Medical normalizing Platform DX continues to progress, with 25% YoY growth in orders backlog at the onset of FY22 COVID related projects (vaccine and treatments) remain steady with Evidence backlog at 33.7 billion
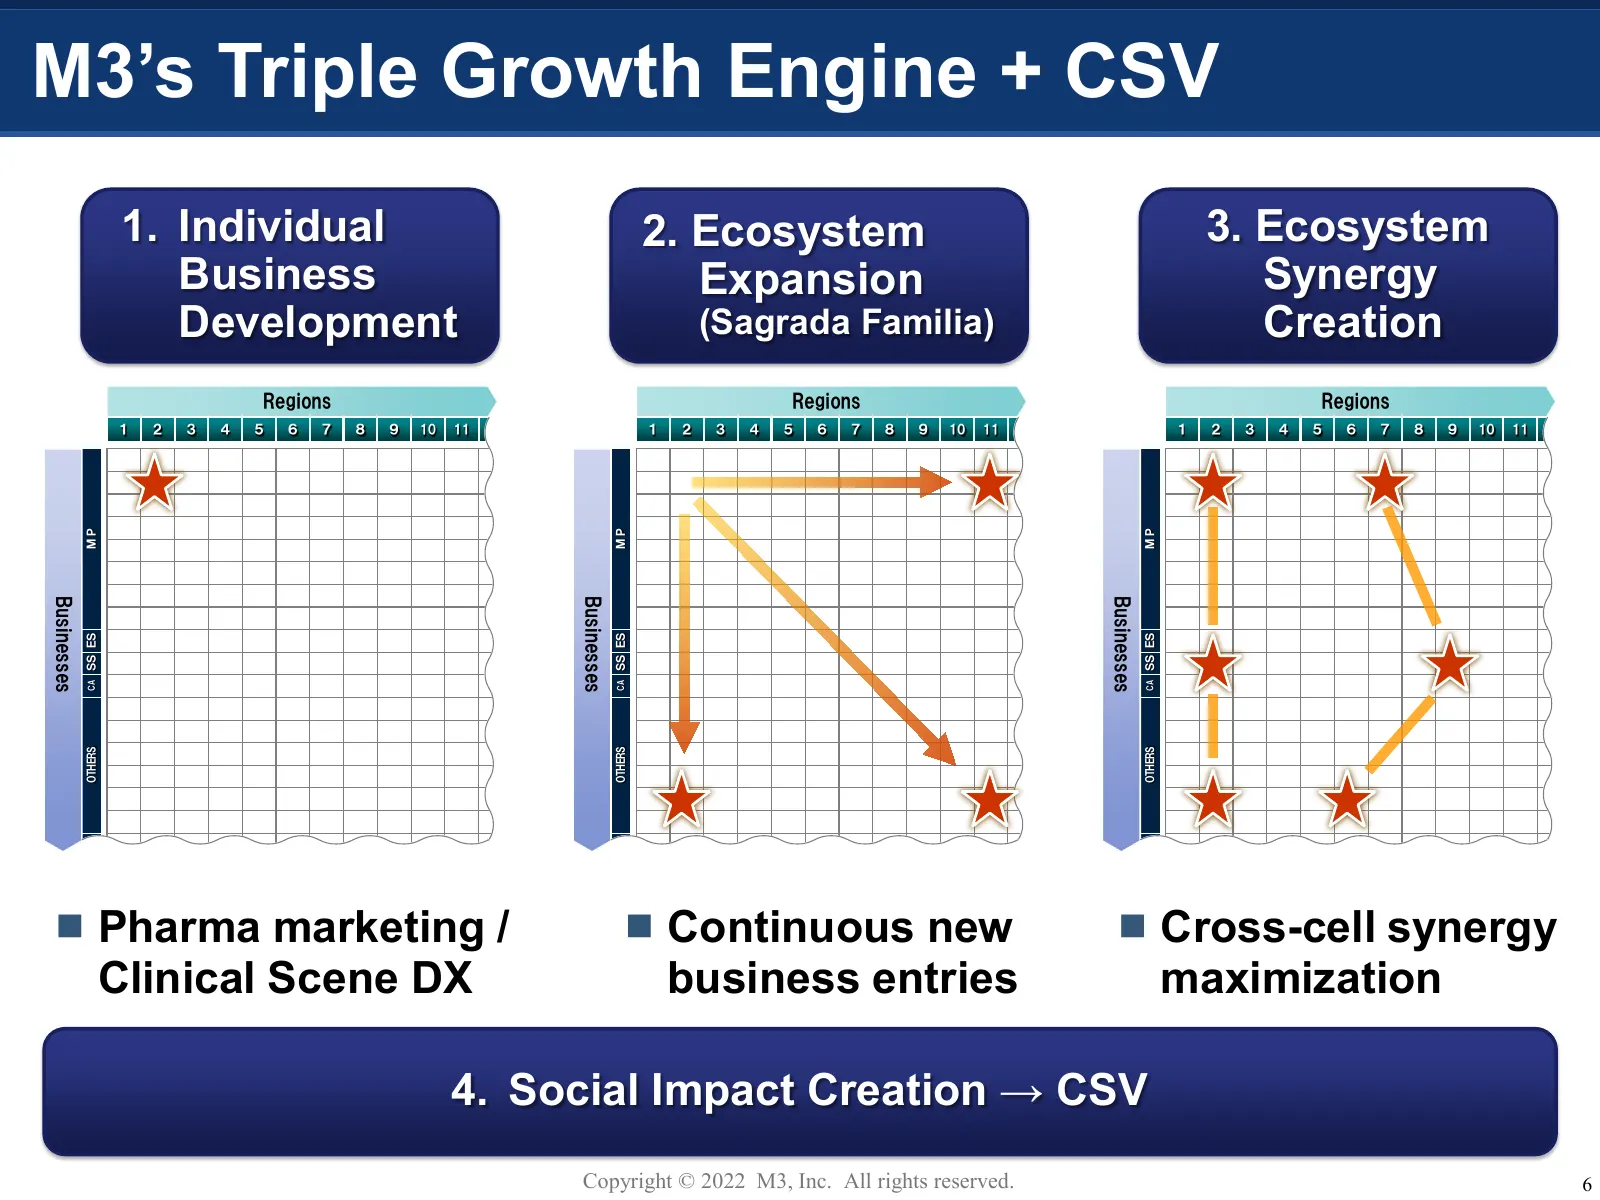
Slide 7: M3's Triple Growth Engine + CSV
M3’s Triple Growth Engine + CSV 1. Individual 2. Ecosystem 3. Ecosystem Business Expansion Synergy Development (Sagrada Familia) Creation Regions Regions Regions 1 2 3 4 5 6 7 8 9 10 11 1 2 3 4 5 6 7 8 9 10 11 1 2 3 4 5 6 7 8 9 10 11 MP MP MP Businesses Businesses Businesses SS ES SS ES SS ES CA CA
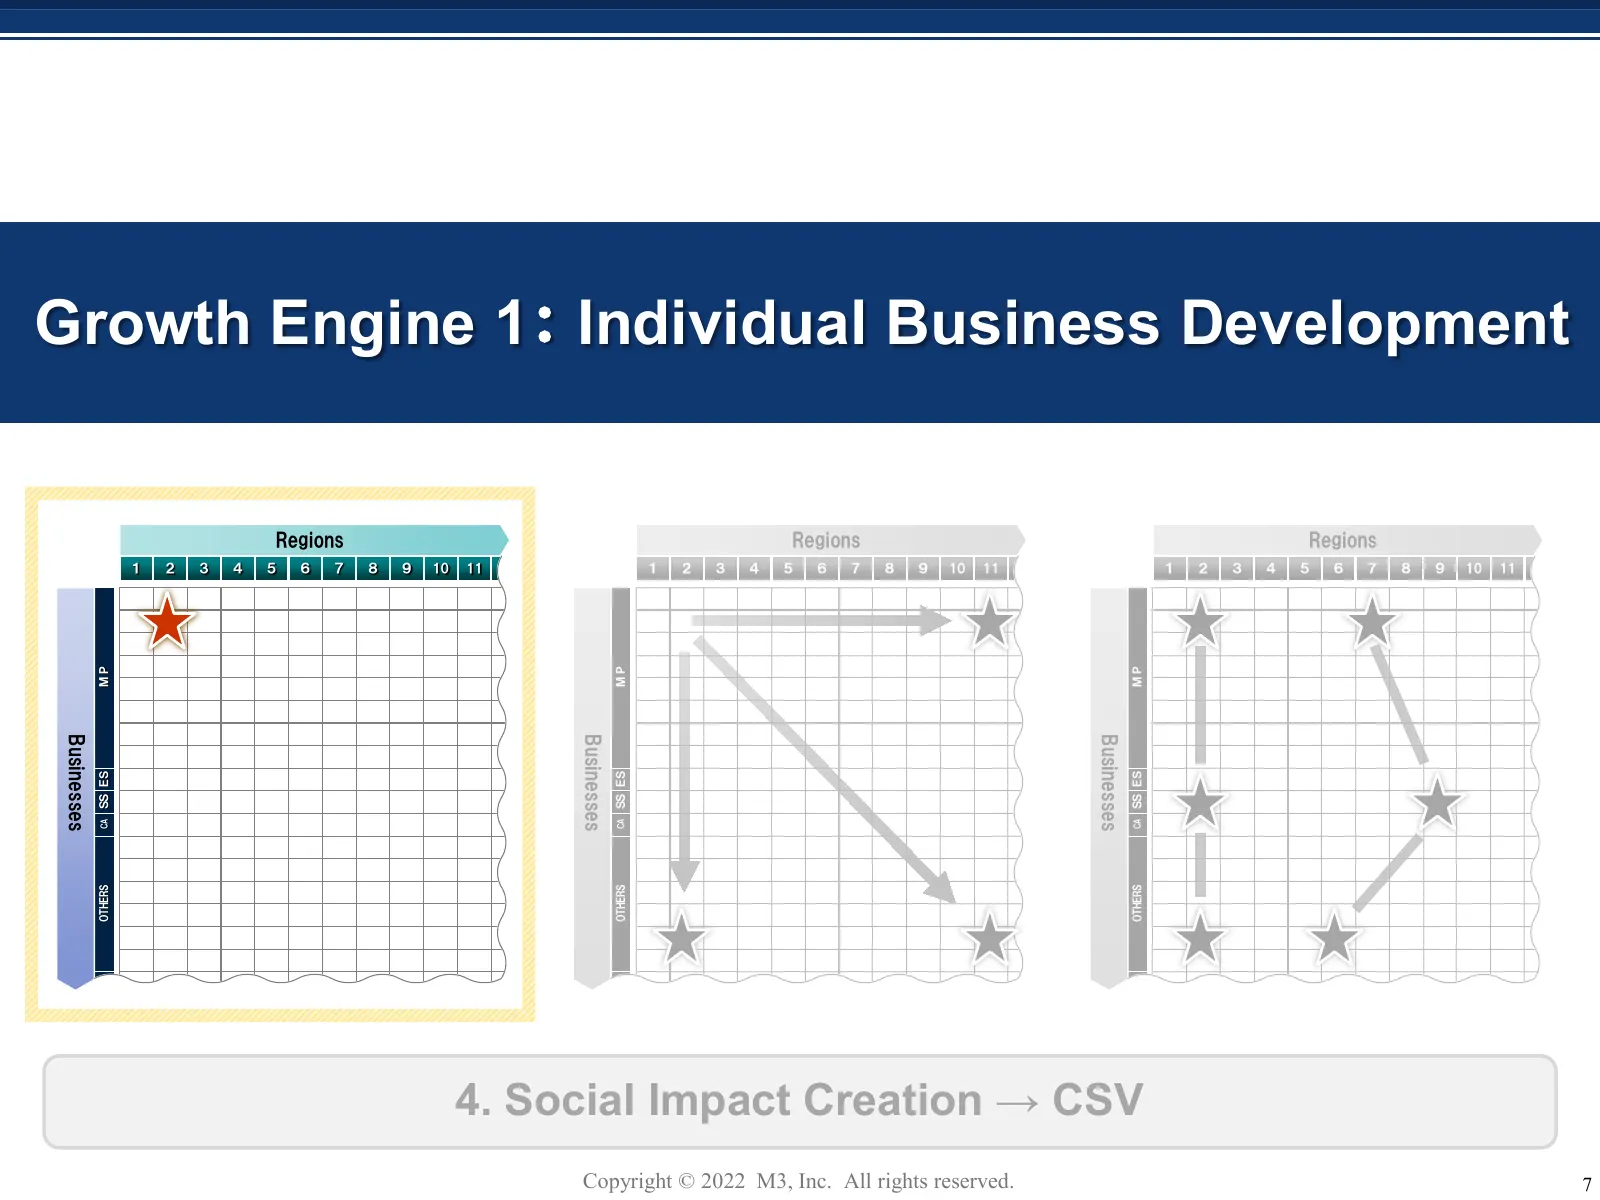
Slide 8: Growth Engine 1: Individual Business Development
Growth Engine 1: Individual Business Development Regions Regions Regions 1 2 3 4 5 6 7 8 9 10 11 1 2 3 4 5 6 7 8 9 10 11 1 2 3 4 5 6 7 8 9 10 11 MP MP MP Businesses Businesses Businesses SS ES SS ES SS ES CA CA CA OTHERS OTHERS OTHERS 4. Social Impact Creation → CSV Copyright © 2022 M3, Inc. All rig
Slide 9: Pharmaceutical Sales & Marketing DX
Pharmaceutical Sales & Marketing DX Copyright © 2022 M3, Inc. All rights reserved. 8
Slide 10: Pharma Marketing Cost and TAM for M3
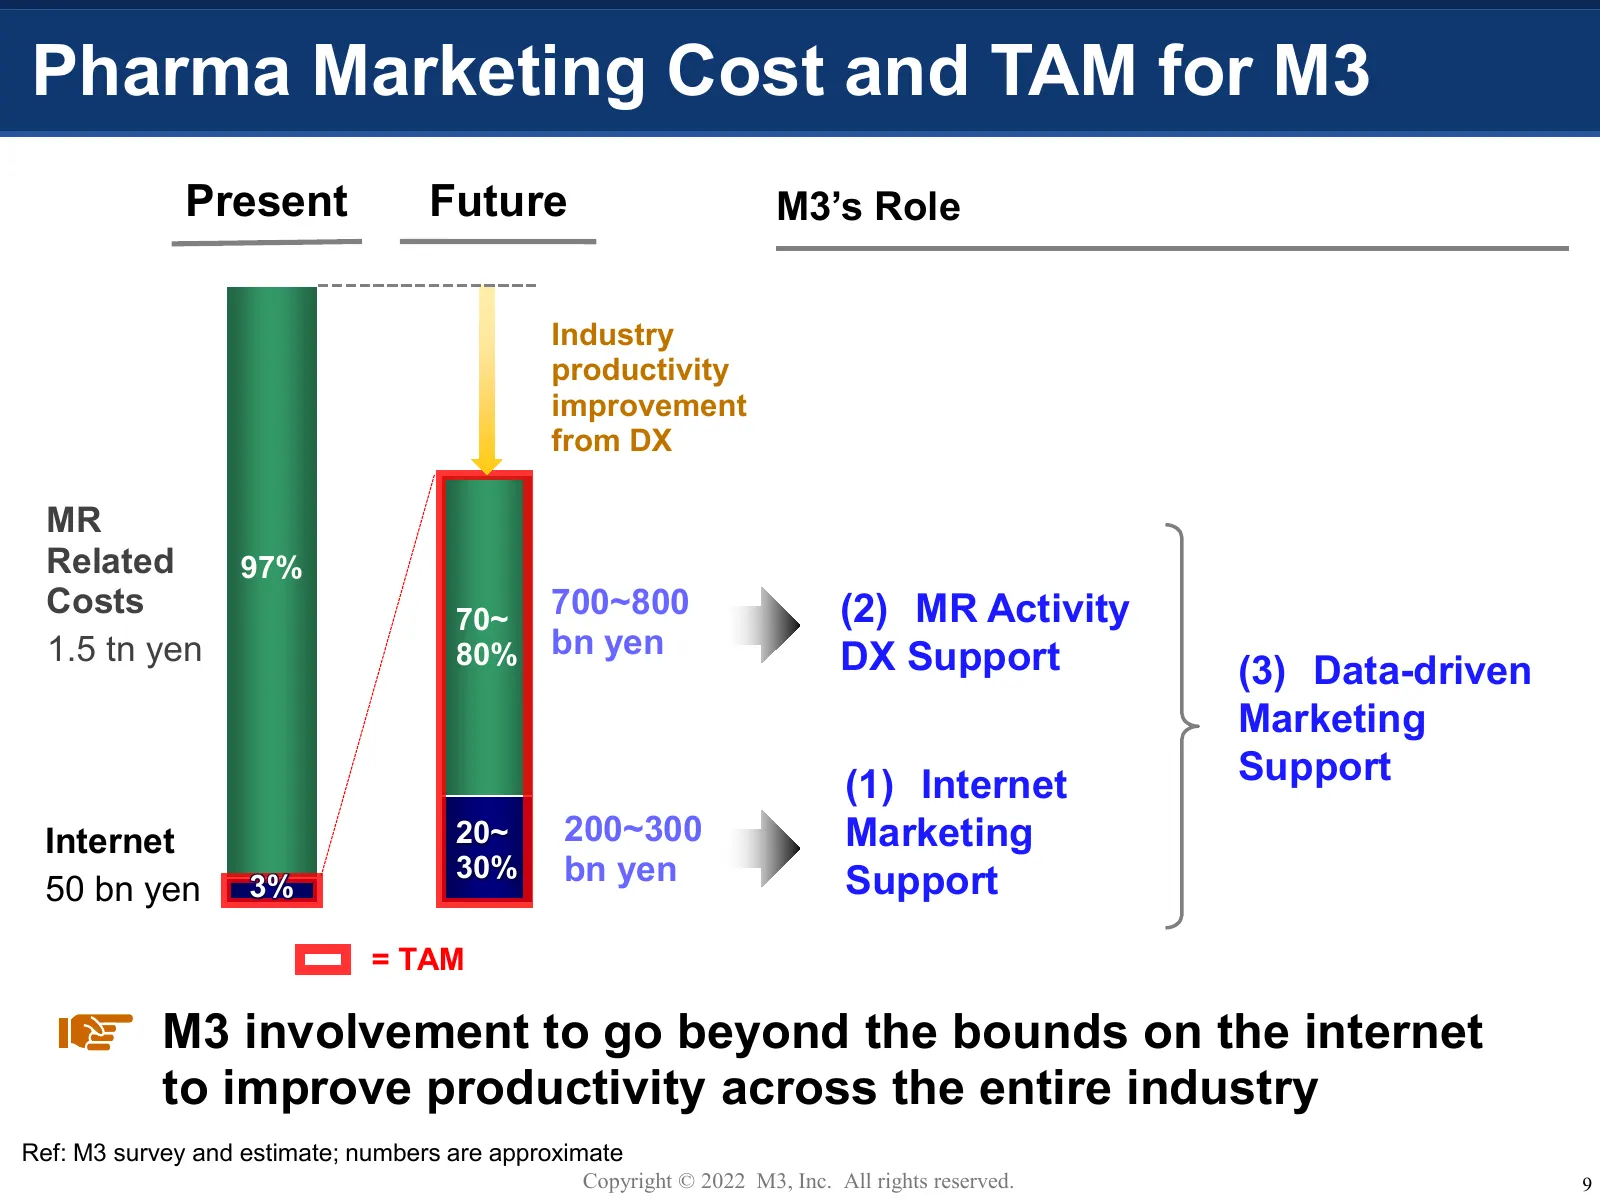
Pharma Marketing Cost and TAM for M3 Present Future M3’s Role Industry productivity improvement from DX MR Related 97% Costs 70~ 700~800 (2) MR Activity 1.5 tn yen 80% bn yen DX Support (3) Data-driven Marketing (1) Internet Support Internet 20~ 200~300 Marketing 30% bn yen Support 50 bn yen 3% = TA
Slide 11: Service Scope Expansion
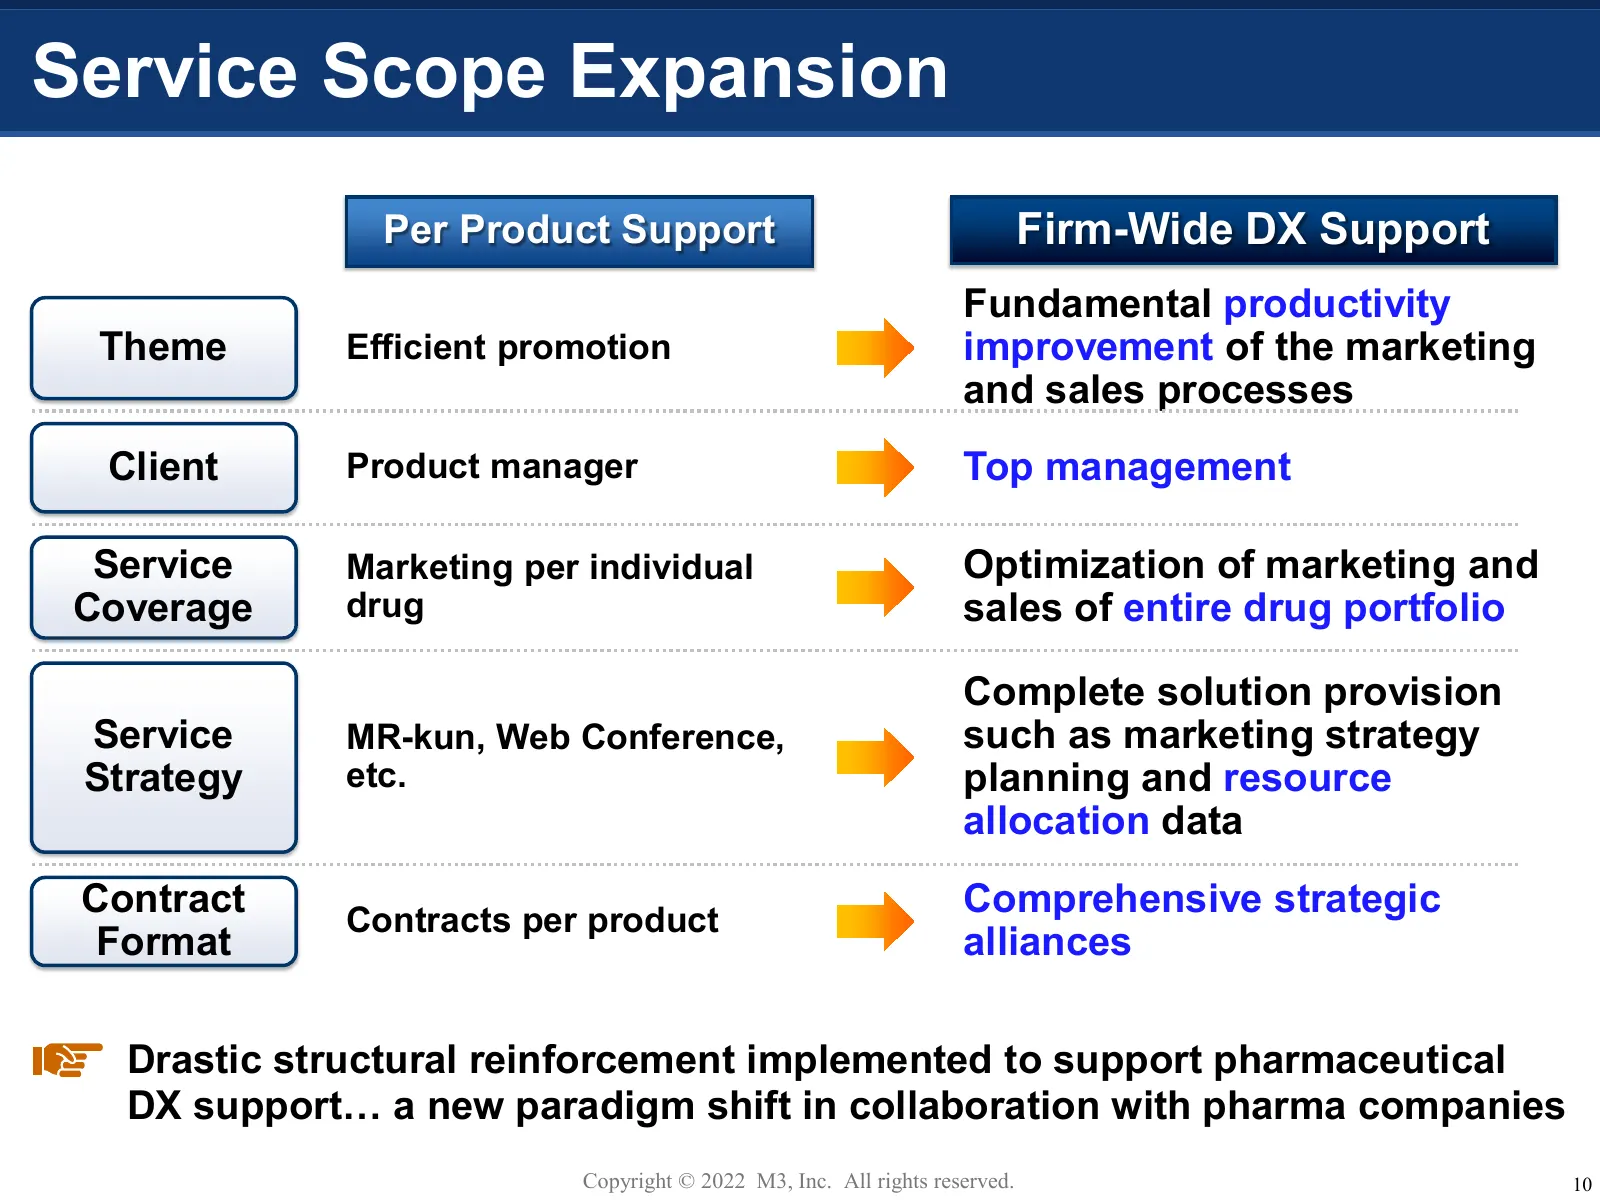
Service Scope Expansion Per Product Support Firm-Wide DX Support Fundamental productivity Theme Efficient promotion improvement of the marketing and sales processes Client Product manager Top management Service Marketing per individual Optimization of marketing and Coverage drug sales of entire drug
Slide 12: Professional Staff Fortification Plan
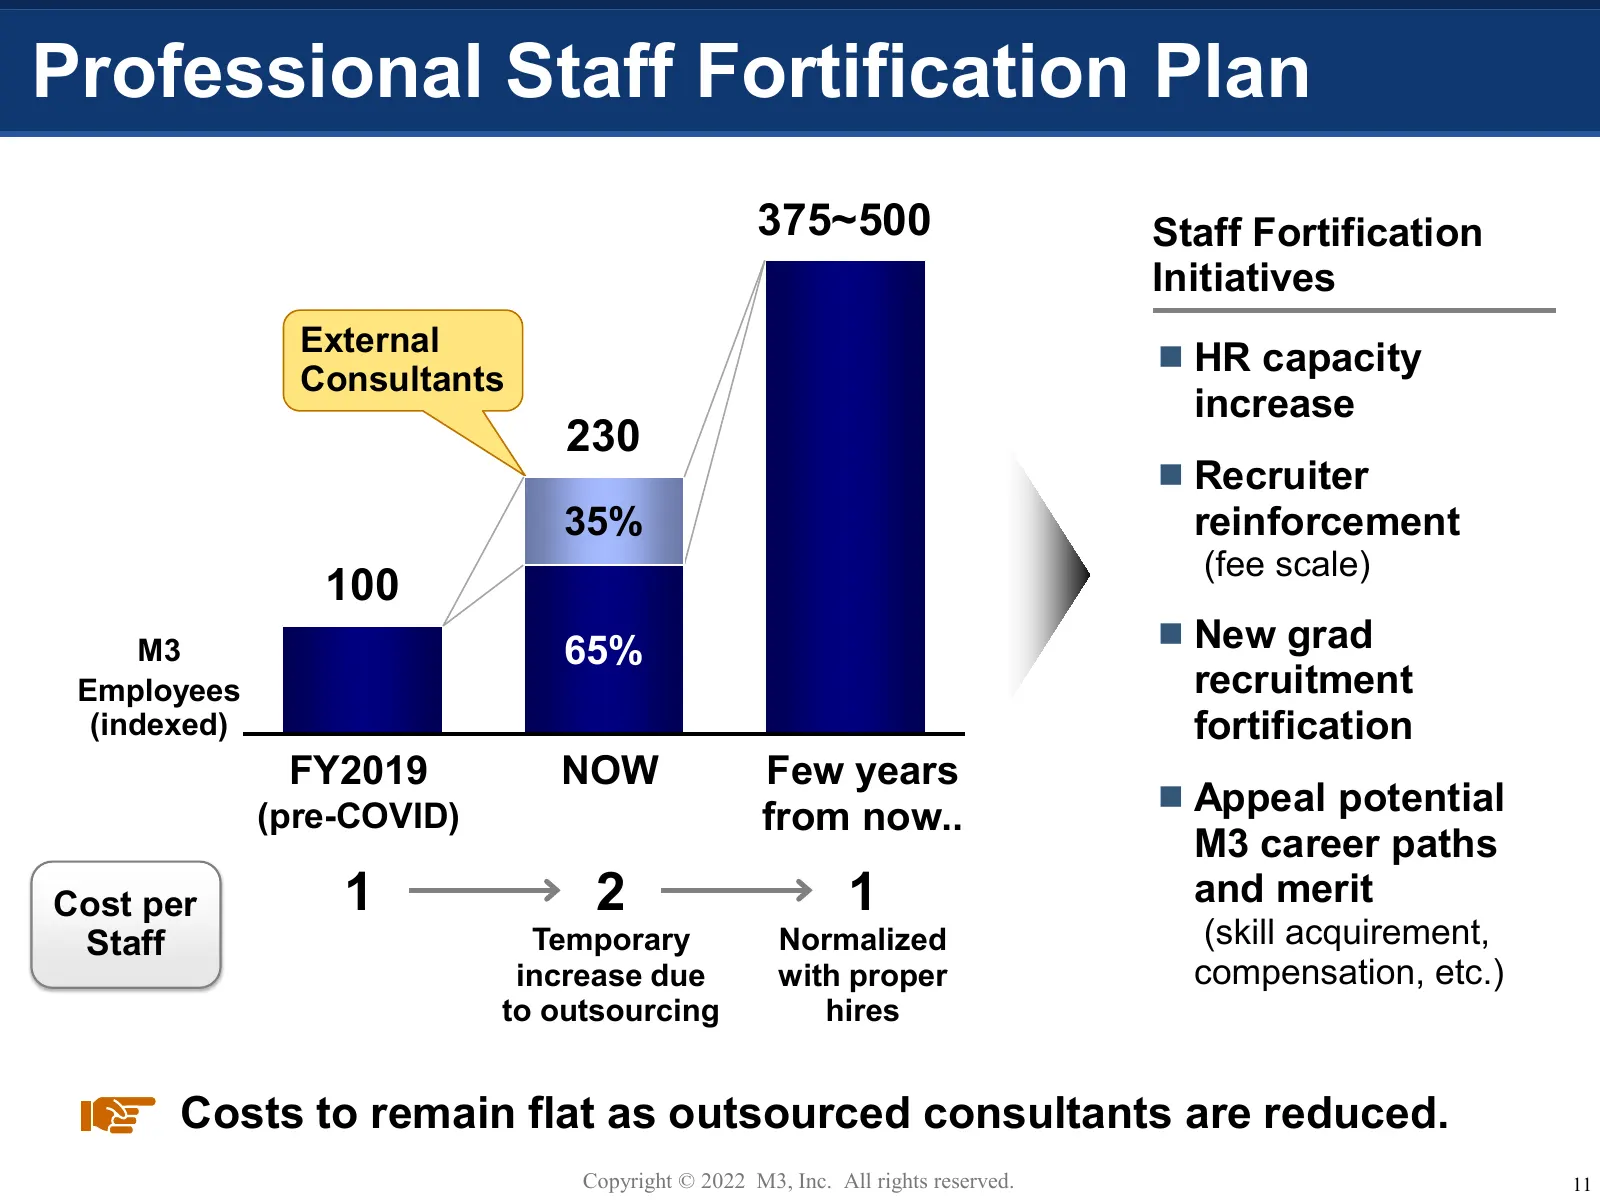
Professional Staff Fortification Plan 375~500 Staff Fortification Initiatives External Consultants HR capacity increase 230 Recruiter 35% reinforcement (fee scale) 100 M3 65% New grad Employees recruitment (indexed) fortification FY2019 NOW Few years (pre-COVID) from now.. Appeal potential M
Slide 13: Hiring Progress of M3 Professionals
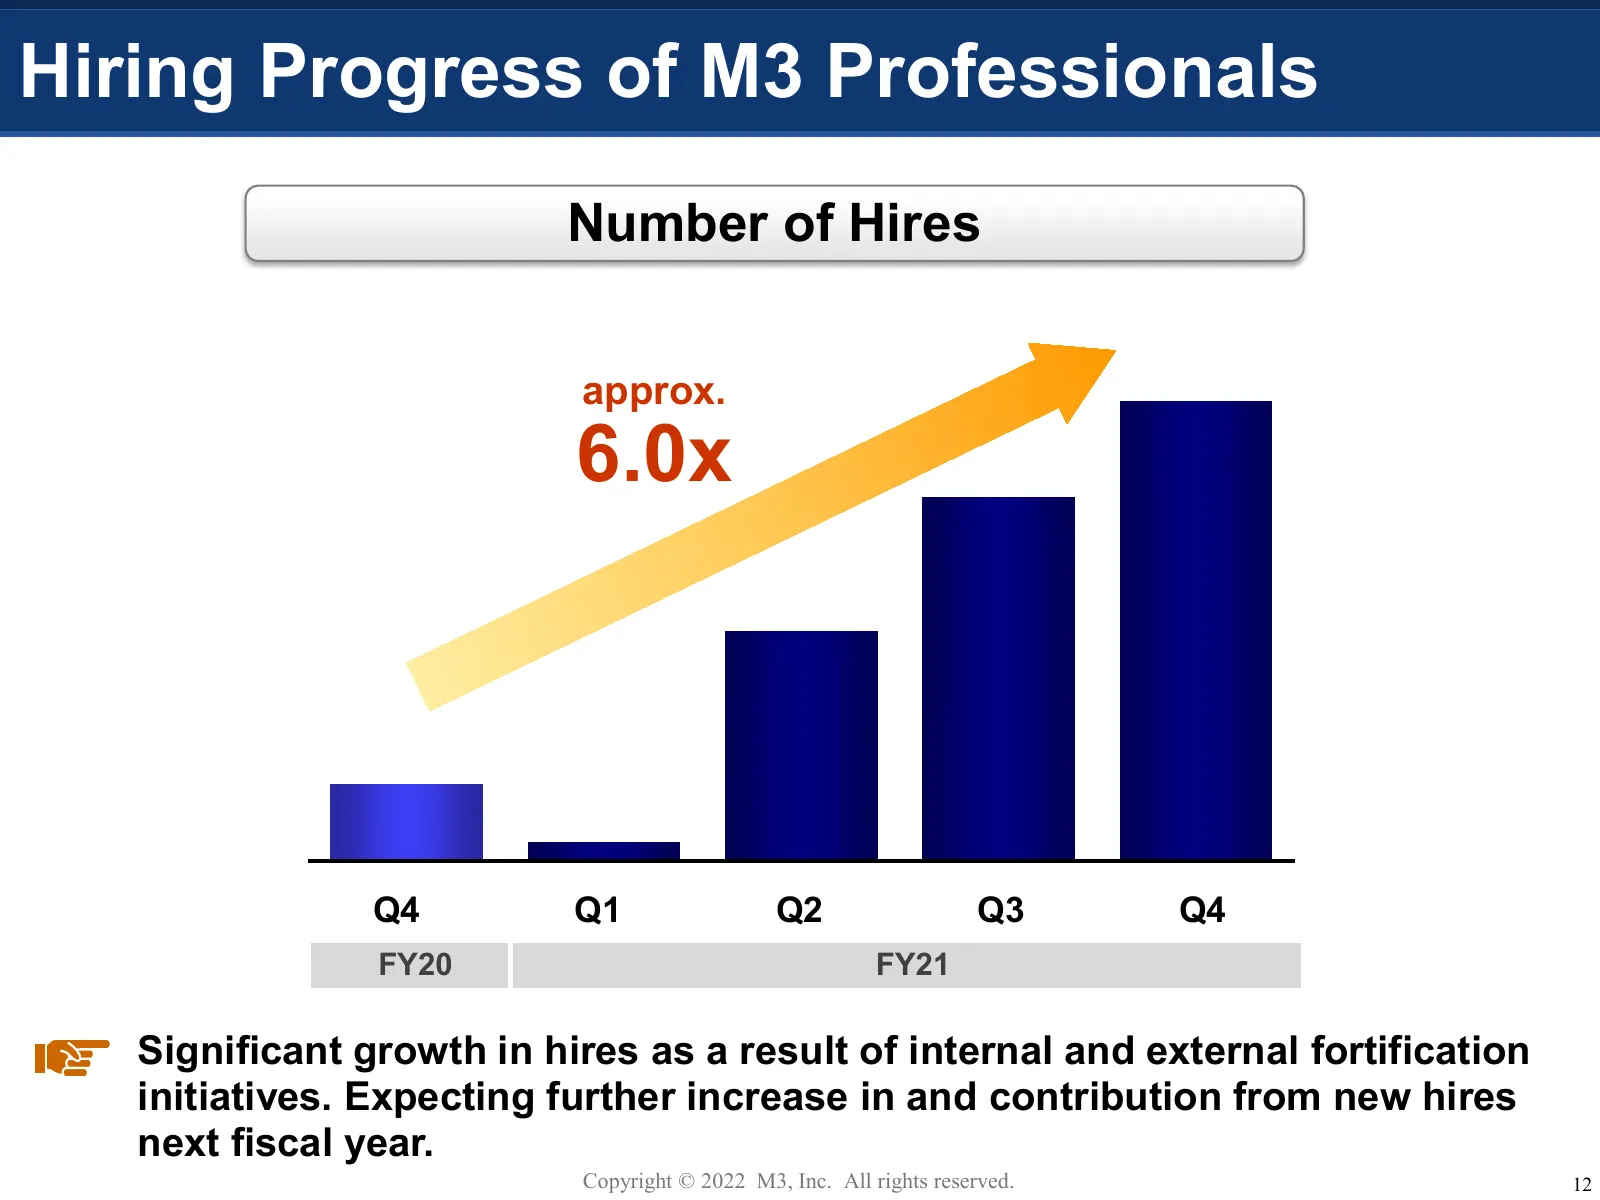
Hiring Progress of M3 Professionals Number of Hires approx. 6.0x Q4 Q1 Q2 Q3 Q4 FY20 FY21 Significant growth in hires as a result of internal and external fortification initiatives. Expecting further increase in and contribution from new hires next fiscal year. Copyright © 2022 M3, Inc. All rights r
Slide 14: Digital Marketing Business Review and Outlook
Digital Marketing Business Review and Outlook Stabilization of FY20 year-end influx seen during COVID saw FY21Q4 sales flat YoY Steady progress in structural DX confirm continued market expansion As a key growth driver, staff reinforcement initiatives progressed favorably Full-scale contribu
Slide 15: DX of the Clinical Scene
DX of the Clinical Scene Copyright © 2022 M3, Inc. All rights reserved. 14
Slide 16: Potential in DX of Clinics
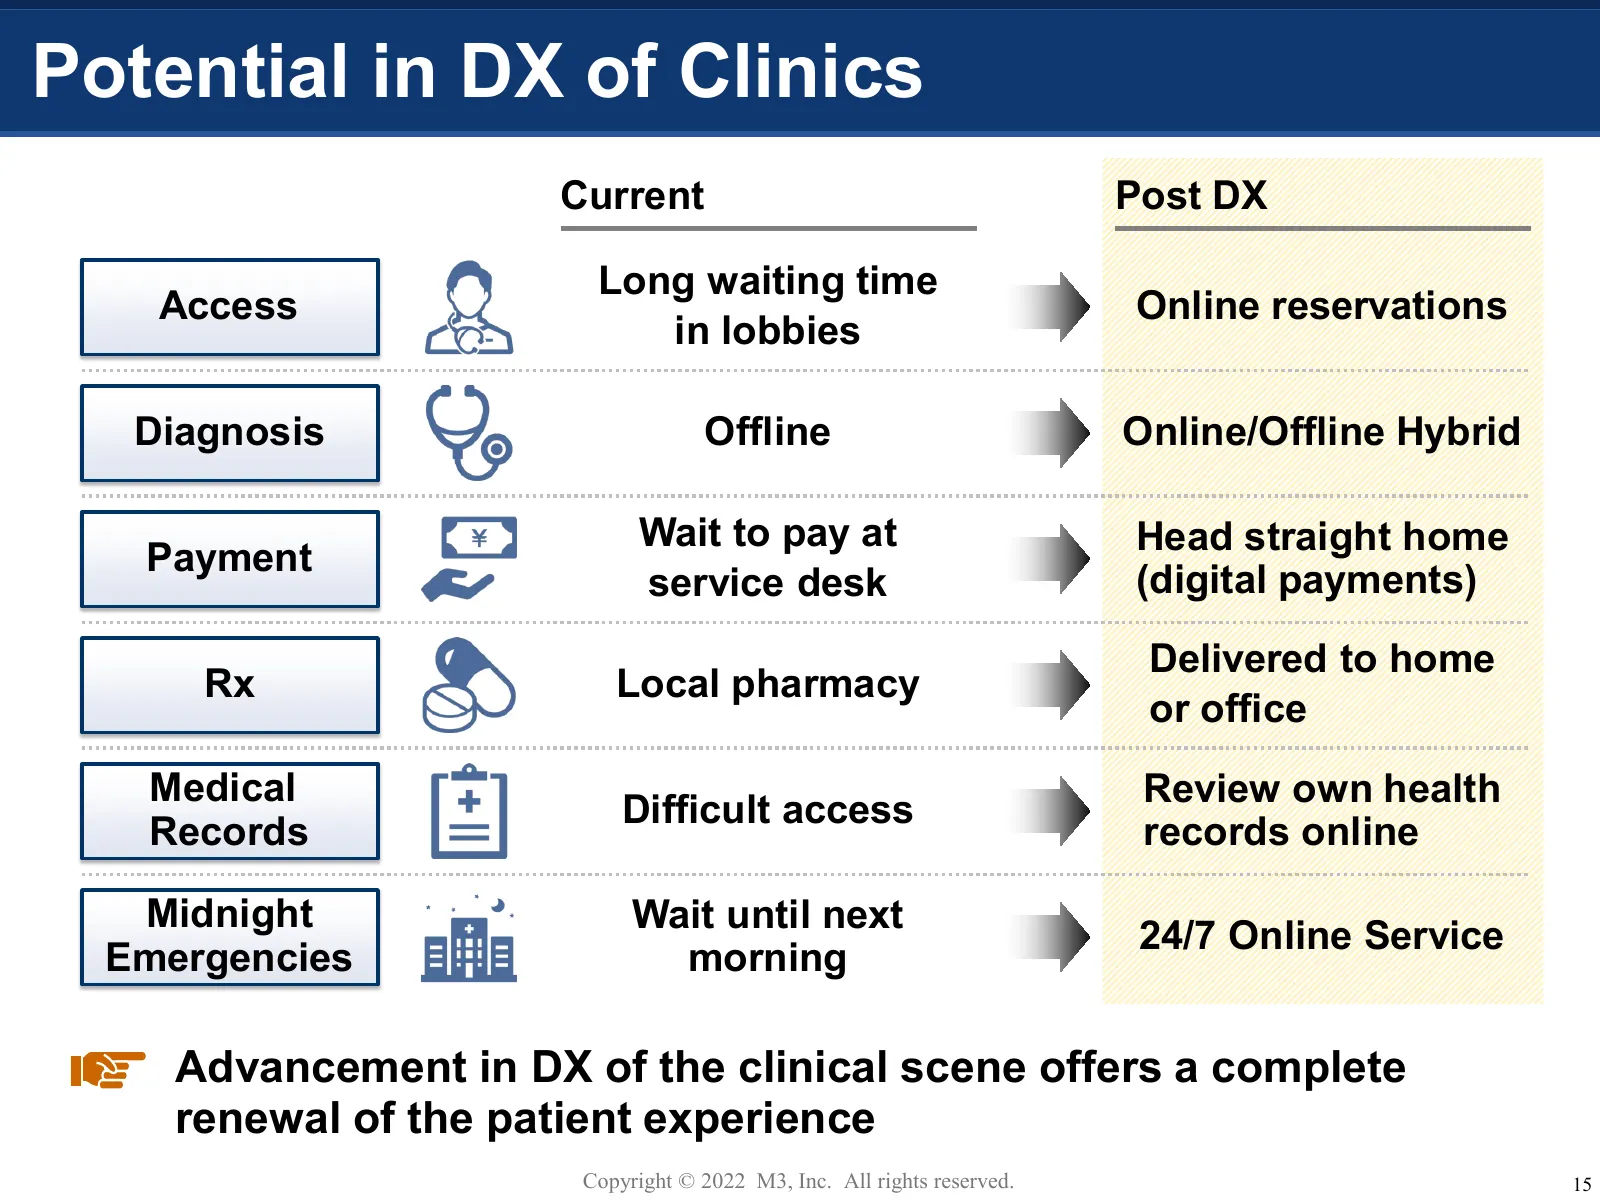
Potential in DX of Clinics Current Post DX Long waiting time Access Online reservations in lobbies Diagnosis Offline Online/Offline Hybrid Wait to pay at Head straight home Payment service desk (digital payments) Delivered to home Rx Local pharmacy or office Medical Review own health Difficult acces
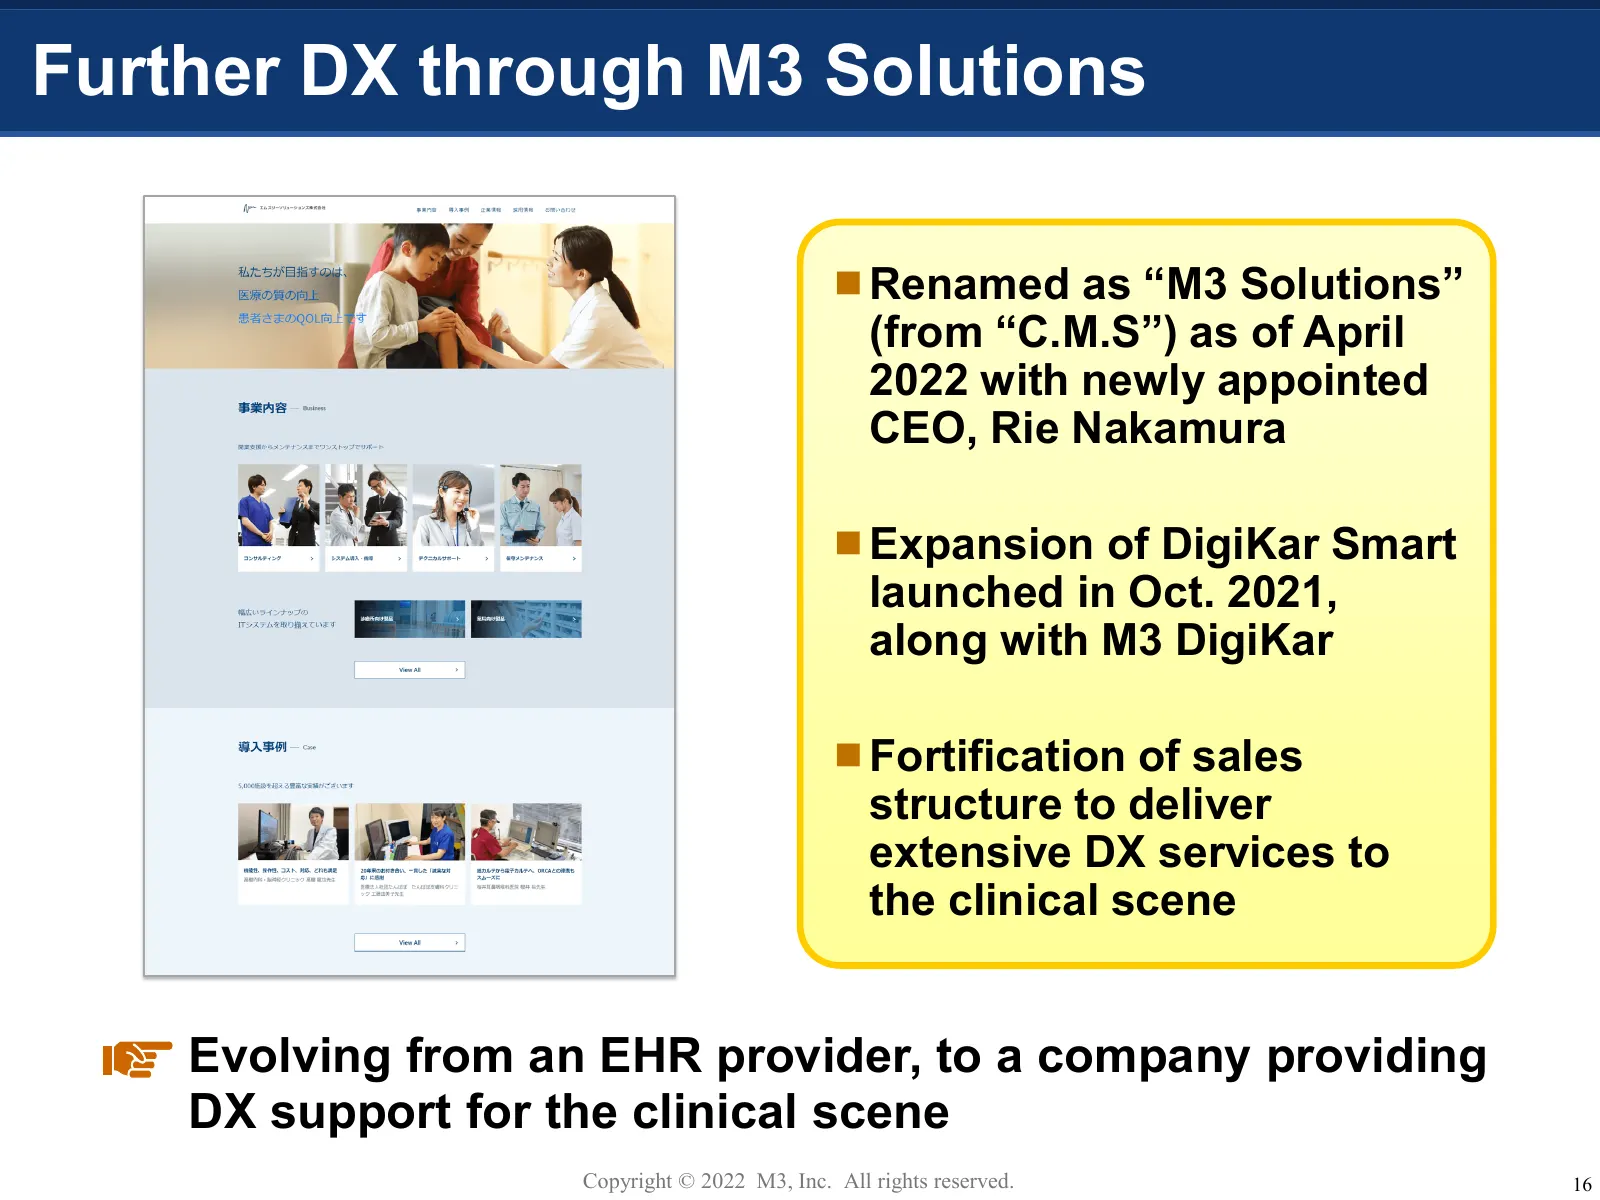
Slide 17: Further DX through M3 Solutions
Further DX through M3 Solutions Renamed as “M3 Solutions” (from “C.M.S”) as of April 2022 with newly appointed CEO, Rie Nakamura Expansion of DigiKar Smart launched in Oct. 2021, along with M3 DigiKar Fortification of sales structure to deliver extensive DX services to the clinical scene Evolving
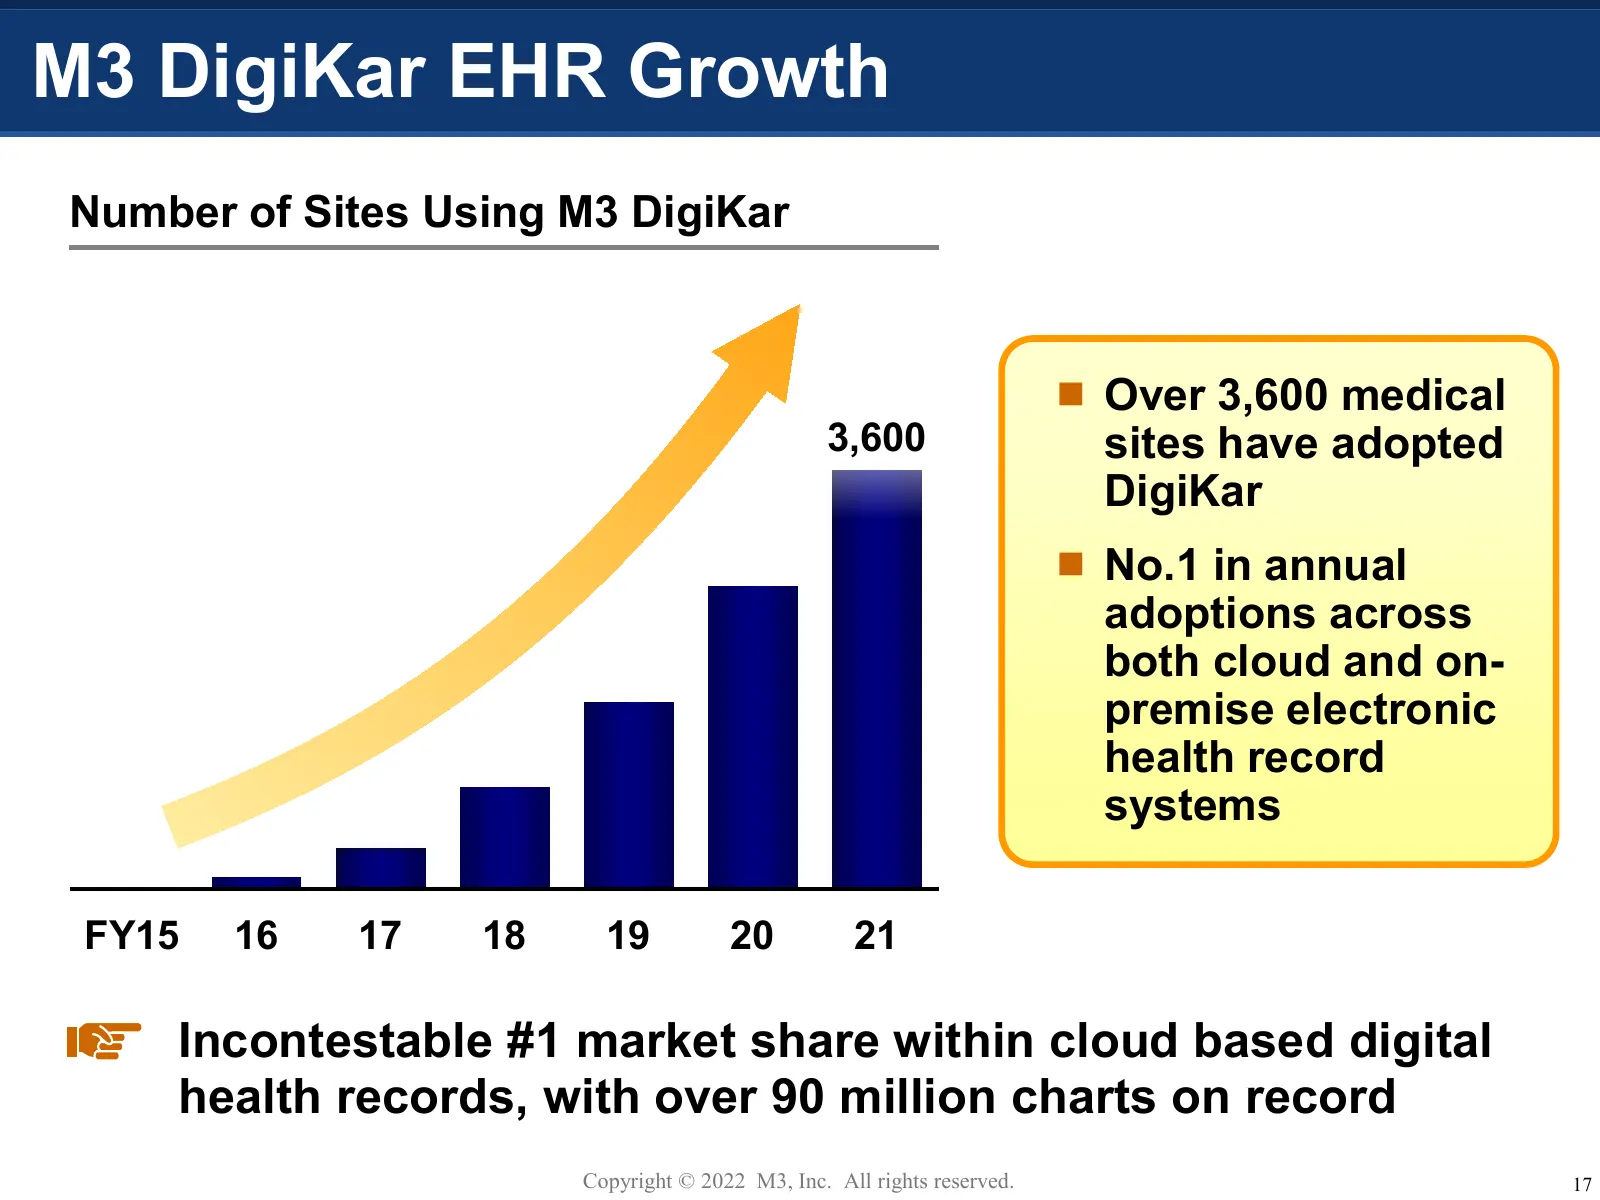
Slide 18: M3 DigiKar EHR Growth
M3 DigiKar EHR Growth Number of Sites Using M3 DigiKar Over 3,600 medical 3,600 sites have adopted DigiKar No.1 in annual adoptions across both cloud and on- premise electronic health record systems FY15 16 17 18 19 20 21 Incontestable #1 market share within cloud based digital health records, w
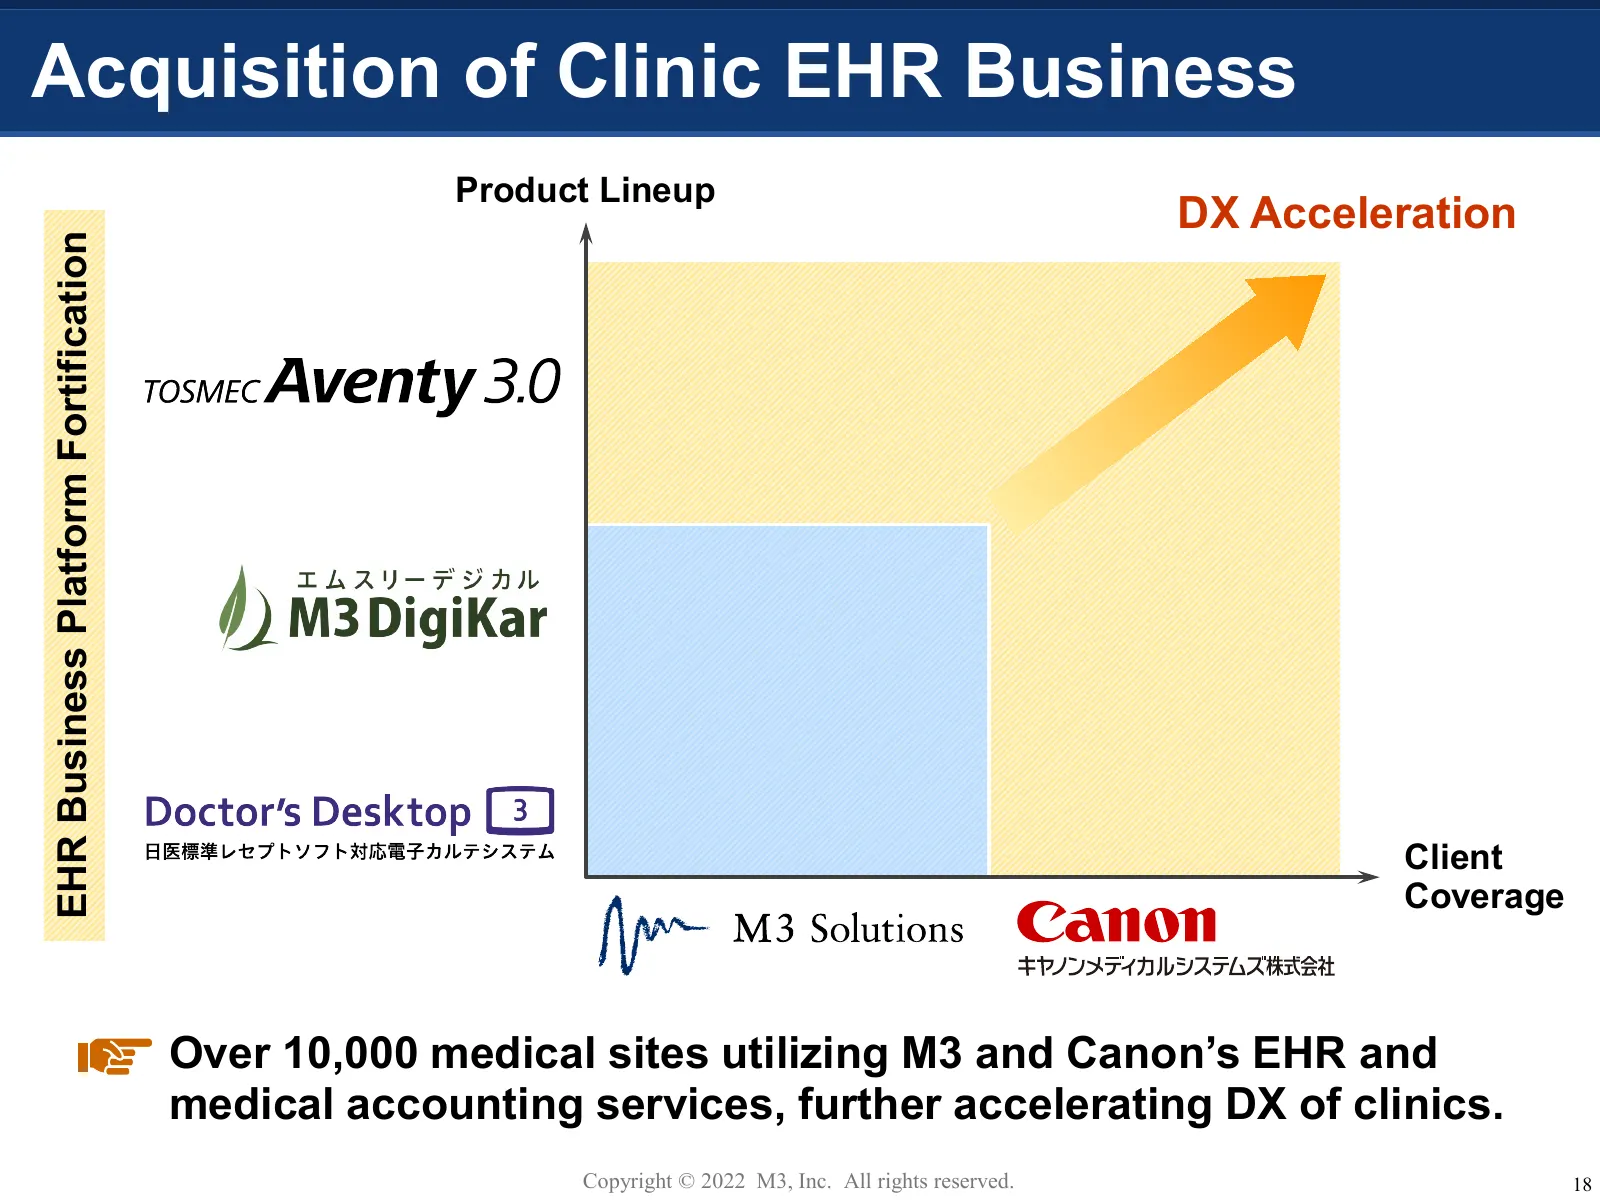
Slide 19: EHR Business Platform Fortification
Acquisition of Clinic EHR Business Product Lineup DX Acceleration EHR Business Platform Fortification Client Coverage Over 10,000 medical sites utilizing M3 and Canon’s EHR and medical accounting services, further accelerating DX of clinics. Copyright © 2022 M3, Inc. All rights reserved. 18
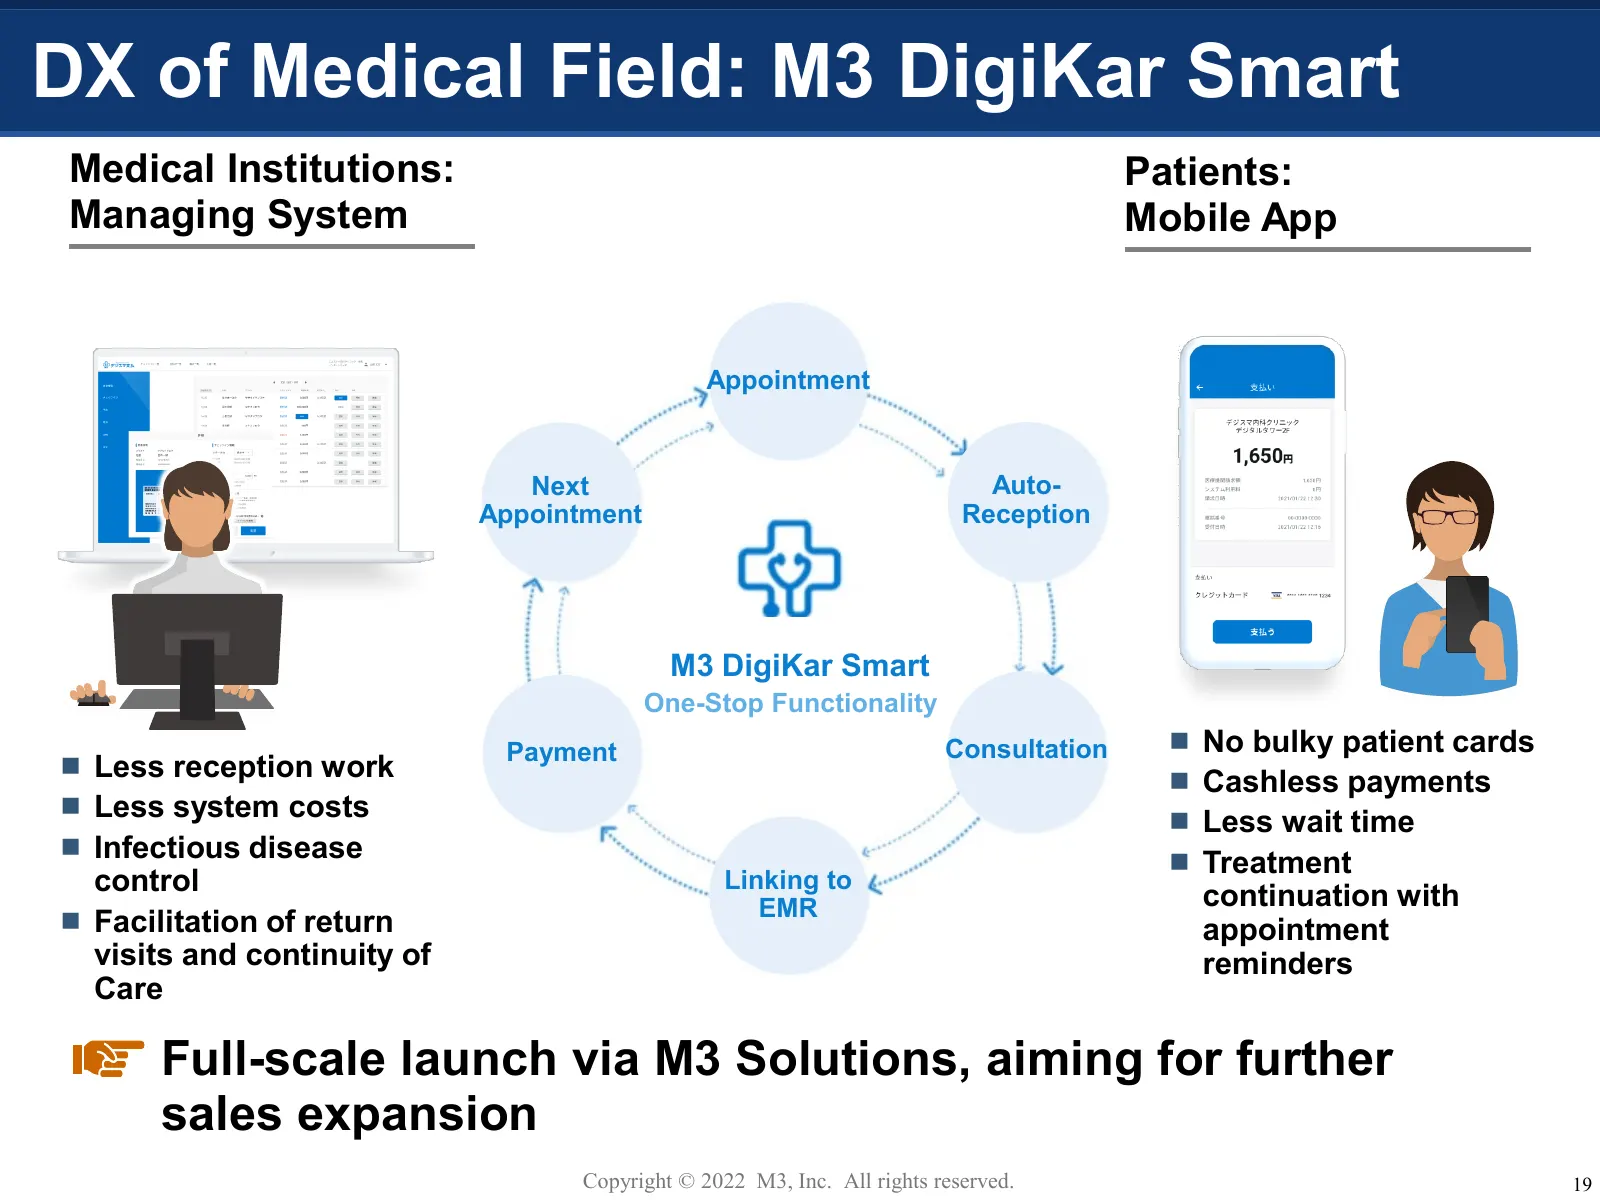
Slide 20: DX of Medical Field: M3 DigiKar Smart
DX of Medical Field: M3 DigiKar Smart Medical Institutions: Patients: Managing System Mobile App Appointment Next Auto- Appointment Reception M3 DigiKar Smart One-Stop Functionality Payment Consultation No bulky patient cards Less reception work Cashless payments Less system costs Less wai
Slide 21: Growth Engine 2: Ecosystem Expansion (Sagrada Familia)
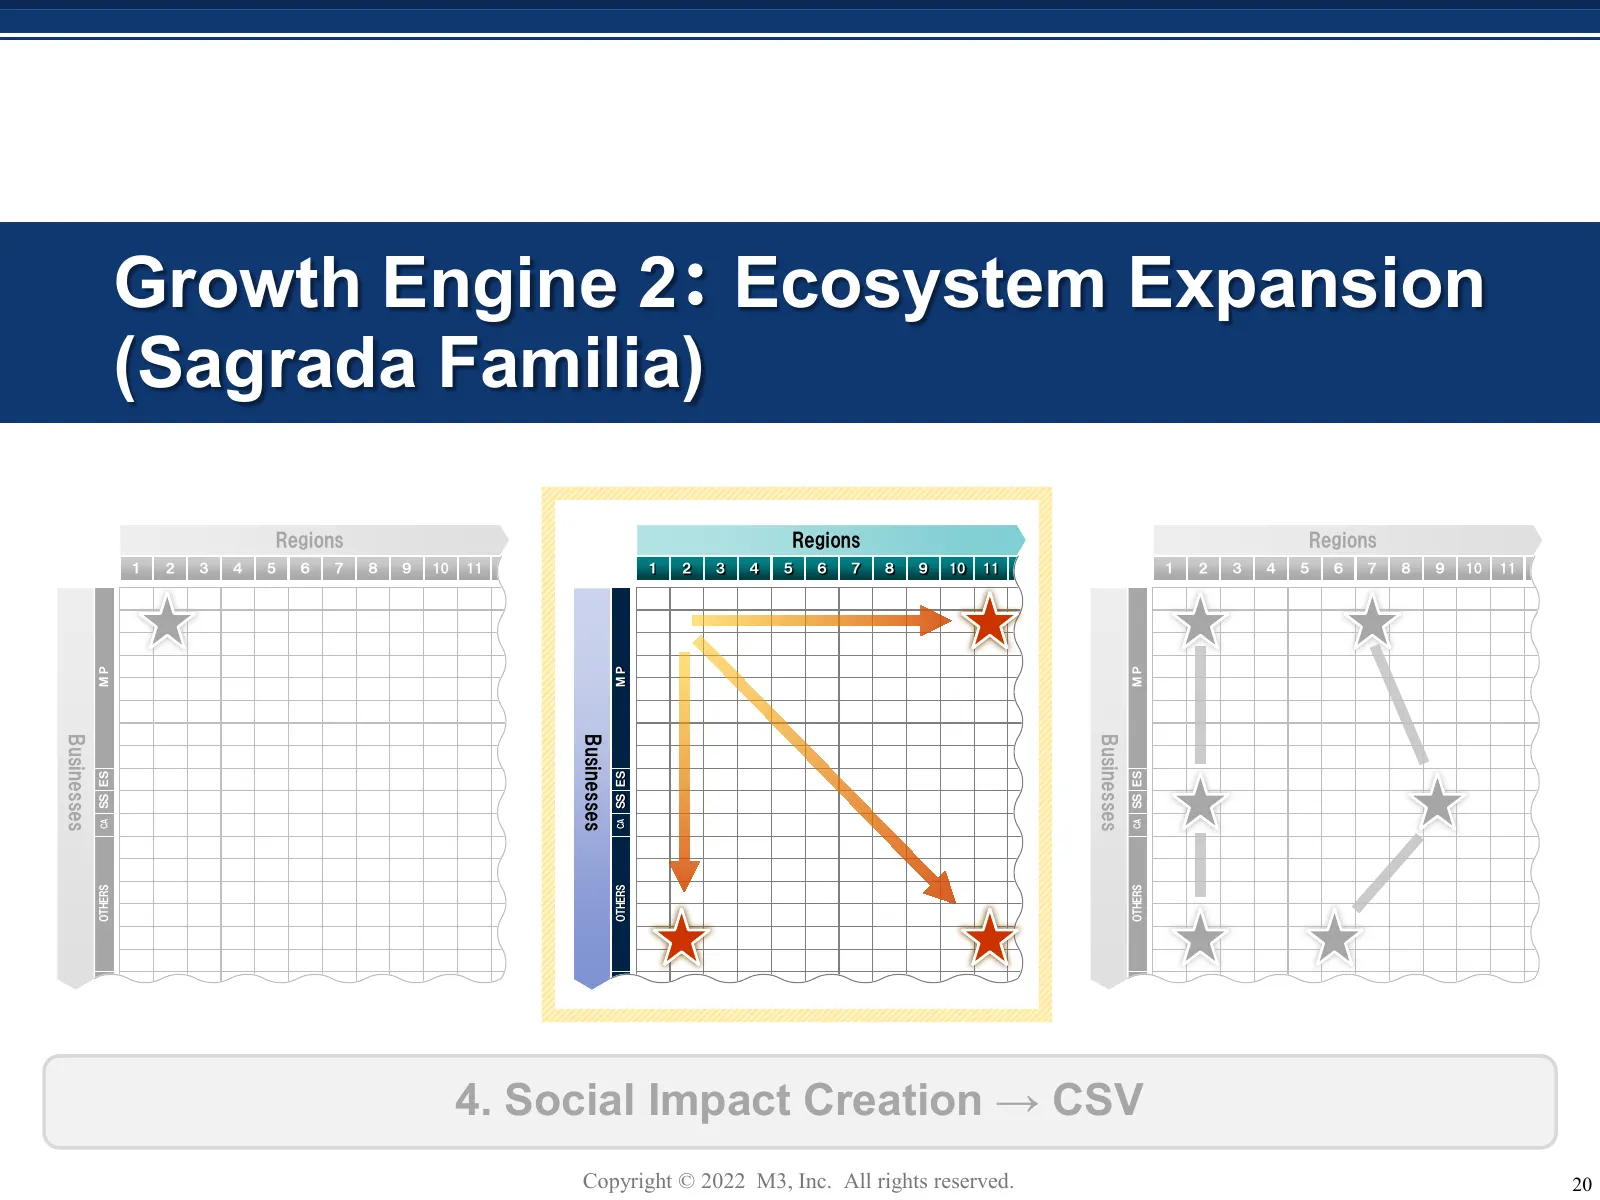
Growth Engine 2: Ecosystem Expansion (Sagrada Familia) Regions Regions Regions 1 2 3 4 5 6 7 8 9 10 11 1 2 3 4 5 6 7 8 9 10 11 1 2 3 4 5 6 7 8 9 10 11 MP MP MP Businesses Businesses Businesses SS ES SS ES SS ES CA CA CA OTHERS OTHERS OTHERS 4. Social Impact Creation → CSV Copyright © 2022 M3, Inc. A
Slide 22: Establishment of JV with SONY: SapplyM
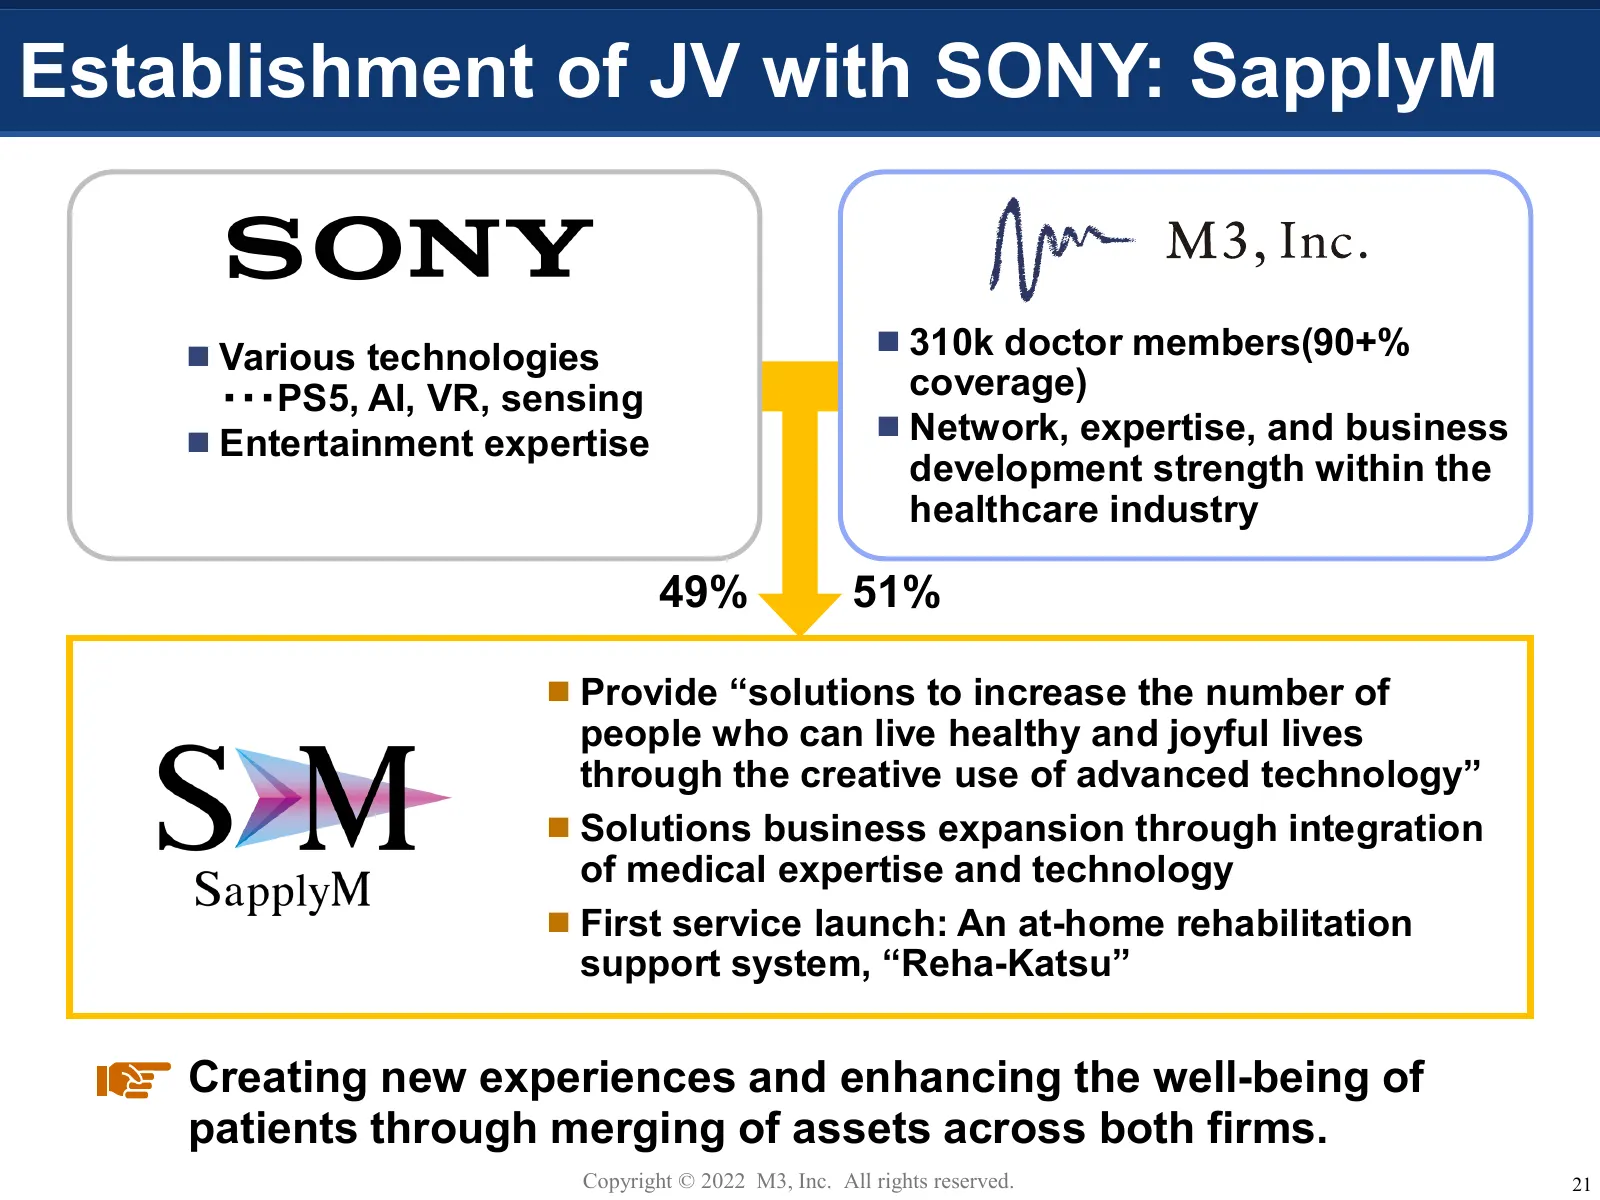
Establishment of JV with SONY: SapplyM Various technologies 310k doctor members(90+% ・・・PS5, AI, VR, sensing coverage) Entertainment expertise Network, expertise, and business development strength within the healthcare industry 49% 51% Provide “solutions to increase the number of people wh
Slide 23: Home Rehabilitation Support Service "Reha-Katsu"
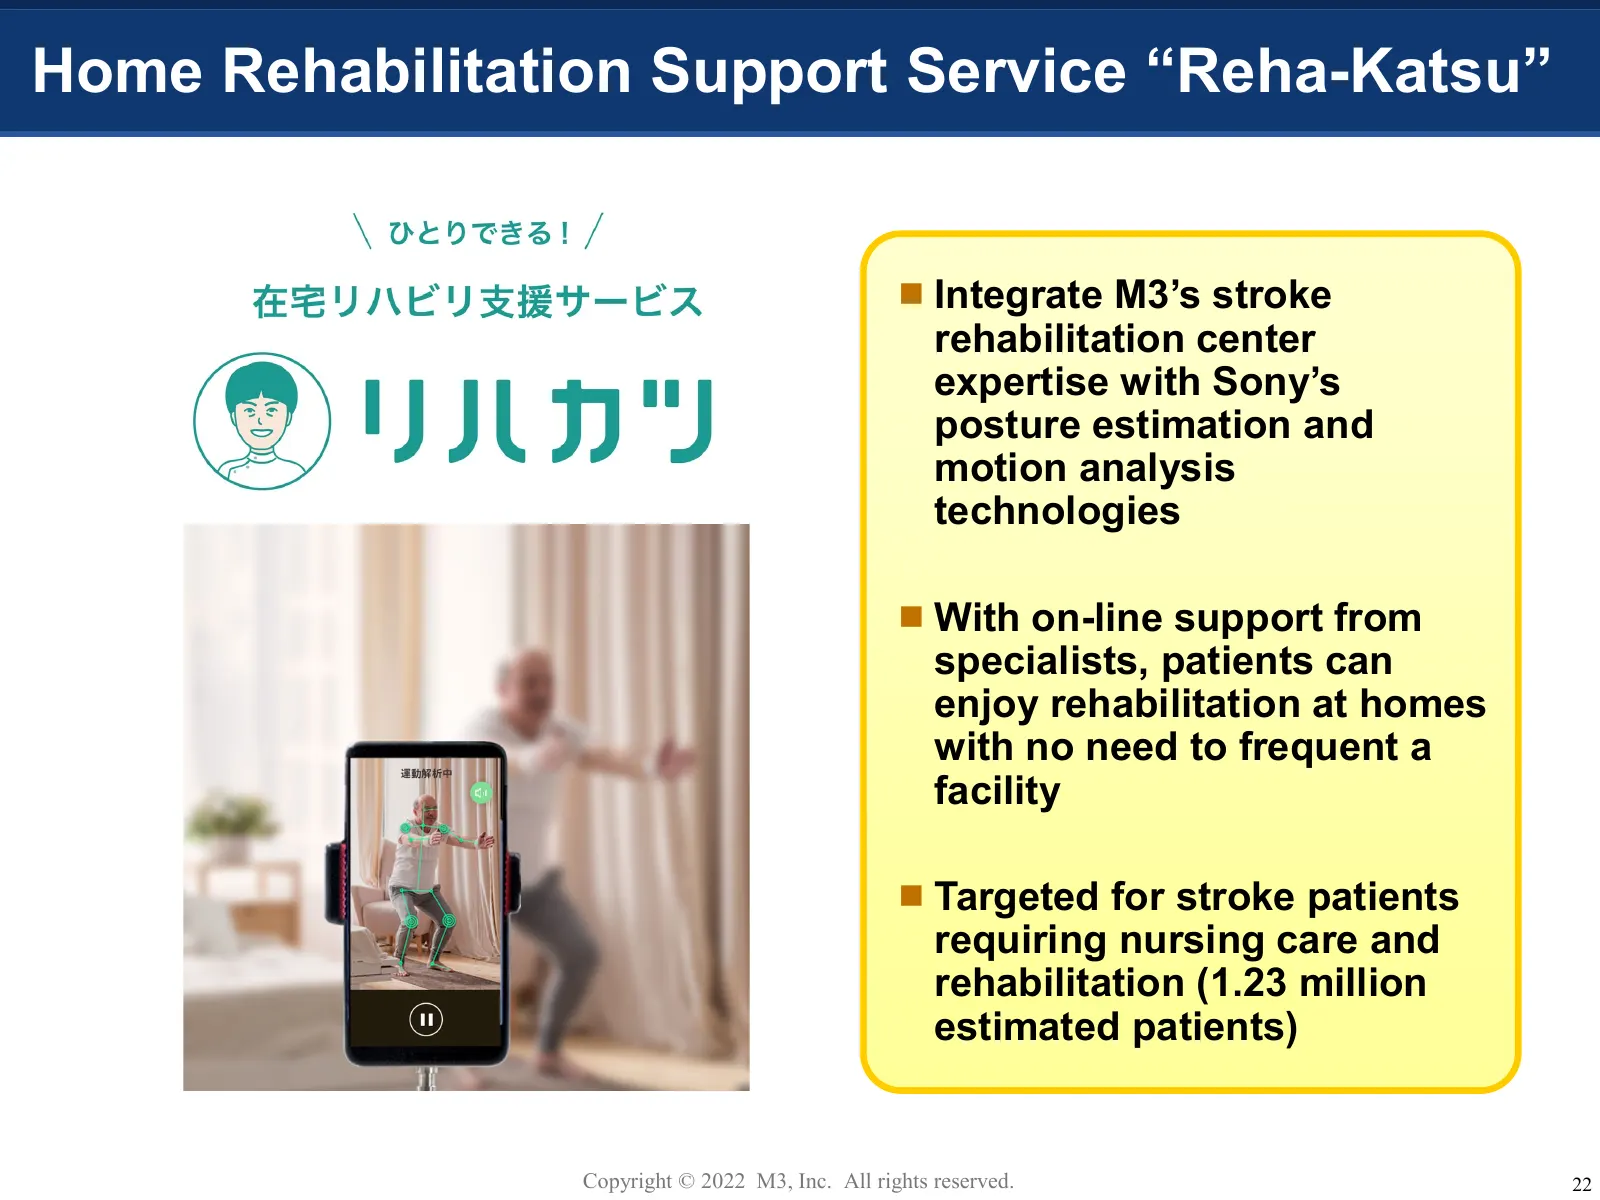
Home Rehabilitation Support Service “Reha-Katsu” Integrate M3’s stroke rehabilitation center expertise with Sony’s posture estimation and motion analysis technologies With on-line support from specialists, patients can enjoy rehabilitation at homes with no need to frequent a facility Targeted
Slide 24: Market Launch of Burn Treatment Device "RECELL"
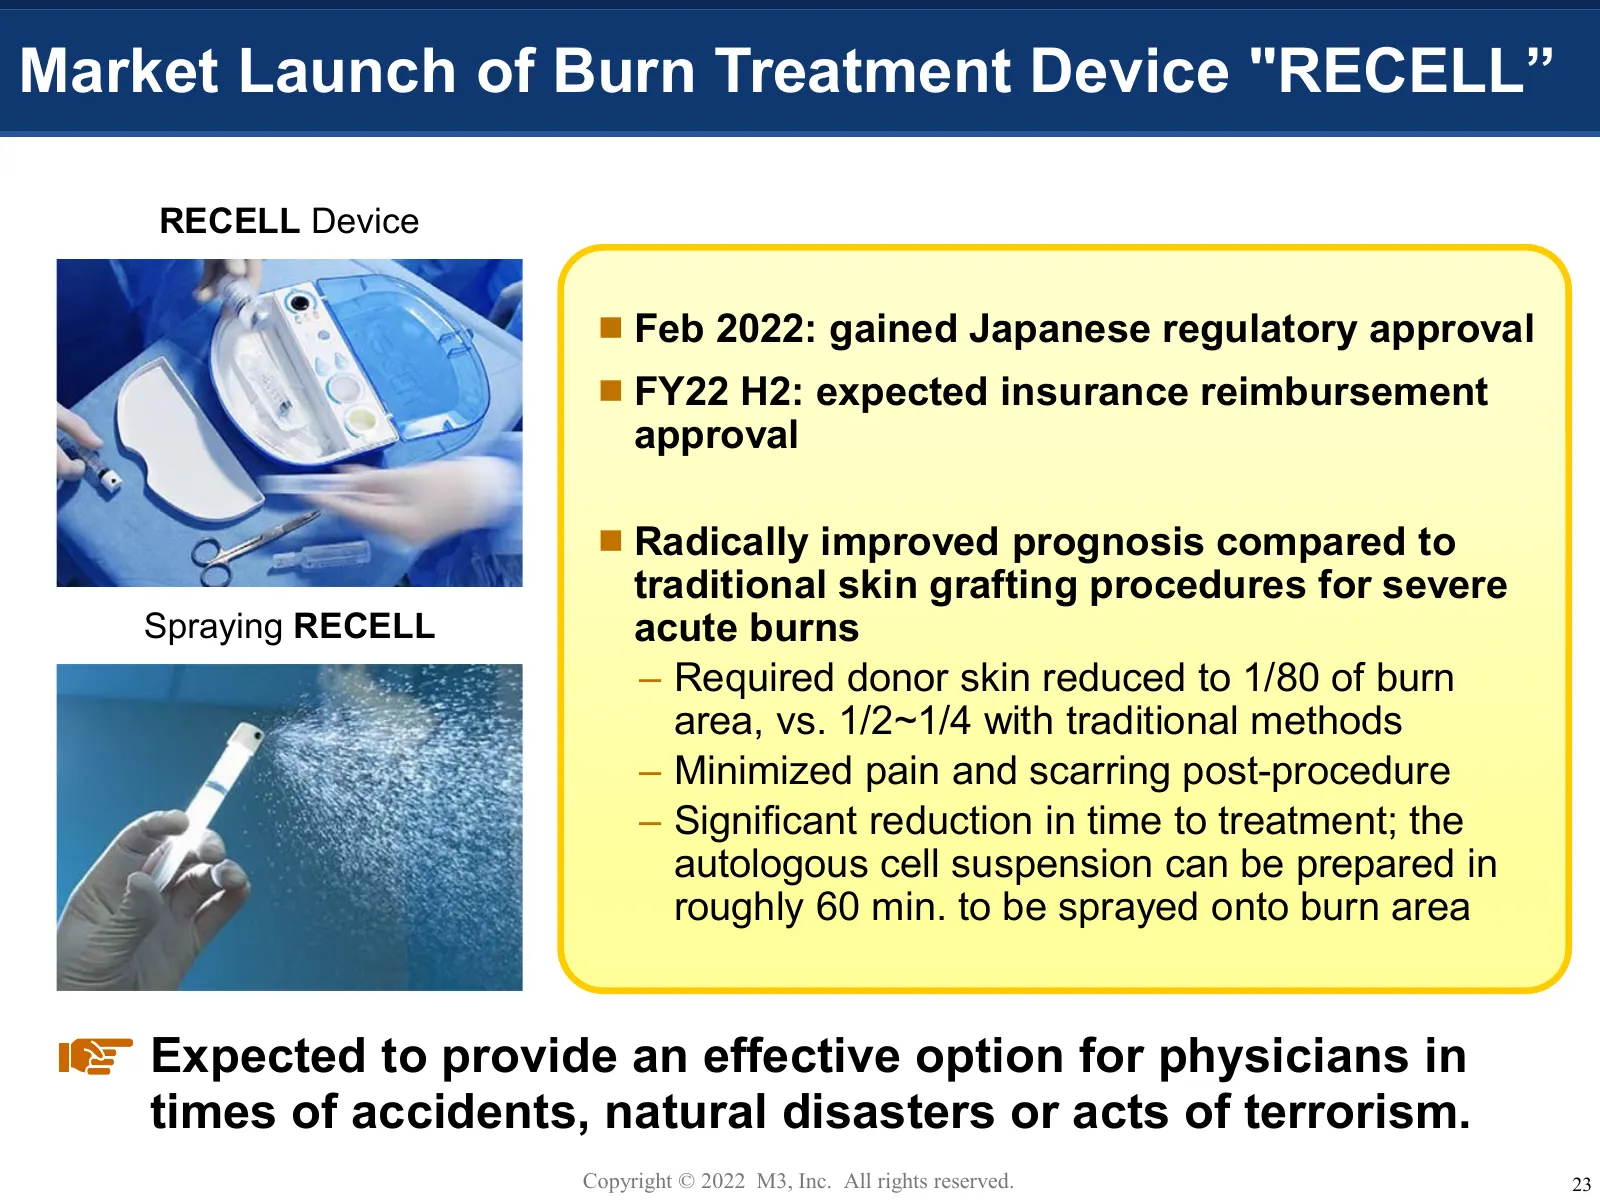
Market Launch of Burn Treatment Device "RECELL” RECELL Device Feb 2022: gained Japanese regulatory approval FY22 H2: expected insurance reimbursement approval Radically improved prognosis compared to traditional skin grafting procedures for severe Spraying RECELL acute burns – Required donor s
Slide 25: Business Scope Expansion and Growth Potential
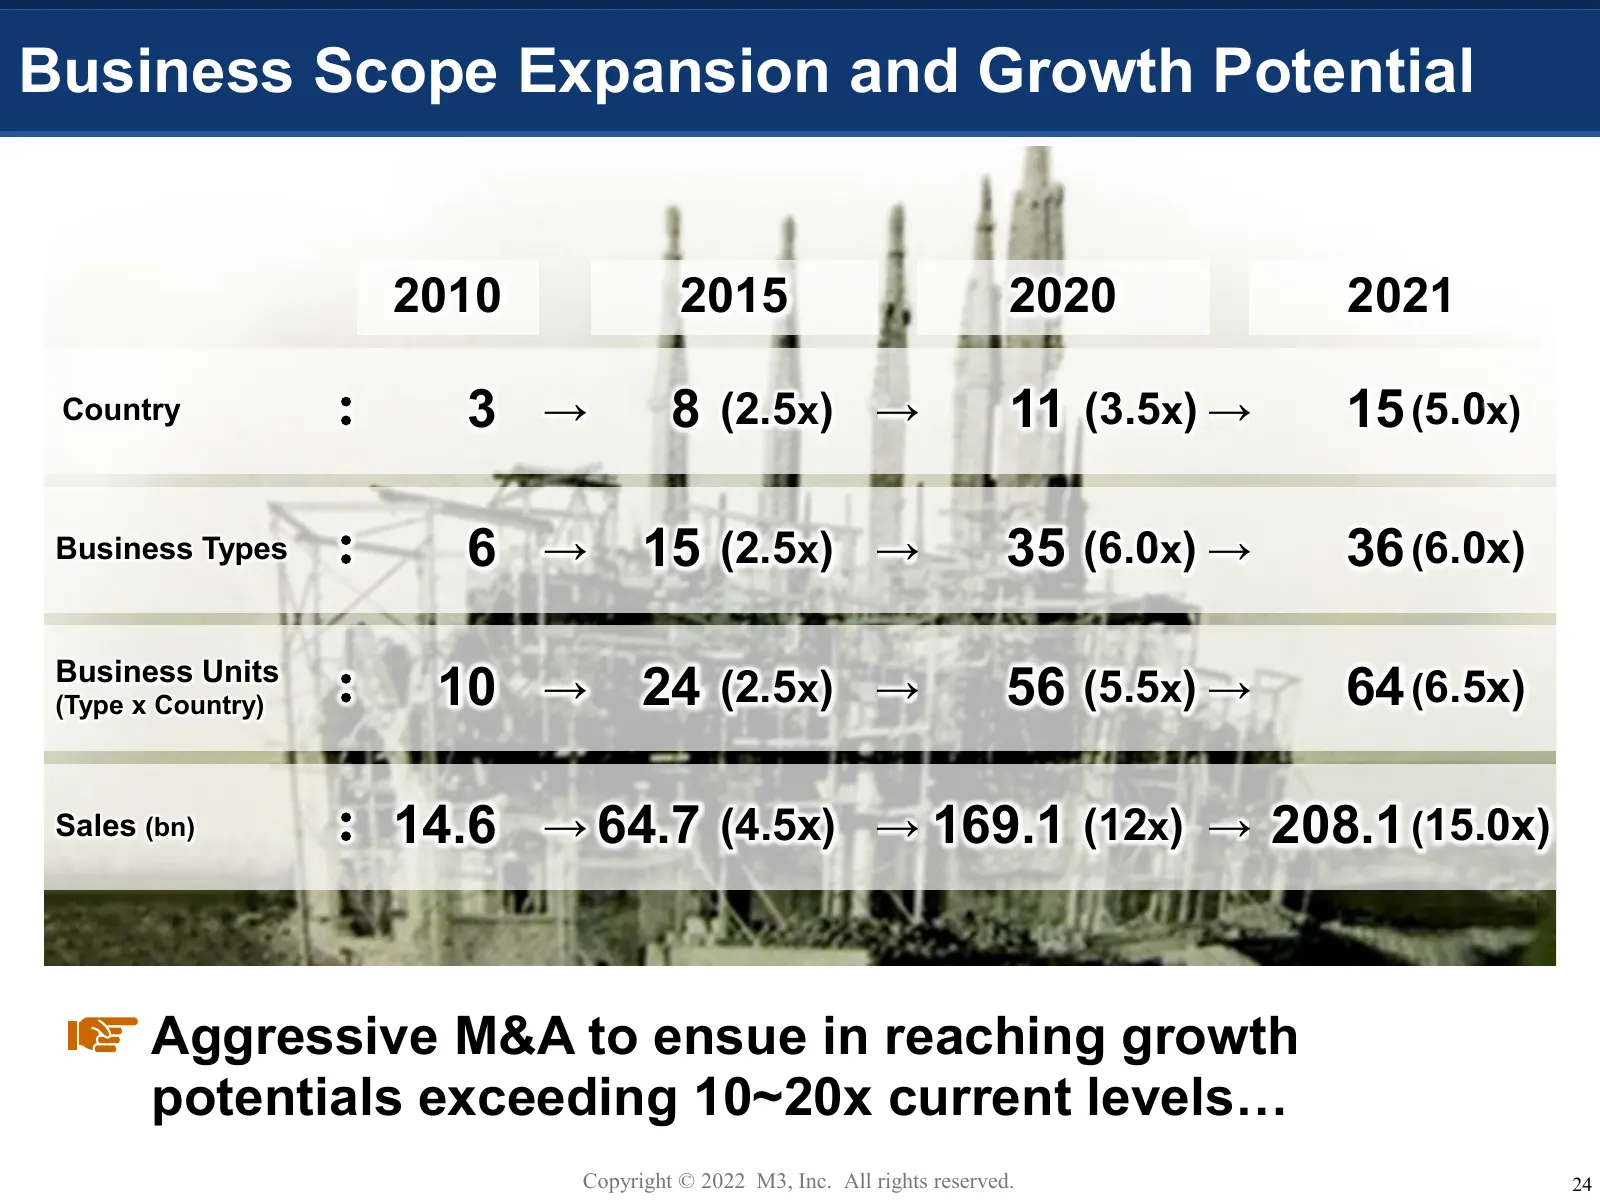
Business Scope Expansion and Growth Potential 2010 2015 2020 2021 Country : 3 → 8 (2.5x) → 11 (3.5x) → 15 (5.0x) Business Types : 6 → 15 (2.5x) → 35 (6.0x) → 36 (6.0x) Business Units (Type x Country) : 10 → 24 (2.5x) → 56 (5.5x) → 64 (6.5x) Sales (bn) : 14.6 → 64.7 (4.5x) → 169.1 (12x) → 208.1 (15.0
Slide 26: Growth Trend per Business Expansion Phases
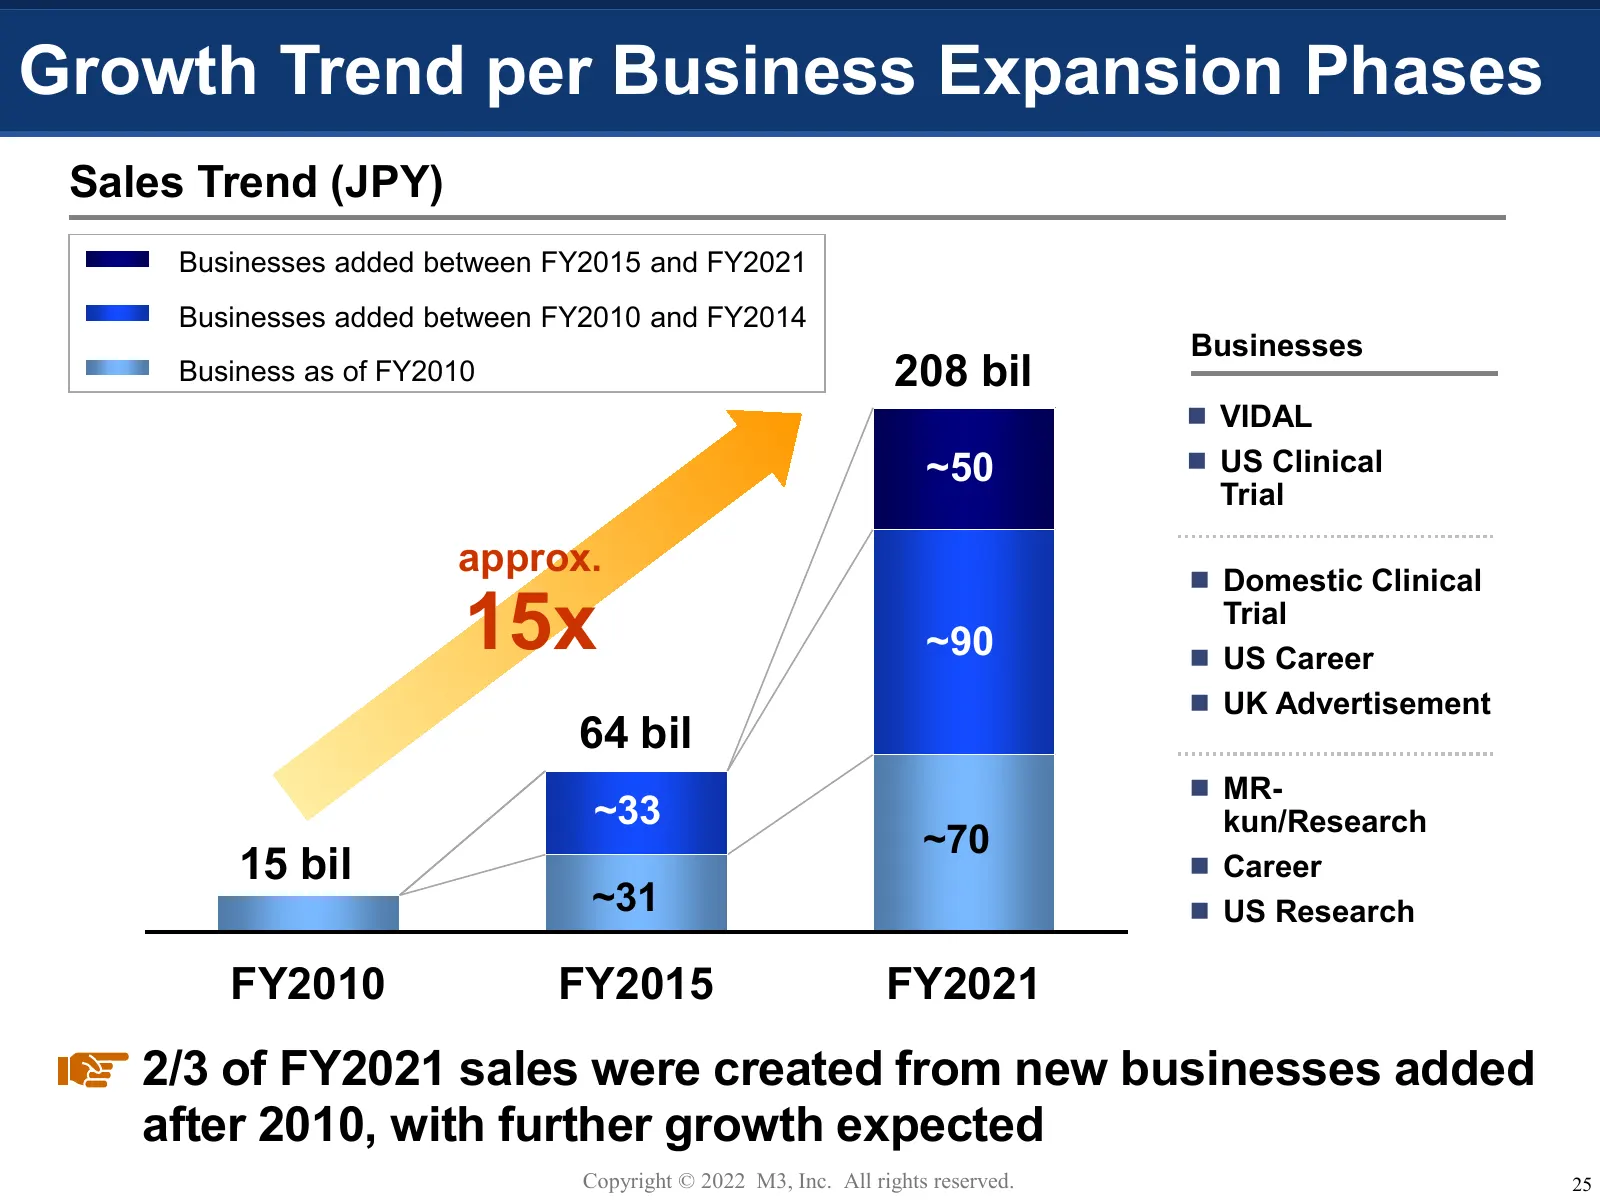
Growth Trend per Business Expansion Phases Sales Trend (JPY) Businesses added between FY2015 and FY2021 Businesses added between FY2010 and FY2014 Businesses Business as of FY2010 208 bil VIDAL ~50 US Clinical Trial approx. Domestic Clinical 15x ~90 Trial US Career UK Advertisement 64 bil
Slide 27: Increase in M&A
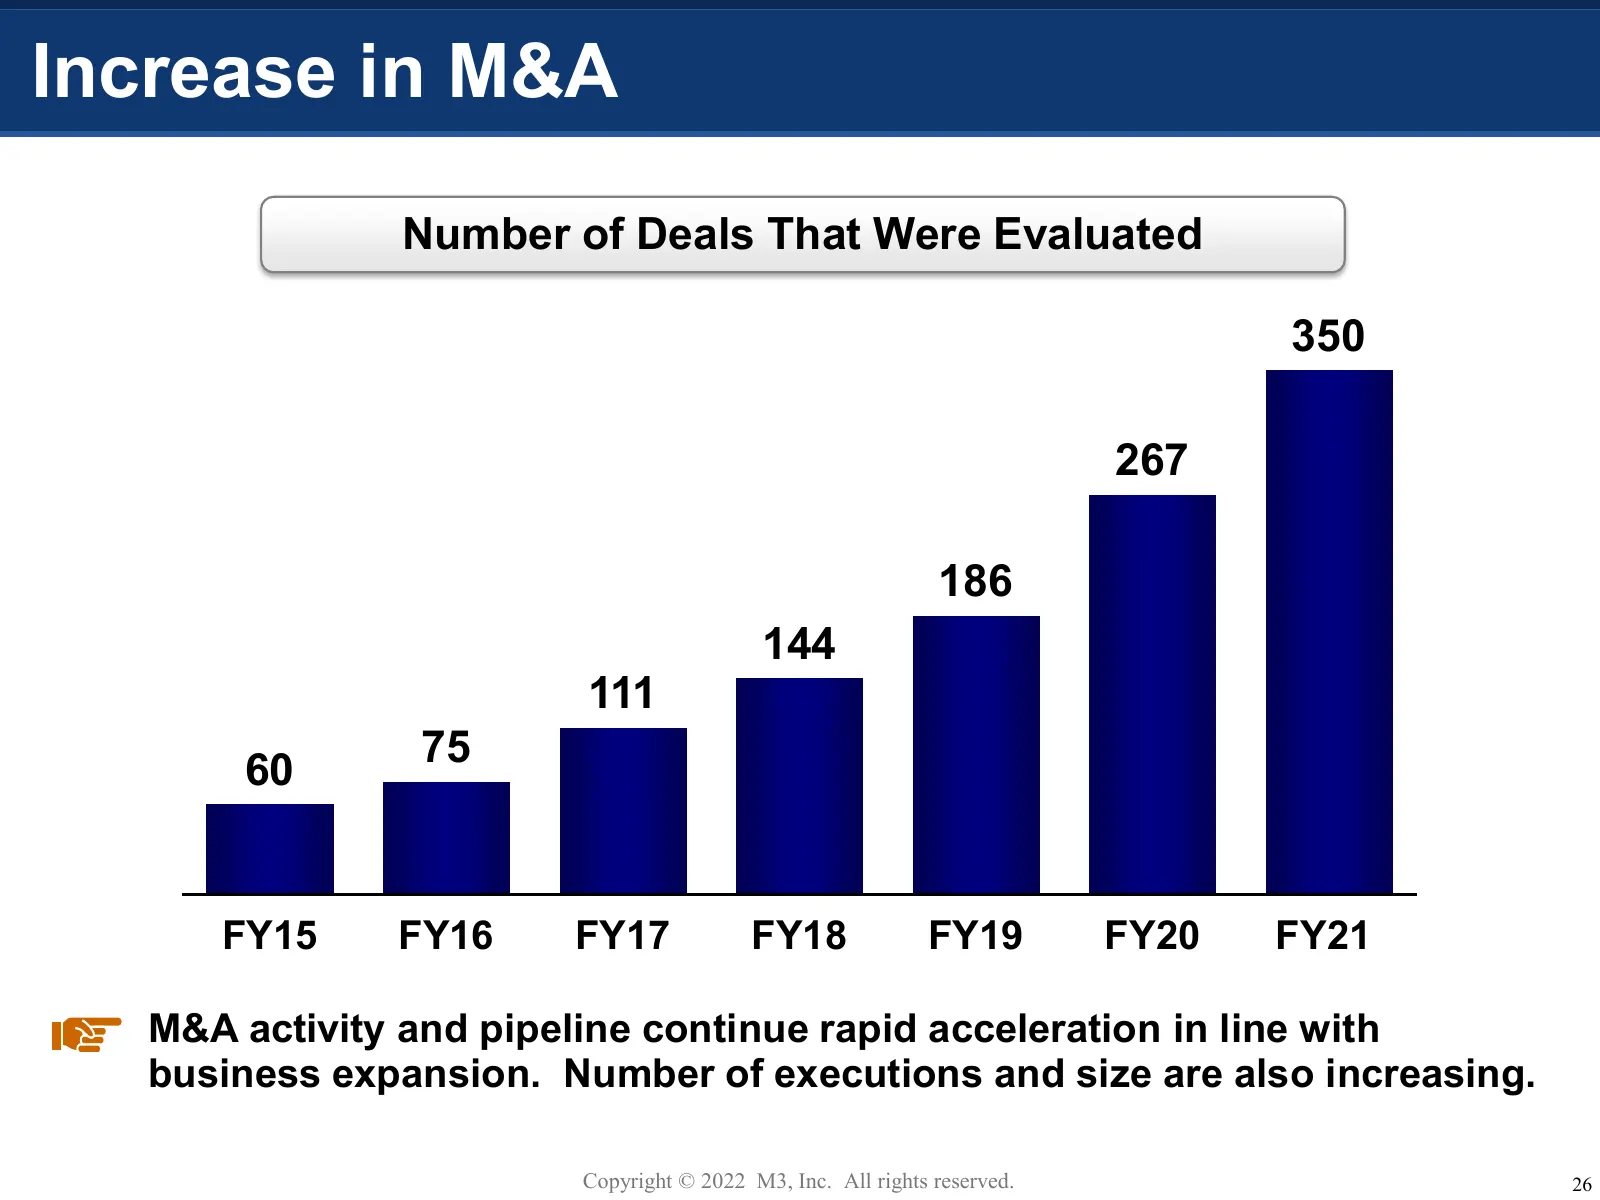
Increase in M&A Number of Deals That Were Evaluated 350 267 186 144 111 75 60 FY15 FY16 FY17 FY18 FY19 FY20 FY21 M&A activity and pipeline continue rapid acceleration in line with business expansion. Number of executions and size are also increasing. Copyright © 2022 M3, Inc. All rights reserved. 26
Slide 28: Growth Engine 3: Ecosystem Synergy Creation
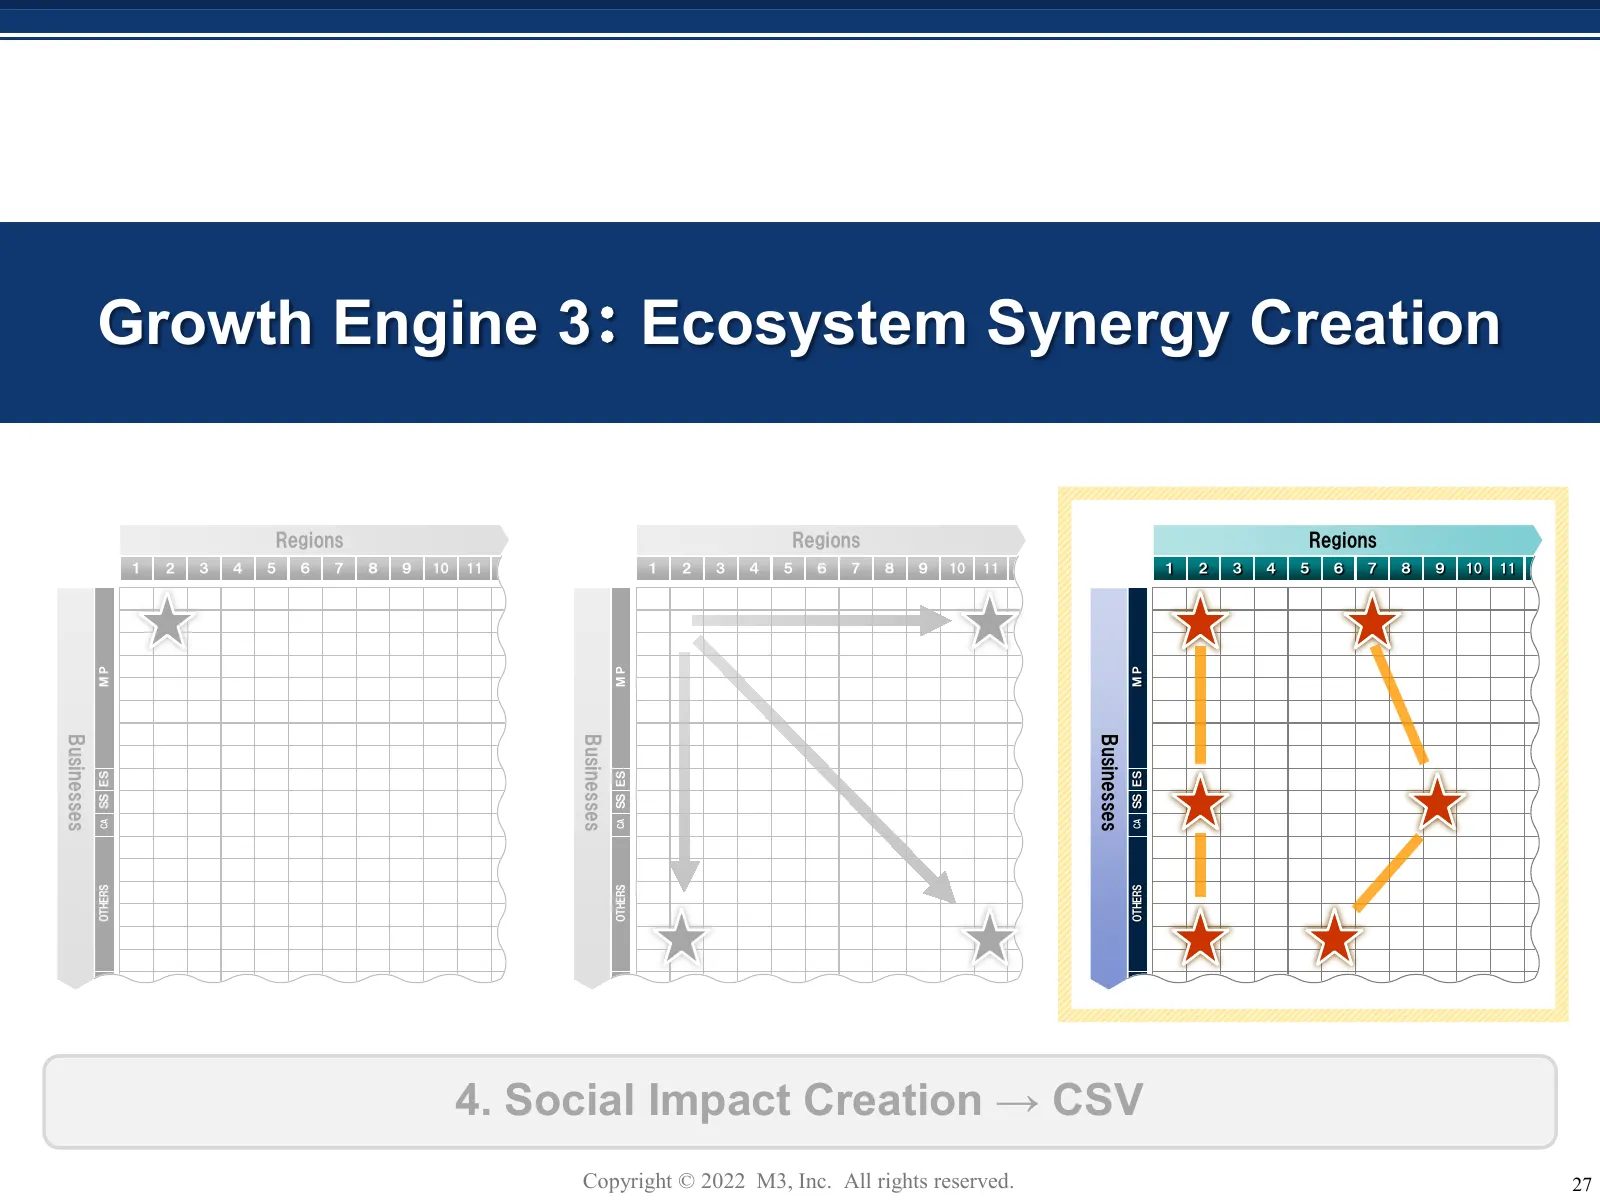
Growth Engine 3: Ecosystem Synergy Creation Regions Regions Regions 1 2 3 4 5 6 7 8 9 10 11 1 2 3 4 5 6 7 8 9 10 11 1 2 3 4 5 6 7 8 9 10 11 MP MP MP Businesses Businesses Businesses SS ES SS ES SS ES CA CA CA OTHERS OTHERS OTHERS 4. Social Impact Creation → CSV Copyright © 2022 M3, Inc. All rights r
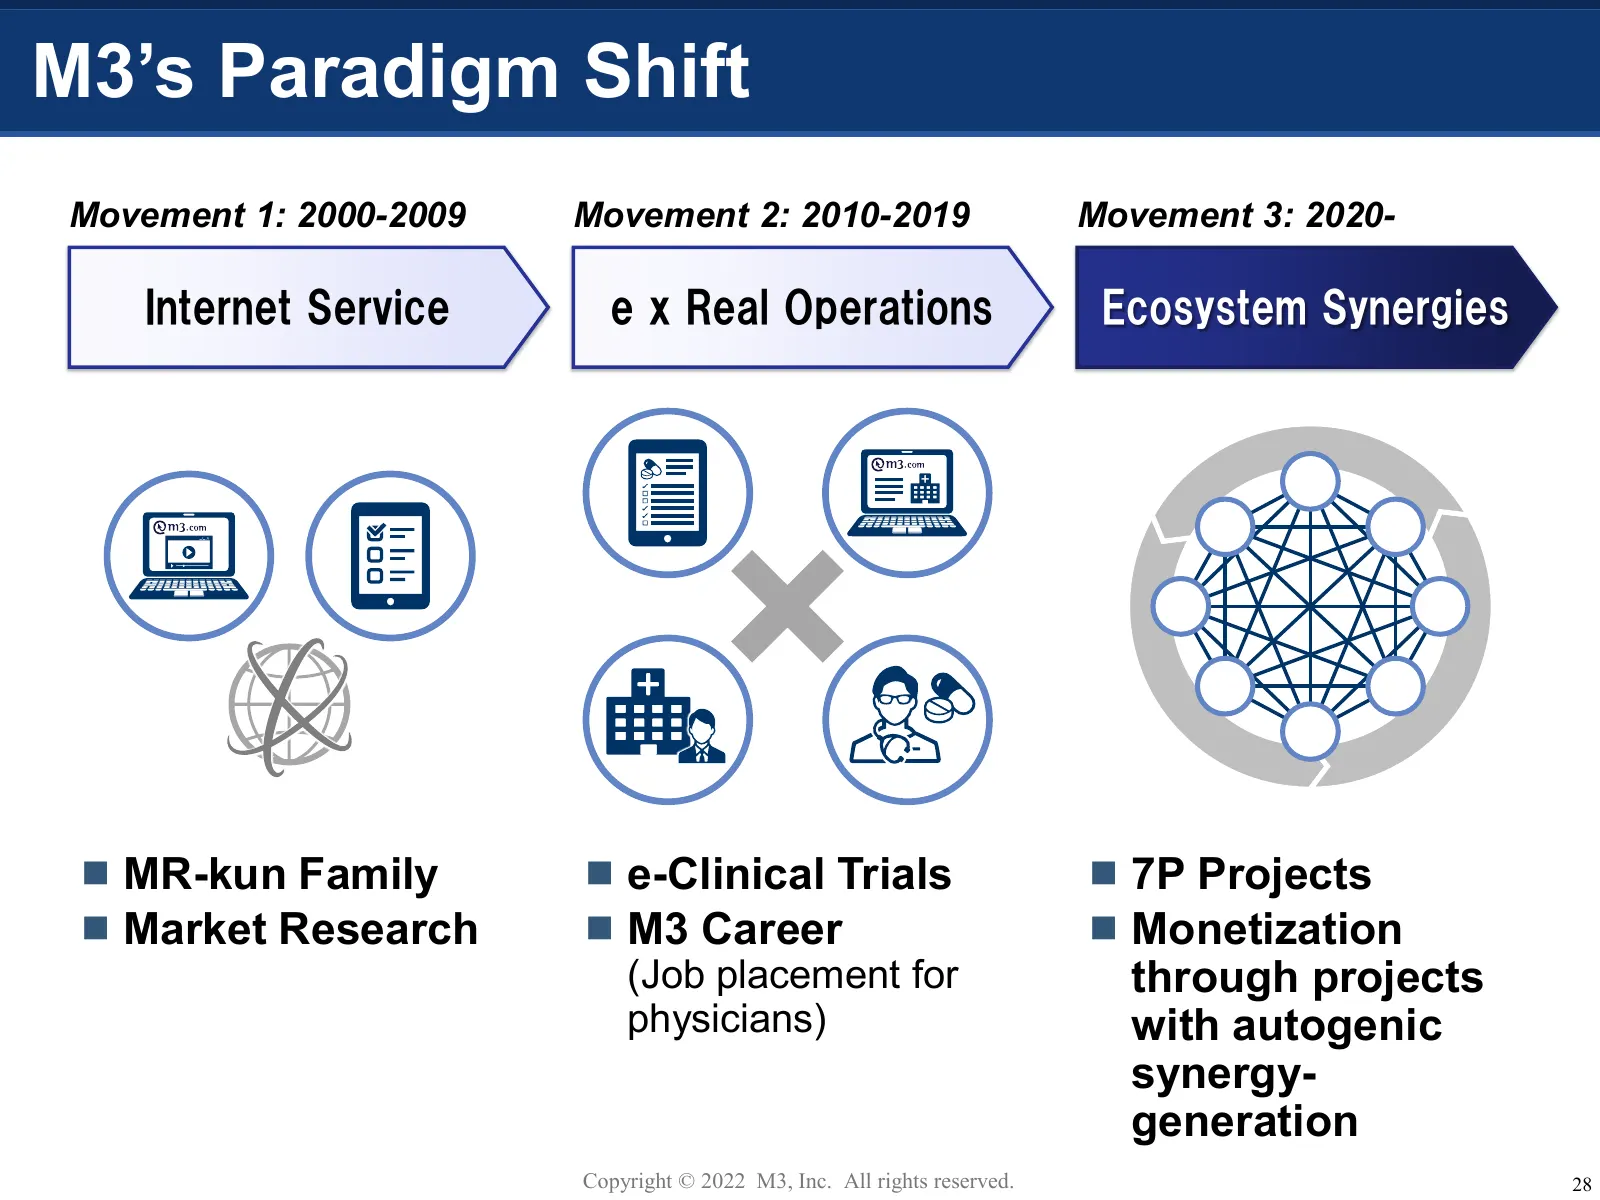
Slide 29: M3's Paradigm Shift
M3’s Paradigm Shift Movement 1: 2000-2009 Movement 2: 2010-2019 Movement 3: 2020- Internet Service e x Real Operations Ecosystem Synergies MR-kun Family e-Clinical Trials 7P Projects Market Research M3 Career Monetization (Job placement for through projects physicians) with autogenic syn
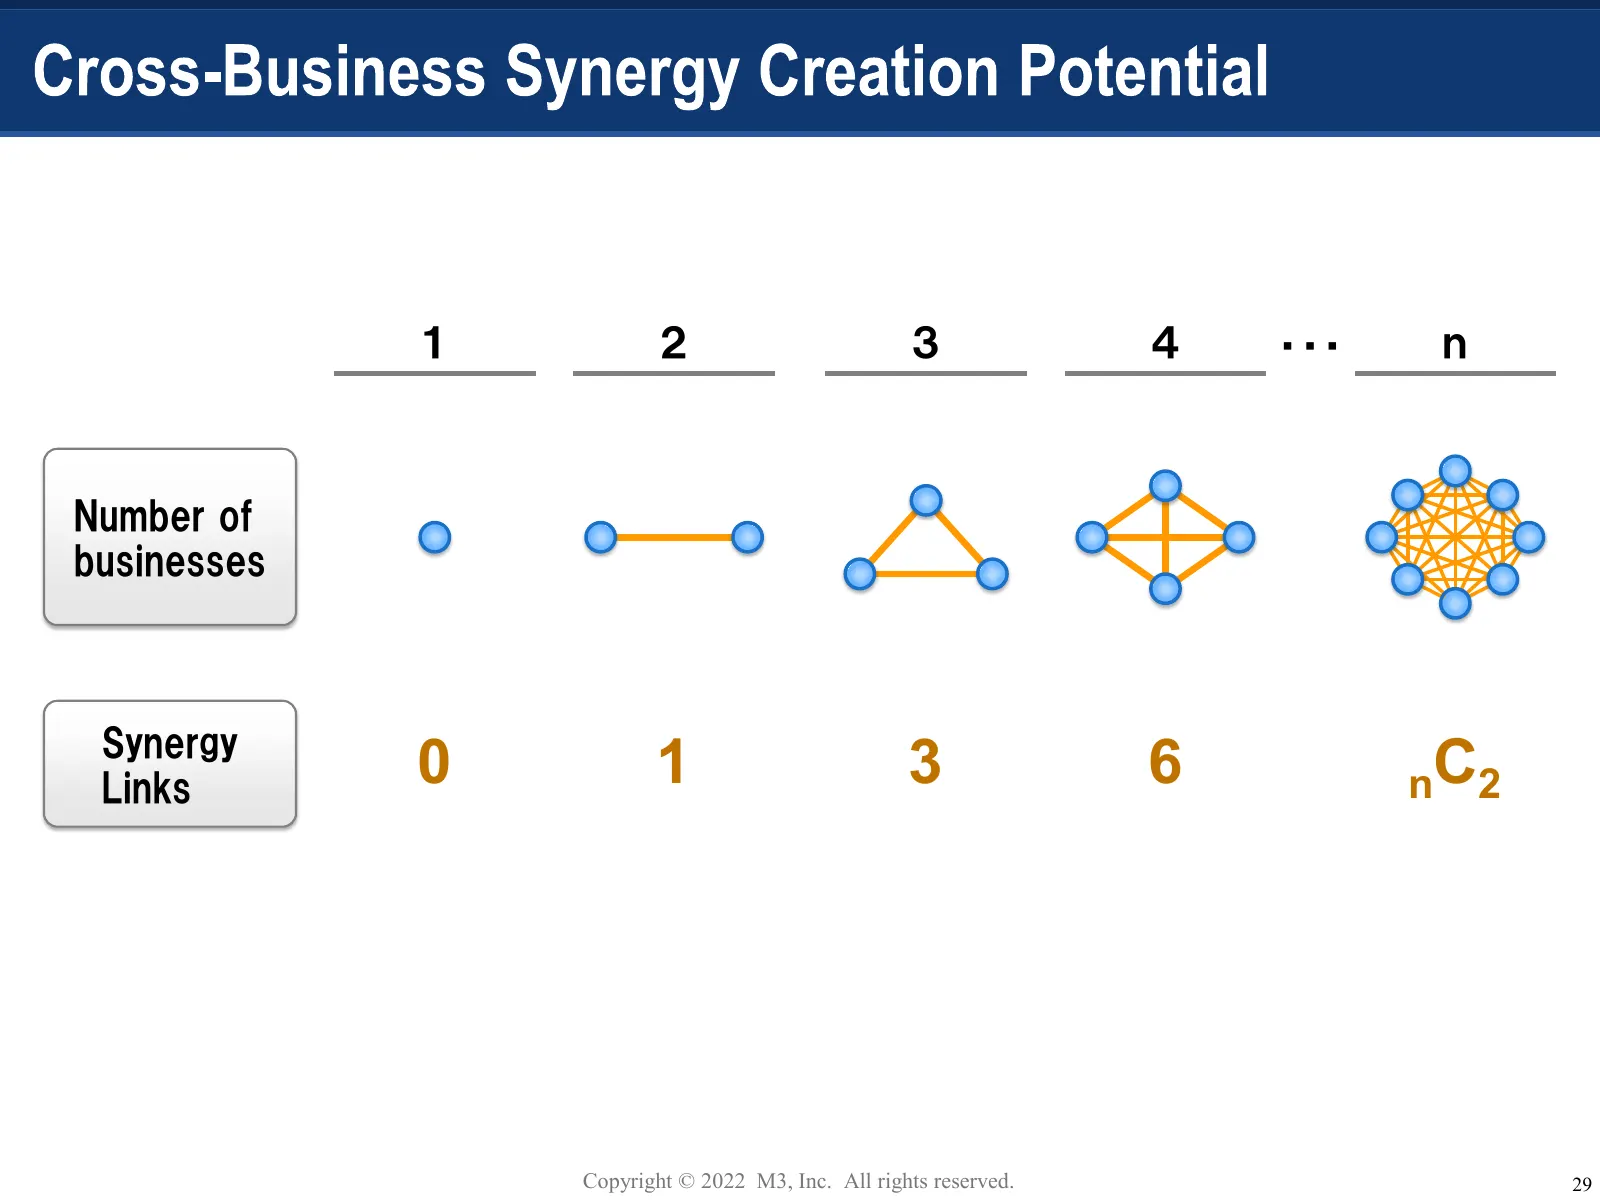
Slide 30: Number of businesses Synergy
1 2 3 4 ・・・ n Number of businesses Synergy Links 0 1 3 6 nC2 Copyright © 2022 M3, Inc. All rights reserved. 29
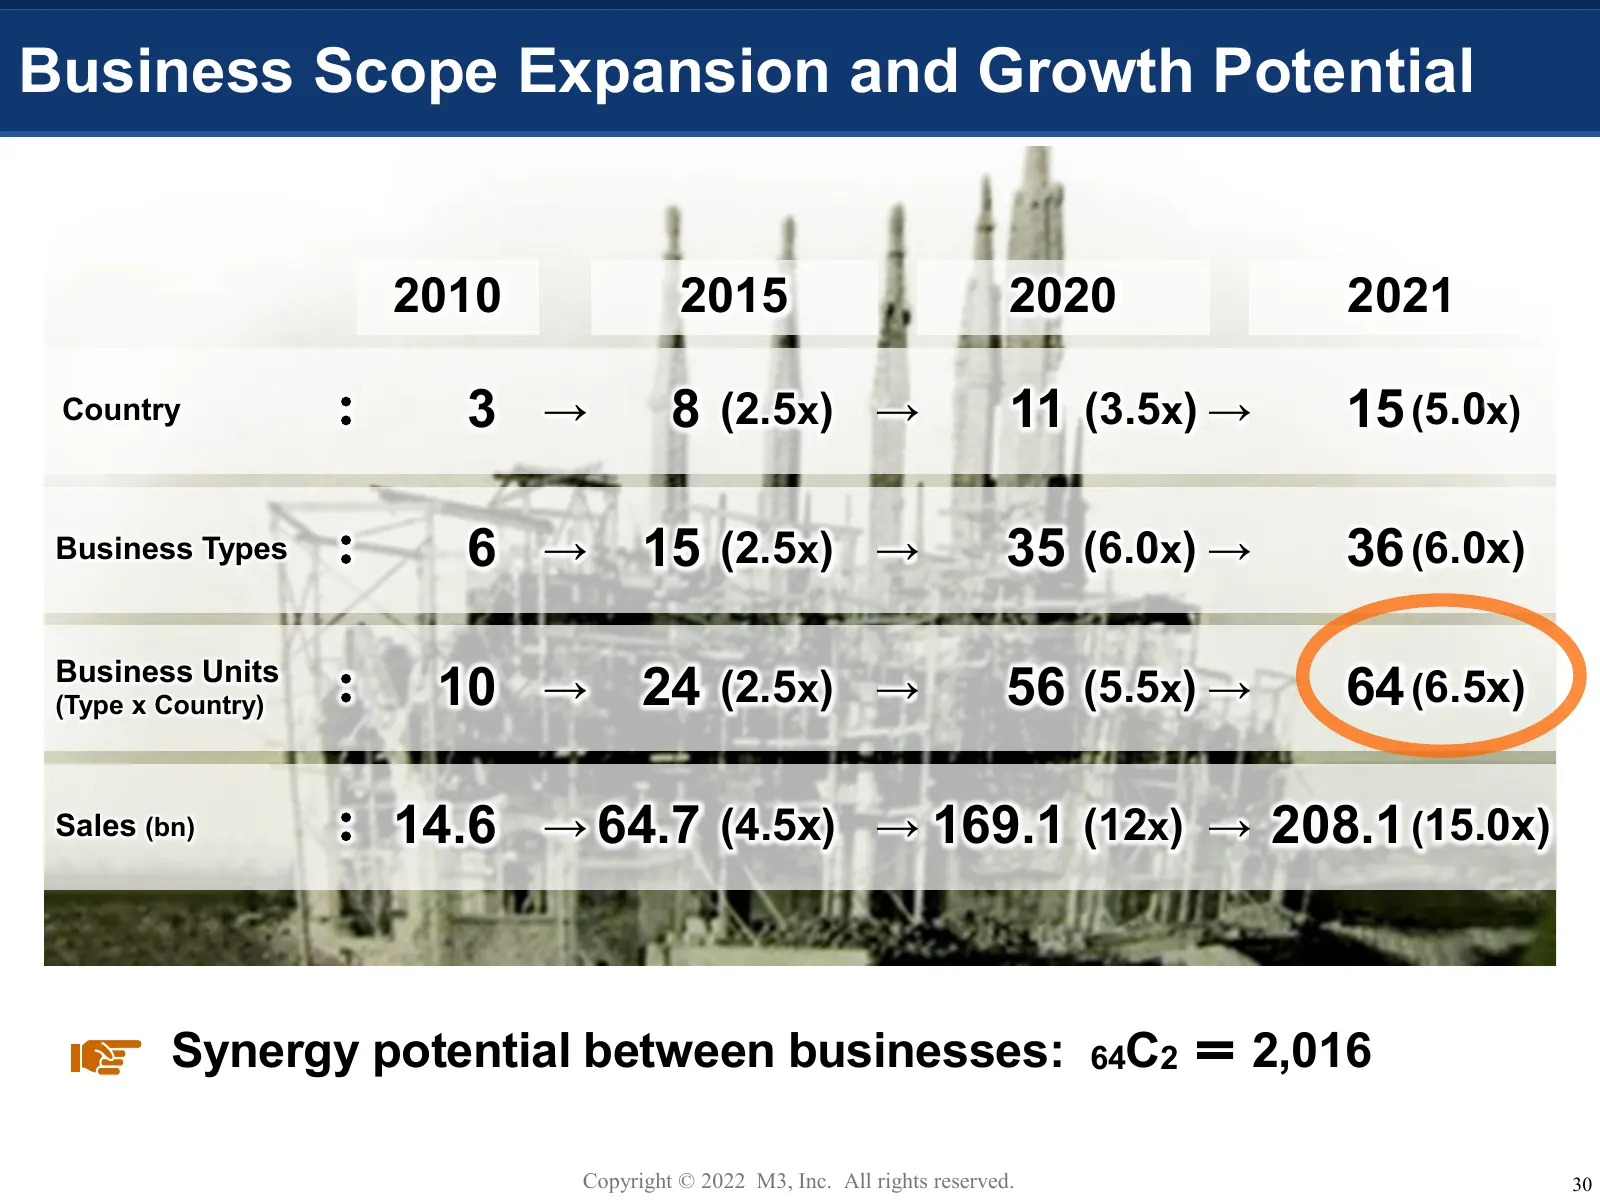
Slide 31: Business Scope Expansion and Growth Potential
Business Scope Expansion and Growth Potential 2010 2015 2020 2021 Country : 3 → 8 (2.5x) → 11 (3.5x) → 15 (5.0x) Business Types : 6 → 15 (2.5x) → 35 (6.0x) → 36 (6.0x) Business Units (Type x Country) : 10 → 24 (2.5x) → 56 (5.5x) → 64 (6.5x) Sales (bn) : 14.6 → 64.7 (4.5x) → 169.1 (12x) → 208.1 (15.0
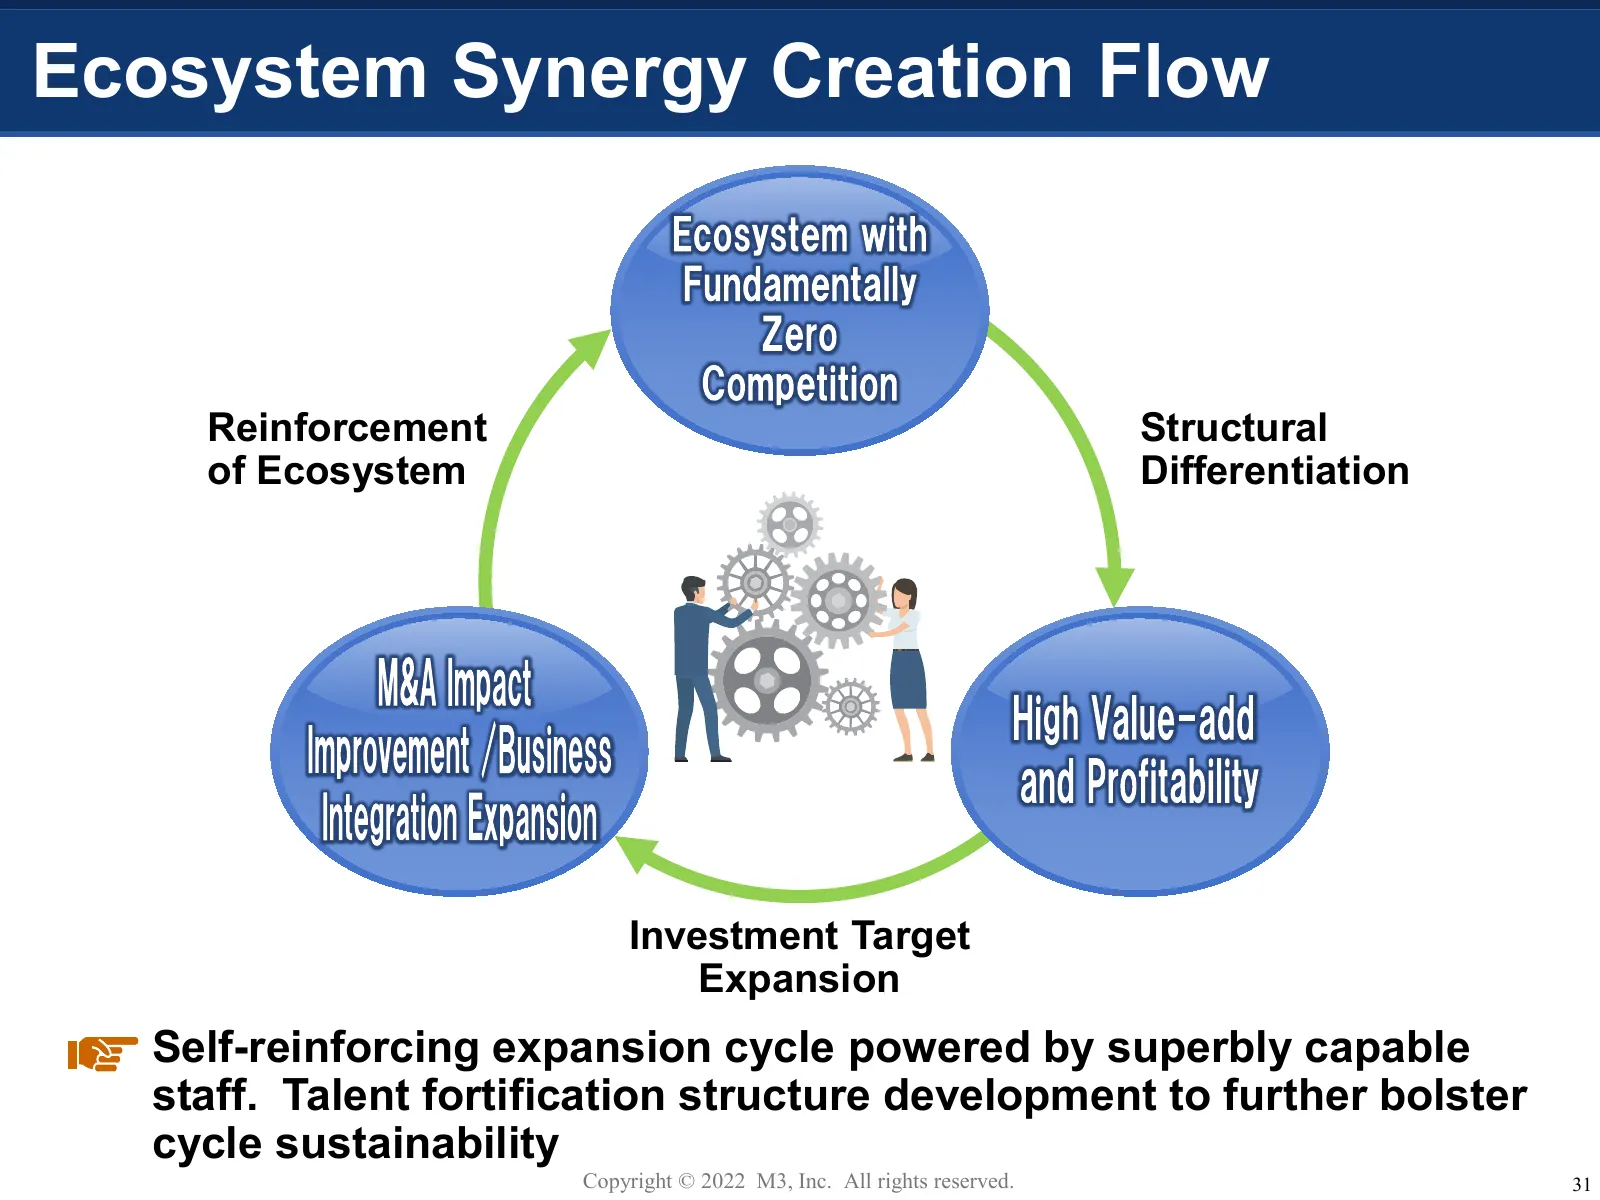
Slide 32: Ecosystem Synergy Creation Flow
Ecosystem Synergy Creation Flow Reinforcement Structural of Ecosystem Differentiation Investment Target Expansion Self-reinforcing expansion cycle powered by superbly capable staff. Talent fortification structure development to further bolster cycle sustainability Copyright © 2022 M3, Inc. All right
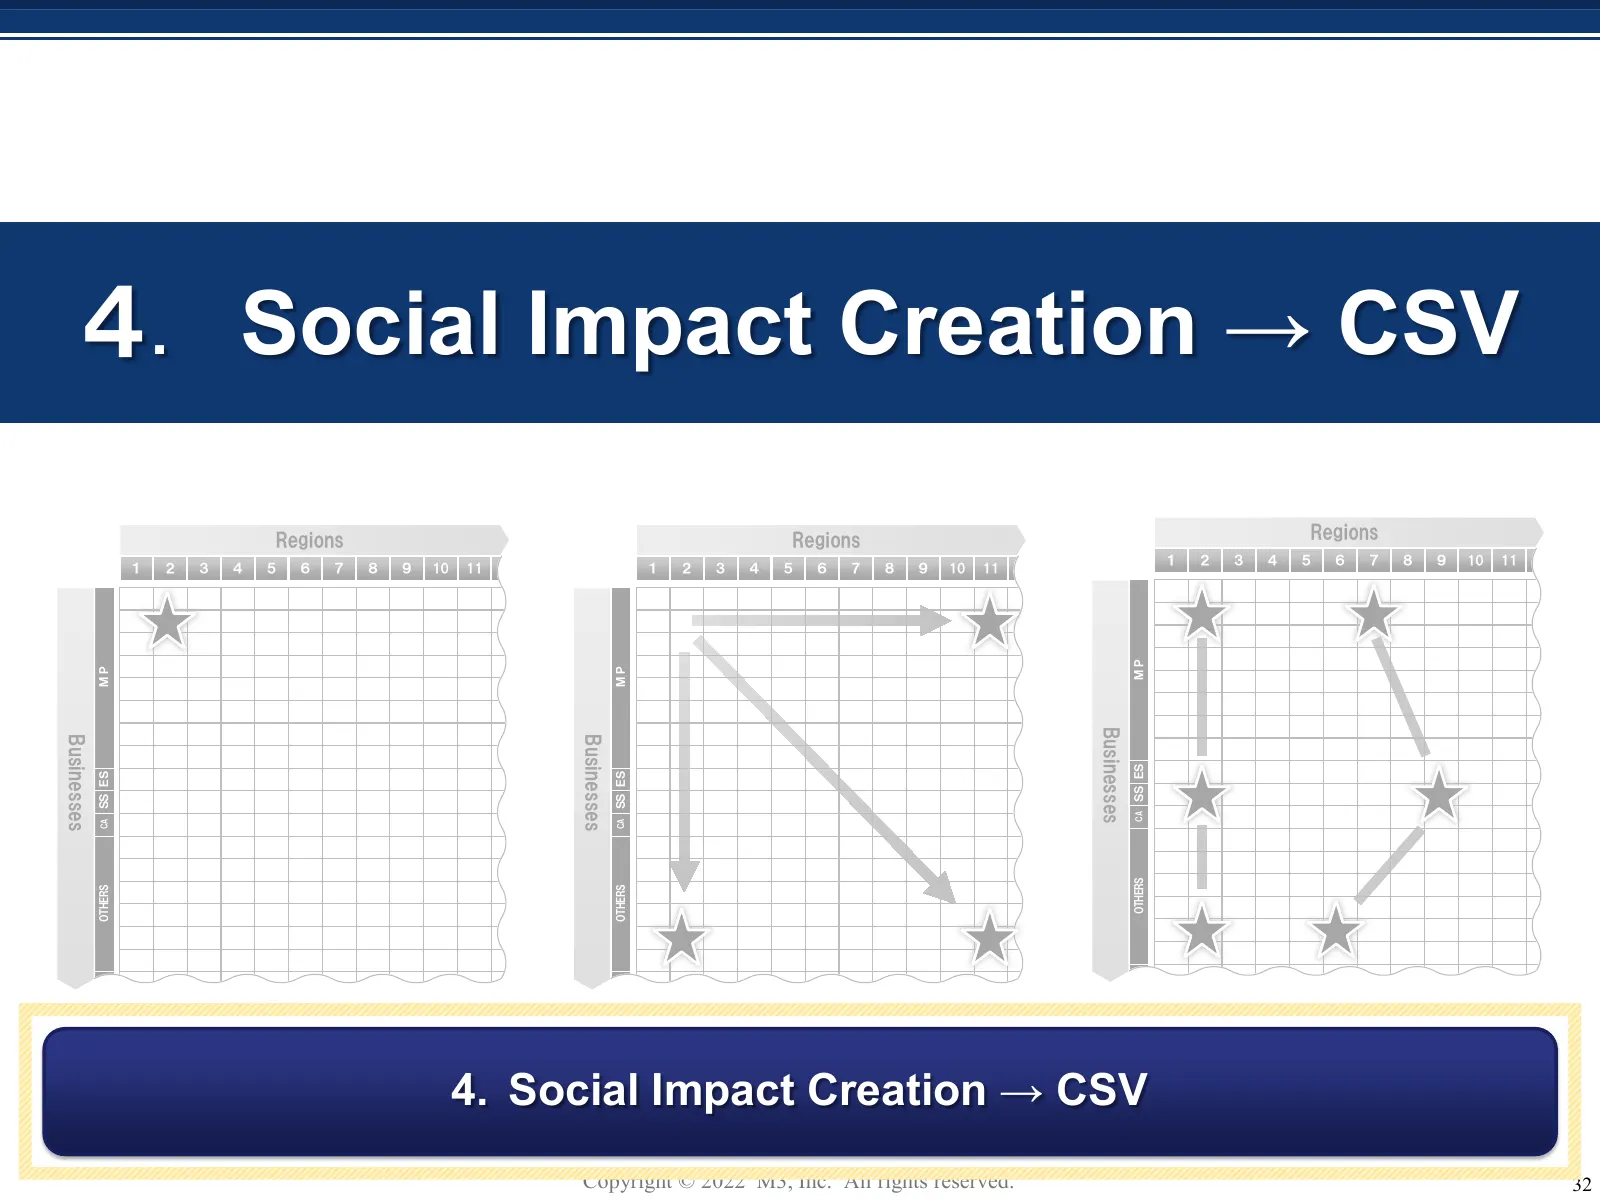
Slide 33: 4. Social Impact Creation → CSV
4. Social Impact Creation → CSV Regions Regions Regions 1 2 3 4 5 6 7 8 9 10 11 1 2 3 4 5 6 7 8 9 10 11 1 2 3 4 5 6 7 8 9 10 11 MP MP MP Businesses Businesses Businesses SS ES SS ES SS ES CA CA CA OTHERS OTHERS OTHERS 4. Social Impact Creation → CSV Copyright © 2022 M3, Inc. All rights reserved. 32
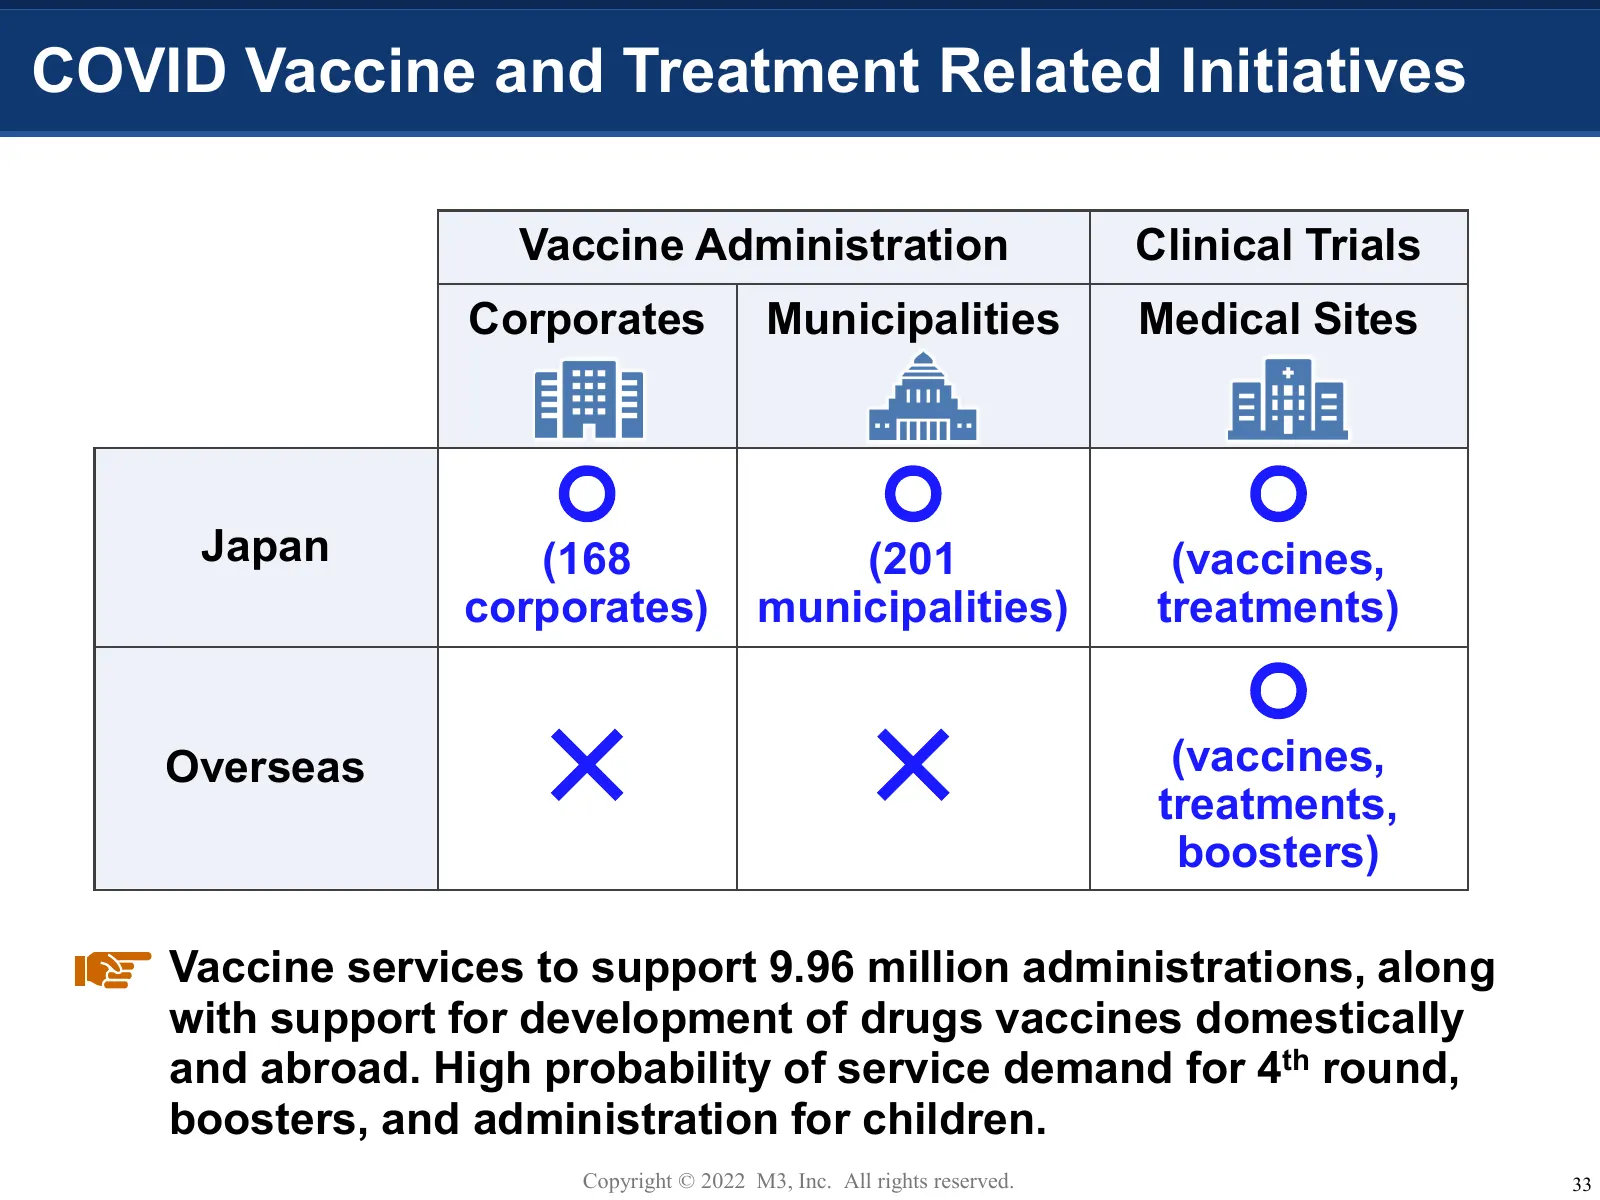
Slide 34: COVID Vaccine and Treatment Related Initiatives
COVID Vaccine and Treatment Related Initiatives Vaccine Administration Clinical Trials Corporates Municipalities Medical Sites 〇 〇 〇 Japan (168 (201 (vaccines, corporates) municipalities) treatments) 〇 Overseas ✕ ✕ (vaccines, treatments, boosters) Vaccine services to support 9.96 million administrat
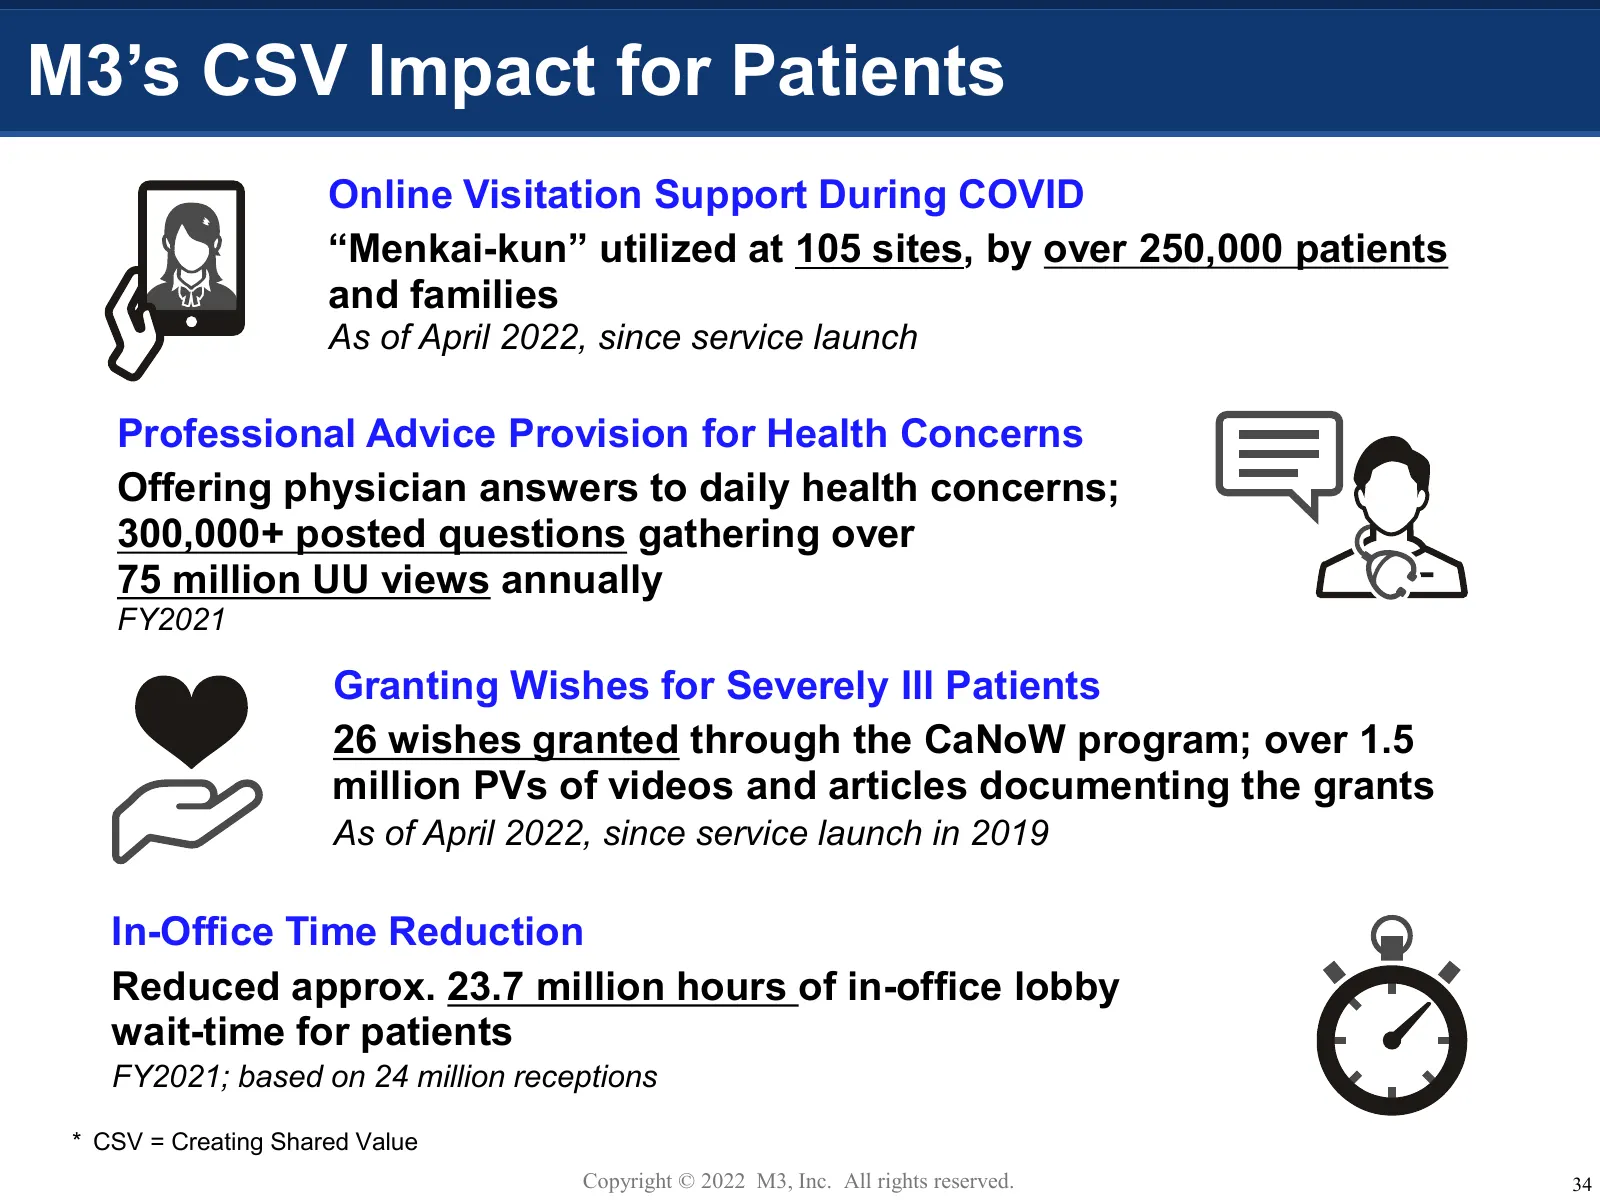
Slide 35: M3's CSV Impact for Patients
M3’s CSV Impact for Patients Online Visitation Support During COVID “Menkai-kun” utilized at 105 sites, by over 250,000 patients and families As of April 2022, since service launch Professional Advice Provision for Health Concerns Offering physician answers to daily health concerns; 300,000+ posted
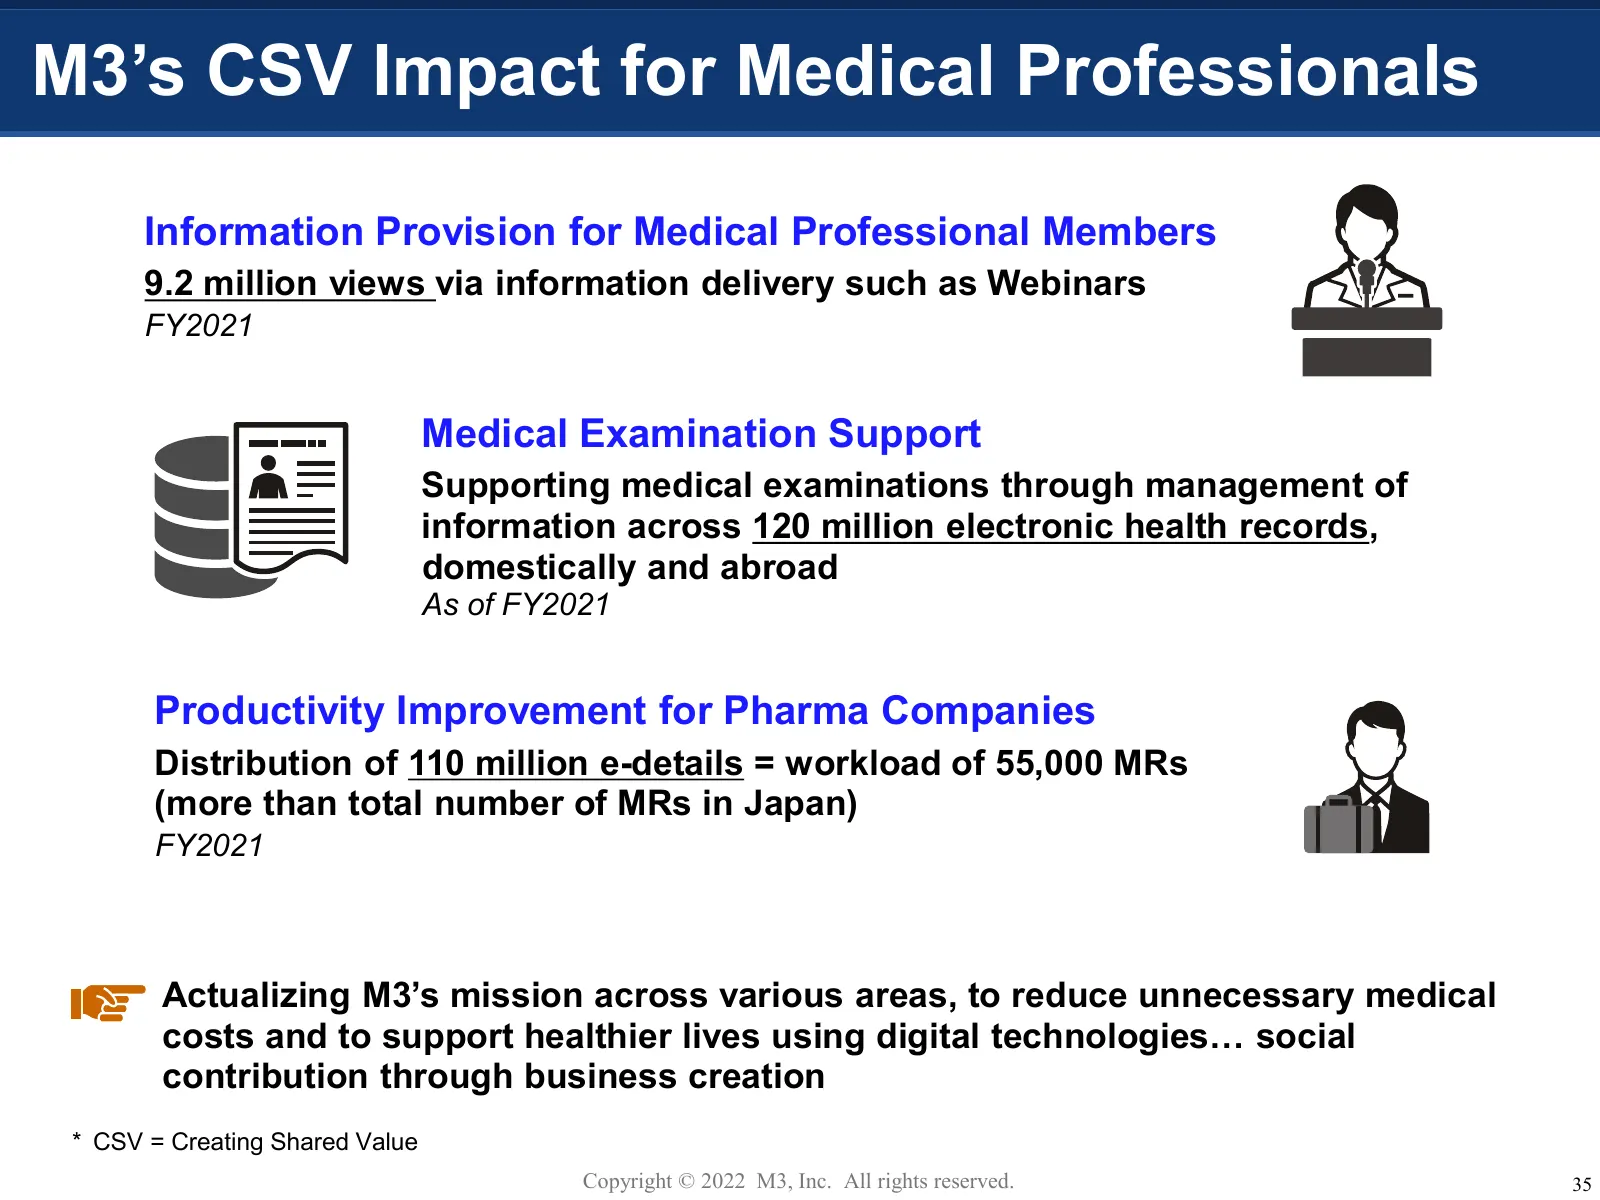
Slide 36: M3's CSV Impact for Medical Professionals
M3’s CSV Impact for Medical Professionals Information Provision for Medical Professional Members 9.2 million views via information delivery such as Webinars FY2021 Medical Examination Support Supporting medical examinations through management of information across 120 million electronic health recor
Slide 37: FY2022 Outlook
FY2022 Outlook Copyright © 2022 M3, Inc. All rights reserved. 36
Slide 38: FY2022 Qualitative Outlook
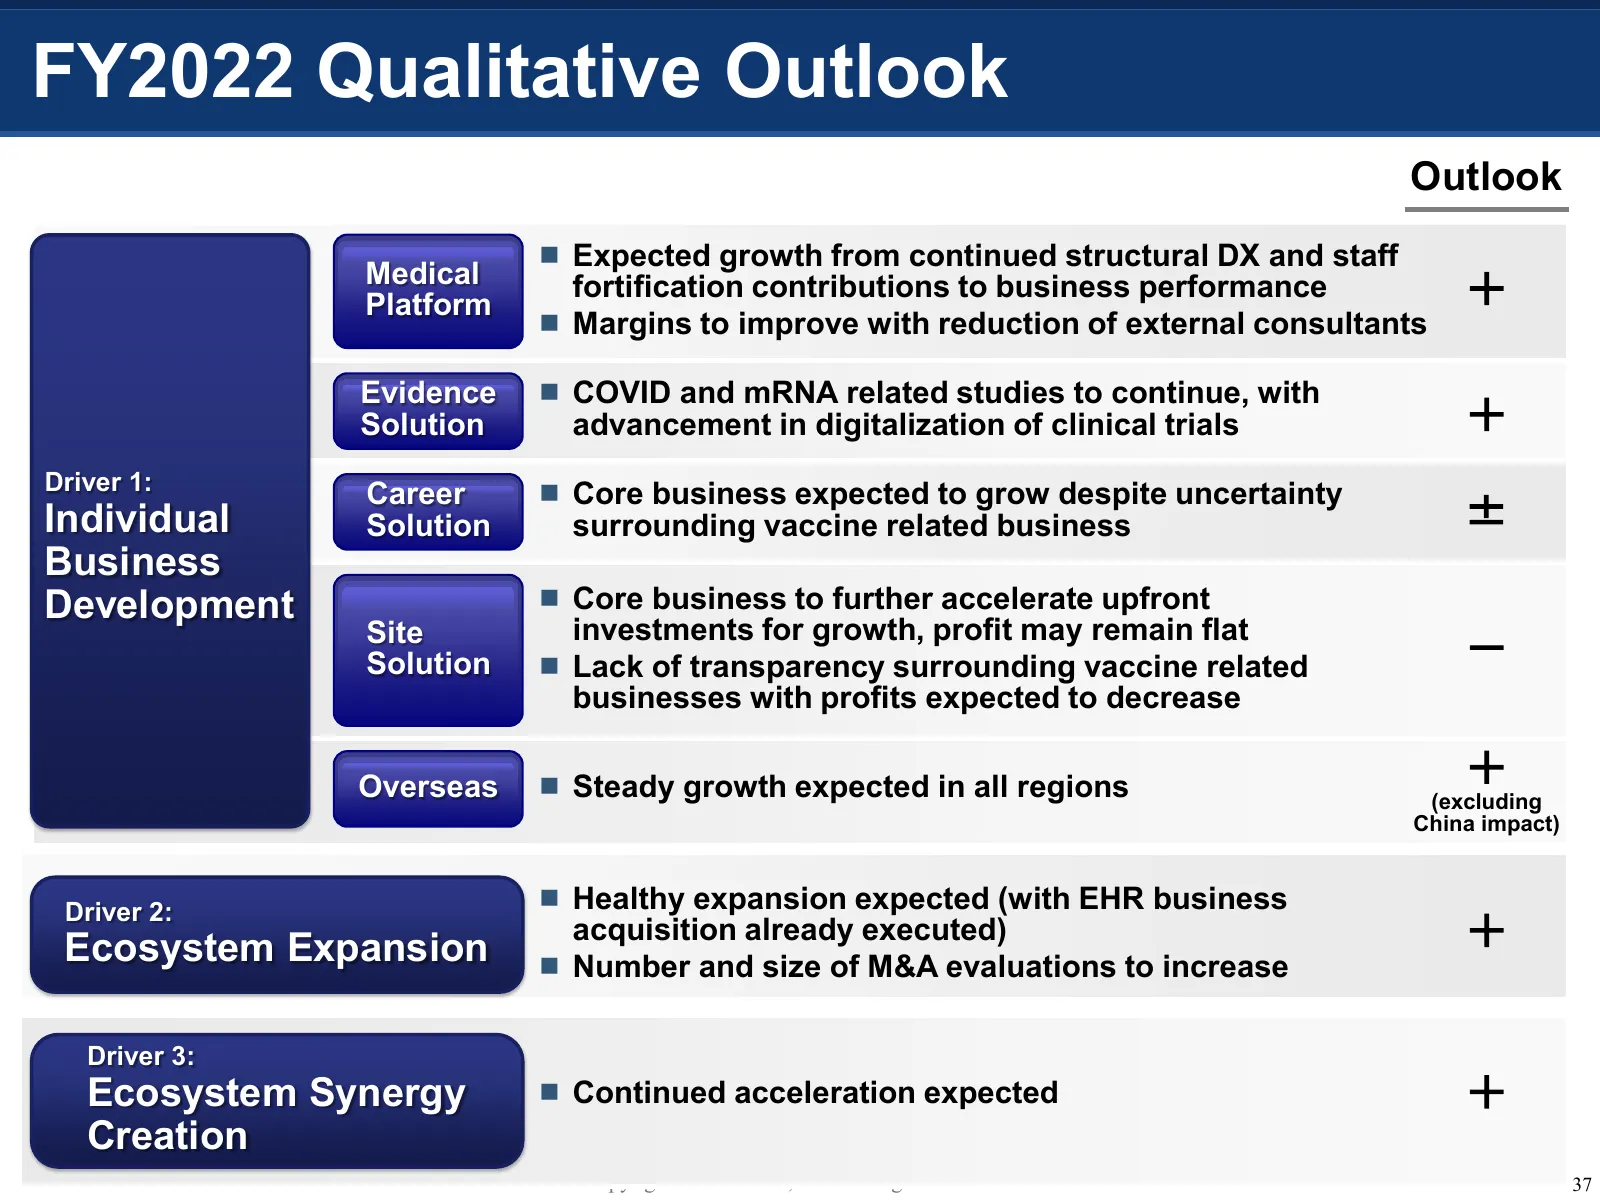
FY2022 Qualitative Outlook Outlook Expected growth from continued structural DX and staff Medical fortification contributions to business performance Platform + Margins to improve with reduction of external consultants Evidence COVID and mRNA related studies to continue, with Solution advancem
Slide 39: Annual Results
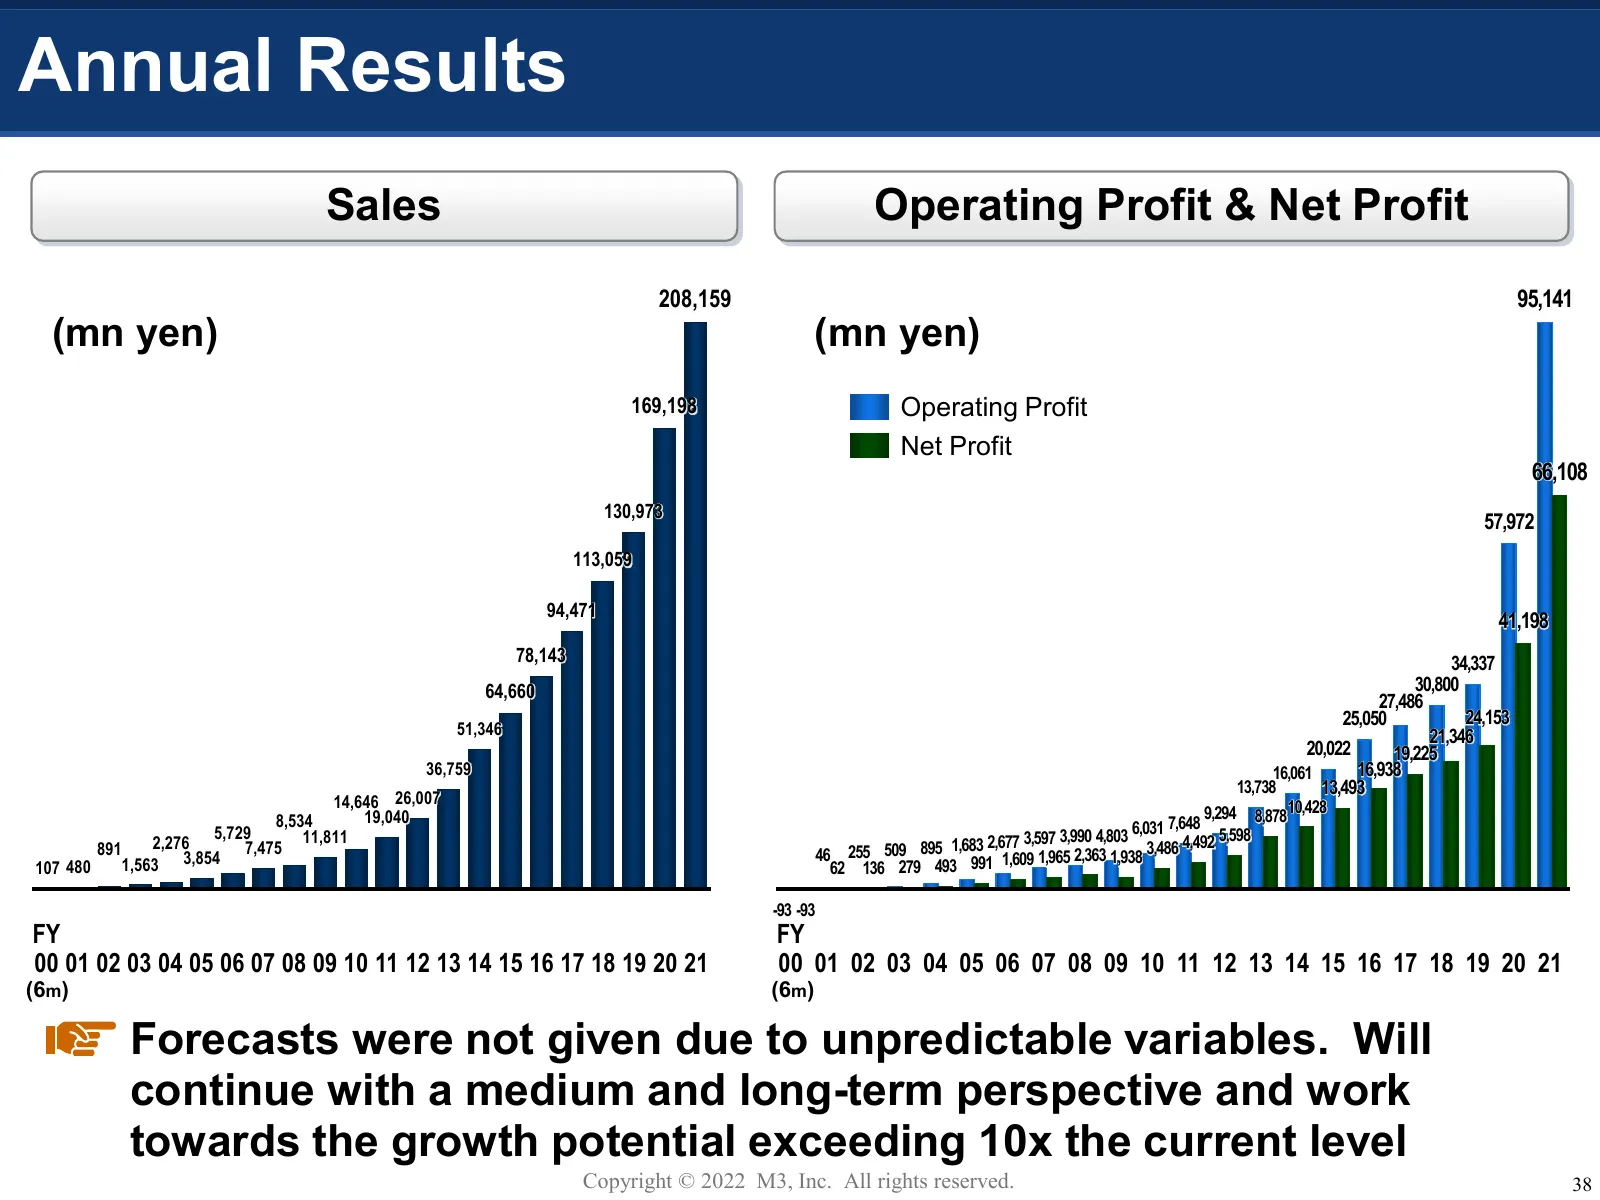
Annual Results Sales Operating Profit & Net Profit 208,159 95,141 (mn yen) (mn yen) 169,198 Operating Profit Net Profit 66,108 130,973 57,972 113,059 94,471 41,198 78,143 34,337 64,660 30,800 27,486 25,050 24,153 51,346 21,346 20,022 19,225 36,759 16,061 16,938 13,738 13,493 14,646 26,007 8,534 19,0
Source: Internet Archive copy of corporate.m3.com
More decks from M3, Inc.
 Investor Presentation (November 2026)8 slides · Nov 20, 2026
 H1 FY2026 Earnings Presentation44 slides · Nov 4, 2026
 Q2 FY2026 Earnings Presentation44 slides · Nov 4, 2026
 Q1 FY2026 Earnings Presentation42 slides · Aug 6, 2026
 Merger or Acquisition (June 2026)14 slides · Jun 5, 2026
 FY2025 Earnings Presentation54 slides · May 1, 2026