Superior Drilling Products Inc
Superior Drilling Products — FY2017 Earnings Presentation
19 slides from Superior Drilling Products's earnings presentation, Mar 8, 2018
Slide 1: Fourth Quarter and Full Year 2017 Financial Results Conference Call
Fourth Quarter and Full Year 2017 Financial Results Conference Call March 8, 2018 NYSE American: SDPI © 2018 Superior Drilling Products
Slide 2: Safe Harbor Statement
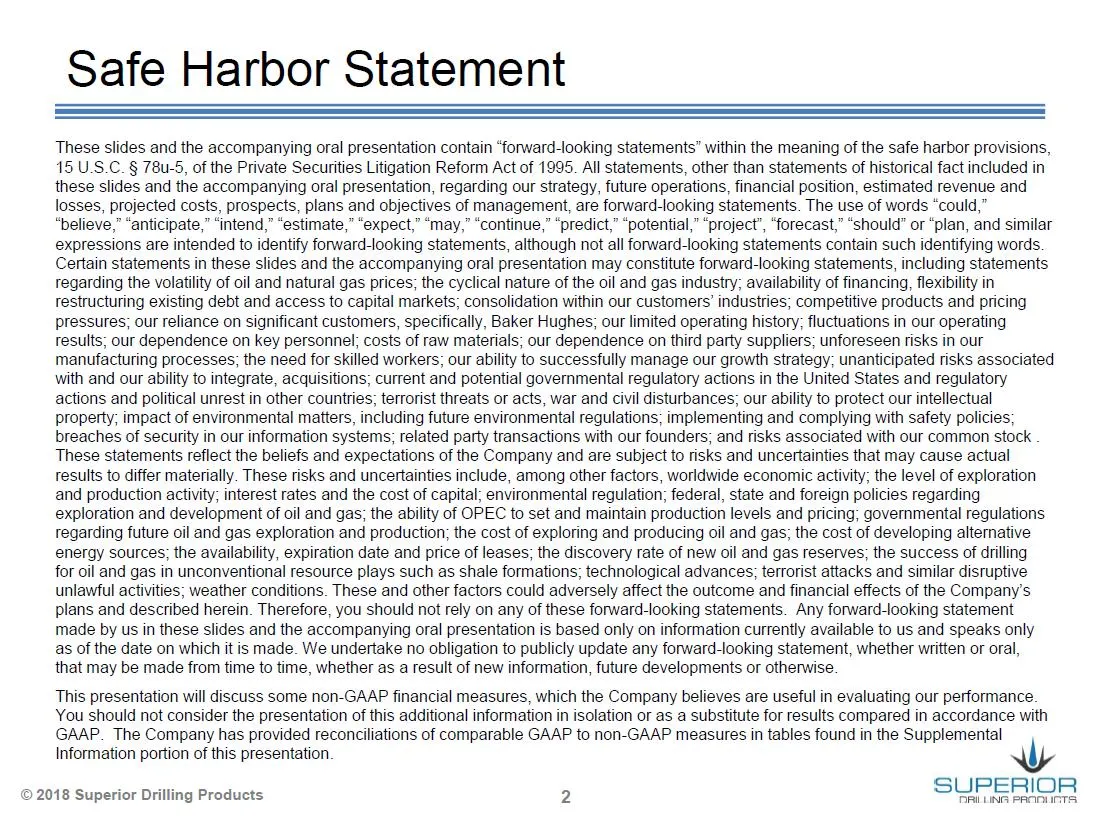
Safe Harbor Statement These slides and the accompanying oral presentation contain “forward-looking statements’ within the meaning of the safe harbor provisions, 15 U.S.C. § 78u-5, of the Private Securities Litigation Reform Act of 1995. Alll statements, other than statements of historical fact inclu
Slide 3: Troy Meier, Chairman and Chief Executive Officer
DRILRING PRODUCTS Troy Meier Chairman and Chief Executive Officer 18 Superior Drilling Products
Slide 4: Q4 and 2017 Highlights
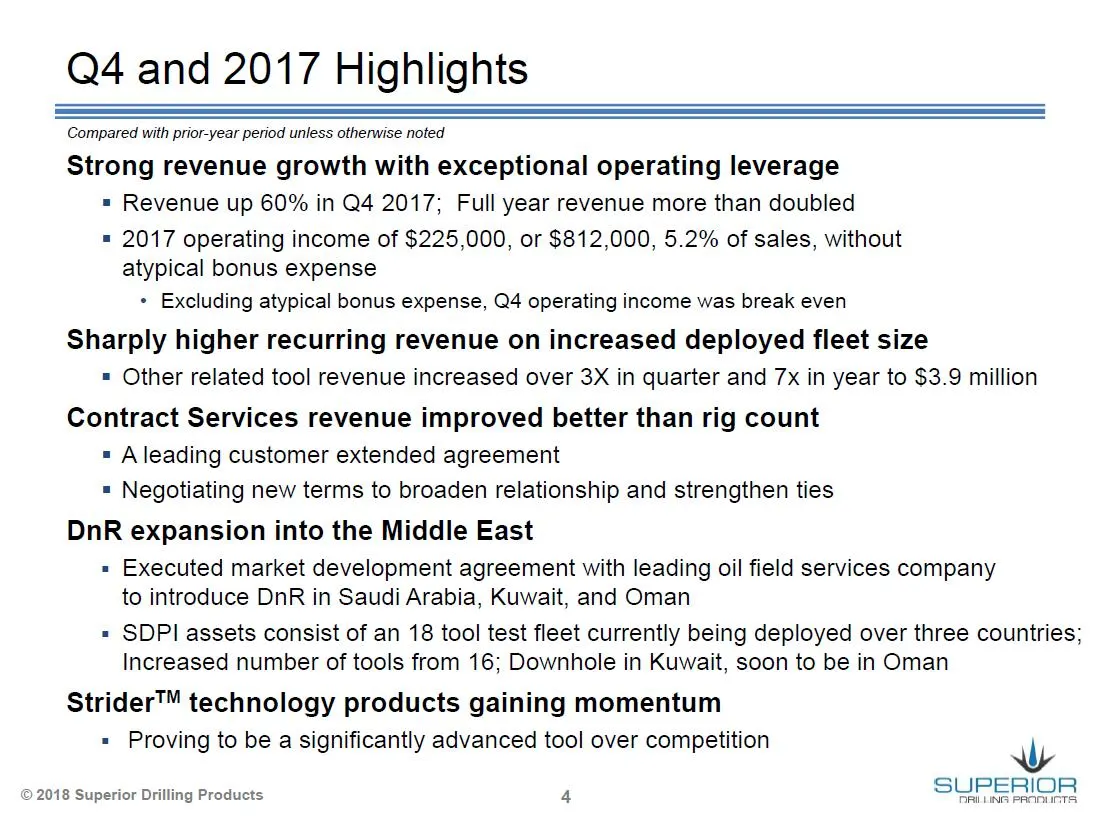
Q4 and 2017 Highlights Compared with prior-year period unless otherwise noted Strong revenue growth with exceptional operating leverage = Revenue up 60% in Q4 2017; Full year revenue more than doubled = 2017 operating income of $225,000, or $812,000, 5.2% of sales, without atypical bonus expense + E
Slide 5: Financial Results
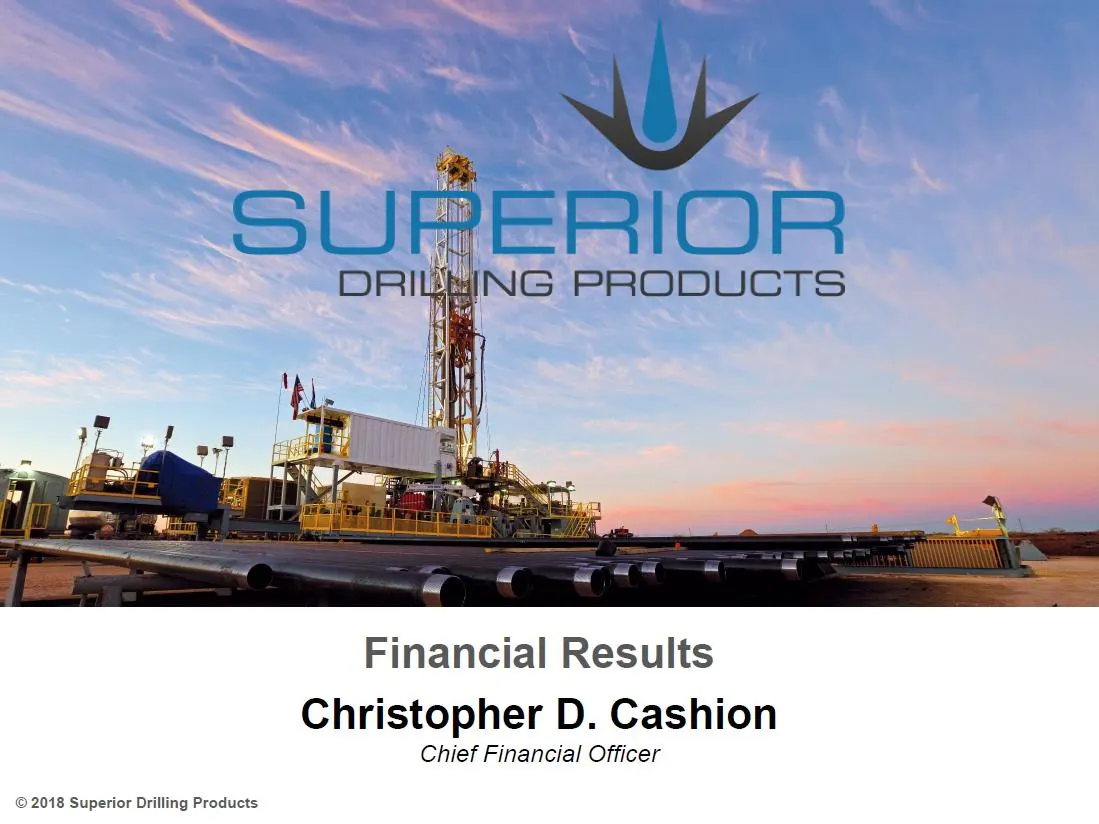
Financial Results Christopher D. Cashion Chief Financial Officer © 2018 Superior Drilling Products
Slide 6: Significant Revenue Growth
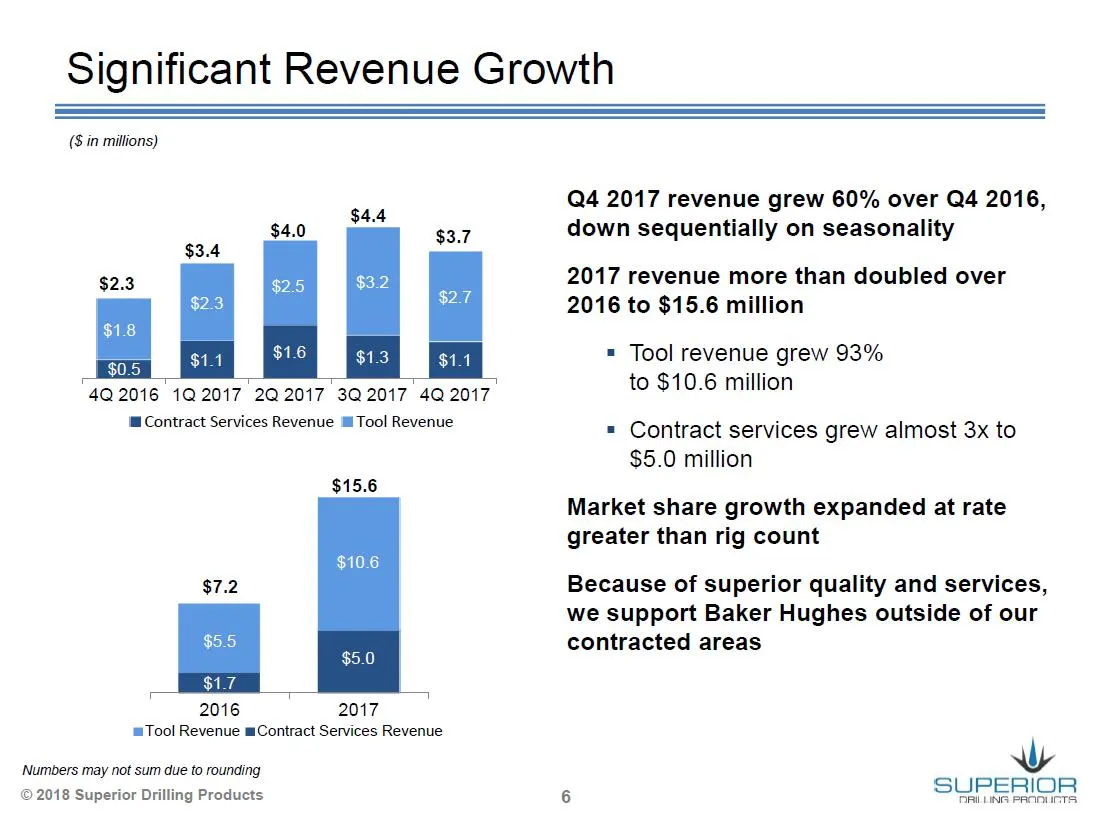
Significant Revenue Growth (8 in millions) ‘Contract Services Revenue i Tool Revenue $15.6 2016 2017 m= Tool Revenue mContract Services Revenue Numbers may not sum due to rounding © 2018 Superior Drilling Products Q4 2017 revenue grew 60% over Q4 2016, down sequentially on seasonality 2017 revenue m
Slide 7: Strong Tool Revenue
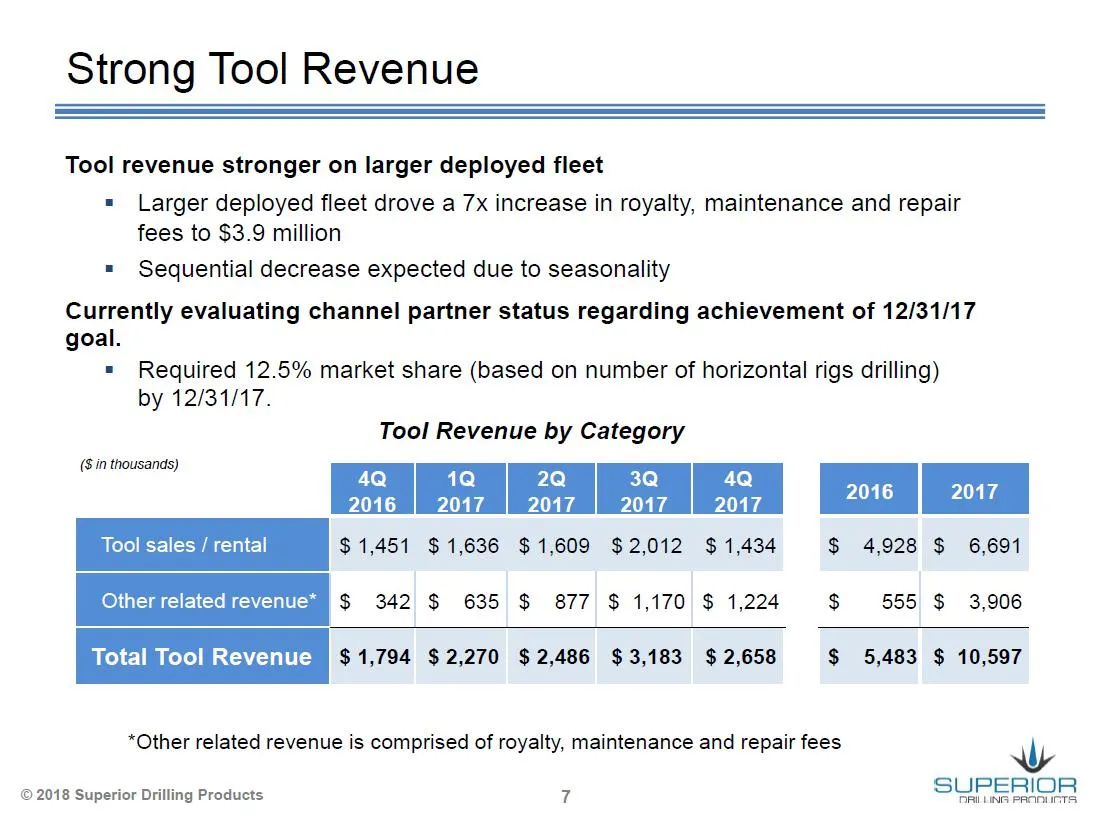
Strong Tool Revenue Tool revenue stronger on larger deployed fleet = Larger deployed fleet drove a 7x increase in royalty, maintenance and repair fees to $3.9 million = Sequential decrease expected due to seasonality Currently evaluating channel partner status regarding achievement of 12/31/17 goal.
Slide 8: Strong Cost Discipline and Operating Leverage
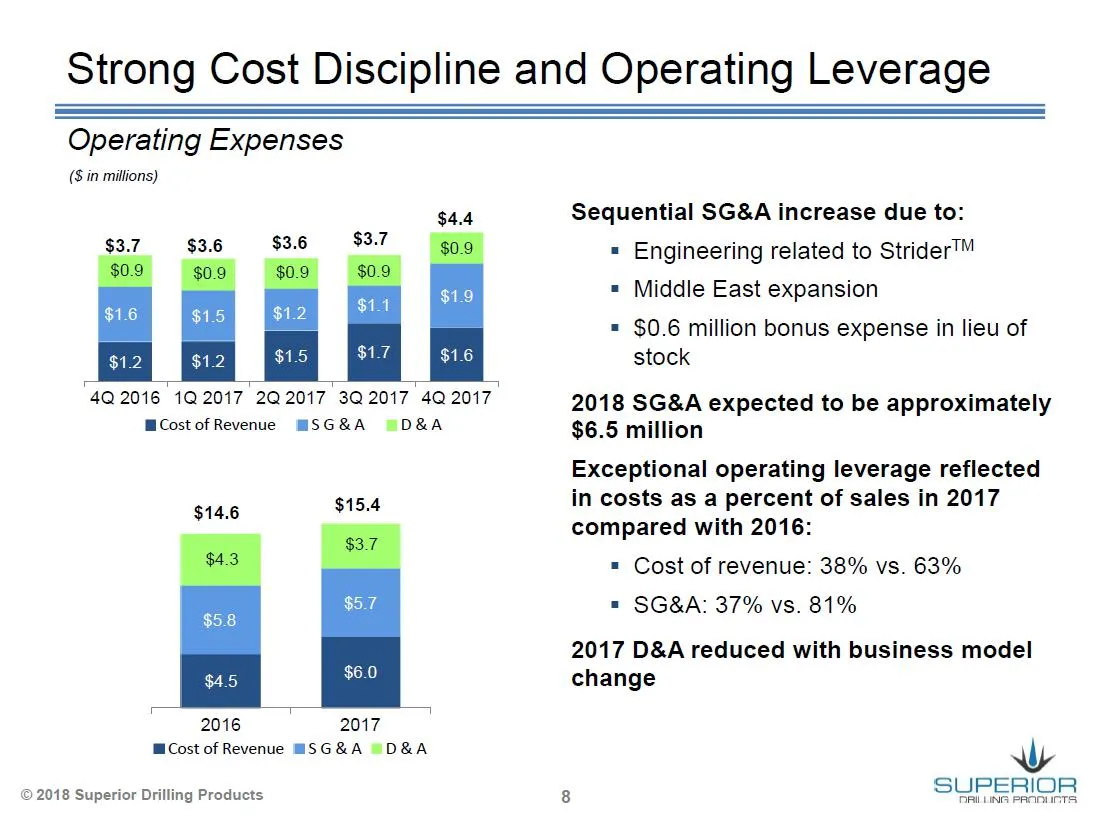
Strong Cost Discipline and Operating Leverage Operating Expenses (S$ in millions) Sequential SG&A increase due to: $37 $3.6 $3.6 $3.7 = Engineering related to Strider™ = Middle East expansion = $0.6 million bonus expense in lieu of stock 4Q 2016 1Q2017 2Q2017 3Q2017 4Q 2017 2018 SG&A expected to be
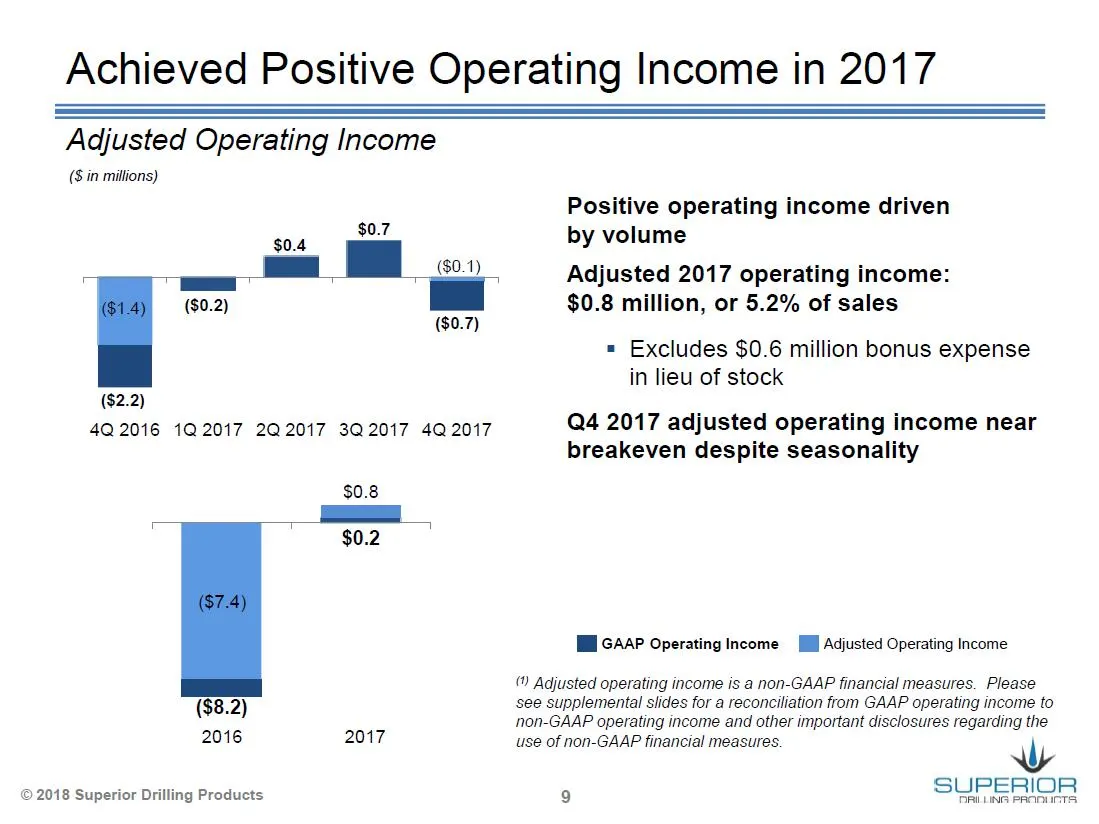
Slide 9: Achieved Positive Operating Income in 2017
Achieved Positive Operating Income in 2017 Adjusted Operating Income (8 in millions) Positive operating income driven $07, by volume Adjusted 2017 operating income: $0.8 million, or 5.2% of sales = Excludes $0.6 million bonus expense in lieu of stock ($2.2) 4Q.2016 102017 2Q2017 32017 402017 Q4 2017
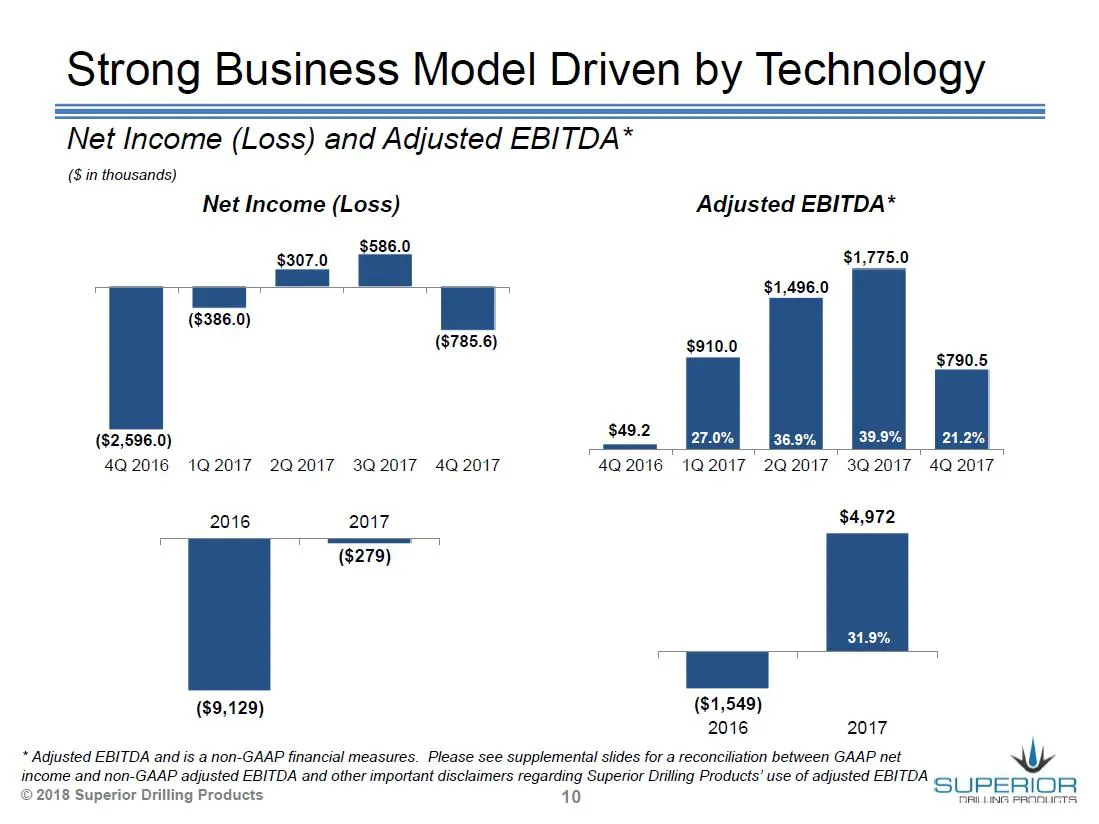
Slide 10: Strong Business Model Driven by Technology
Strong Business Model Driven by Technology Net Income (Loss) and Adjusted EBITDA* (8 in thousands) Net Income (Loss) Adjusted EBITDA* $307.0 28.8 $1,775.0 Ee $1,496.0 ($386.0) ($785.6) ($2,596.0) 4Q 2016 102017 2Q2017 302017 4Q2017 4Q 2016 192017 202017 302017 4Q 2017 2016 2017 $4,972 ($279) ($9,129
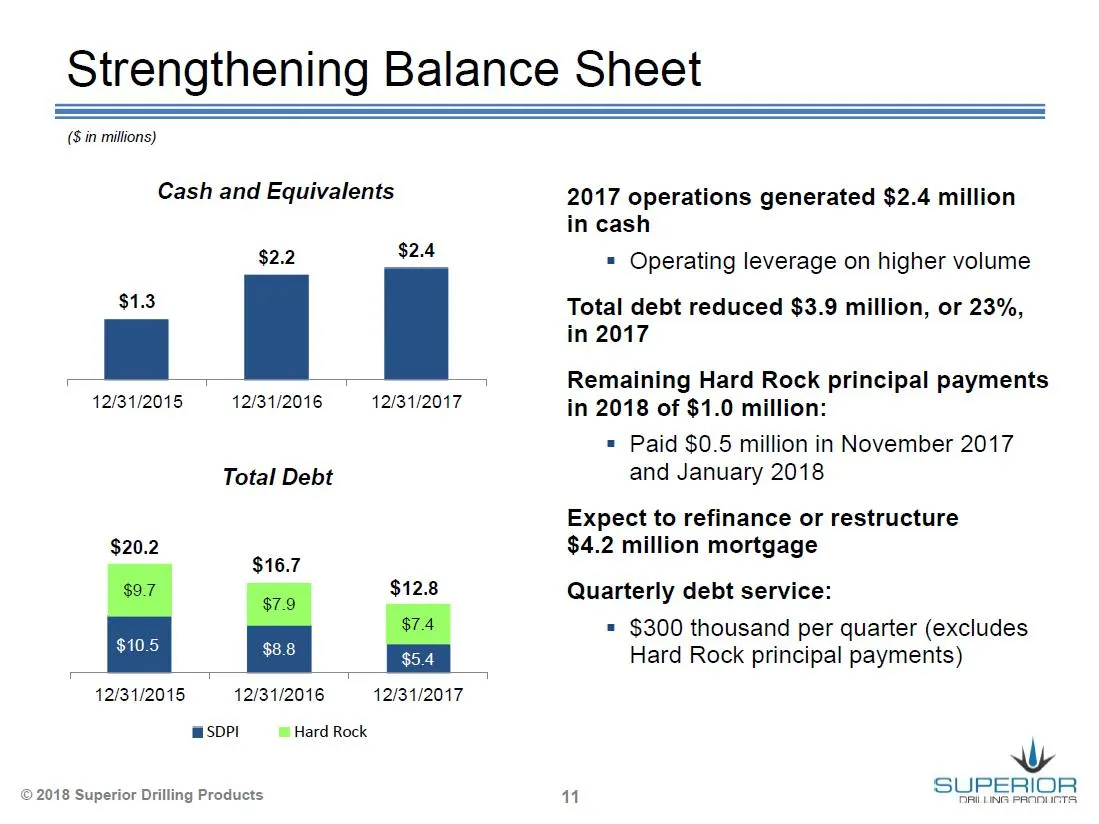
Slide 11: Strengthening Balance Sheet
Strengthening Balance Sheet (Sin millions) Cash and Equivalents $2.2 $2.4 - U U 12/31/2015 12/31/2016 12/31/2017 Total Debt $20.2 $16.7 $12.8 $5 12/31/2015 12/34/2016 += 12/31/2017 mSDPI Hard Rock © 2018 Superior Drilling Products 2017 operations generated $2.4 million in cash = Operating leverage o
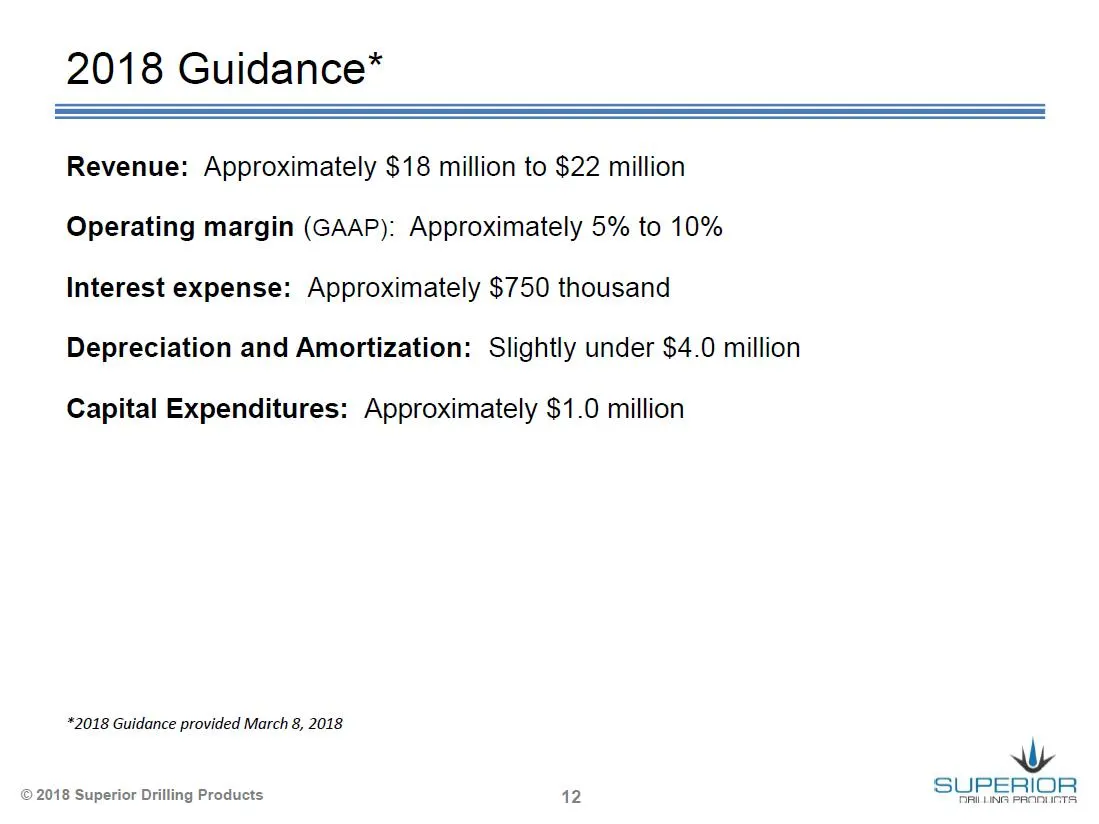
Slide 12: 2018 Guidance
2018 Guidance* Revenue: Approximately $18 million to $22 million Operating margin (GAAP): Approximately 5% to 10% Interest expense: Approximately $750 thousand Depreciation and Amortization: Slightly under $4.0 million Capital Expenditures: Approximately $1.0 million *2018 Guidance provided March 8,
Slide 13: Overview and Outlook
Overview and Outlook Troy Meier Chairman and Chief Executive Officer © 2018 Superior Drilling Products
Slide 14: Opportunities
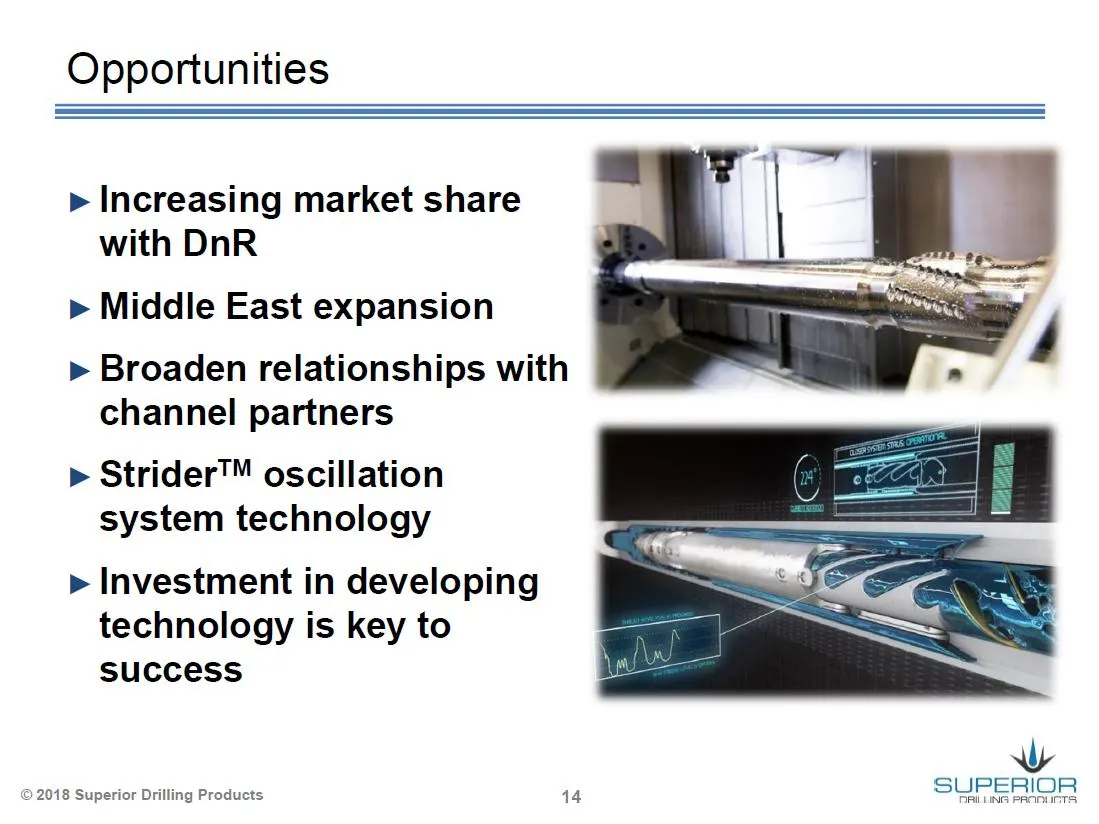
Opportunities > Increasing market share with DnR >» Middle East expansion > Broaden relationships with channel partners > Strider™ oscillation system technology > Investment in developing technology is key to success © 2018 Superior Drilling Products 14
Slide 15: Supplemental Information
Supplemental Information © 2018 Superior Drilling Products
Slide 16: Adjusted Income from Operations Reconciliation
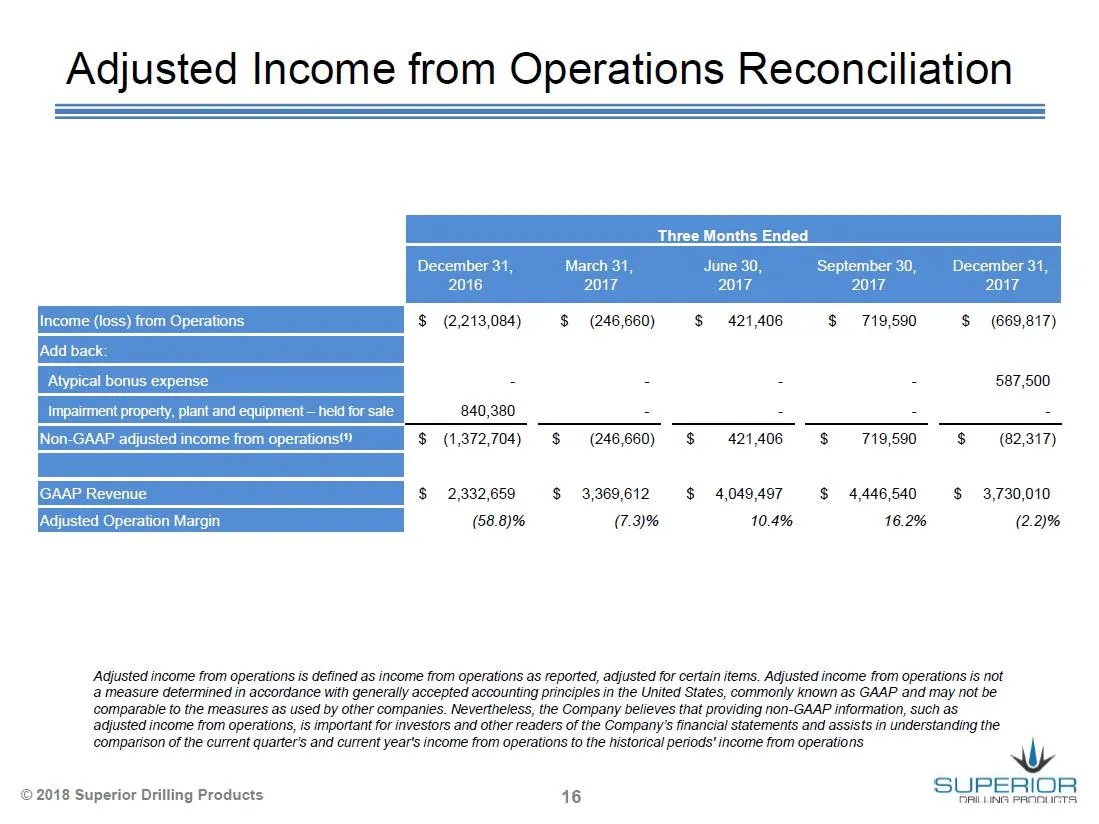
Adjusted Income from Operations Reconciliation December 2017 Income (loss) from Operations $ (2,213,084) = $ (246,660) $ 421,406 $ 719,590 $ (669,817) |Add back Atypical bonus expense = = a - 587,500 Impairment property, plant and equipment — held for sale 840,380 ~ « * “ Non-GAAP adjusted income fr
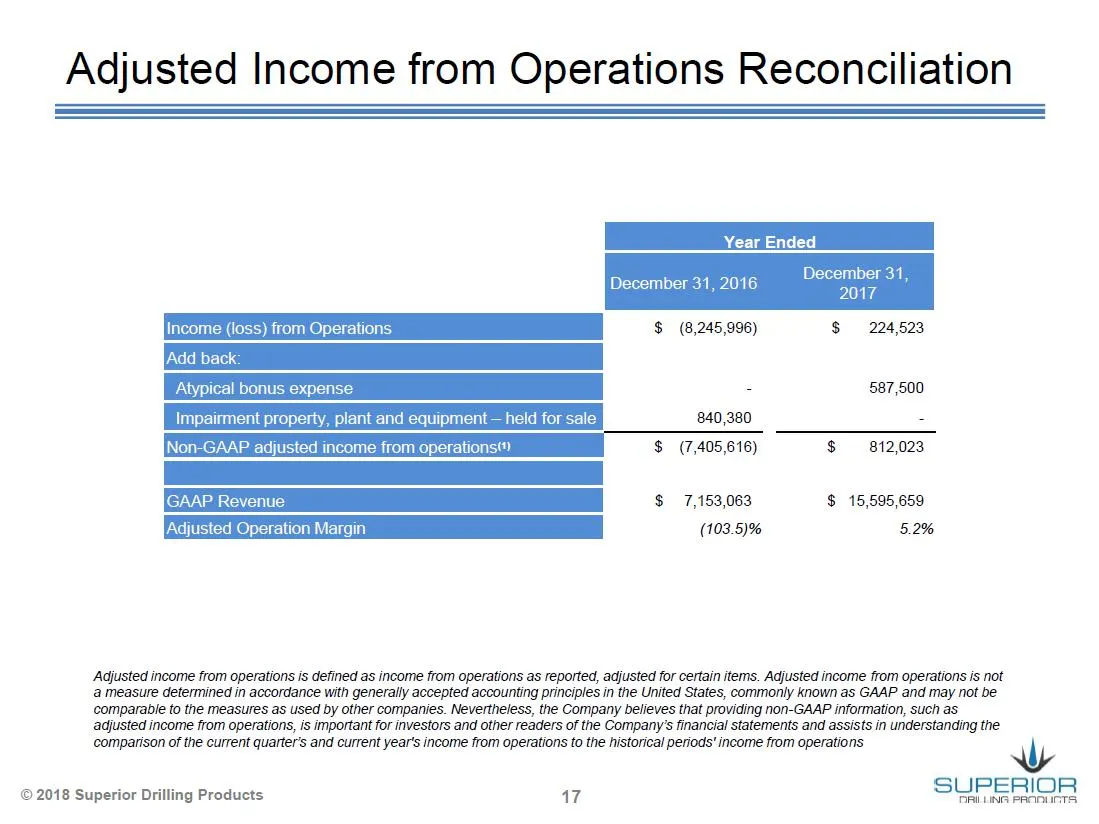
Slide 17: Adjusted Income from Operations Reconciliation
Adjusted Income from Operations Reconciliation $ (8,245,996) S$ 224,523 = 887,600 840,380 : $ (7,405,616) $812,023 PO $7,153,083 $ 15,595,659 (103.5)% 5.2% ‘Adjusted income from operations is defined as income from operations as reported, adjusted for certain items. Adjusted income from operations i
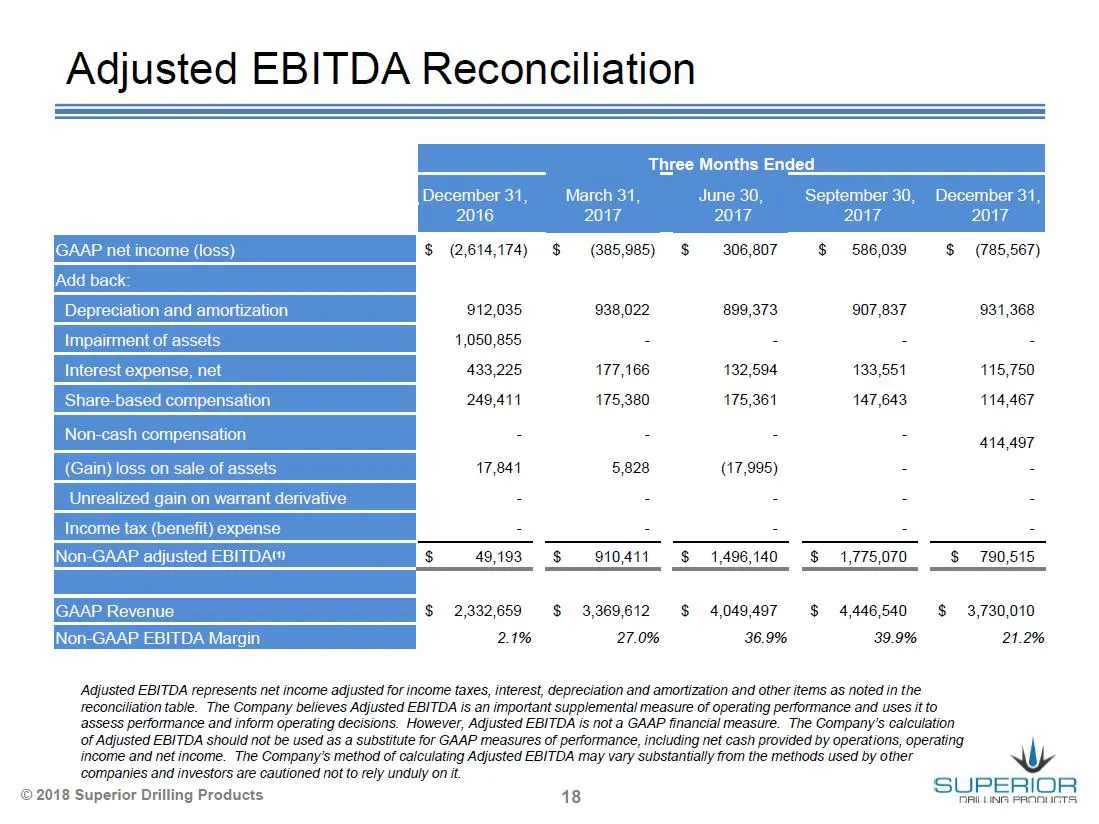
Slide 18: Adjusted EBITDA Reconciliation
Adjusted EBITDA Reconciliation March 31, 2017 Jun Three Months Ended 30, 2017 September 30, 2017 December 31, 2017 (385,985) $ 306807 $ 586039 $ (785,567) 912,035 938,022 899,373 907,837 931,368 1,050,855 = = ss 2 433,225 177,166 132,594 133,551 115,750 249,411 175,380 175,361 147,643 114,467 - - -
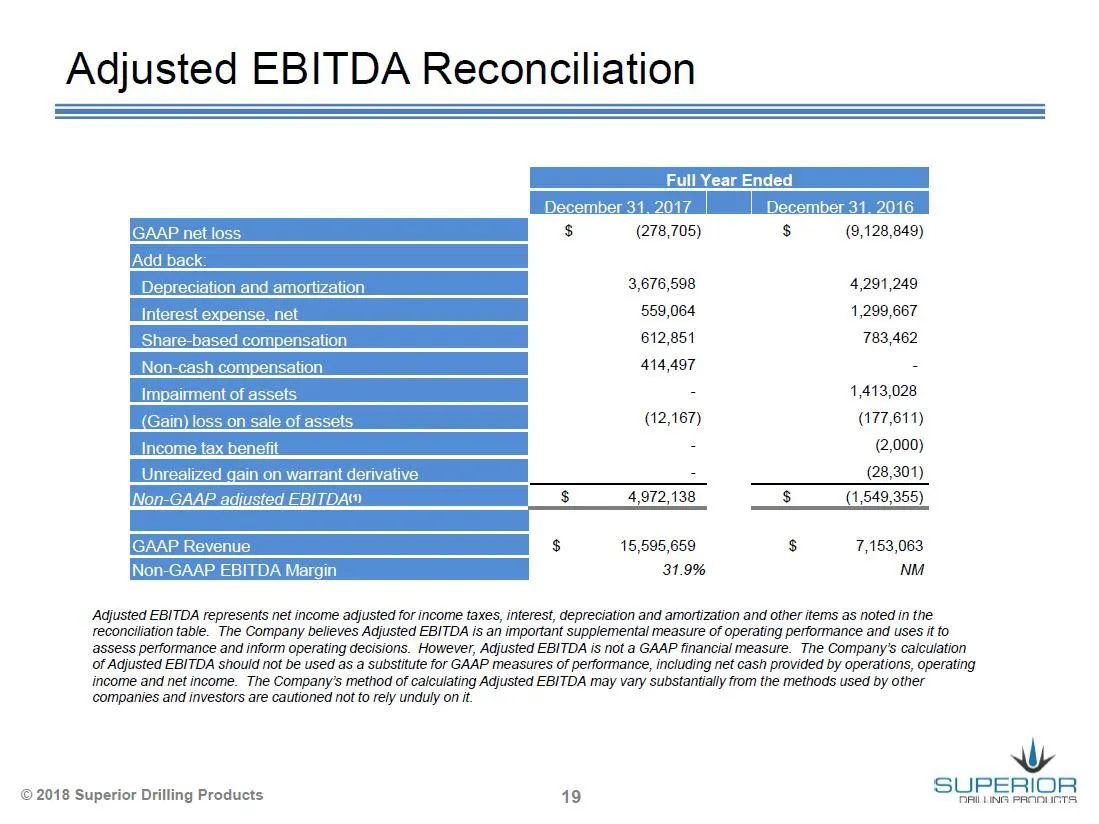
Slide 19: Adjusted EBITDA Reconciliation
Adjusted EBITDA Reconciliation [December 31 2017 |] Decomber 31. 2016 | s (278,705) S (9,128,849) 3,676,598 4,291,249 x] t 559,064 1,299,667 612,851 783,462 re 414,497 - : 1,413,028 (12,167) (177611) [incometaxbenent - (2,000) : (28,301) Non-GAAP adjusted EBITDA $ 4,972,138 $ (1,549,355) IGAAP Reven
Source: SEC EDGAR · 8-K filed Mar 8, 2018
More decks from Superior Drilling Products Inc
 Q3 2023 Earnings Presentation12 slides · Nov 9, 2023
 Q2 2023 Earnings Presentation12 slides · Aug 14, 2023
 Q1 2023 Earnings Presentation12 slides · May 15, 2023
 FY2022 Earnings Presentation13 slides · Mar 10, 2023
 Q3 2022 Earnings Presentation12 slides · Nov 14, 2022
 MicroCap Rodeo Windy City Roundup 202220 slides · Oct 12, 2022