M3, Inc. · TSE:2413
M3 — Q1 FY2019 Earnings Presentation
31 slides from M3's earnings presentation, July 2019

Slide 1: M3, Inc. Presentation Material
M3, Inc. Presentation Material July 2019 Copyright © 2019 M3, Inc. All rights reserved.
Slide 2: Forward-looking statements disclaimer
The following presentation contains forecasts, future plans, management targets and other forward-looking projections relating to M3, Inc. and/or its group. These statements are drawn from assumptions of future events based on data currently available to us, and there exist possibilities that such a
Slide 3: FY2019 Q1 Consolidated Results
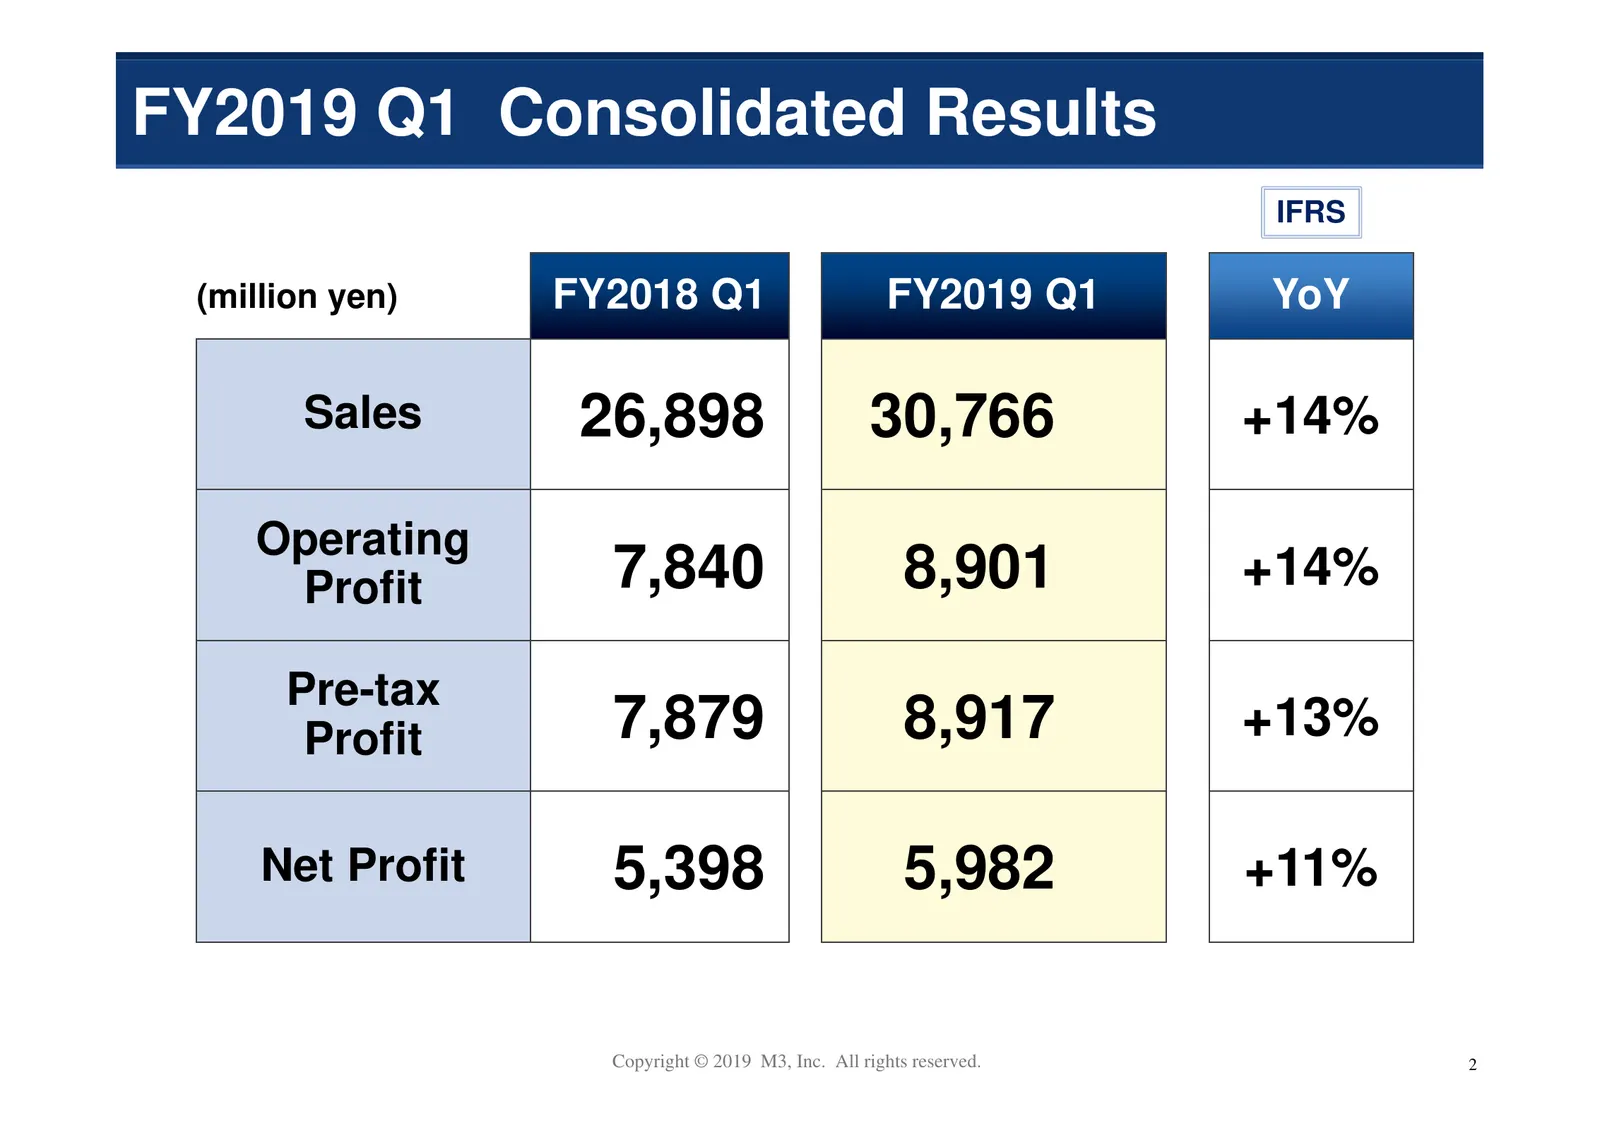
FY2019 Q1 Consolidated Results IFRS (million yen) FY2018 Q1 FY2019 Q1 YoY Sales 26,898 30,766 +14% Operating Profit 7,840 8,901 +14% Pre-tax Profit 7,879 8,917 +13% Net Profit 5,398 5,982 +11% Copyright © 2019 M3, Inc. All rights reserved. 2
Slide 4: FY2019 Q1 Consolidated Results by Segment
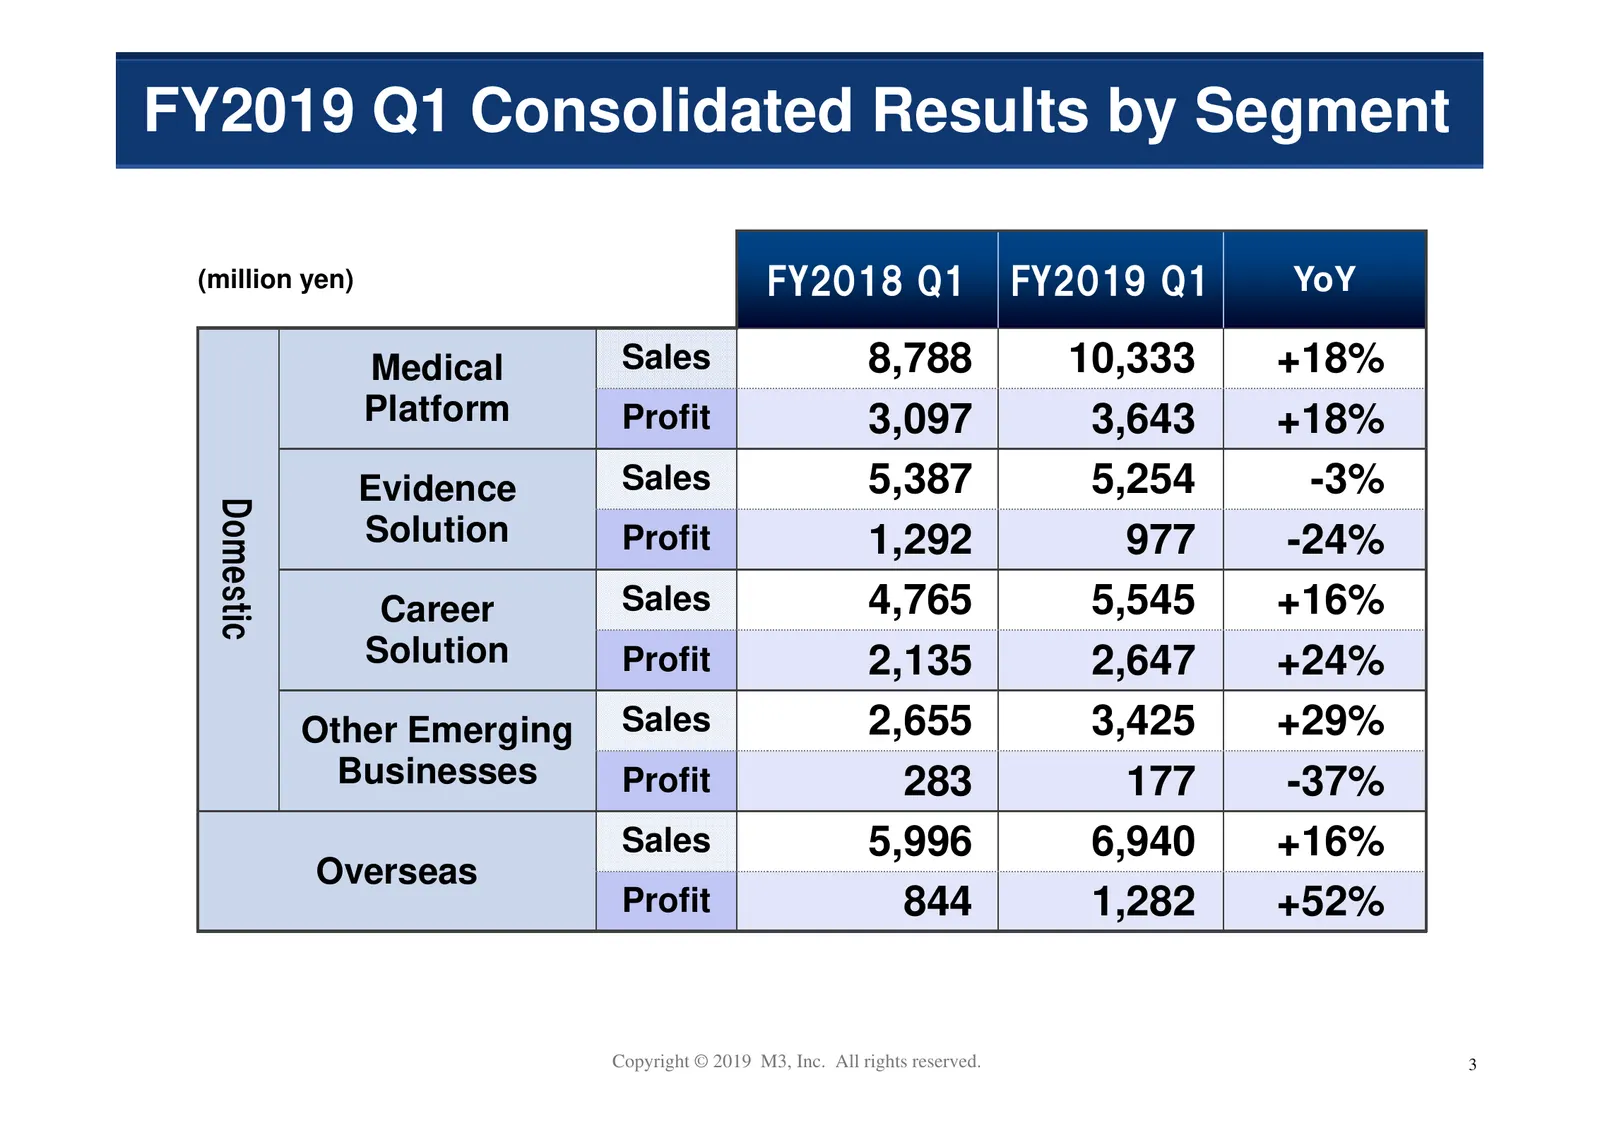
FY2019 Q1 Consolidated Results by Segment (million yen) FY2018 Q1 FY2019 Q1 YoY Medical Sales 8,788 10,333 +18% Platform Profit 3,097 3,643 +18% Evidence Sales 5,387 5,254 -3% Domestic Solution Profit 1,292 977 -24% Career Sales 4,765 5,545 +16% Solution Profit 2,135 2,647 +24% Other Emerging Sales
Slide 5: Consolidated Operating Profit Change Analysis
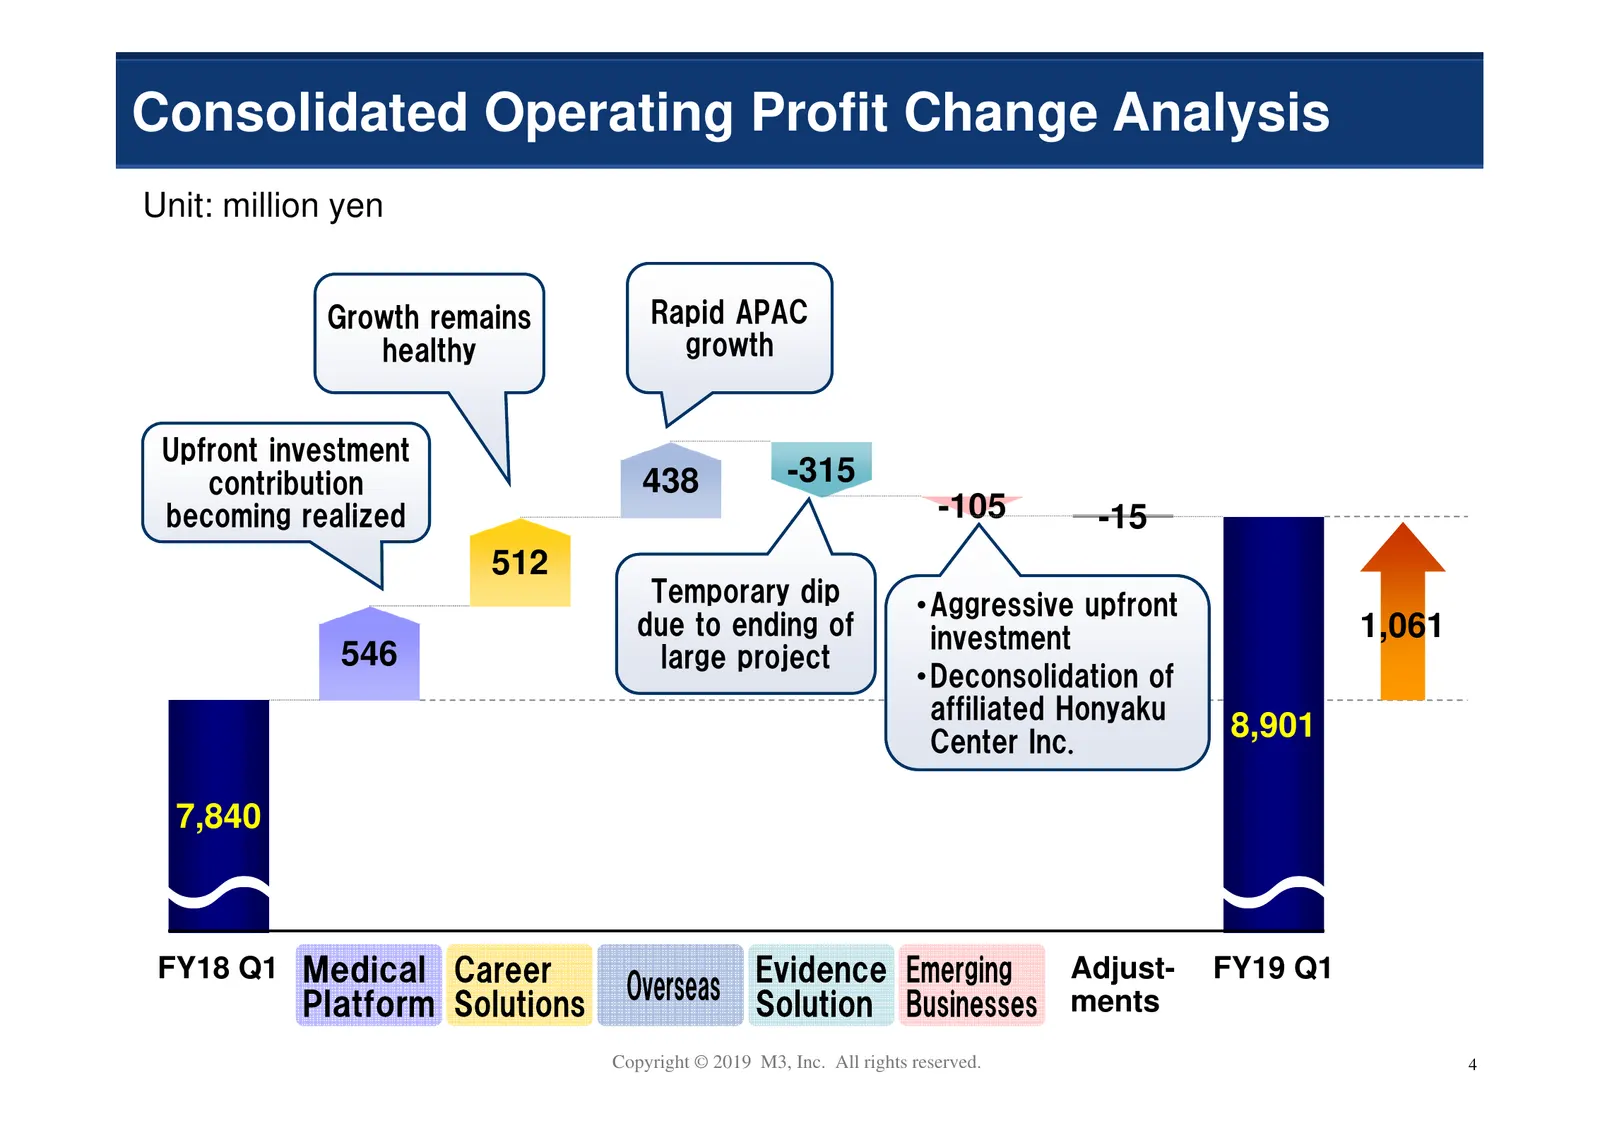
Consolidated Operating Profit Change Analysis Unit: million yen Growth remains Rapid APAC healthy growth Upfront investment contribution 438 -315 becoming realized -105 -15 512 Temporary dip • Aggressive upfront due to ending of investment 1,061 546 large project • Deconsolidation of affiliated Hony
Slide 6: FY2019 Q1 Overview
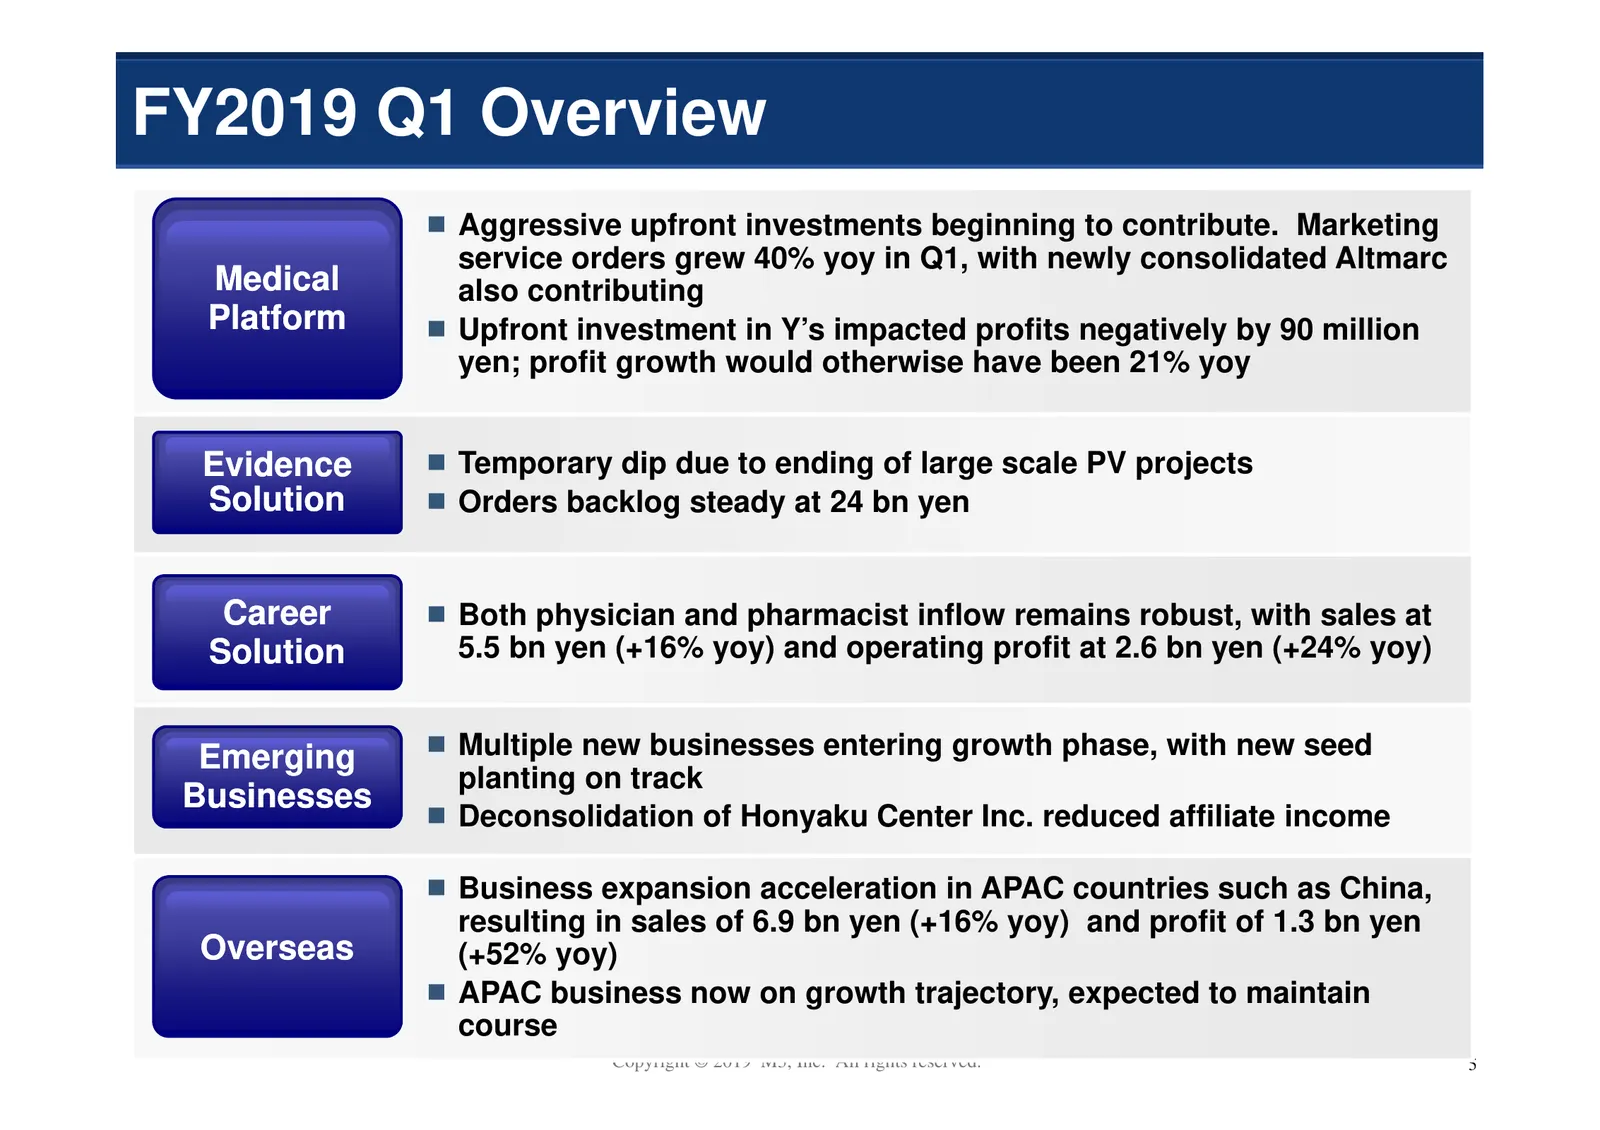
FY2019 Q1 Overview Aggressive upfront investments beginning to contribute. Marketing service orders grew 40% yoy in Q1, with newly consolidated Altmarc Medical also contributing Platform Upfront investment in Y’s impacted profits negatively by 90 million yen; profit growth would otherwise have been
Slide 7: Medical Platform
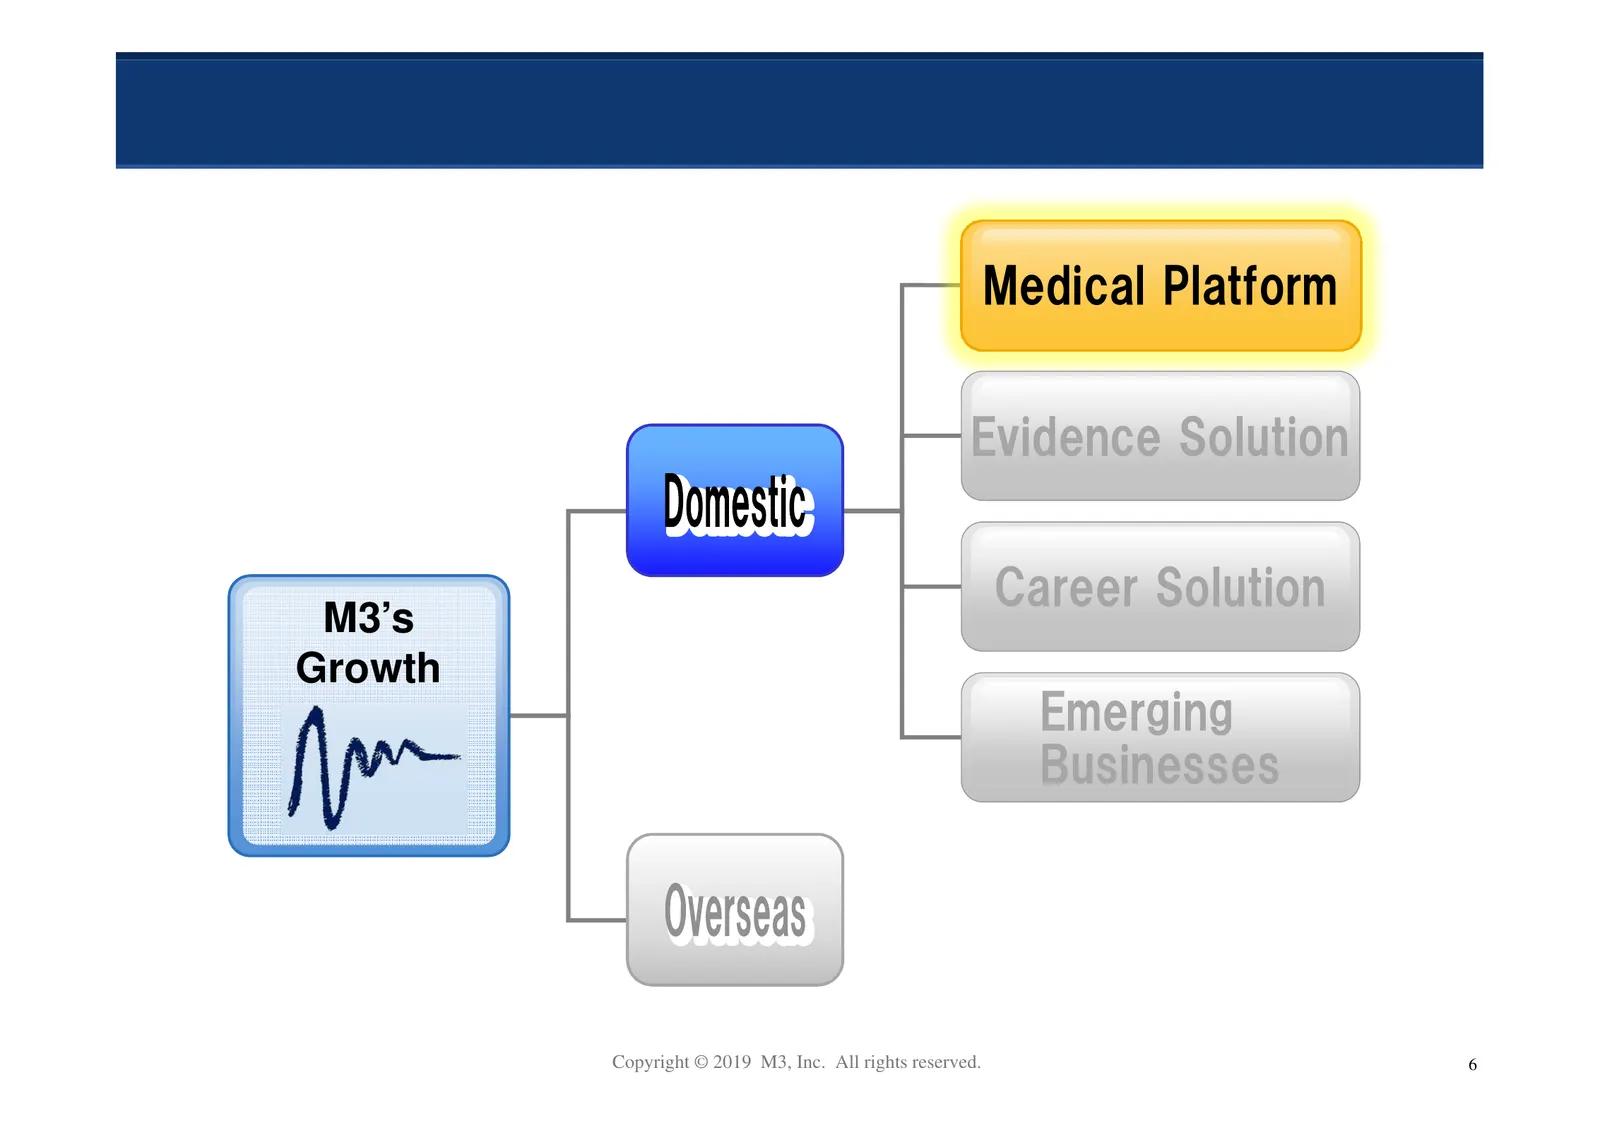
Medical Platform Evidence Solution Career Solution M3’s Growth Emerging Businesses Copyright © 2019 M3, Inc. All rights reserved. 6
Slide 8: Doctor's Time Allocation vs Pharma's Budget Allocation
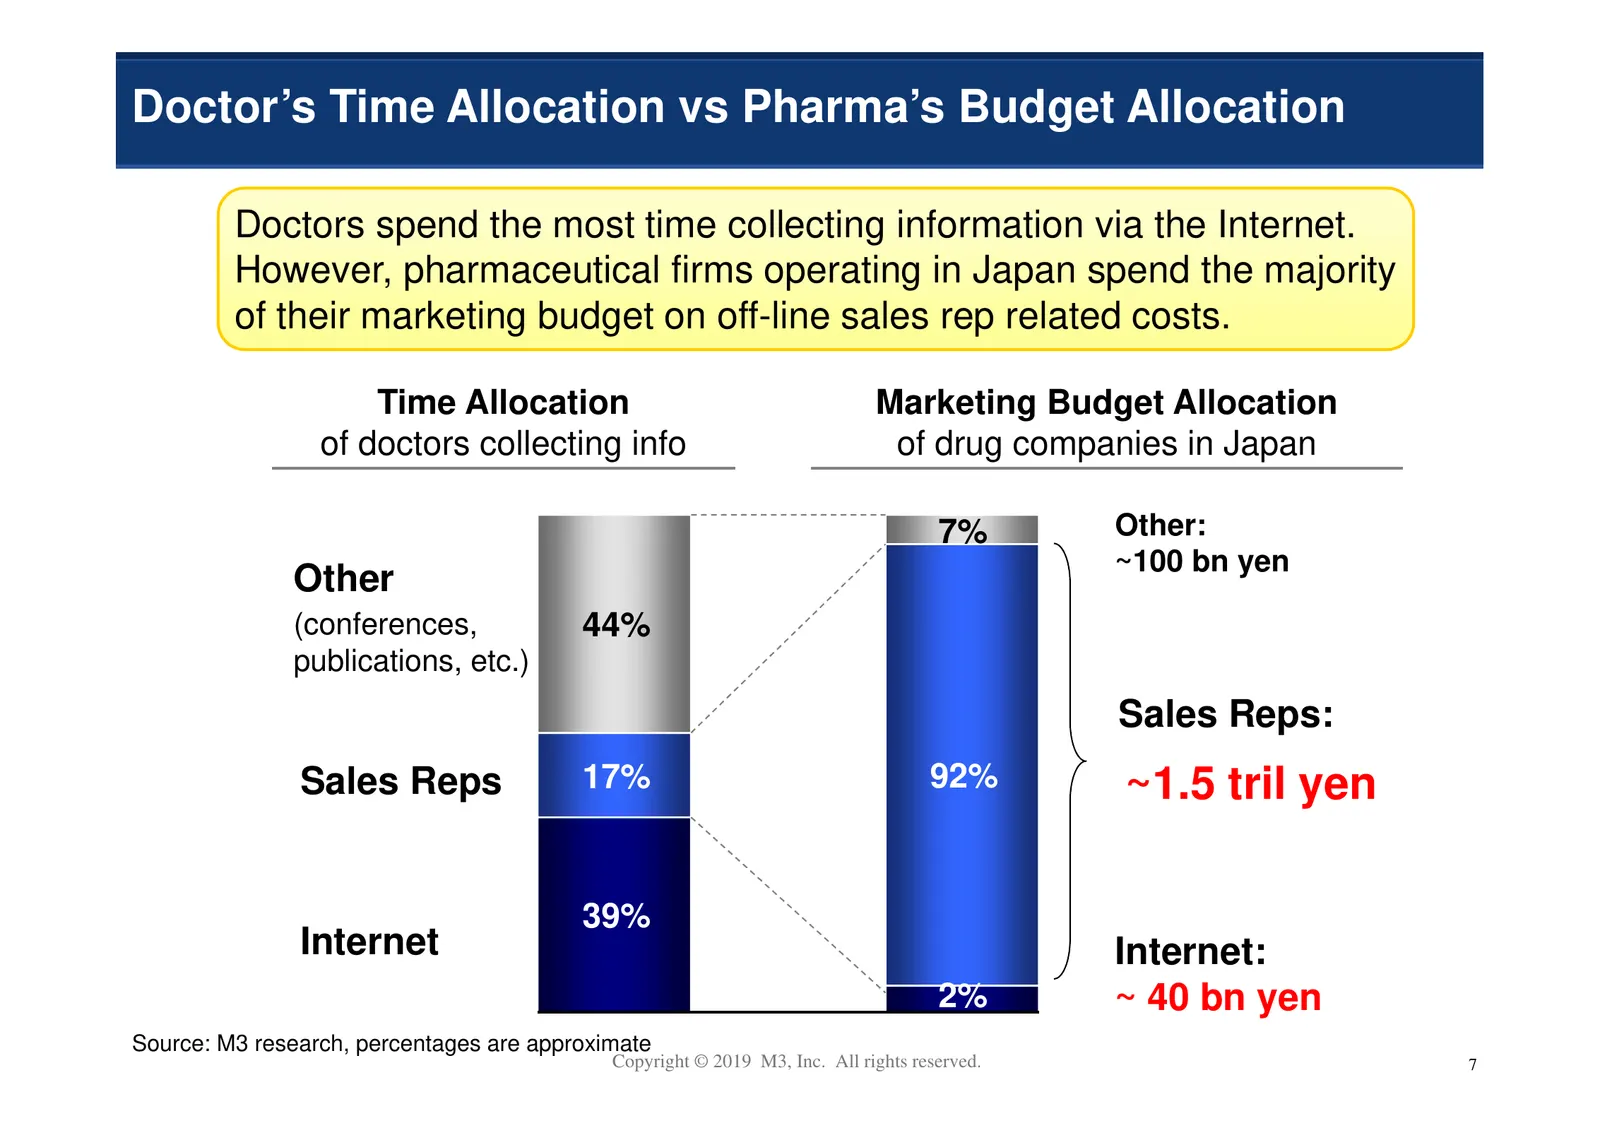
Doctor’s Time Allocation vs Pharma’s Budget Allocation Doctors spend the most time collecting information via the Internet. However, pharmaceutical firms operating in Japan spend the majority of their marketing budget on off-line sales rep related costs. Time Allocation Marketing Budget Allocation o
Slide 9: Medical Platform Growth Potential in Japan
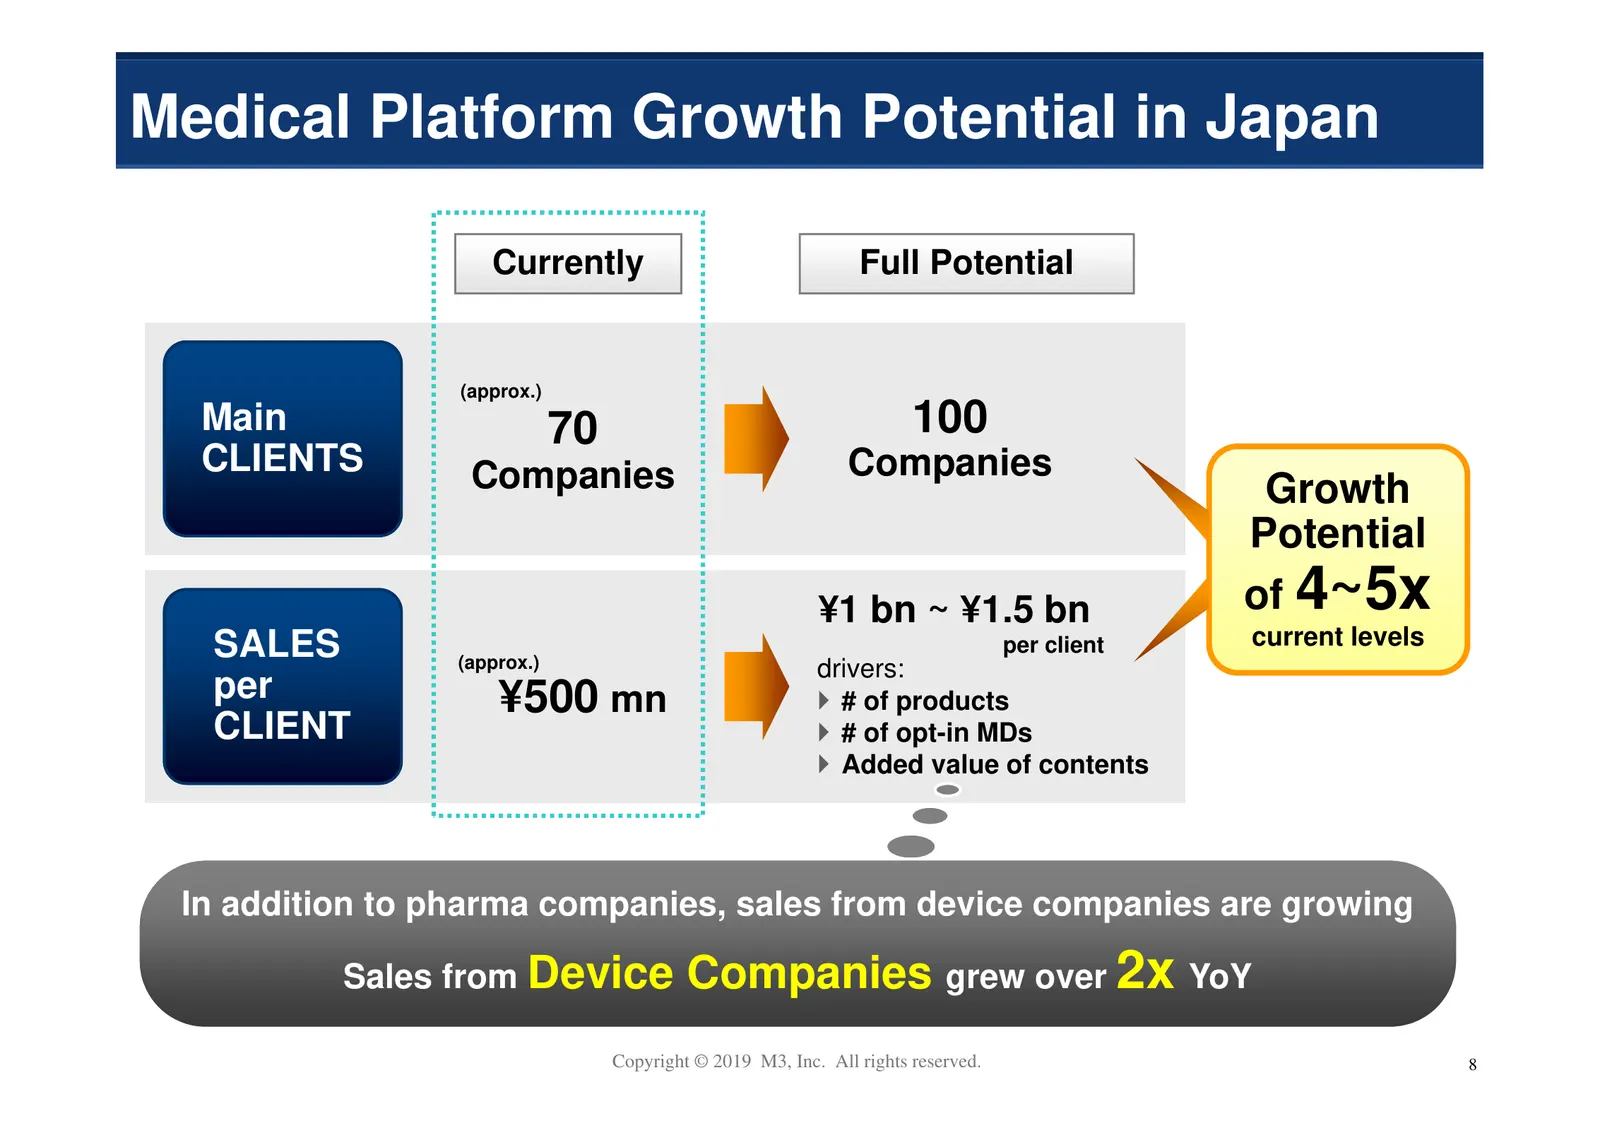
Medical Platform Growth Potential in Japan Currently Full Potential (approx.) Main 70 100 CLIENTS Companies Companies Growth Potential ¥1 bn ~ ¥1.5 bn of 4~5x SALES per client current levels (approx.) drivers: per ¥500 mn # of products CLIENT # of opt-in MDs Added value of contents In addition to ph
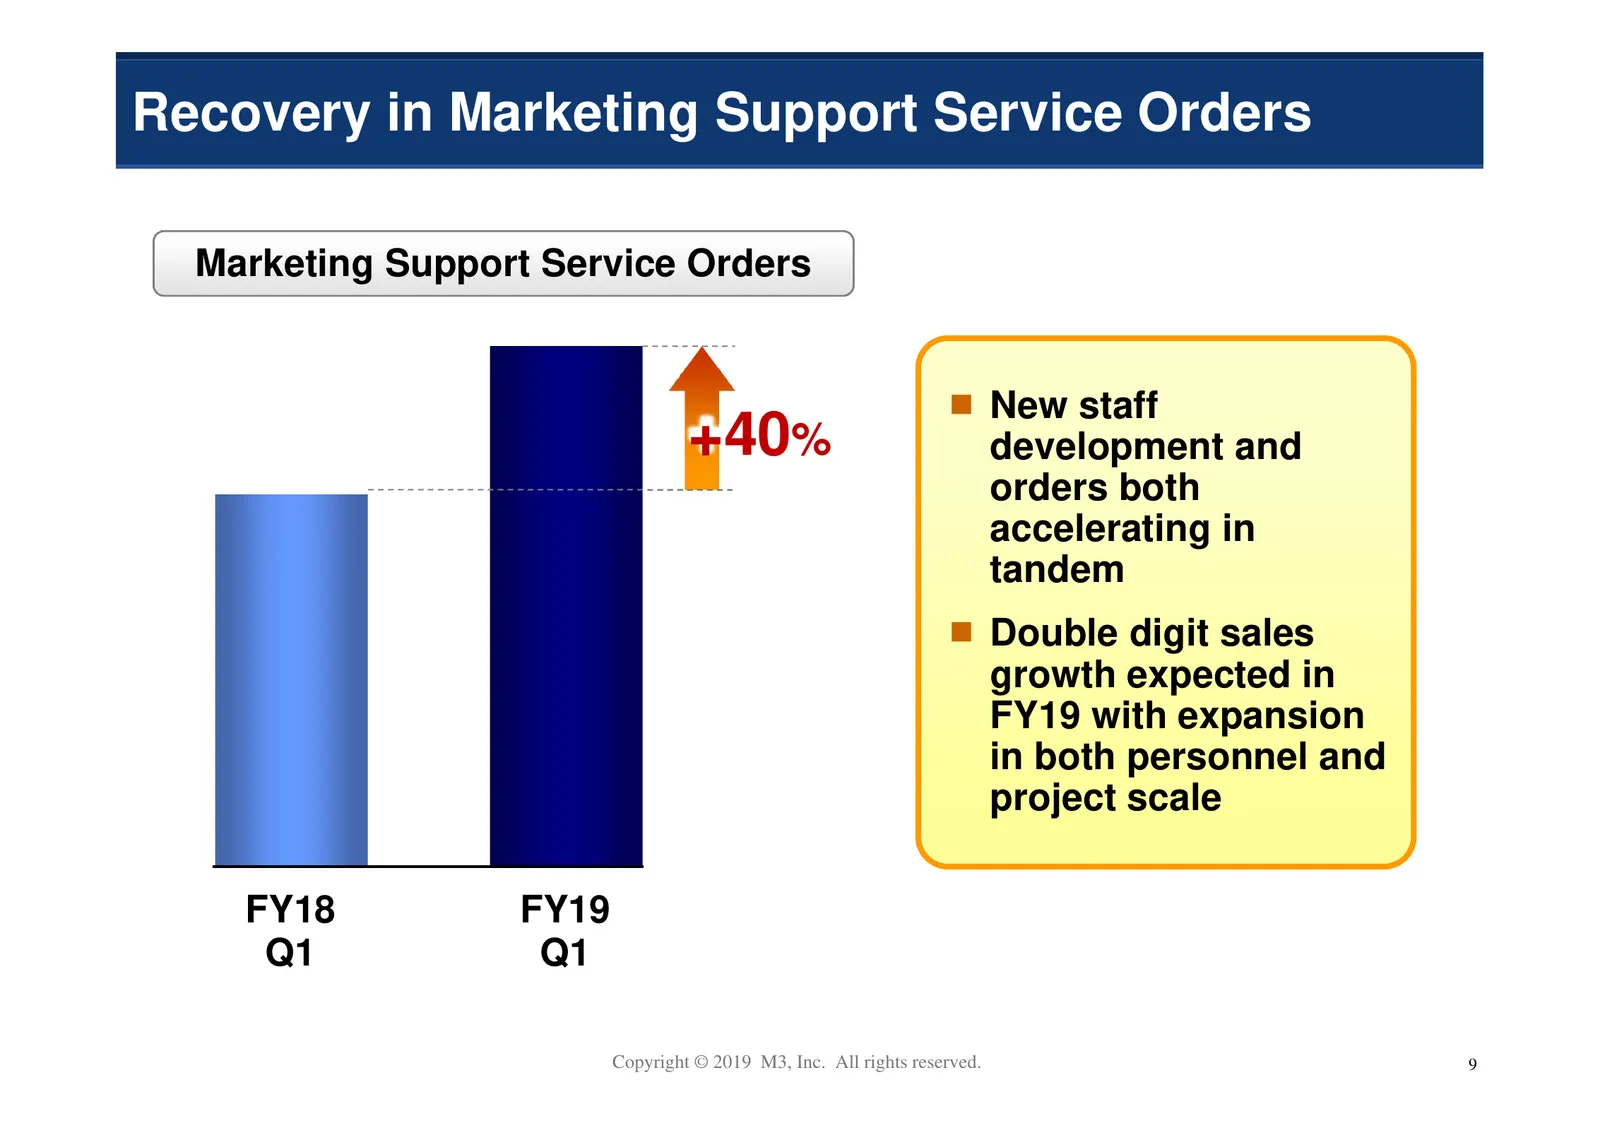
Slide 10: Recovery in Marketing Support Service Orders
Recovery in Marketing Support Service Orders Marketing Support Service Orders New staff +40% development and orders both accelerating in tandem Double digit sales growth expected in FY19 with expansion in both personnel and project scale FY18 FY19 Q1 Q1 Copyright © 2019 M3, Inc. All rights reserved.
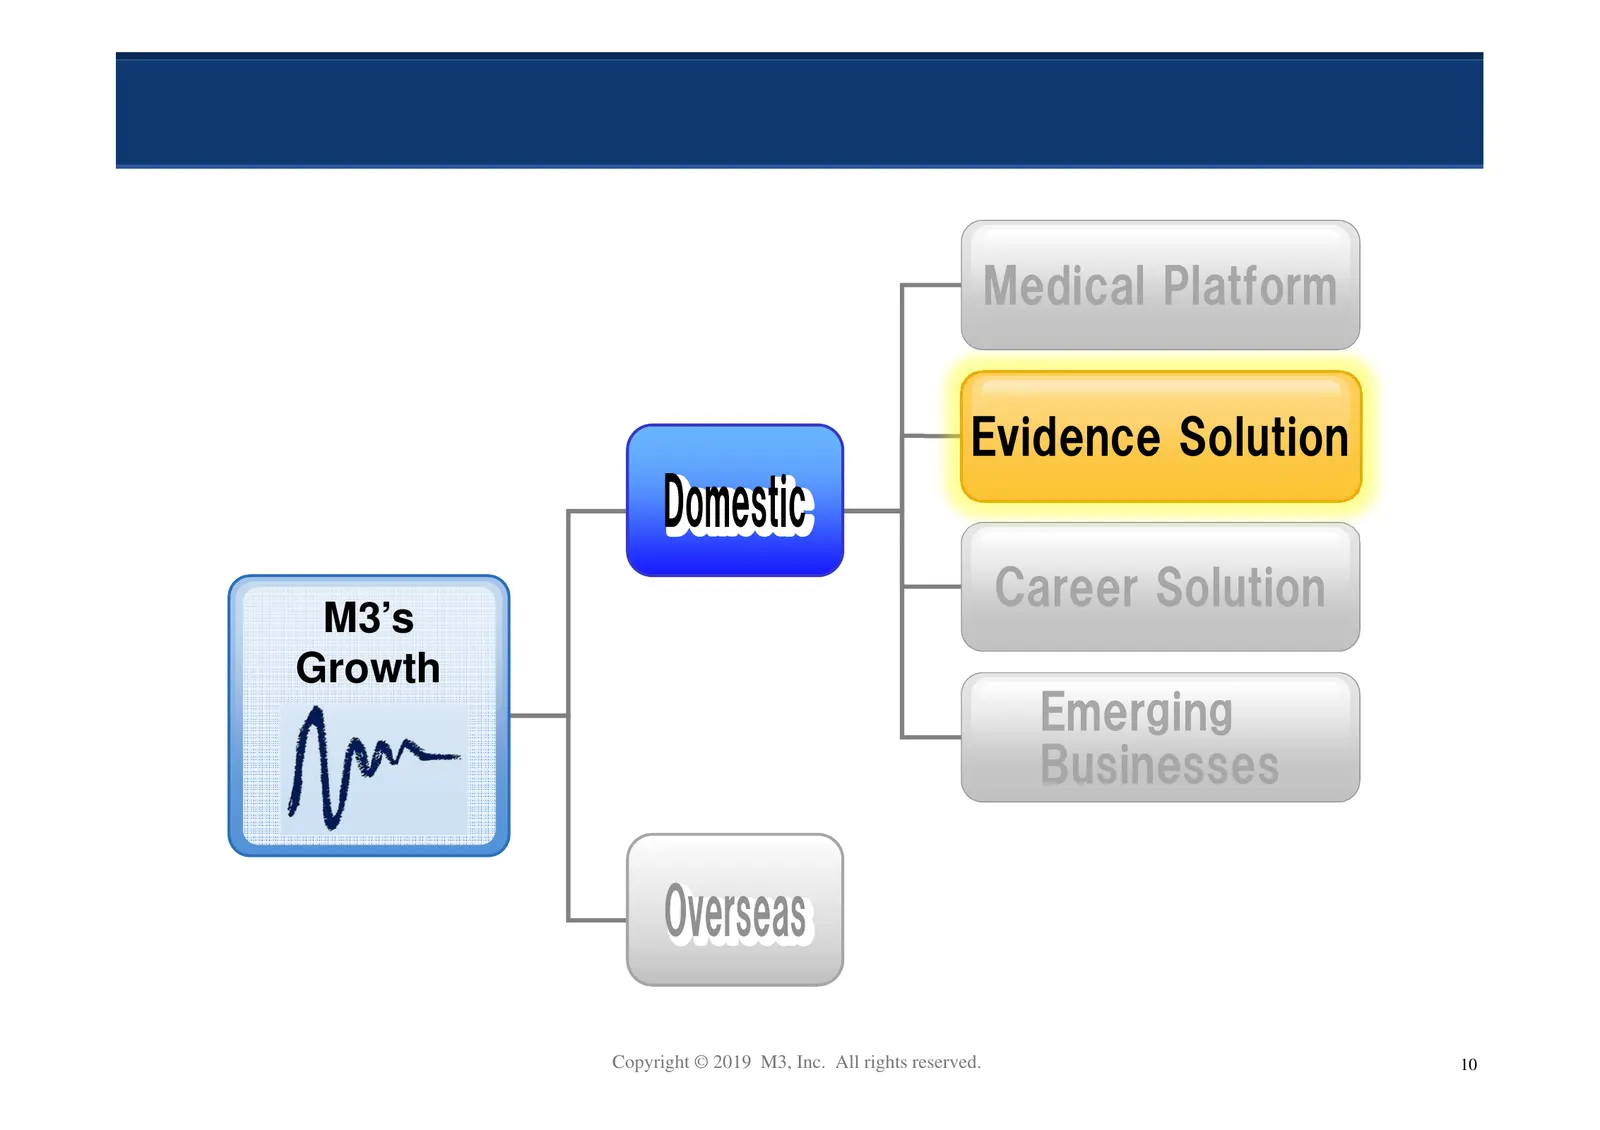
Slide 11: Evidence Solution
Medical Platform Evidence Solution Career Solution M3’s Growth Emerging Businesses Copyright © 2019 M3, Inc. All rights reserved. 10
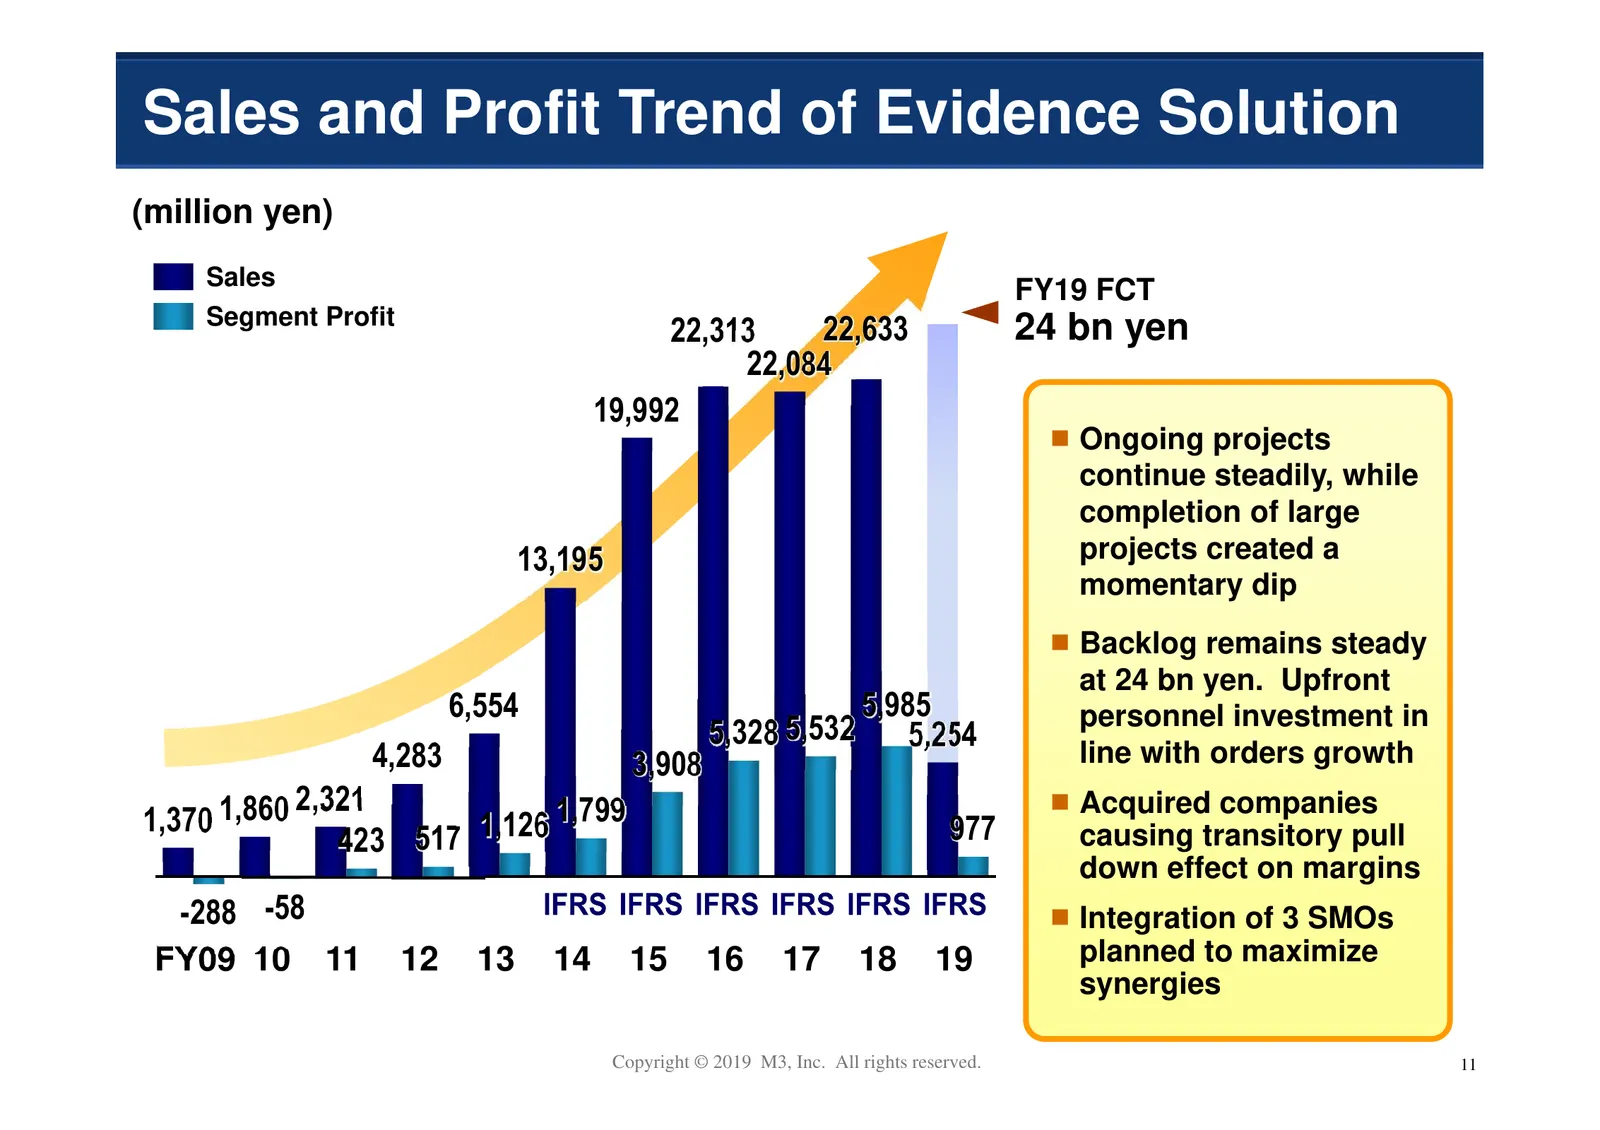
Slide 12: Sales and Profit Trend of Evidence Solution
Sales and Profit Trend of Evidence Solution (million yen) Sales FY19 FCT Segment Profit 22,313 22,633 24 bn yen 22,084 19,992 Ongoing projects continue steadily, while completion of large 13,195 projects created a momentary dip Backlog remains steady at 24 bn yen. Upfront 6,554 5,985 personnel inves
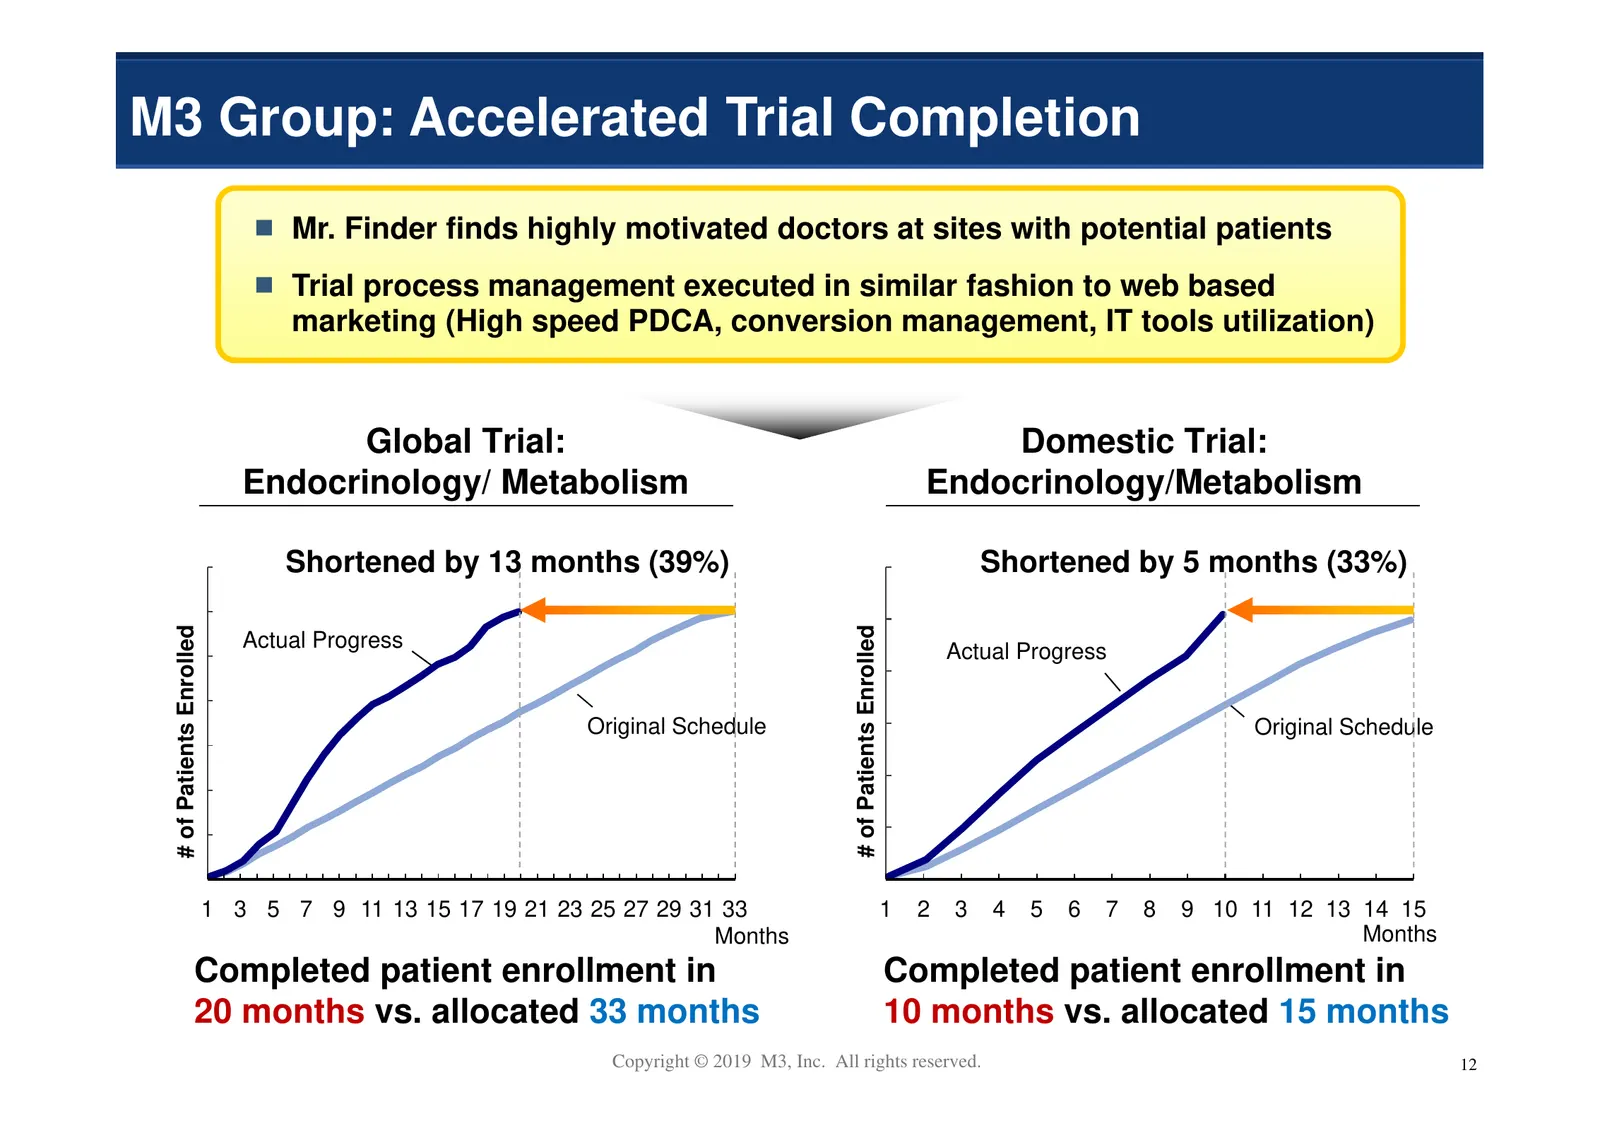
Slide 13: M3 Group: Accelerated Trial Completion
M3 Group: Accelerated Trial Completion Mr. Finder finds highly motivated doctors at sites with potential patients Trial process management executed in similar fashion to web based marketing (High speed PDCA, conversion management, IT tools utilization) Global Trial: Domestic Trial: Endocrinology/ Me
Slide 14: Career Solution
Medical Platform Evidence Solution Career Solution M3’s Growth Emerging Businesses Copyright © 2019 M3, Inc. All rights reserved. 13
Slide 15: Sales and Profit Trend of Career Solutions
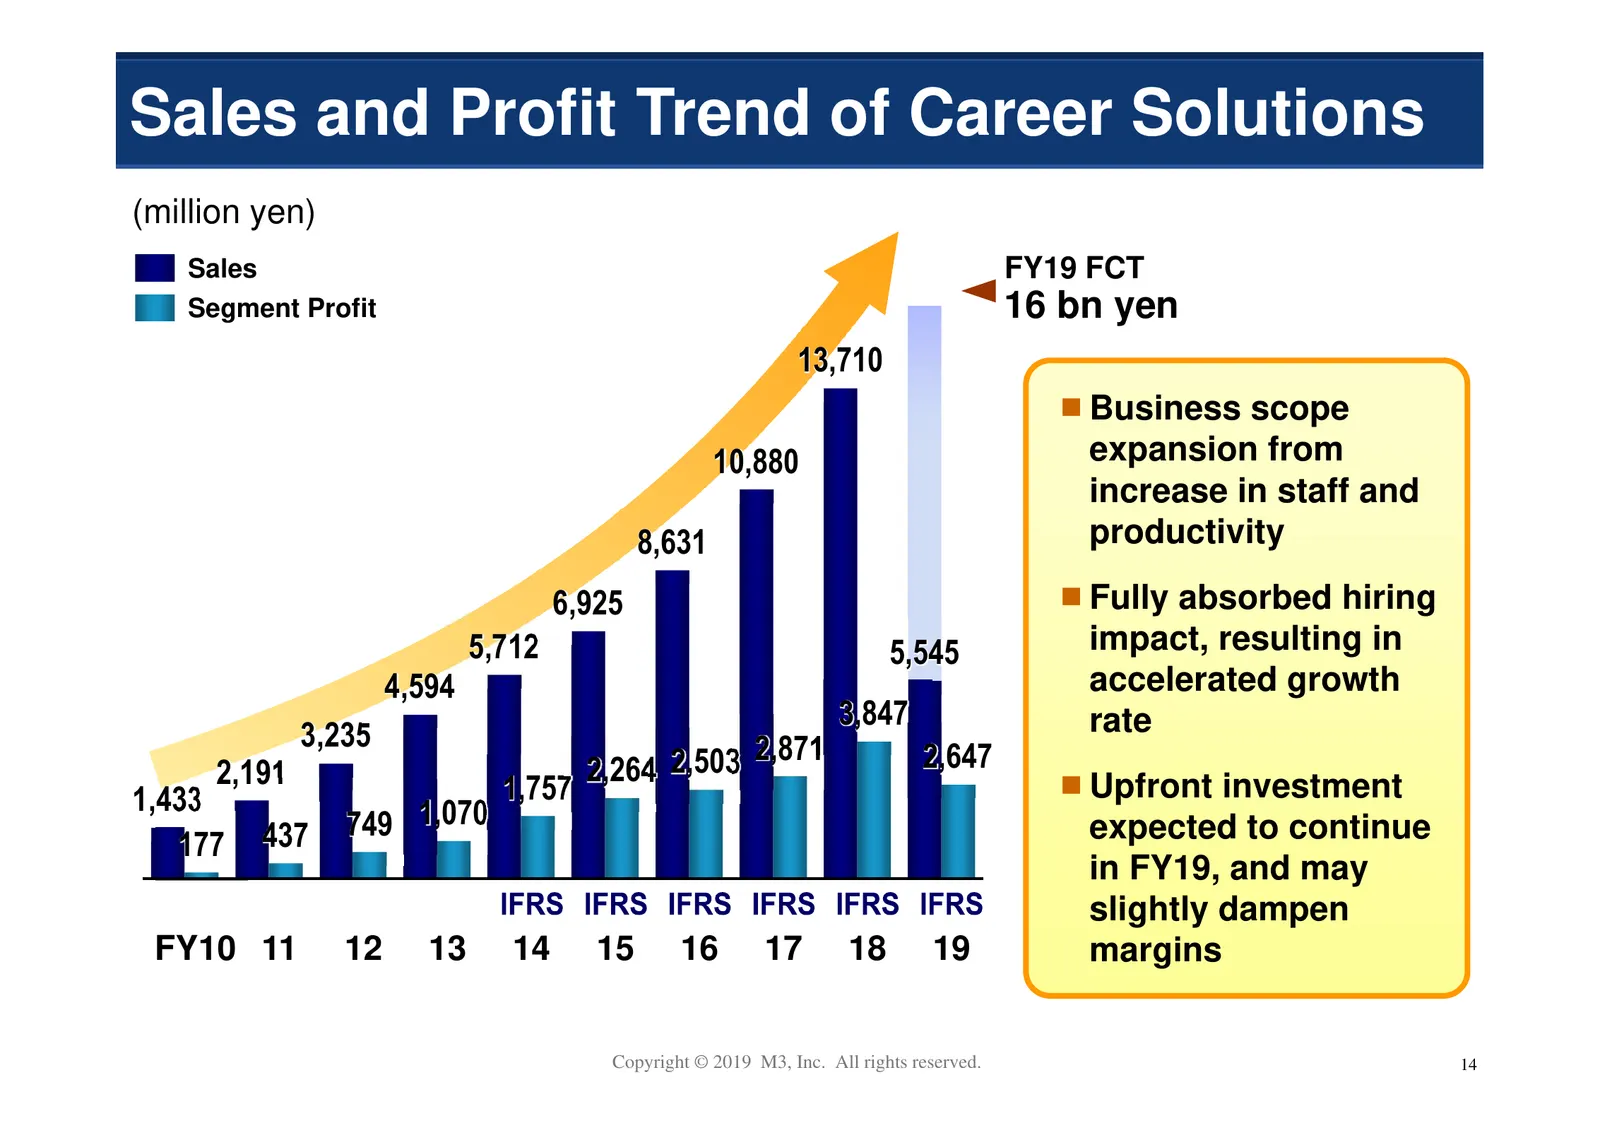
Sales and Profit Trend of Career Solutions (million yen) Sales FY19 FCT Segment Profit 16 bn yen 13,710 Business scope 10,880 expansion from increase in staff and 8,631 productivity 6,925 Fully absorbed hiring 5,712 5,545 impact, resulting in 4,594 accelerated growth 3,847 rate 3,235 2,871 2,191 2,2
Slide 16: Emerging Businesses
Medical Platform Evidence Solution Career Solution M3’s Growth Emerging Businesses Copyright © 2019 M3, Inc. All rights reserved. 15
Slide 17: Sales and Profit Trend of Emerging Businesses
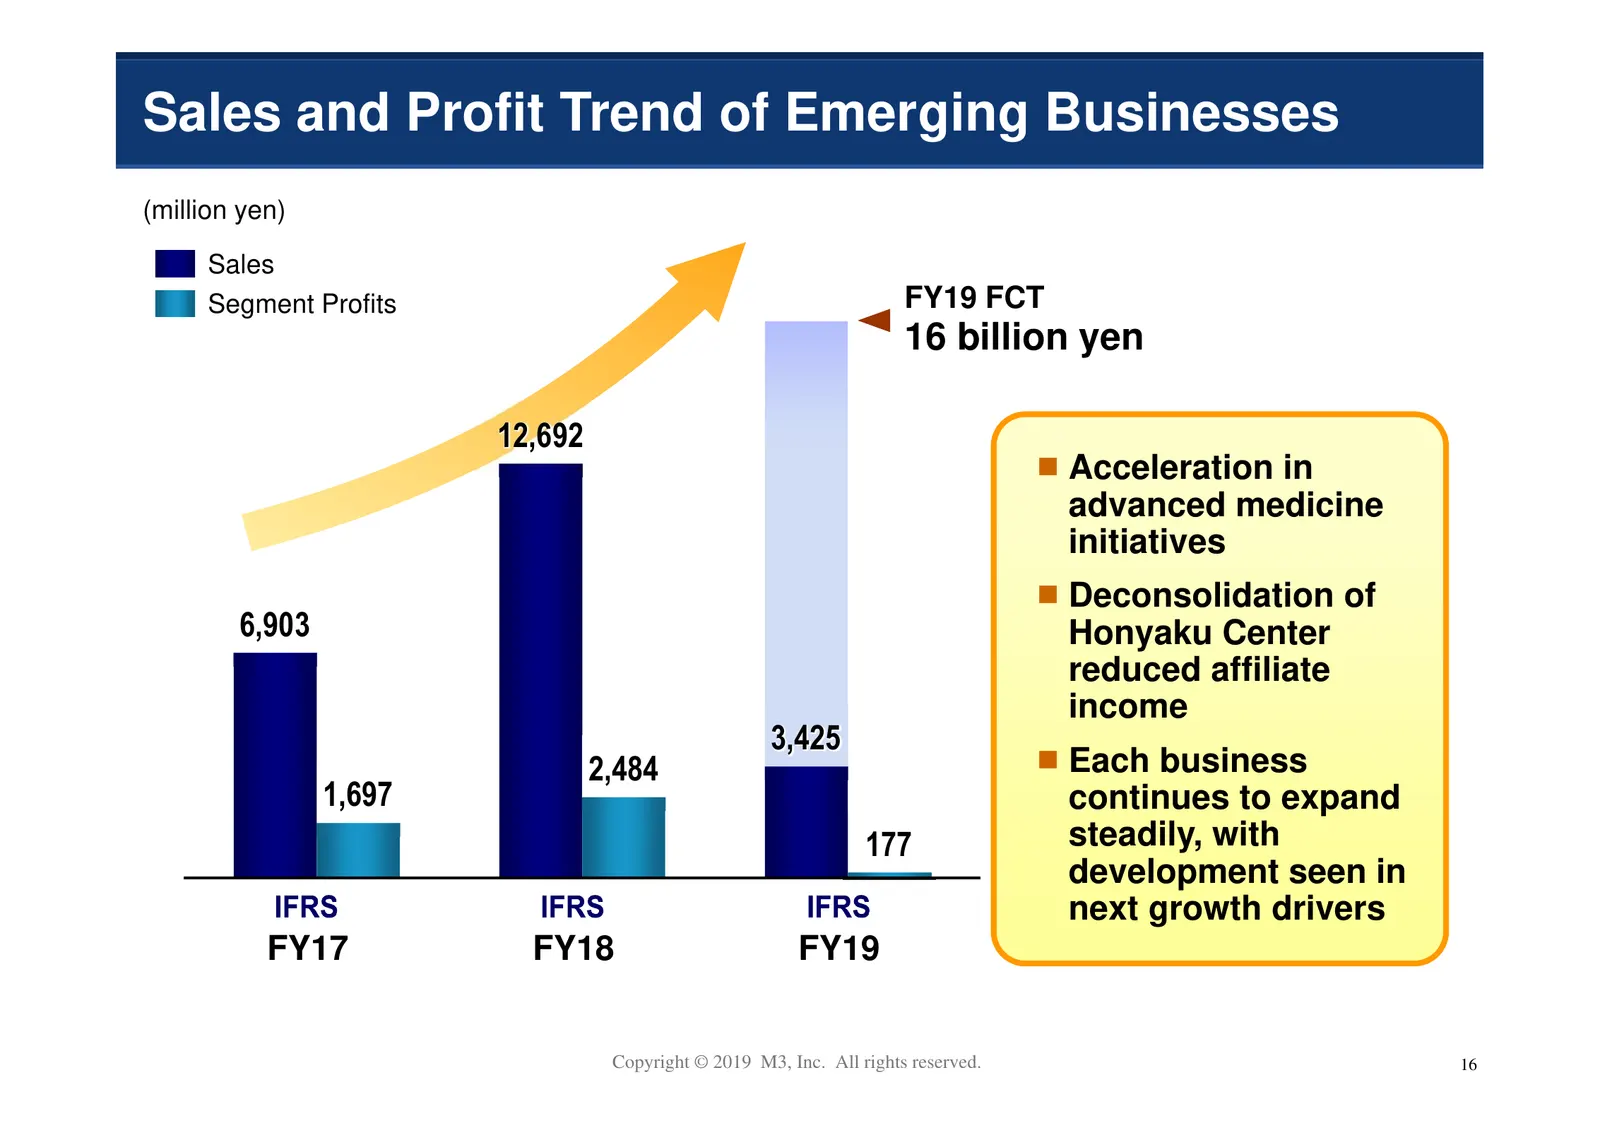
Sales and Profit Trend of Emerging Businesses (million yen) Sales Segment Profits FY19 FCT 16 billion yen 12,692 Acceleration in advanced medicine initiatives Deconsolidation of 6,903 Honyaku Center reduced affiliate income 3,425 2,484 Each business 1,697 continues to expand 177 steadily, with devel
Slide 18: Overseas
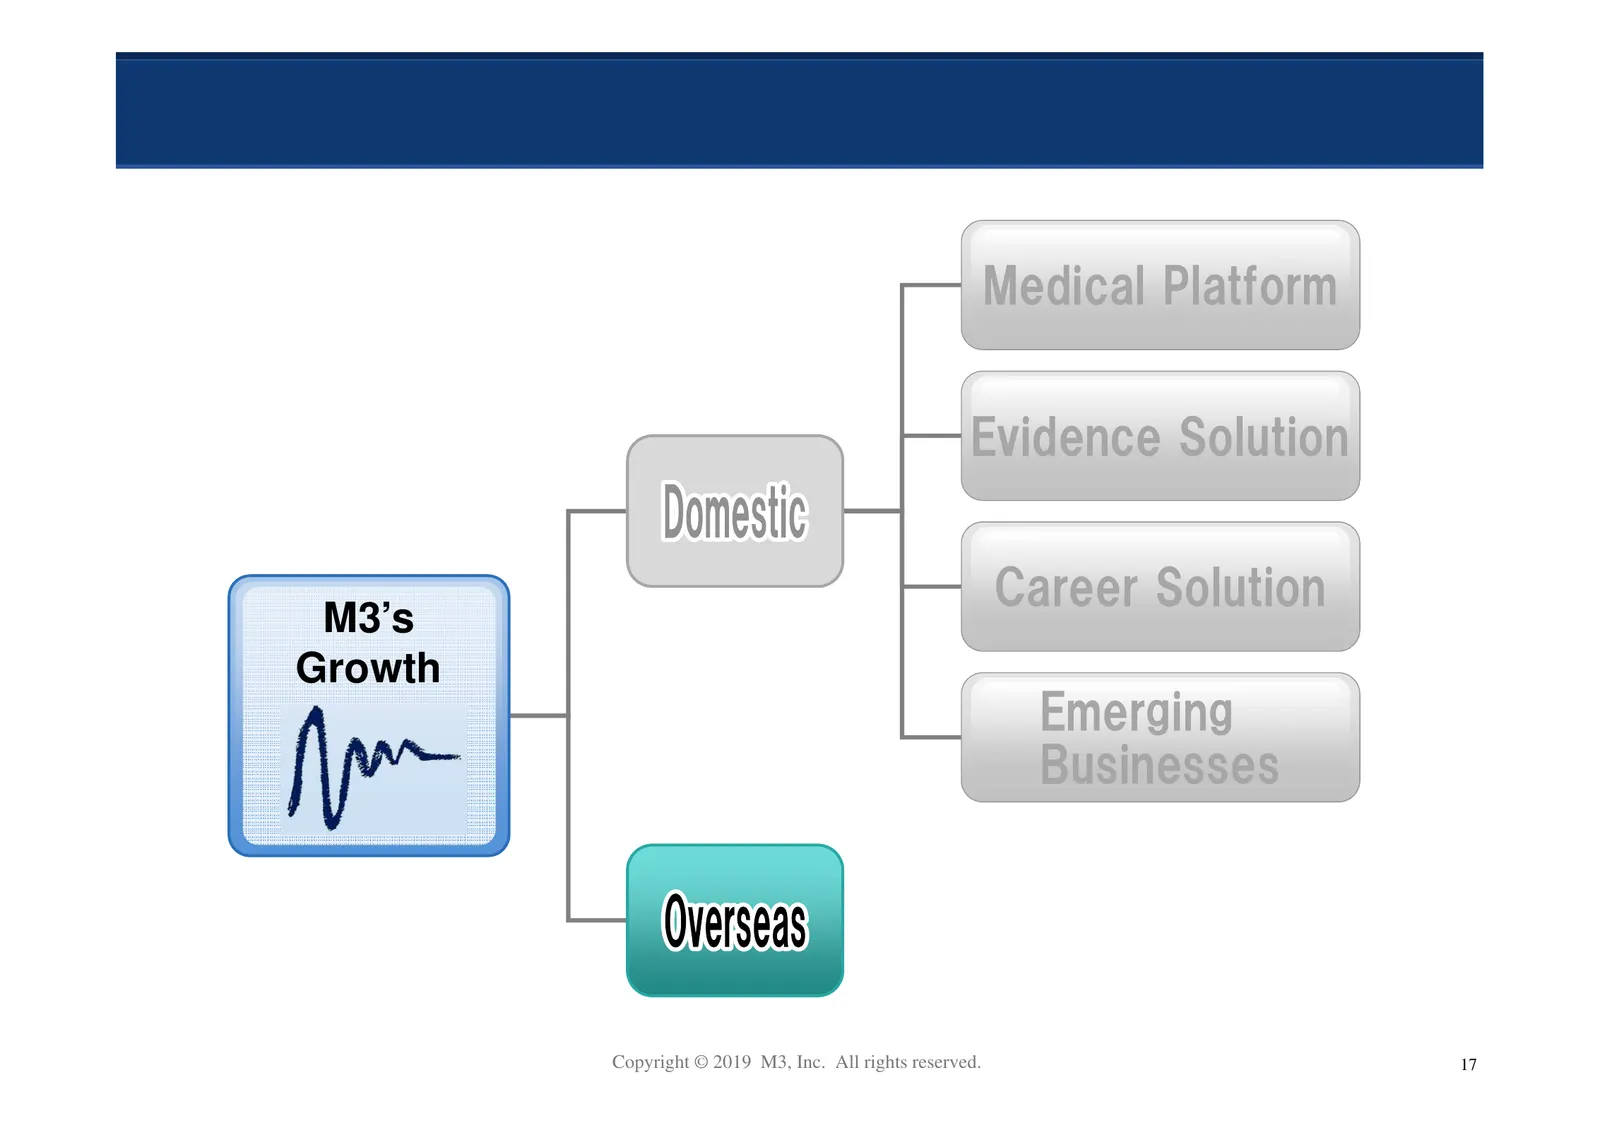
Medical Platform Evidence Solution Career Solution M3’s Growth Emerging Businesses Copyright © 2019 M3, Inc. All rights reserved. 17
Slide 19: Number of Physician Members and Panelists (Global)
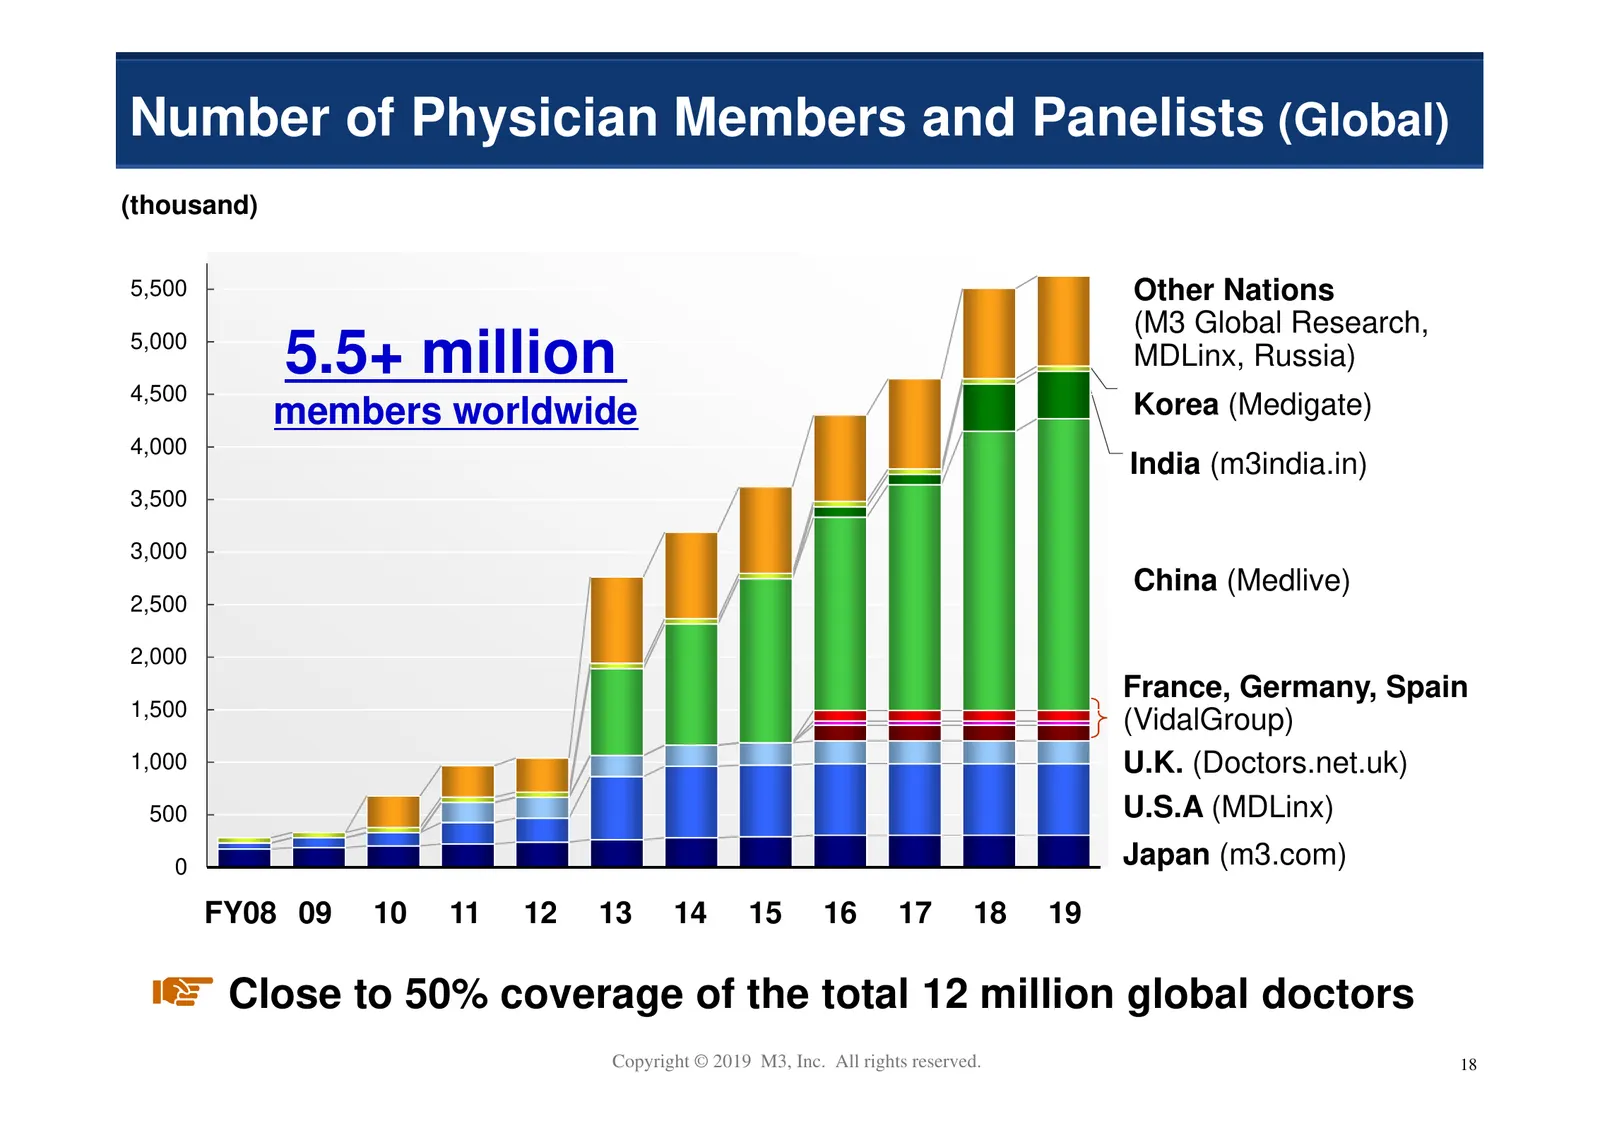
Number of Physician Members and Panelists (Global) (thousand) 5,500 Other Nations (M3 Global Research, 5,000 4,500 5.5+ million MDLinx, Russia) members worldwide Korea (Medigate) 4,000 India (m3india.in) 3,500 3,000 China (Medlive) 2,500 2,000 France, Germany, Spain 1,500 (VidalGroup) 1,000 U.K. (Do
Slide 20: Sales and Profit Trend of Overseas
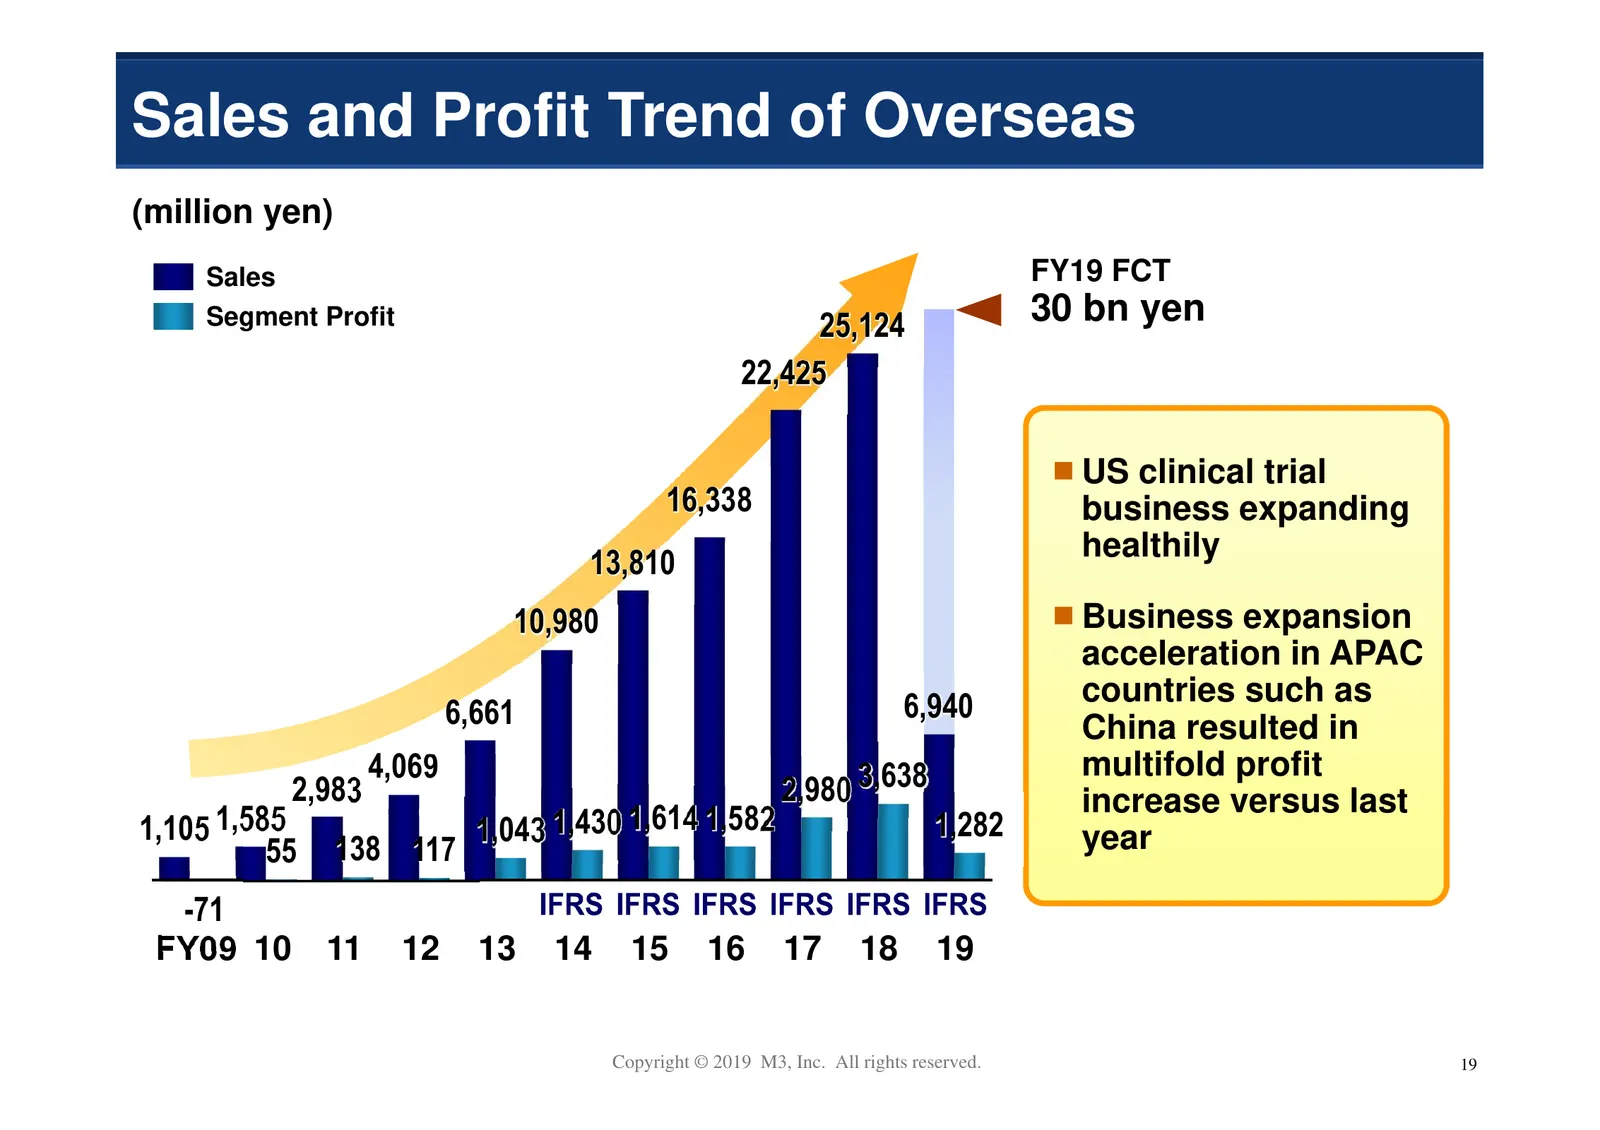
Sales and Profit Trend of Overseas (million yen) Sales FY19 FCT Segment Profit 25,124 30 bn yen 22,425 US clinical trial 16,338 business expanding healthily 13,810 10,980 Business expansion acceleration in APAC 6,940 countries such as 6,661 China resulted in 4,069 multifold profit 2,983 2,980 3,638
Slide 21: China: Membership Expansion
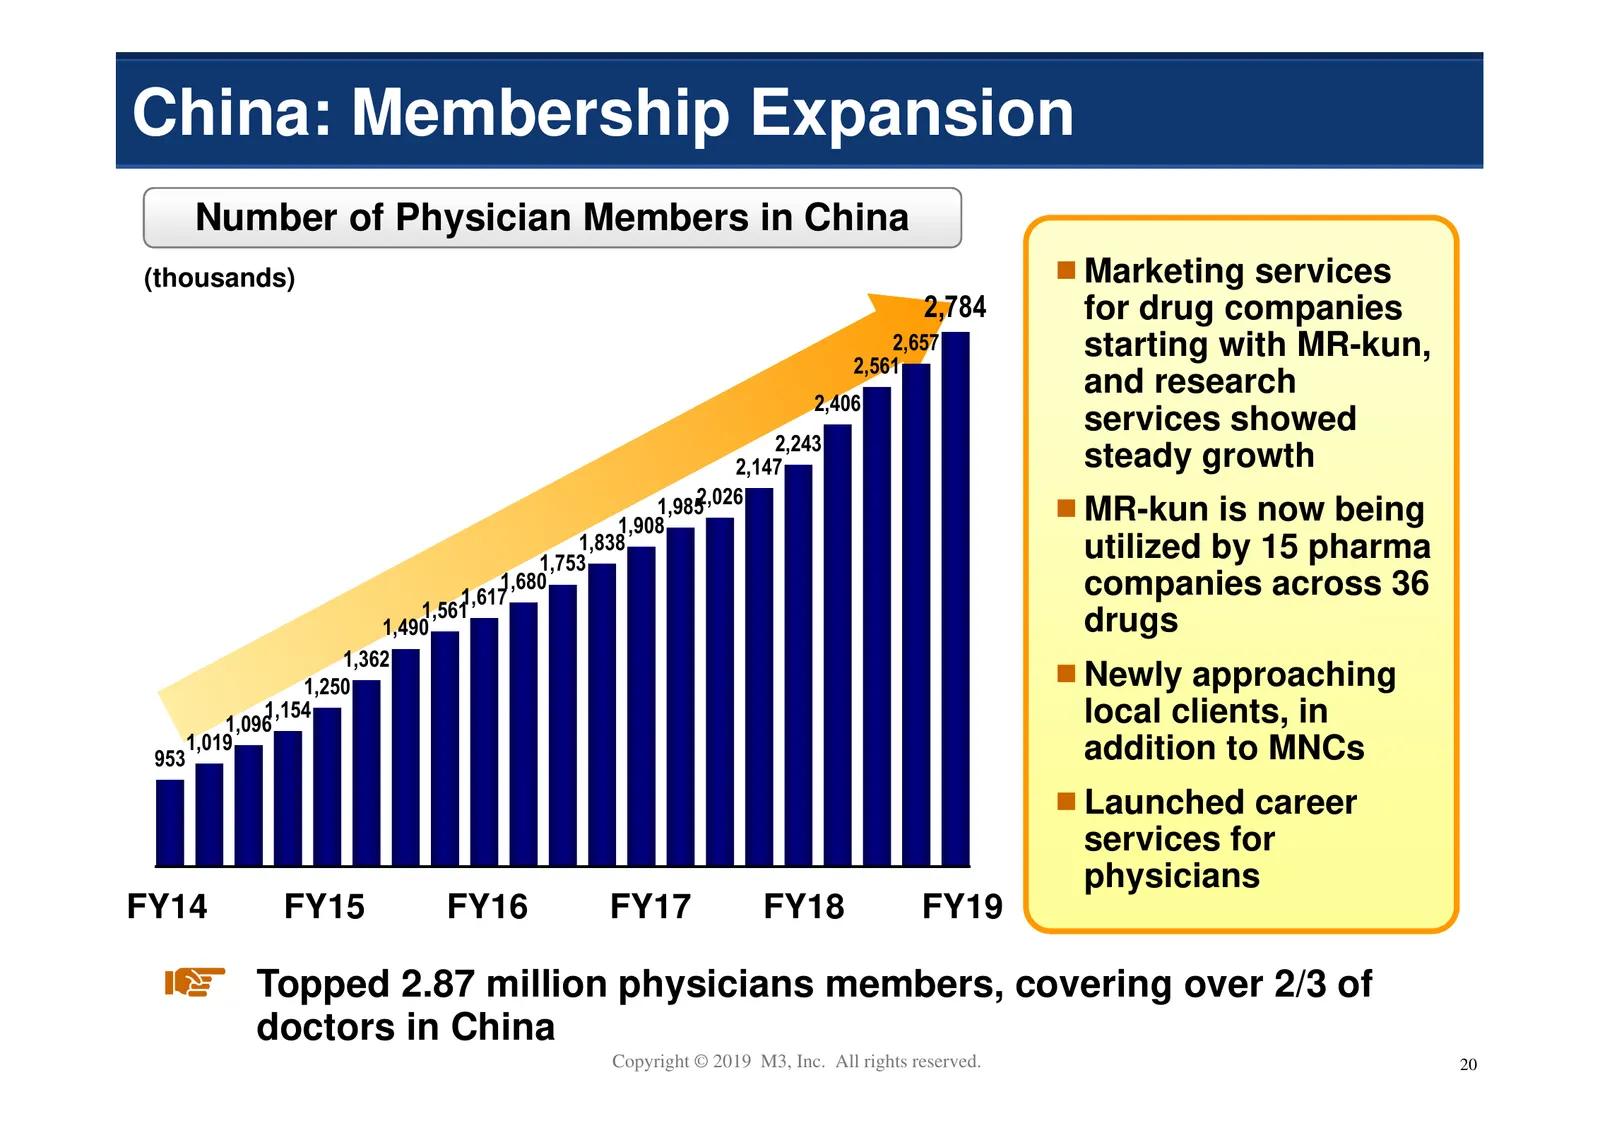
China: Membership Expansion Number of Physician Members in China (thousands) Marketing services 2,784 for drug companies 2,657 starting with MR-kun, 2,561 and research 2,406 services showed 2,243 2,147 steady growth 1,9852,026 MR-kun is now being 1,908 1,838 1,753 utilized by 15 pharma 1,680 1,617 c
Slide 22: US Clinical Trial Site Network Expansion
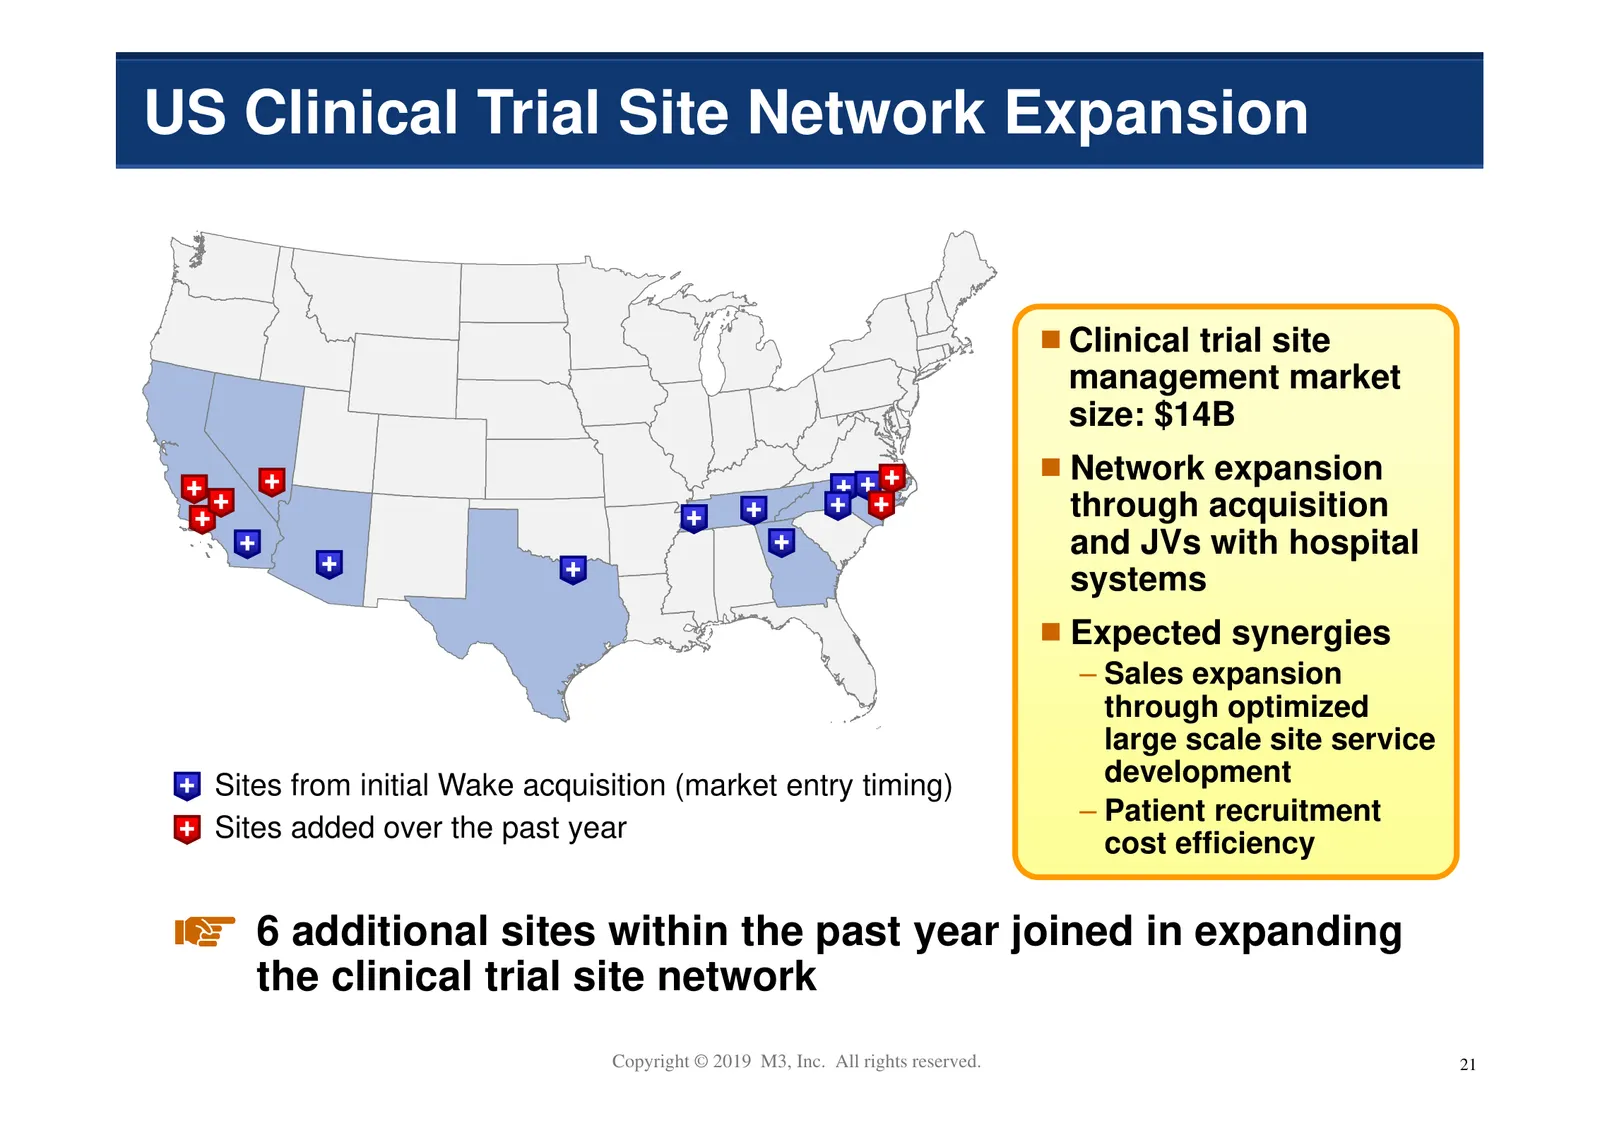
US Clinical Trial Site Network Expansion Clinical trial site management market size: $14B Network expansion through acquisition and JVs with hospital systems Expected synergies – Sales expansion through optimized large scale site service Sites from initial Wake acquisition (market entry timing) deve
Slide 23: New Initiatives Update
New Initiatives Update Copyright © 2019 M3, Inc. All rights reserved. 22
Slide 24: Newest Initiatives Update
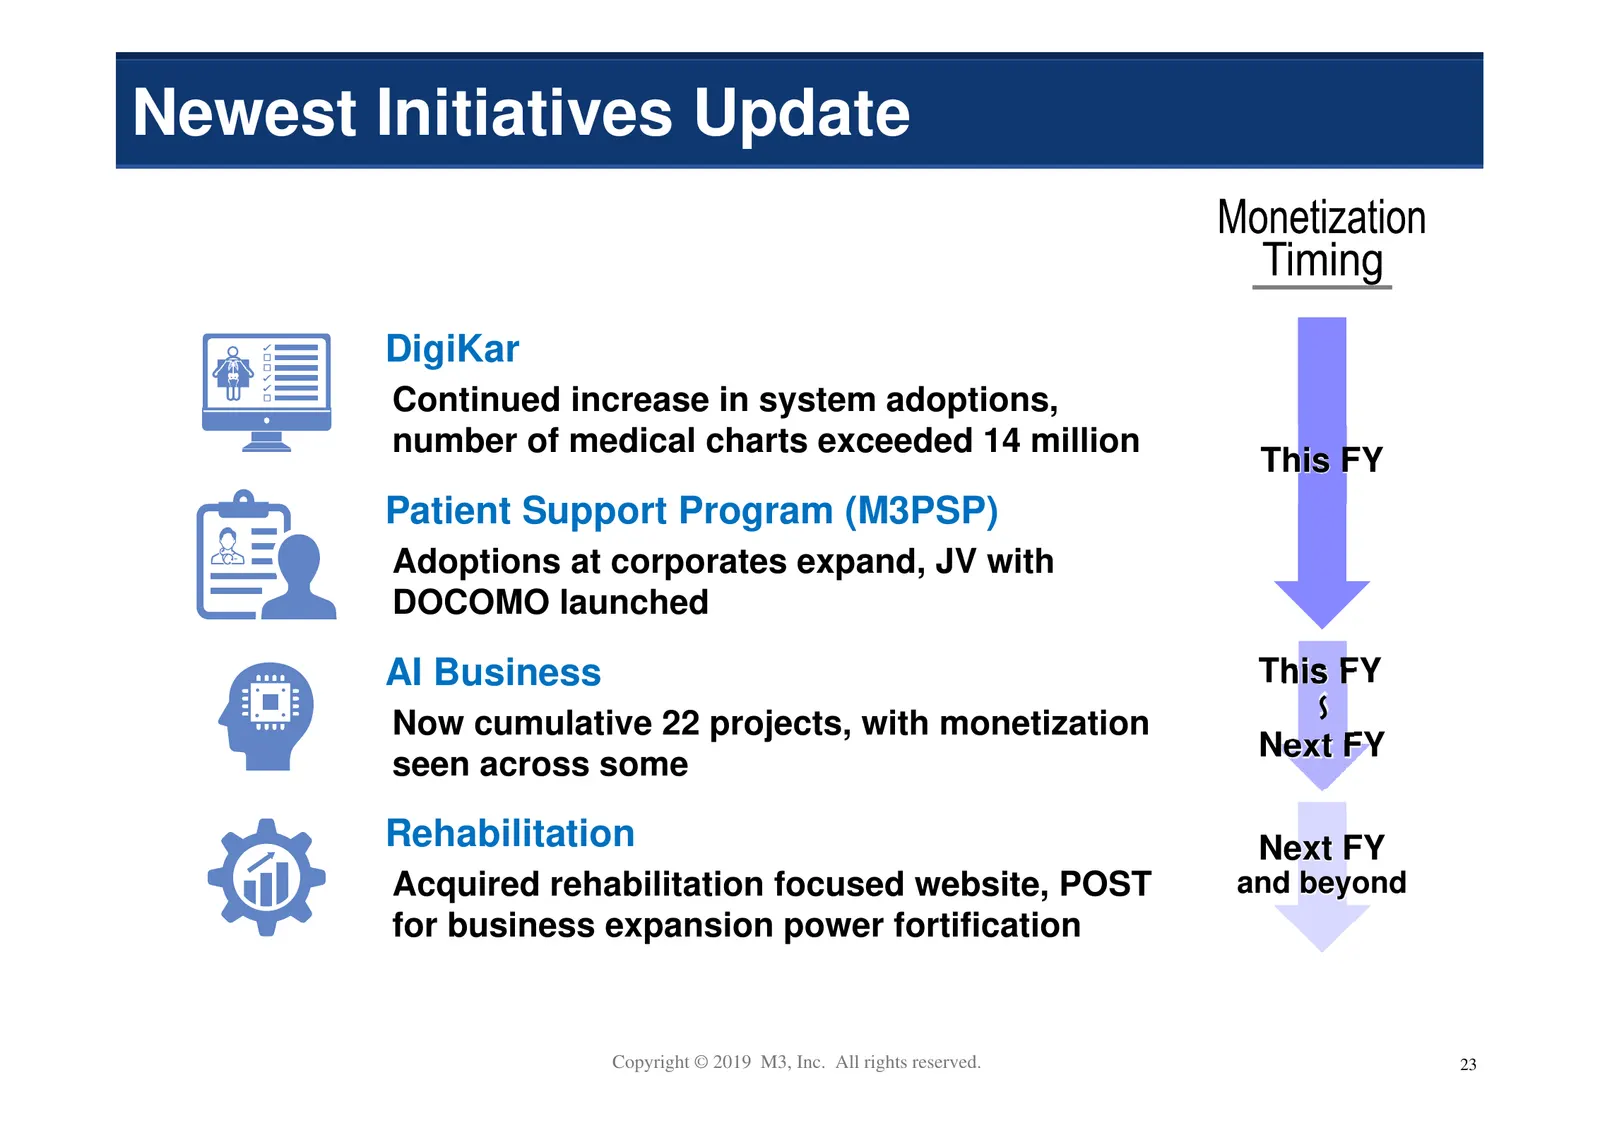
Newest Initiatives Update DigiKar Continued increase in system adoptions, number of medical charts exceeded 14 million This FY Patient Support Program (M3PSP) Adoptions at corporates expand, JV with DOCOMO launched AI Business This FY ~ Now cumulative 22 projects, with monetization Next FY seen acro
Slide 25: M3 DigiKar Acceleration
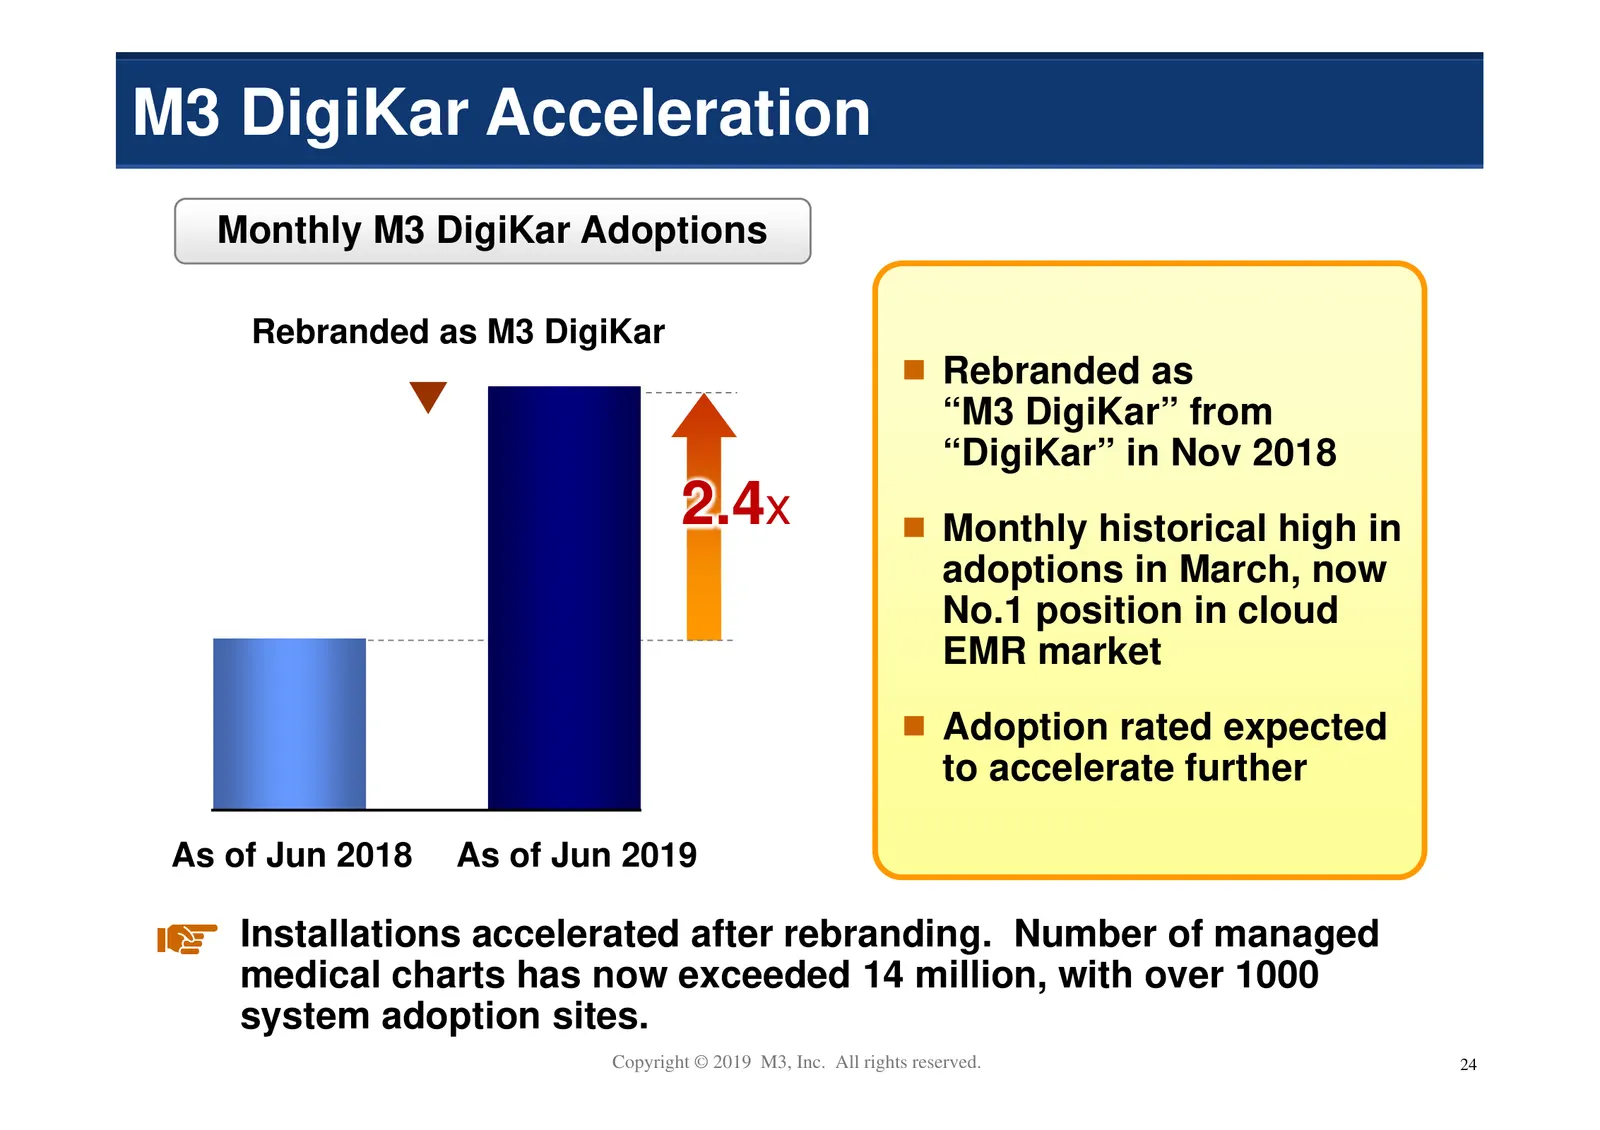
M3 DigiKar Acceleration Monthly M3 DigiKar Adoptions Rebranded as M3 DigiKar Rebranded as “M3 DigiKar” from “DigiKar” in Nov 2018 2.4x Monthly historical high in adoptions in March, now No.1 position in cloud EMR market Adoption rated expected to accelerate further As of Jun 2018 As of Jun 2019 Inst
Slide 26: M3PSP NPS Comparison with Industry Leaders
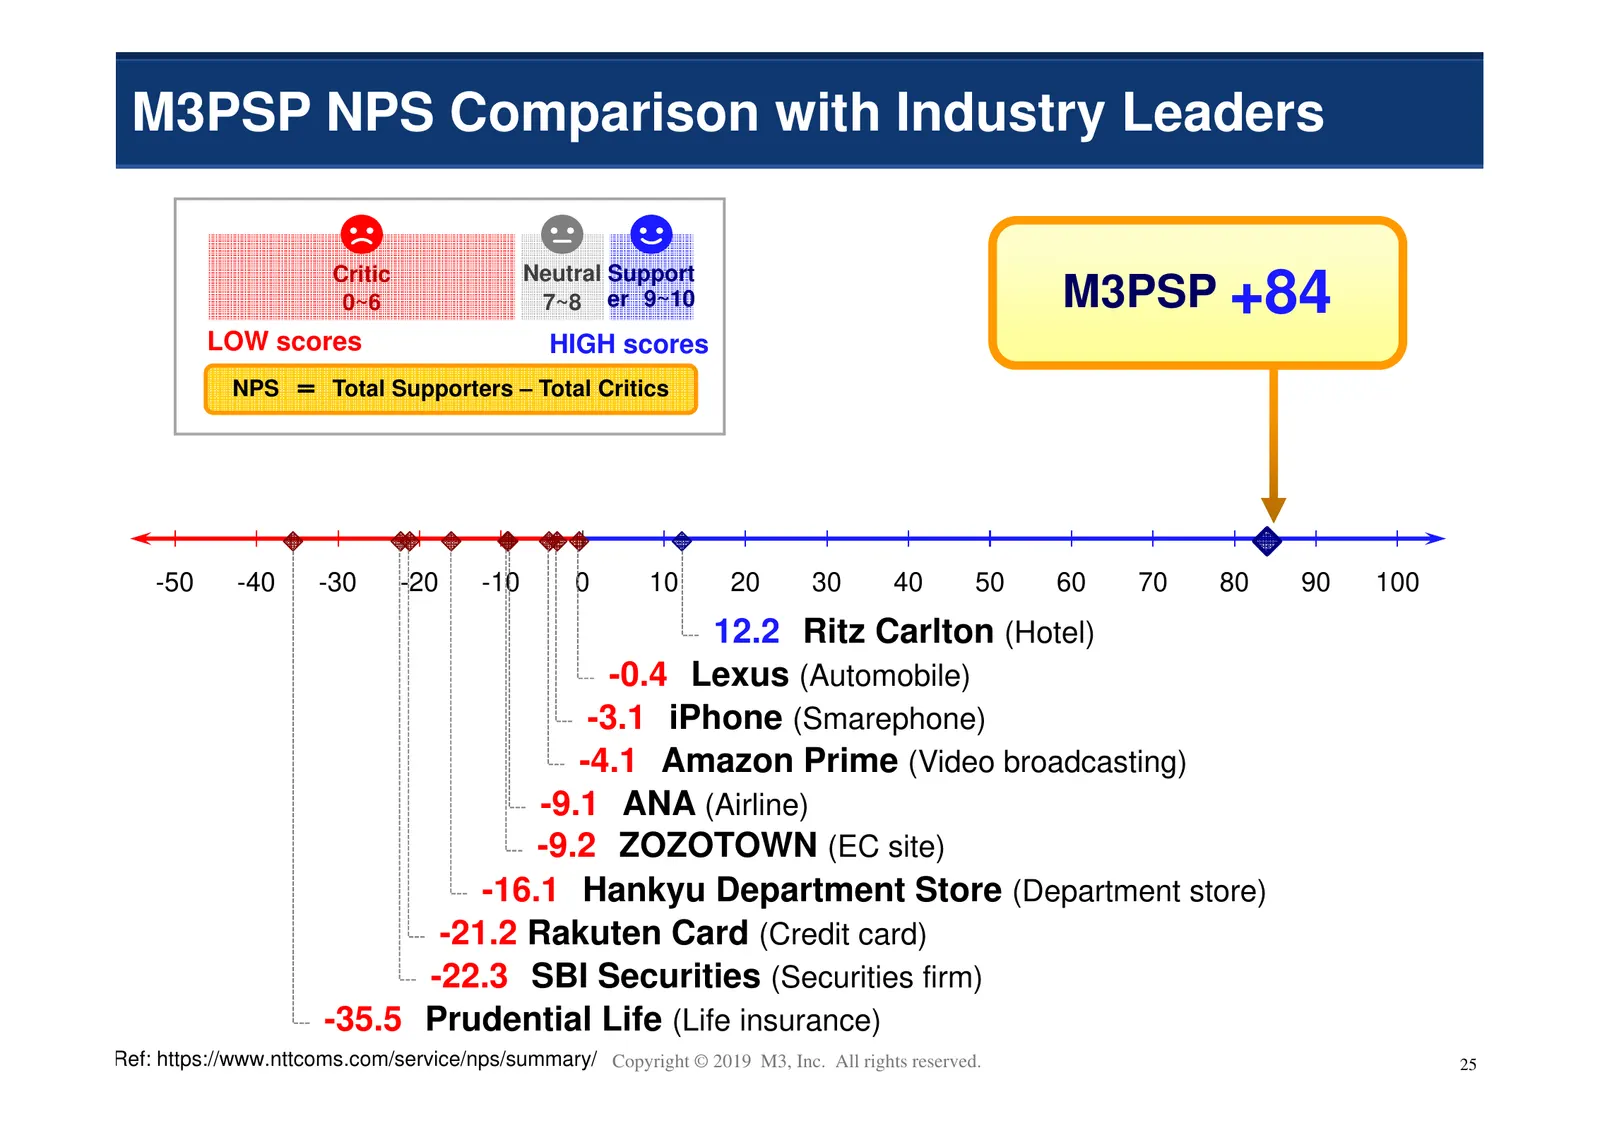
M3PSP NPS Comparison with Industry Leaders Critic Neutral Support 0~6 7~8 er 9~10 M3PSP +84 LOW scores HIGH scores NPS = Total Supporters – Total Critics -50 -40 -30 -20 -10 0 10 20 30 40 50 60 70 80 90 100 12.2 Ritz Carlton (Hotel) -0.4 Lexus (Automobile) -3.1 iPhone (Smarephone) -4.1 Amazon Prime
Slide 27: Rapid Increase in AI Project Pipeline
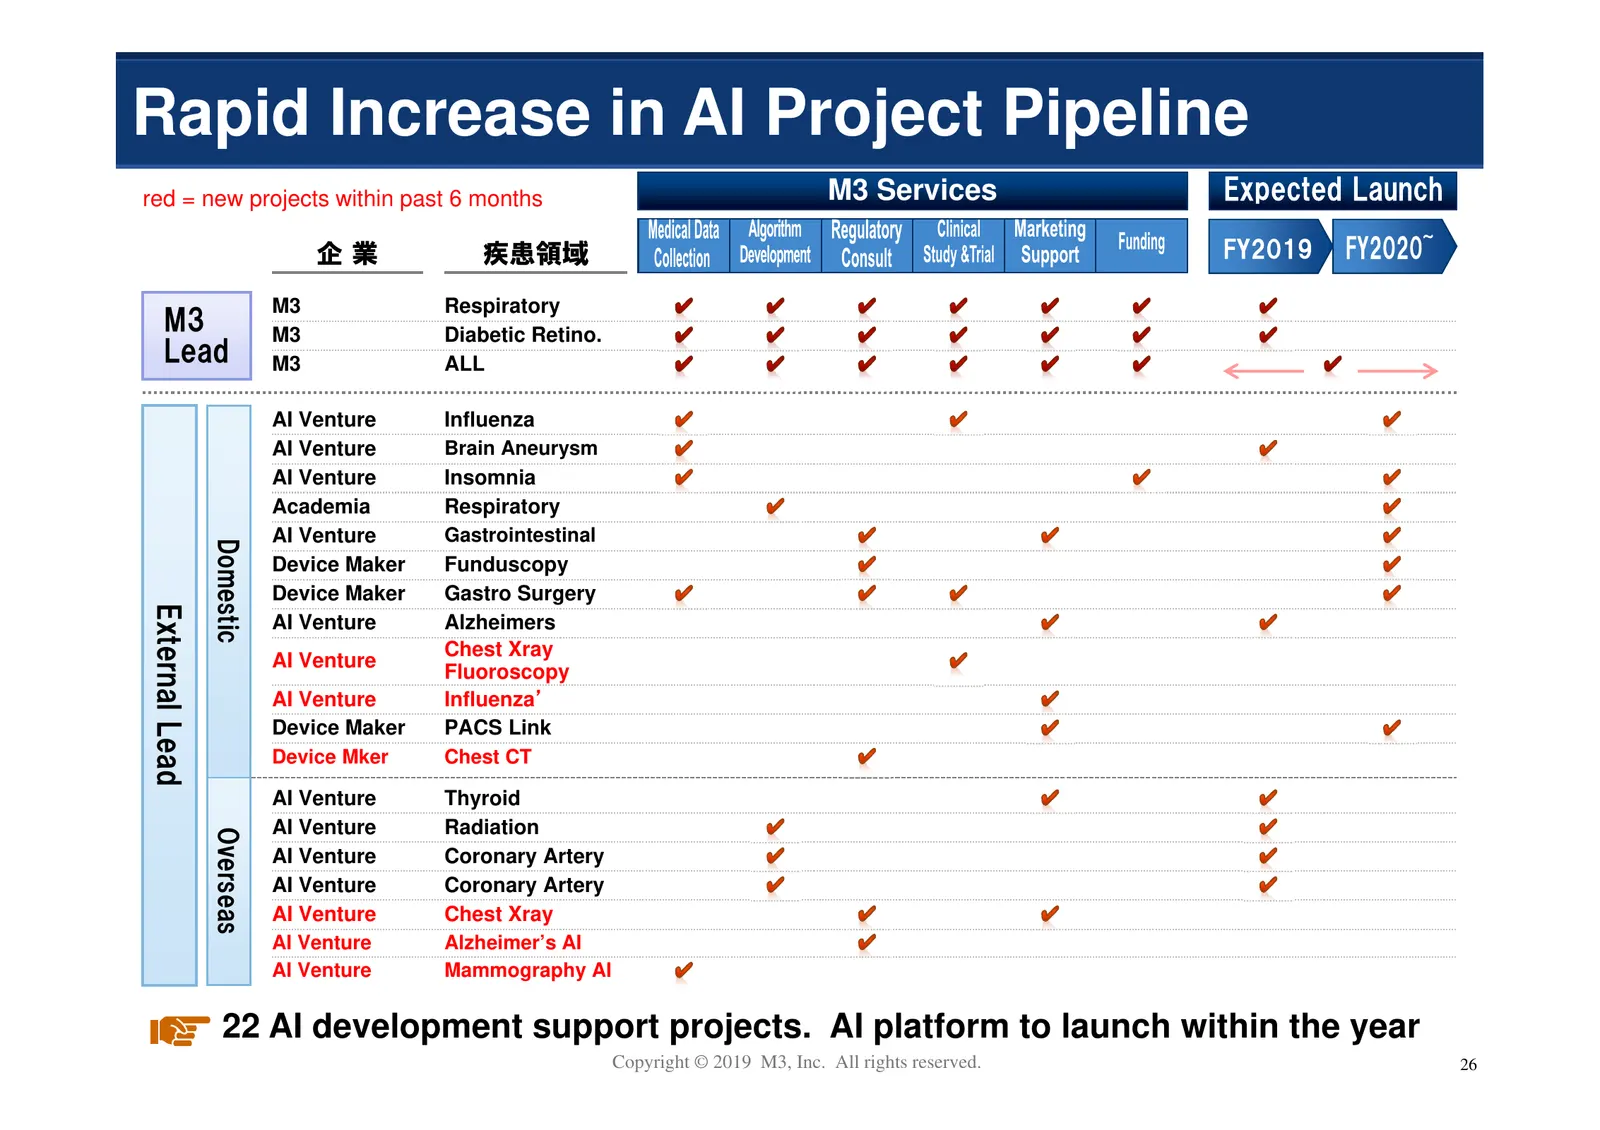
Rapid Increase in AI Project Pipeline red = new projects within past 6 months M3 Services 企業 疾患領域 M3 Respiratory M3 M3 Diabetic Retino. Lead M3 ALL AI Venture Influenza AI Venture Brain Aneurysm AI Venture Insomnia Academia Respiratory AI Venture Gastrointestinal Domestic Device Maker Funduscopy Dev
Slide 28: Acquisition of Rehabilitation Media Site, POST
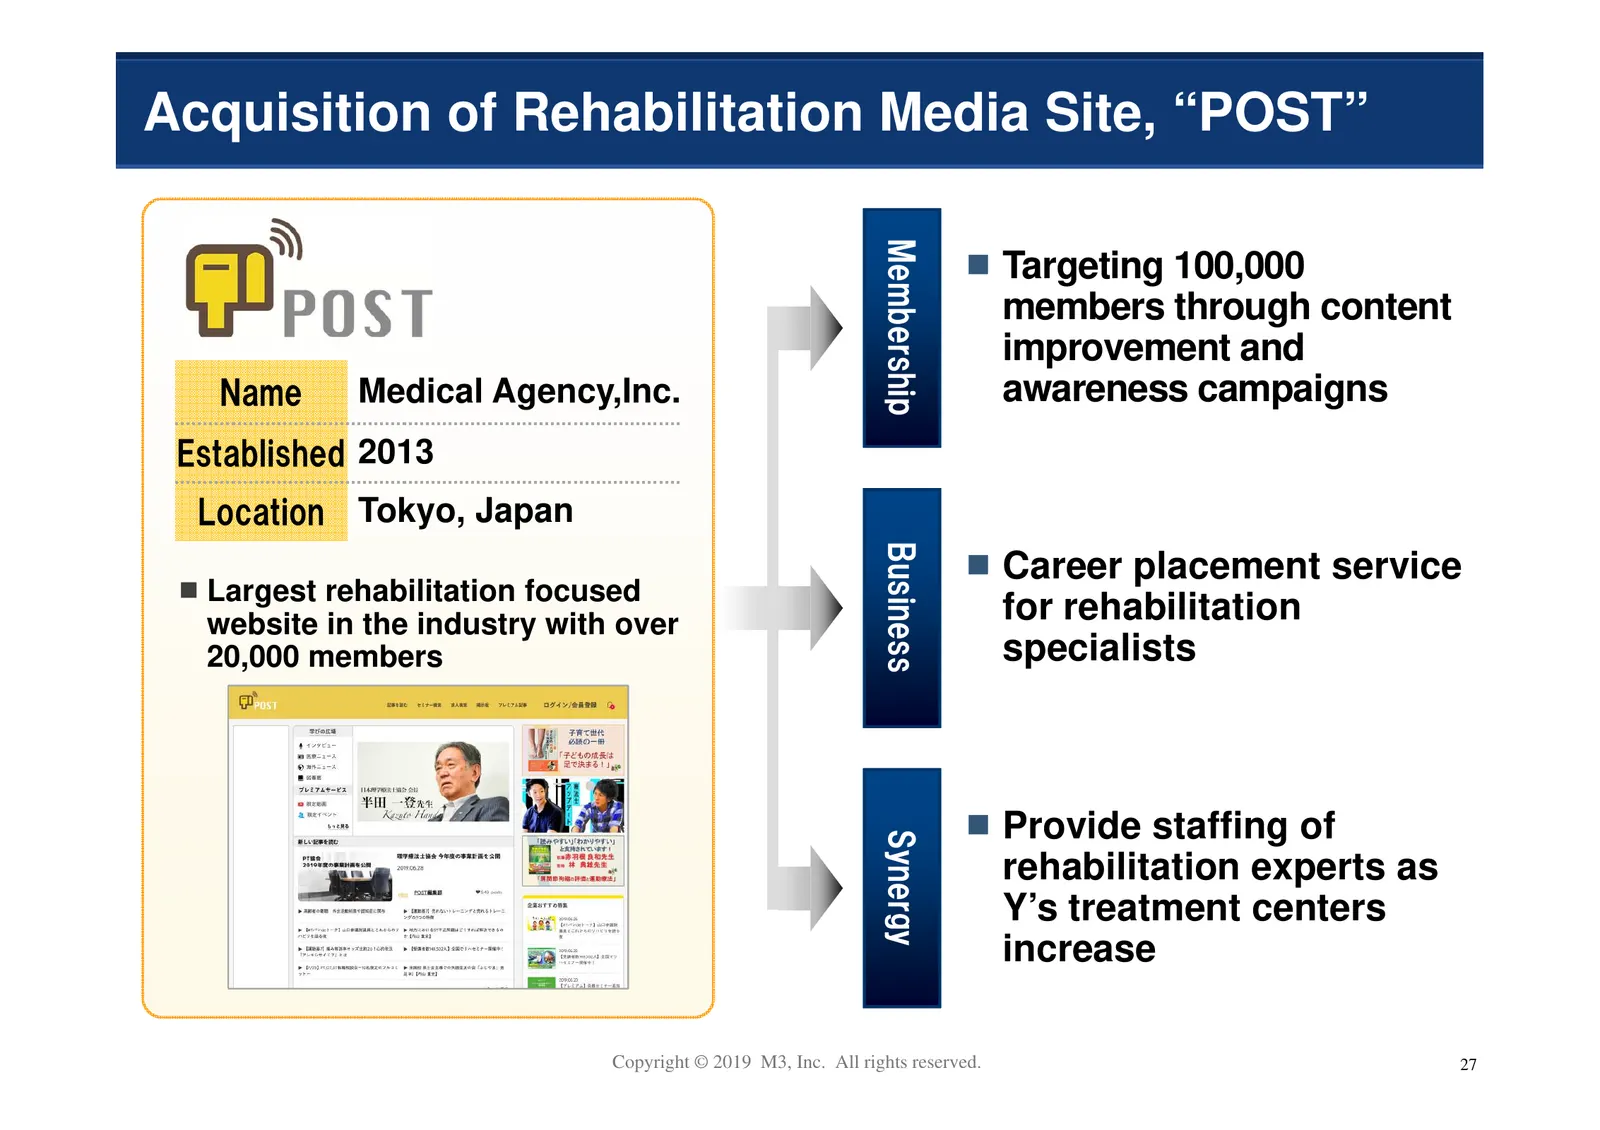
Acquisition of Rehabilitation Media Site, “POST” Membership Targeting 100,000 members through content improvement and Name Medical Agency,Inc. awareness campaigns Established 2013 Location Tokyo, Japan Business Career placement service Largest rehabilitation focused website in the industry with over
Slide 29: Business Scope Expansion and Growth Potential
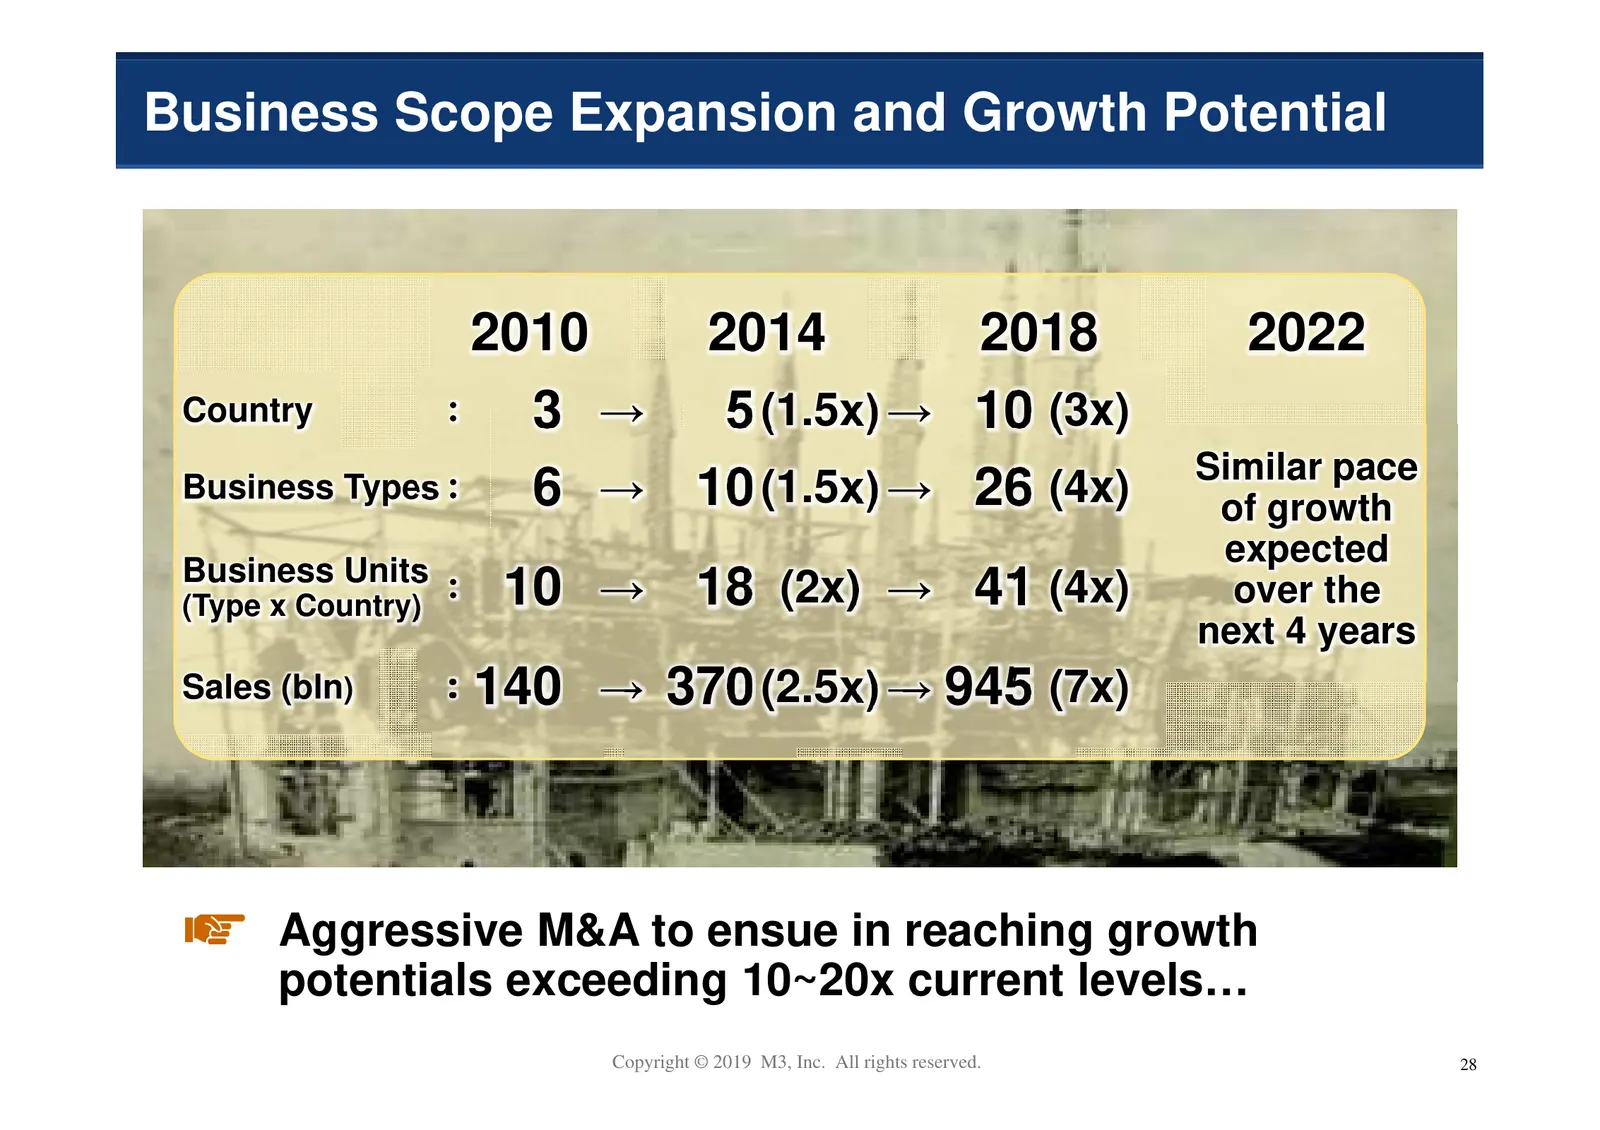
Business Scope Expansion and Growth Potential 2010 2014 2018 2022 Country : 3 → 5 (1.5x) → 10 (3x) Similar pace Business Types : 6 → 10 (1.5x) → 26 (4x) of growth expected Business Units : (Type x Country) 10 → 18 (2x) → 41 (4x) over the next 4 years Sales (bln) : 140 → 370 (2.5x) → 945 (7x) Aggress
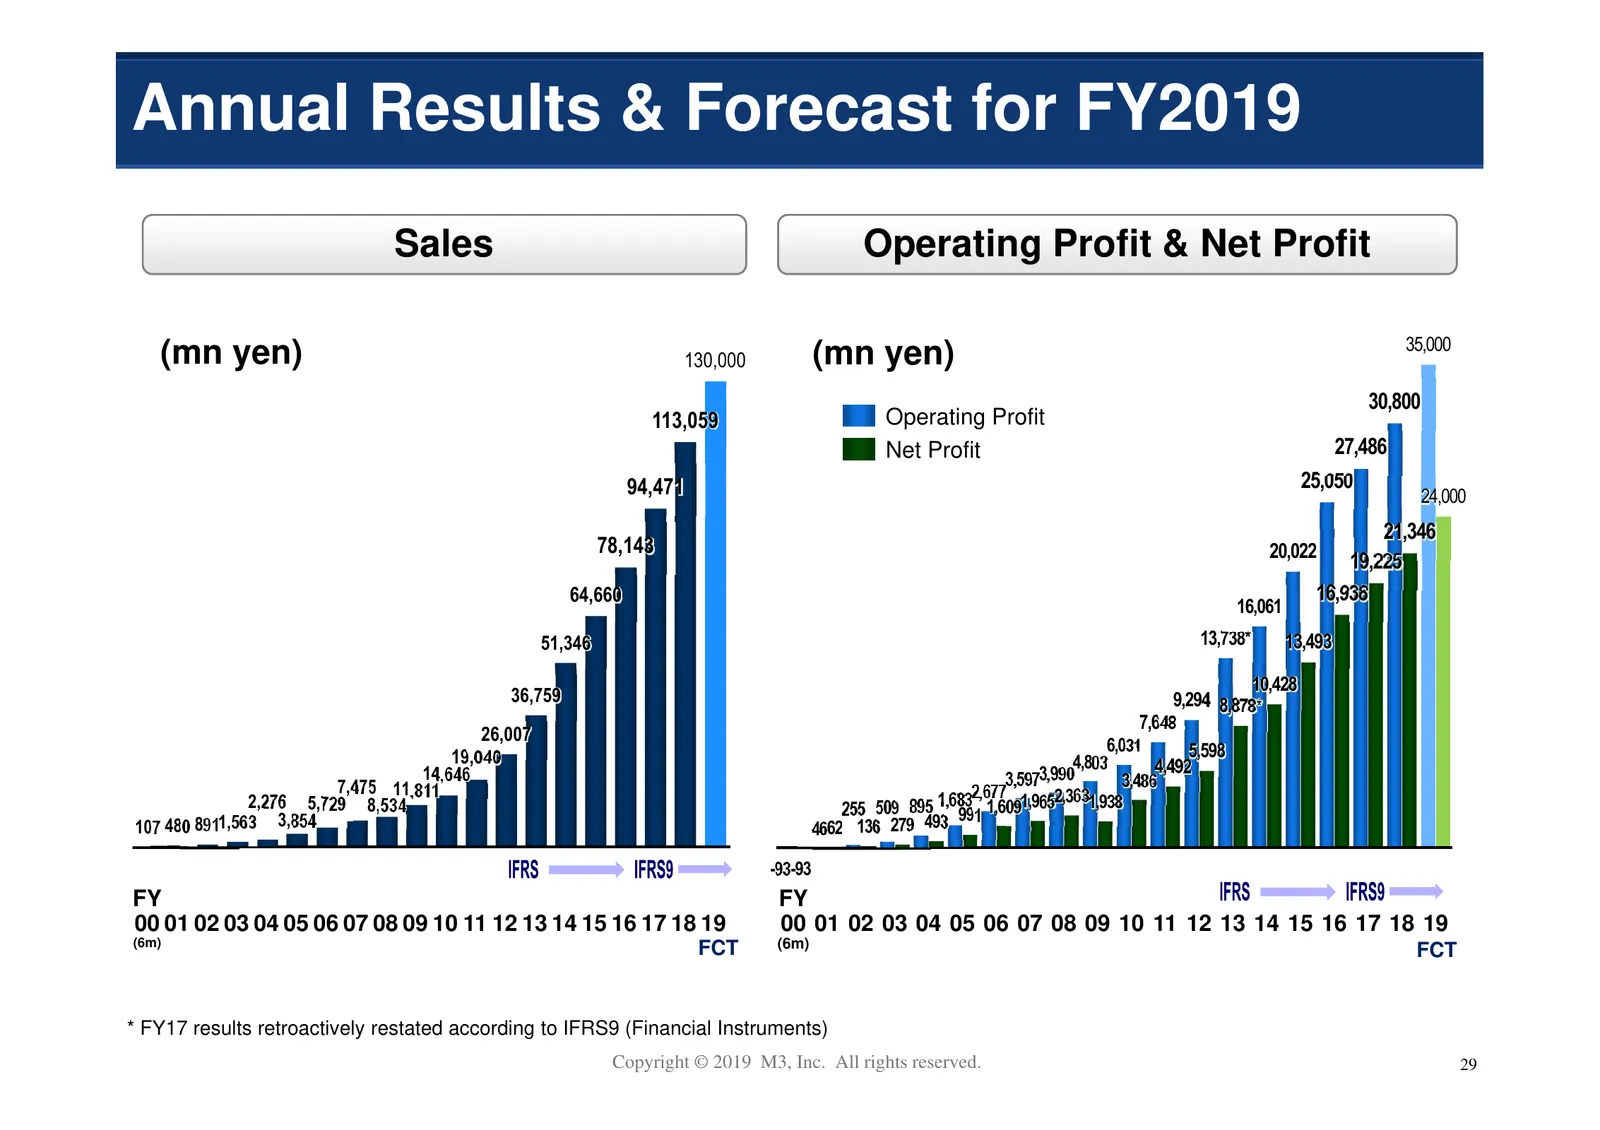
Slide 30: Annual Results & Forecast for FY2019
Annual Results & Forecast for FY2019 Sales Operating Profit & Net Profit 35,000 (mn yen) 130,000 (mn yen) 30,800 113,059 Operating Profit Net Profit 27,486 94,471 25,050 24,000 21,346 78,143 20,022 19,225 64,660 16,938 16,061 51,346 13,738* 13,493 10,428 36,759 9,294 8,878* 7,648 26,007 6,031 5,598
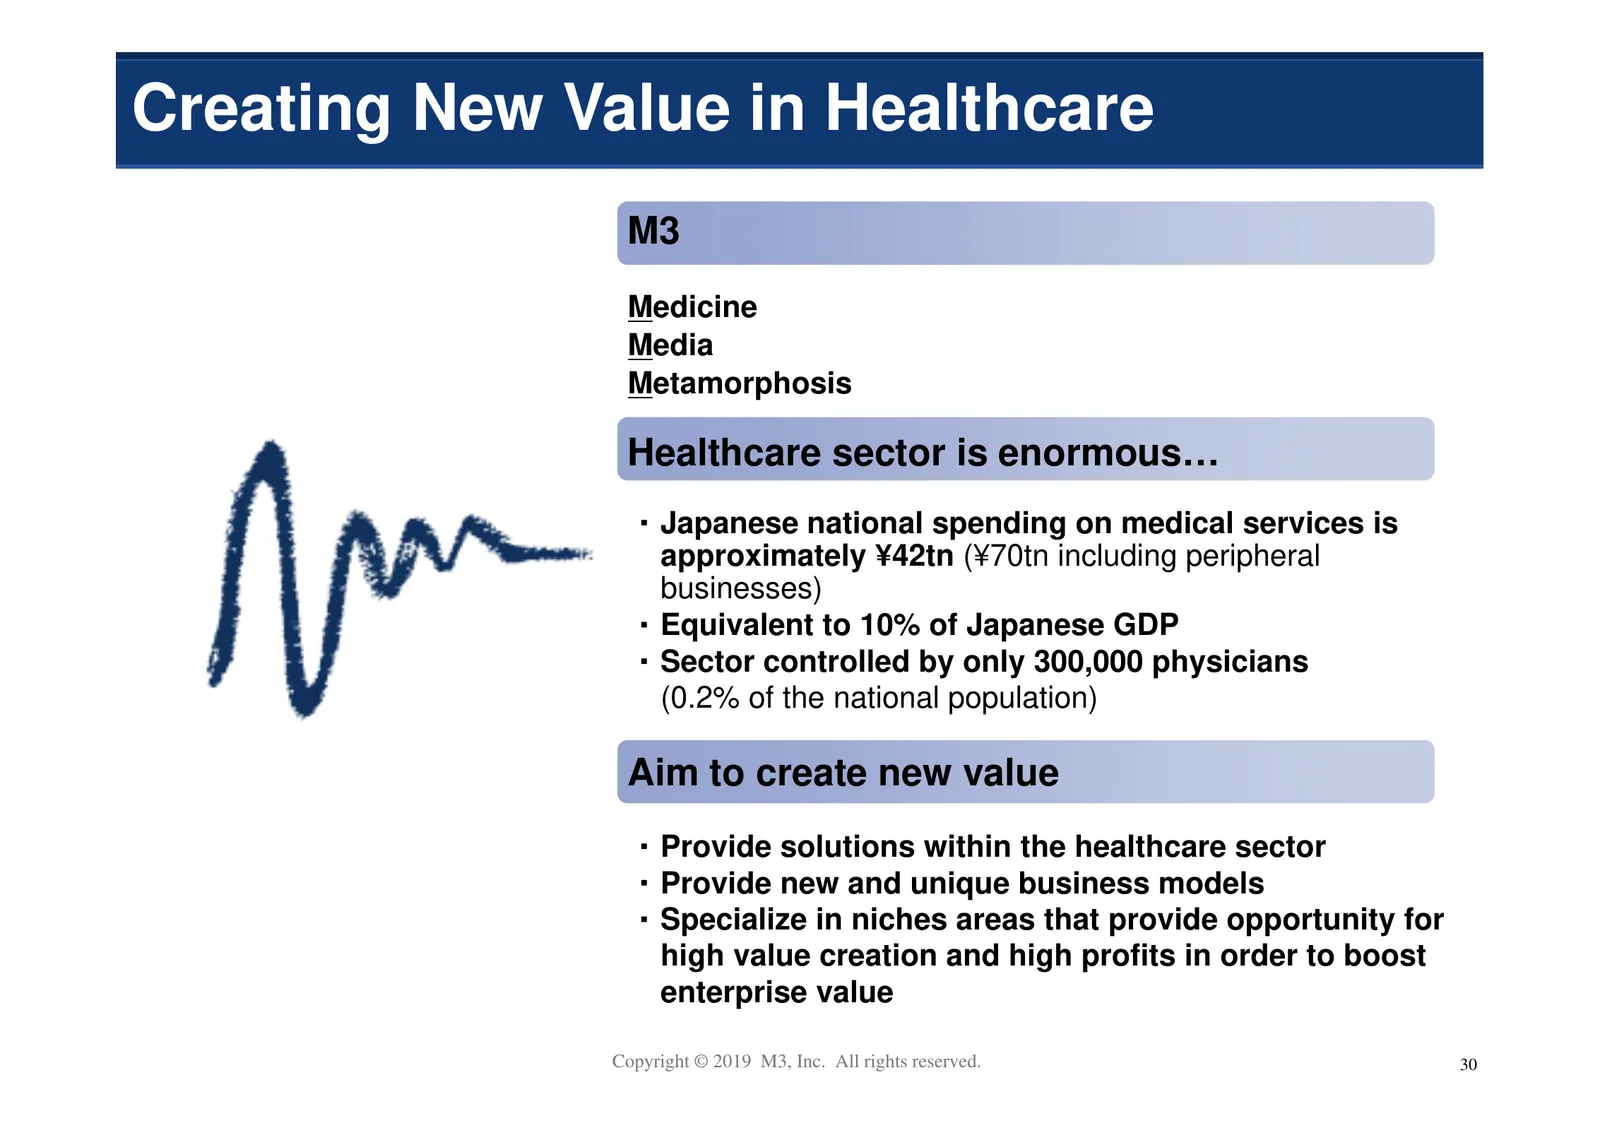
Slide 31: Creating New Value in Healthcare
Creating New Value in Healthcare M3 Medicine Media Metamorphosis Healthcare sector is enormous… ・ Japanese national spending on medical services is approximately ¥42tn (¥70tn including peripheral businesses) ・ Equivalent to 10% of Japanese GDP ・ Sector controlled by only 300,000 physicians (0.2% of
Source: Internet Archive copy of corporate.m3.com
More decks from M3, Inc.
 Investor Presentation (November 2026)8 slides · Nov 20, 2026
 H1 FY2026 Earnings Presentation44 slides · Nov 4, 2026
 Q2 FY2026 Earnings Presentation44 slides · Nov 4, 2026
 Q1 FY2026 Earnings Presentation42 slides · Aug 6, 2026
 Merger or Acquisition (June 2026)14 slides · Jun 5, 2026
 FY2025 Earnings Presentation54 slides · May 1, 2026