Hellenic Telecommunications Organization SA · ATHEX:HTO
Hellenic Telecommunications Organization SA — Cosmote — FY2006 Earnings Presentation
21 slides from Hellenic Telecommunications Organization SA's earnings presentation, February 2007
Slide 1: Full Year 2006 results: Impressive Growth Across the Board
Full Year 2006 results: Impressive Growth Across the Board February 2007 Visit our website: www.cosmote.com
Slide 2: Group Performance
Group Performance COSMOTE
Slide 3: The trends driving growth
The trends driving growth ¾ In an environment of similar competitive offerings, distribution is increasingly becoming the key market issue. In this field, GERMANOS is a major driver for COSMOTE’s ongoing aggressive subscriber growth ¾ Voice traffic is growing in all markets, driven by steady trends
Slide 4: 2006 Financial Highlights
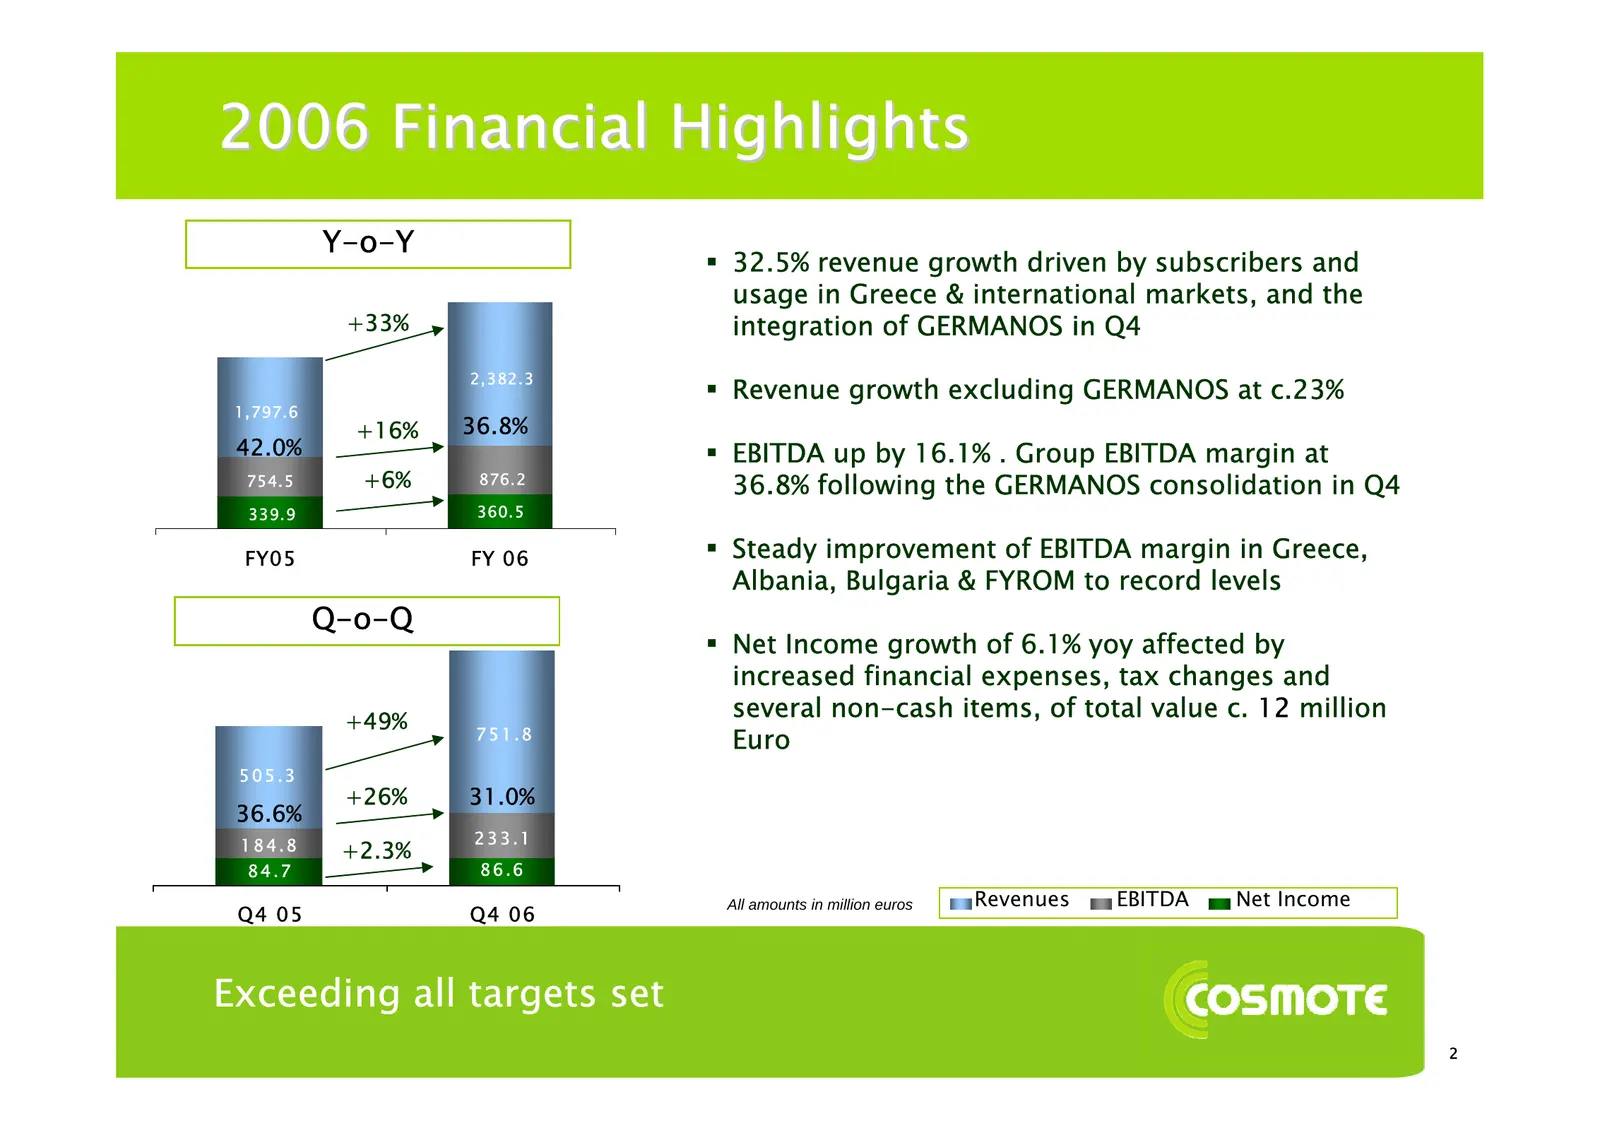
2006 Financial Highlights Y-o-Y 32.5% revenue growth driven by subscribers and usage in Greece & international markets, and the +33% integration of GERMANOS in Q4 2,382.3 Revenue growth excluding GERMANOS at c.23% 1,797.6 +16% 36.8% 42.0% EBITDA up by 16.1% . Group EBITDA margin at 754.5 +6% 8
Slide 5: 2006 Operational Highlights
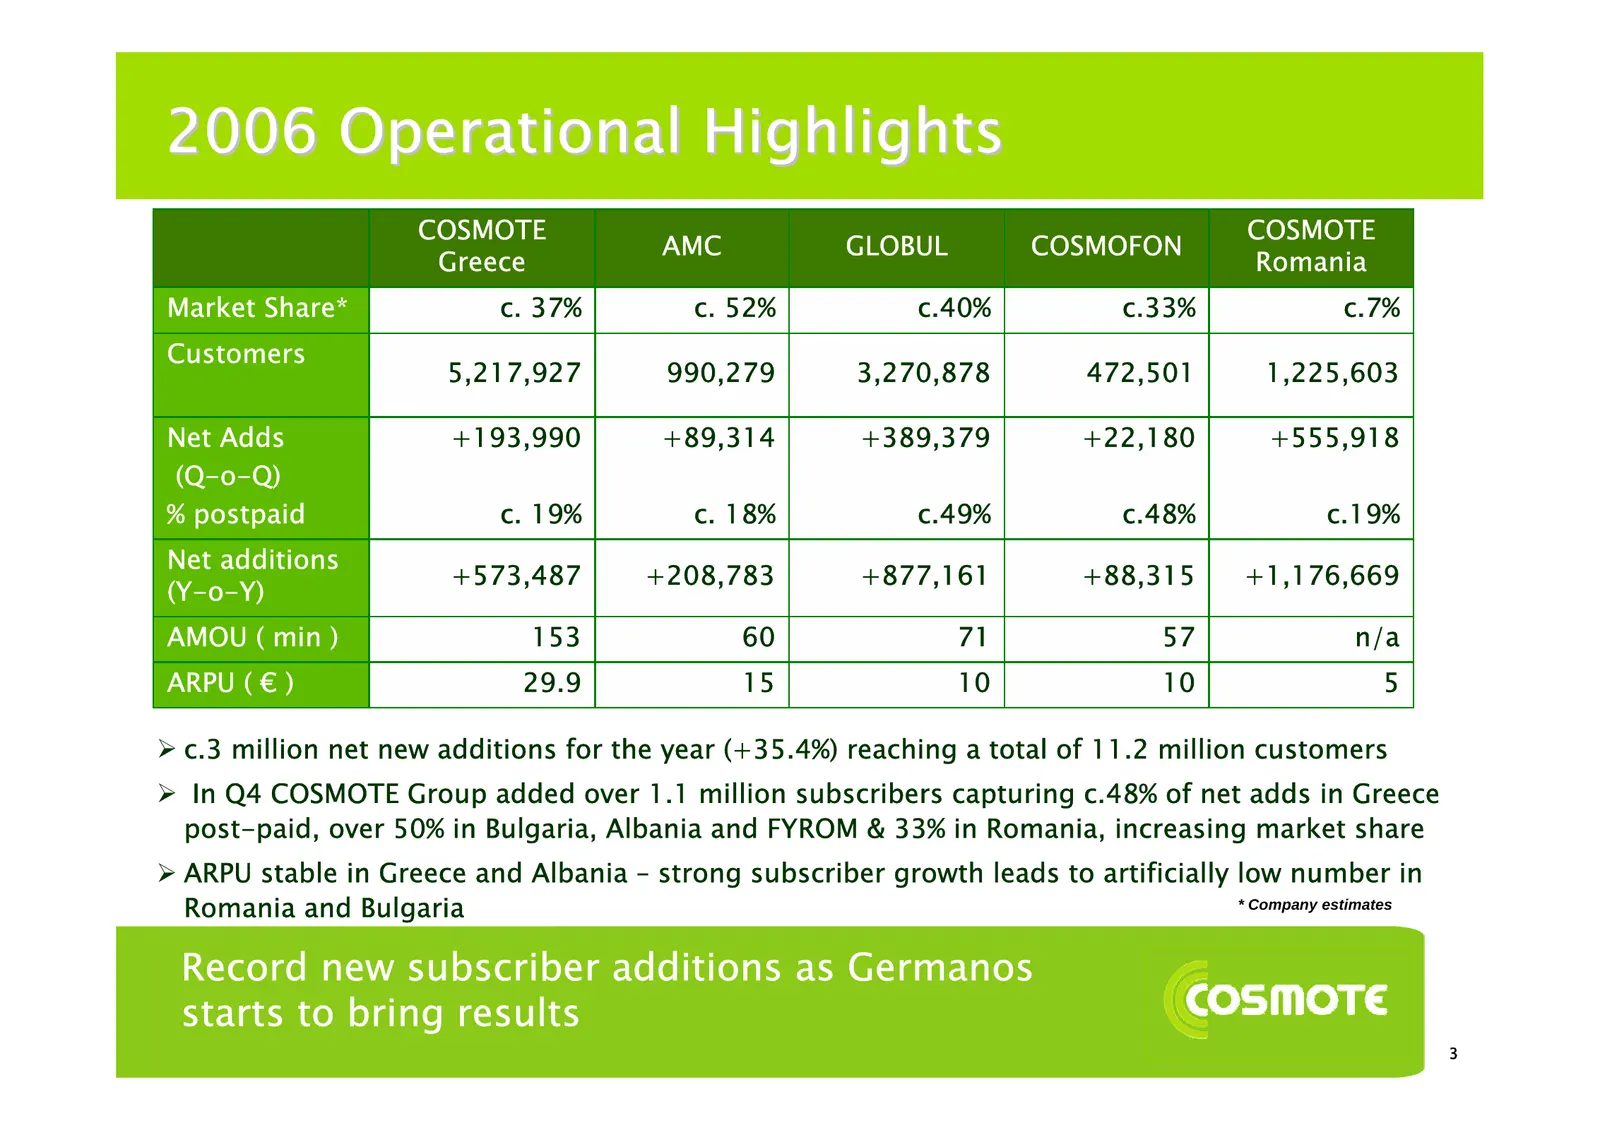
2006 Operational Highlights COSMOTE COSMOTE AMC GLOBUL COSMOFON Greece Romania Market Share* c. 37% c. 52% c.40% c.33% c.7% Customers 5,217,927 990,279 3,270,878 472,501 1,225,603 Net Adds +193,990 +89,314 +389,379 +22,180 +555,918 (Q-o-Q) % postpaid c. 19% c. 18% c.49% c.48% c.19% Net additions +57
Slide 6: Operational & Financial Review
Operational & Financial Review
Slide 7: COSMOTE Greece
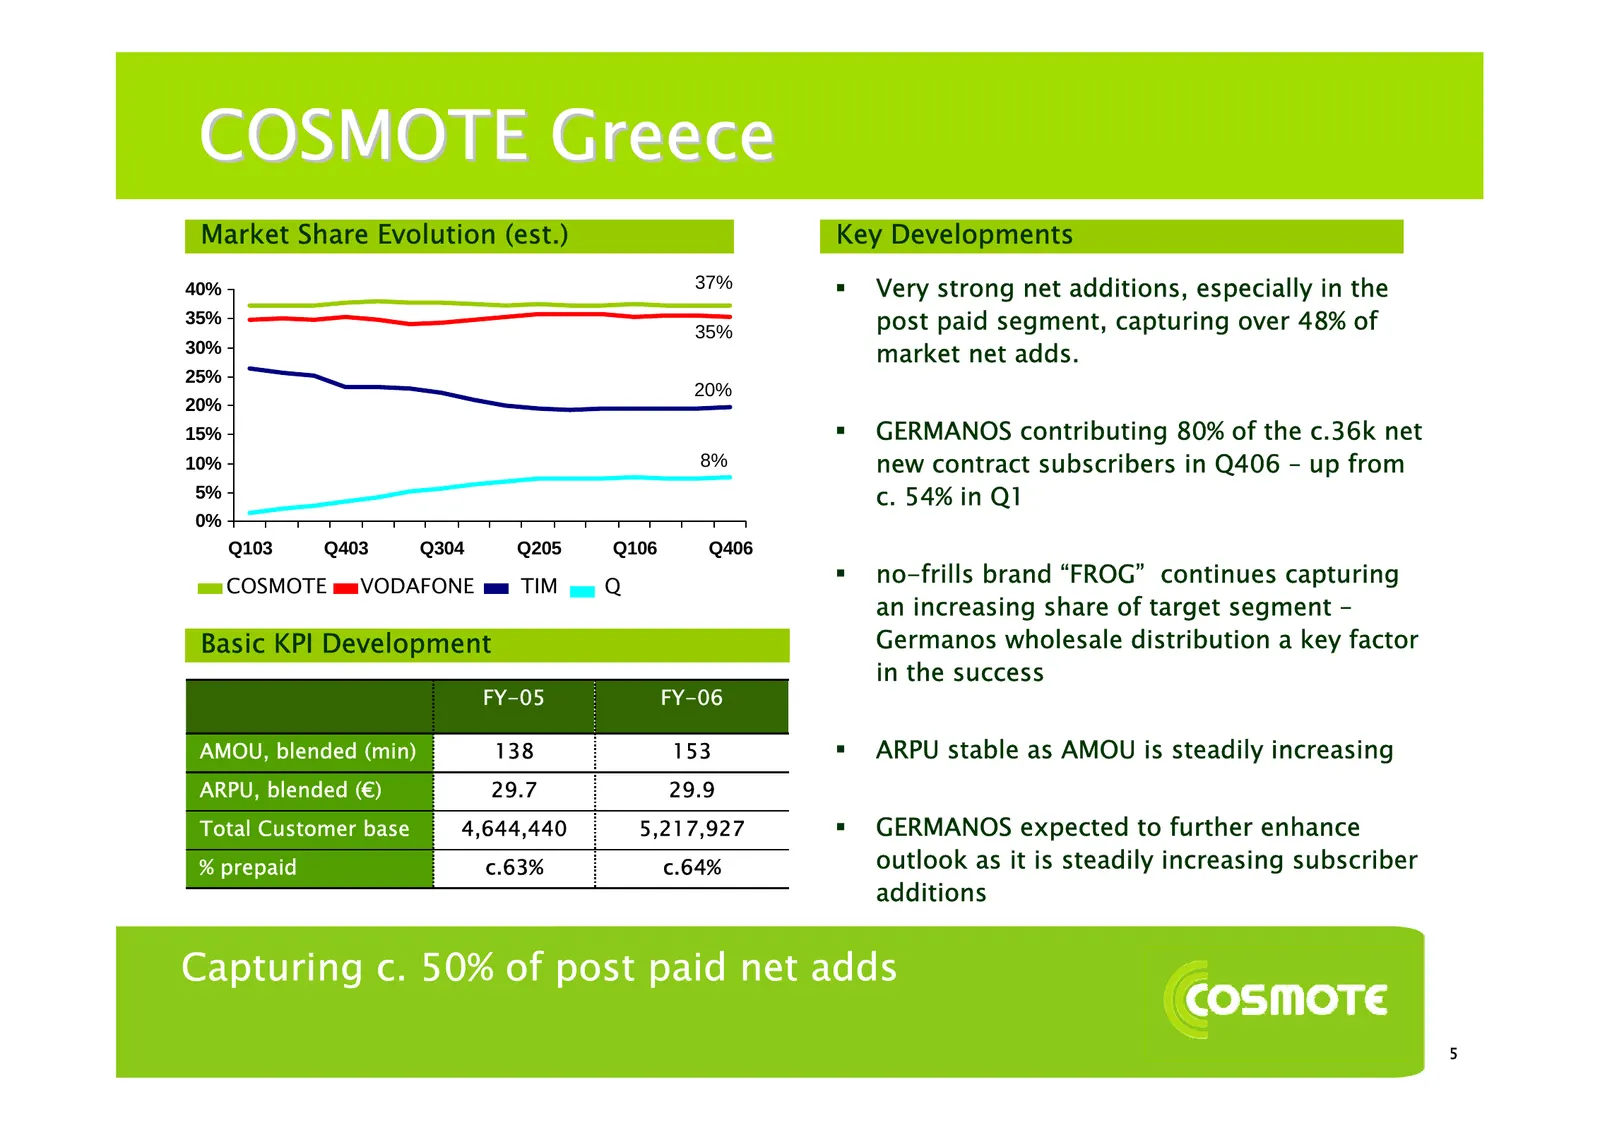
COSMOTE Greece Market Share Evolution (est.) Key Developments 40% 37% Very strong net additions, especially in the 35% 35% post paid segment, capturing over 48% of 30% market net adds. 25% 20% 20% 15% GERMANOS contributing 80% of the c.36k net 10% 8% new contract subscribers in Q406 – up from 5%
Slide 8: COSMOTE Greece
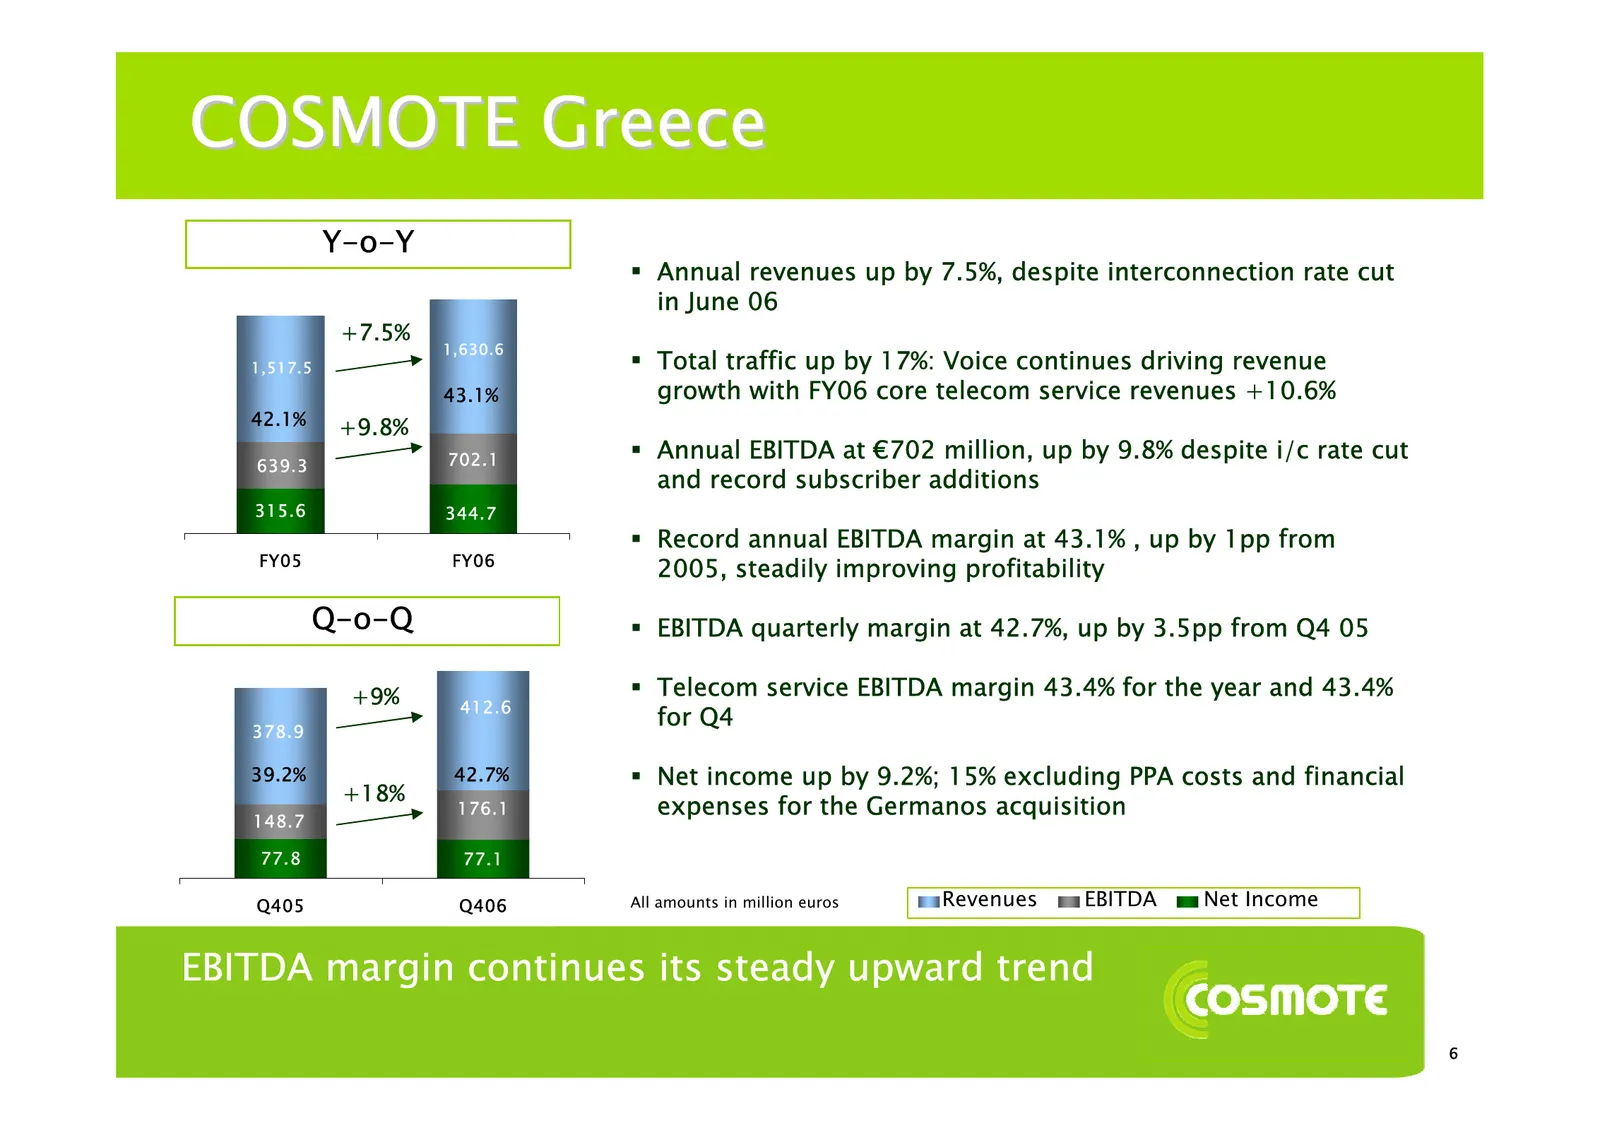
COSMOTE Greece Y-o-Y Annual revenues up by 7.5%, despite interconnection rate cut in June 06 +7.5% 1,630.6 1,517.5 Total traffic up by 17%: Voice continues driving revenue 43.1% growth with FY06 core telecom service revenues +10.6% 42.1% +9.8% 702.1 Annual EBITDA at €702 million, up by 9.8% de
Slide 9: COSMOTE Greece
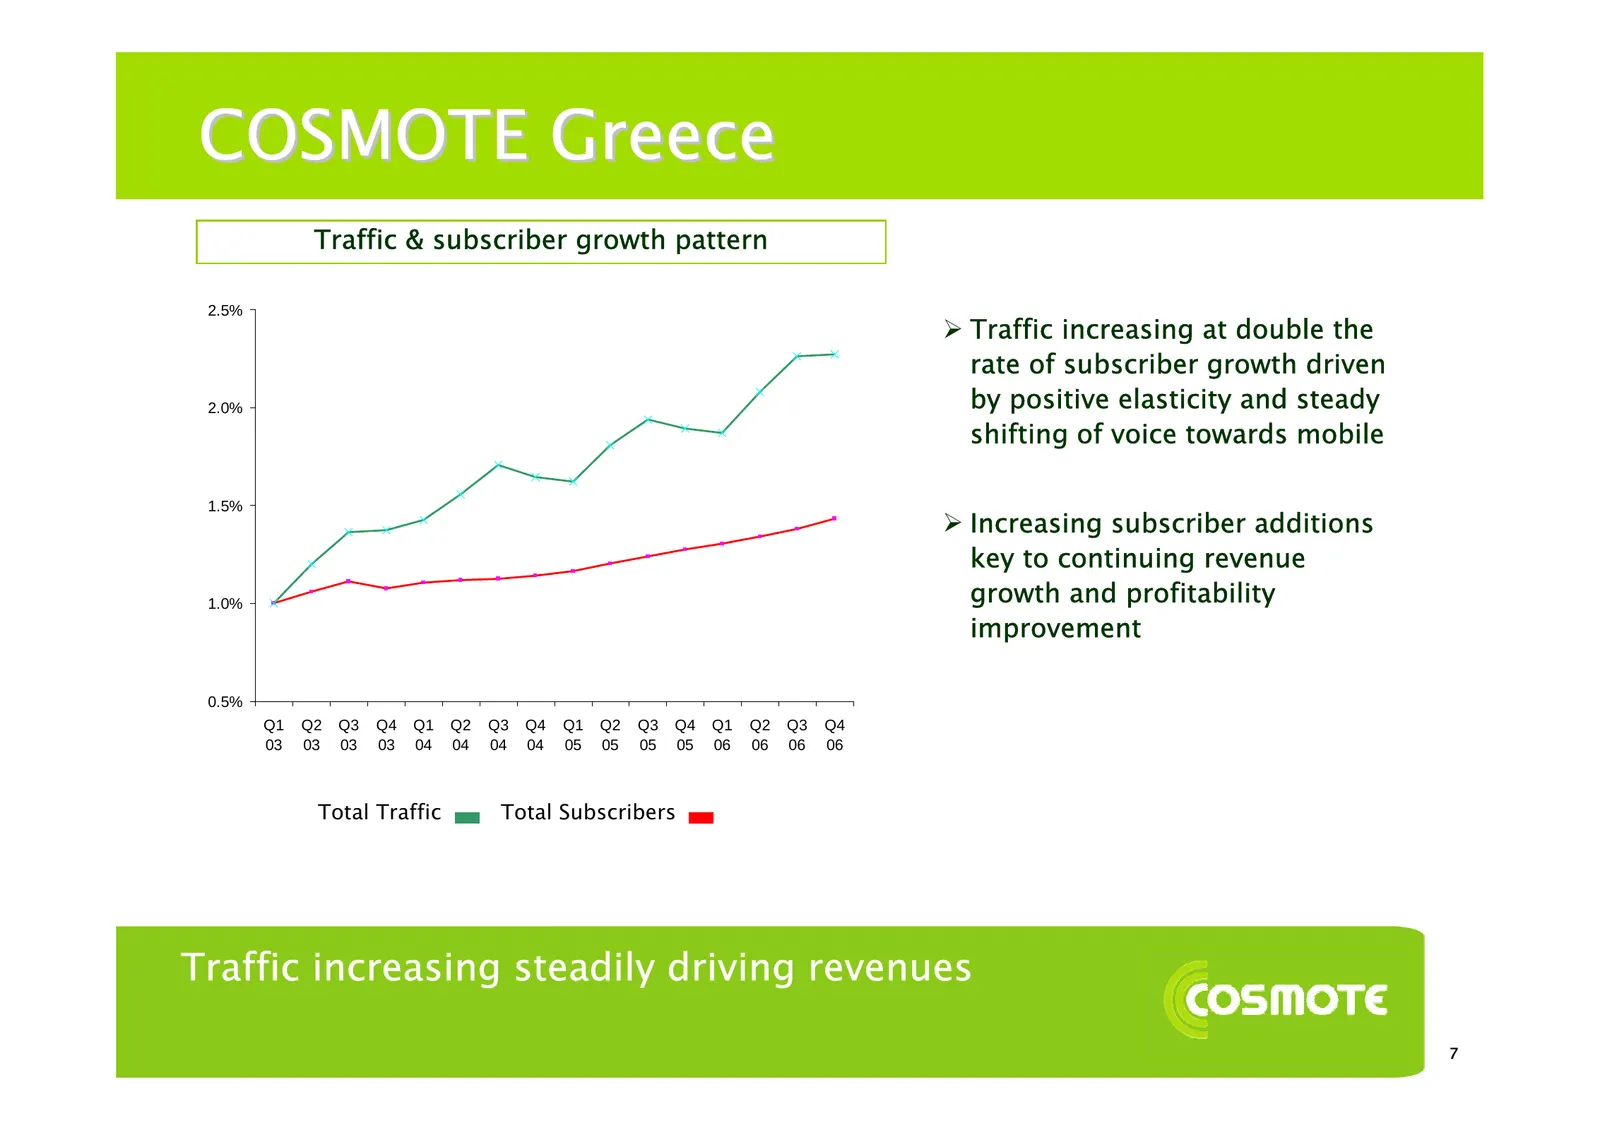
COSMOTE Greece Traffic & subscriber growth pattern 2.5% ¾ Traffic increasing at double the rate of subscriber growth driven 2.0% by positive elasticity and steady shifting of voice towards mobile 1.5% ¾ Increasing subscriber additions key to continuing revenue 1.0% growth and profitability improveme
Slide 10: AMC
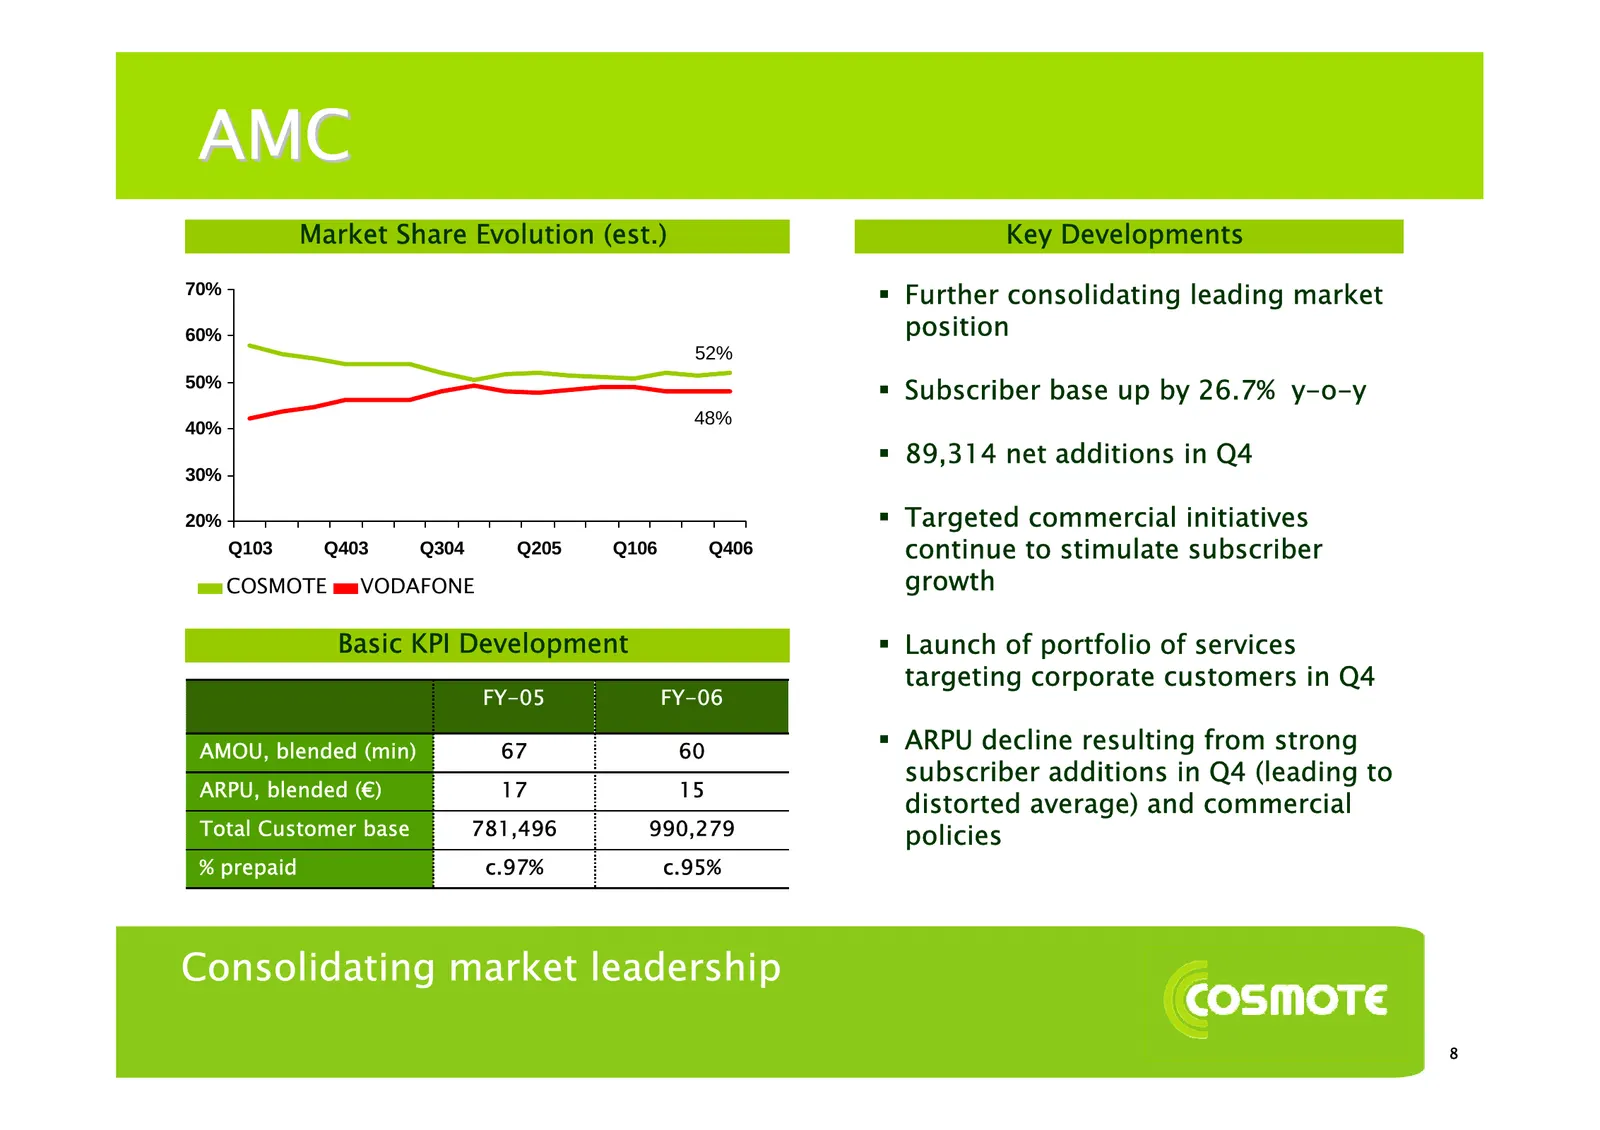
AMC Market Share Evolution (est.) Key Developments 70% Further consolidating leading market 60% position 52% 50% Subscriber base up by 26.7% y-o-y 48% 40% 89,314 net additions in Q4 30% 20% Targeted commercial initiatives Q103 Q403 Q304 Q205 Q106 Q406 continue to stimulate subscriber COSMOTE
Slide 11: AMC
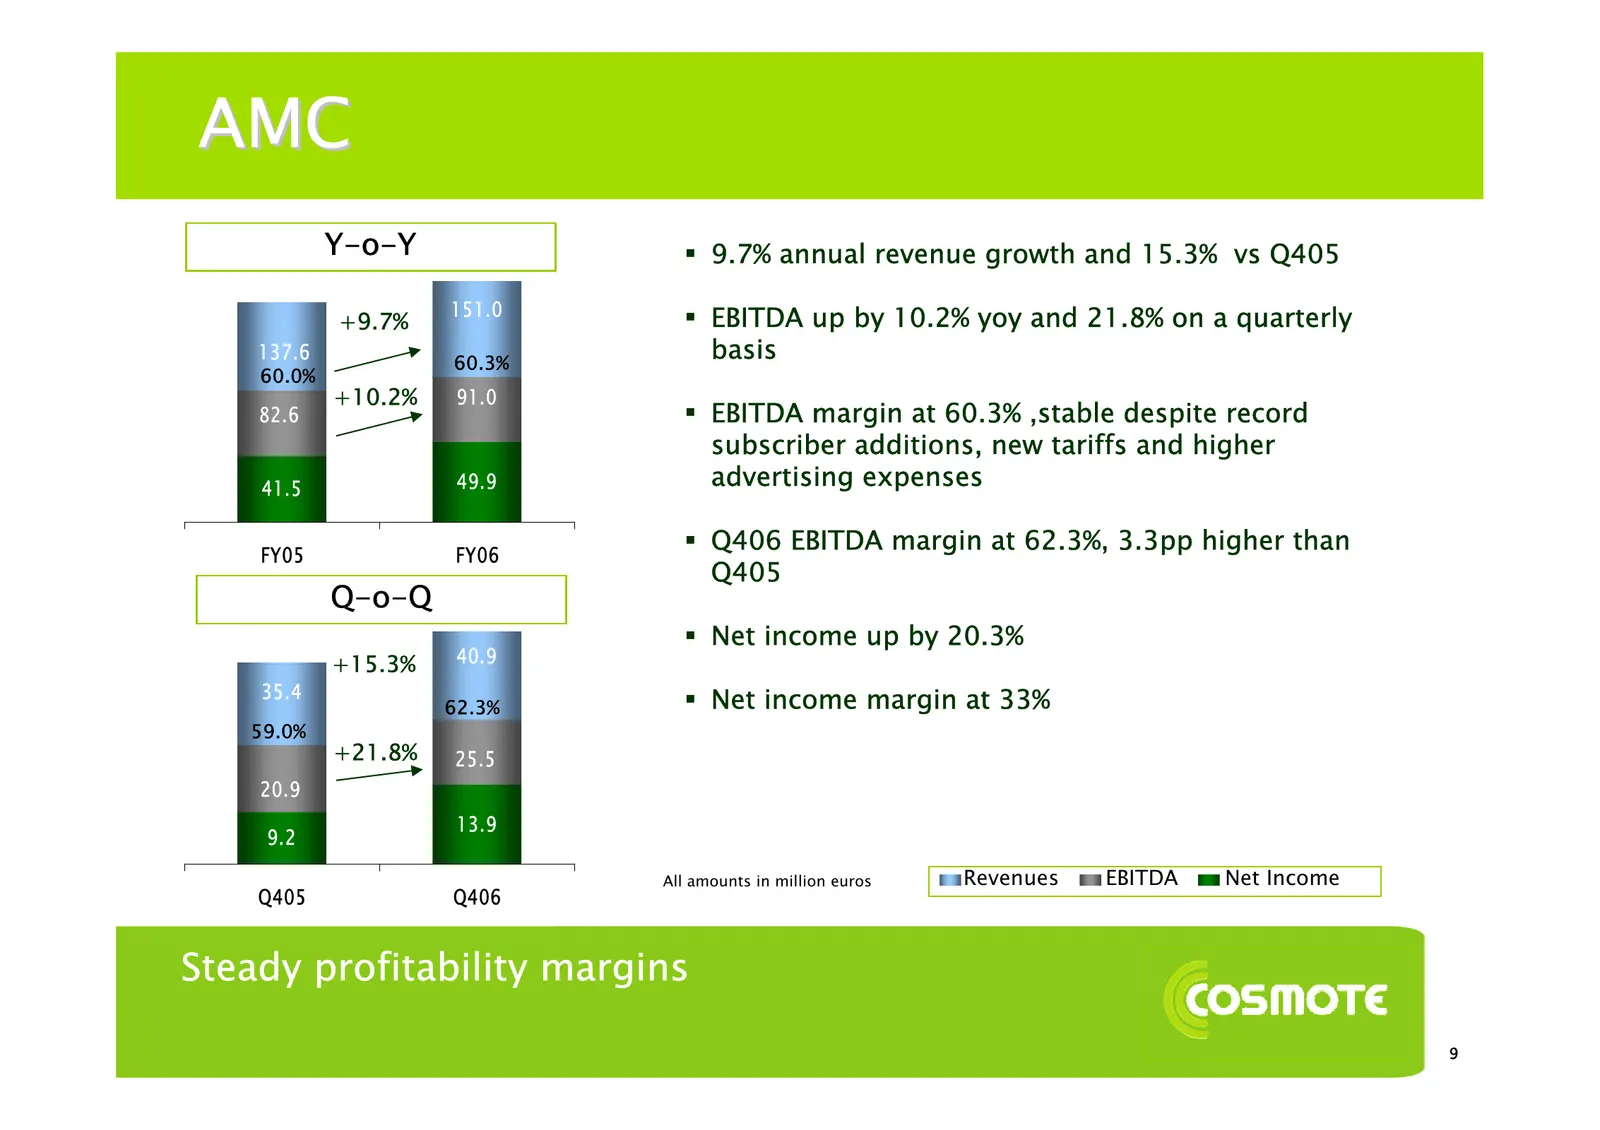
AMC Y-o-Y 9.7% annual revenue growth and 15.3% vs Q405 151.0 EBITDA up by 10.2% yoy and 21.8% on a quarterly +9.7% 137.6 60.3% basis 60.0% +10.2% 91.0 82.6 EBITDA margin at 60.3% ,stable despite record subscriber additions, new tariffs and higher 41.5 49.9 advertising expenses FY05 FY06 Q406
Slide 12: GLOBUL
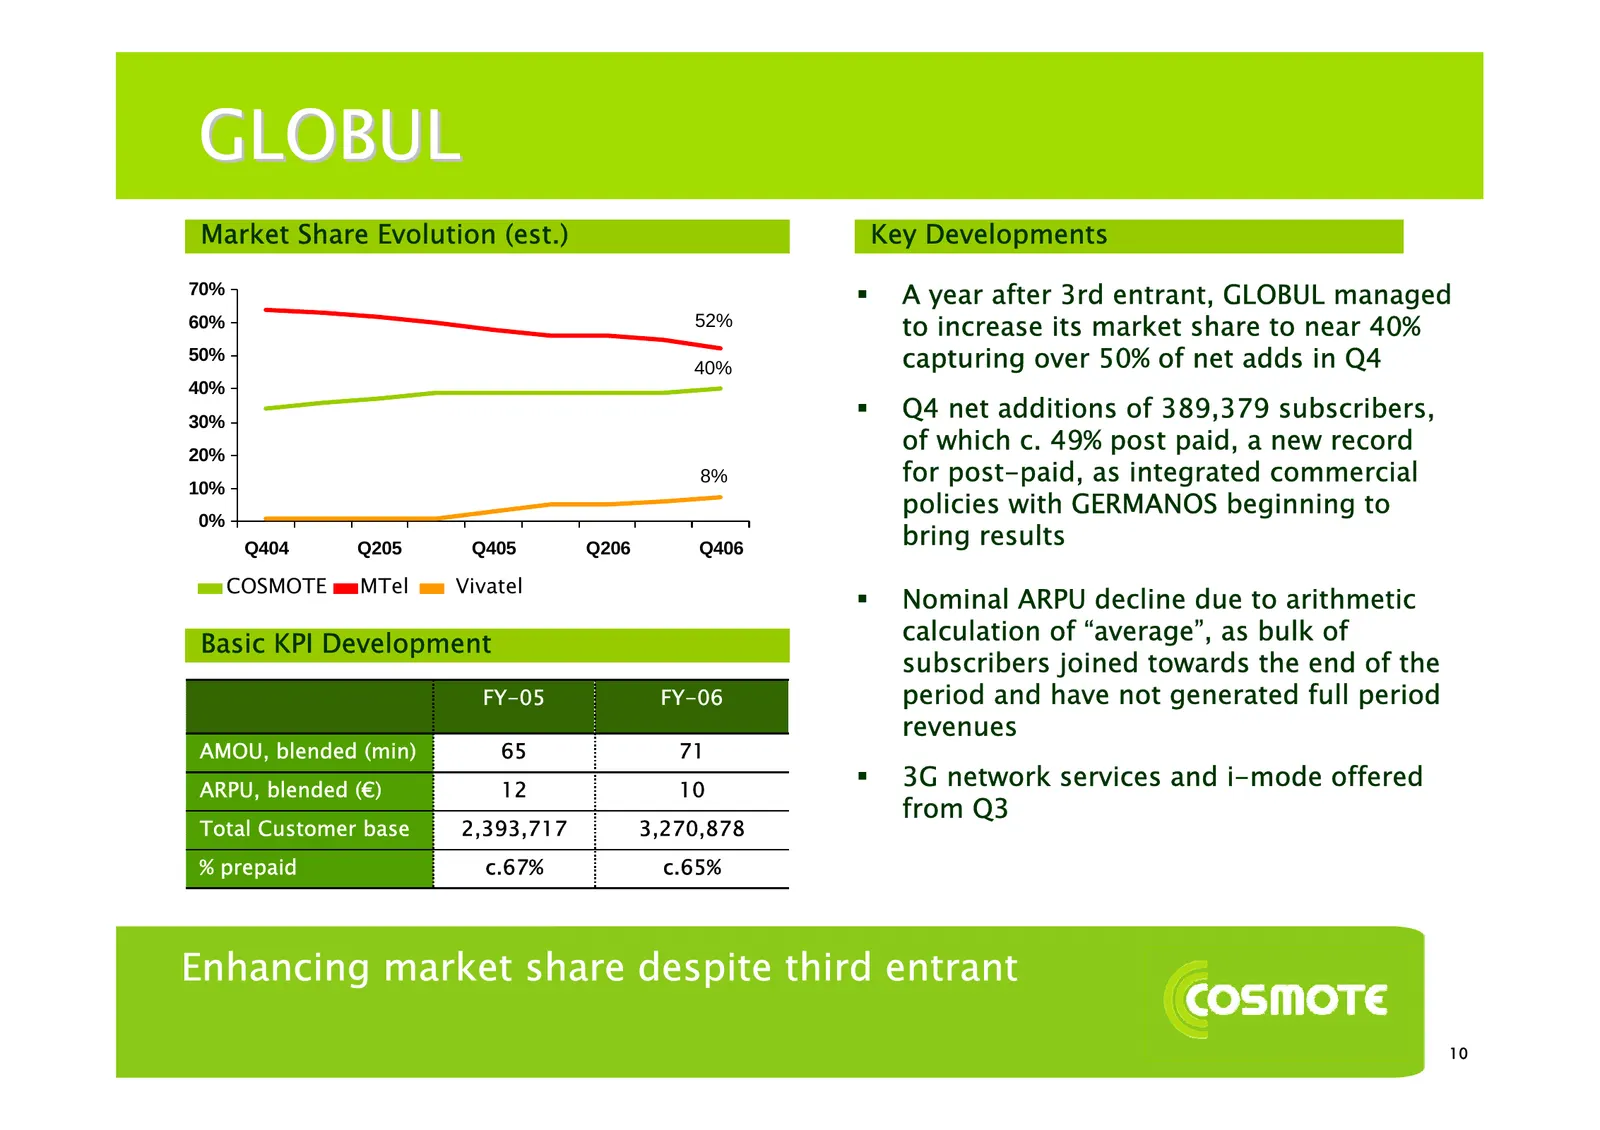
GLOBUL Market Share Evolution (est.) Key Developments 70% A year after 3rd entrant, GLOBUL managed 60% 52% to increase its market share to near 40% 50% 40% capturing over 50% of net adds in Q4 40% 30% Q4 net additions of 389,379 subscribers, 20% of which c. 49% post paid, a new record 8% for pos
Slide 13: GLOBUL
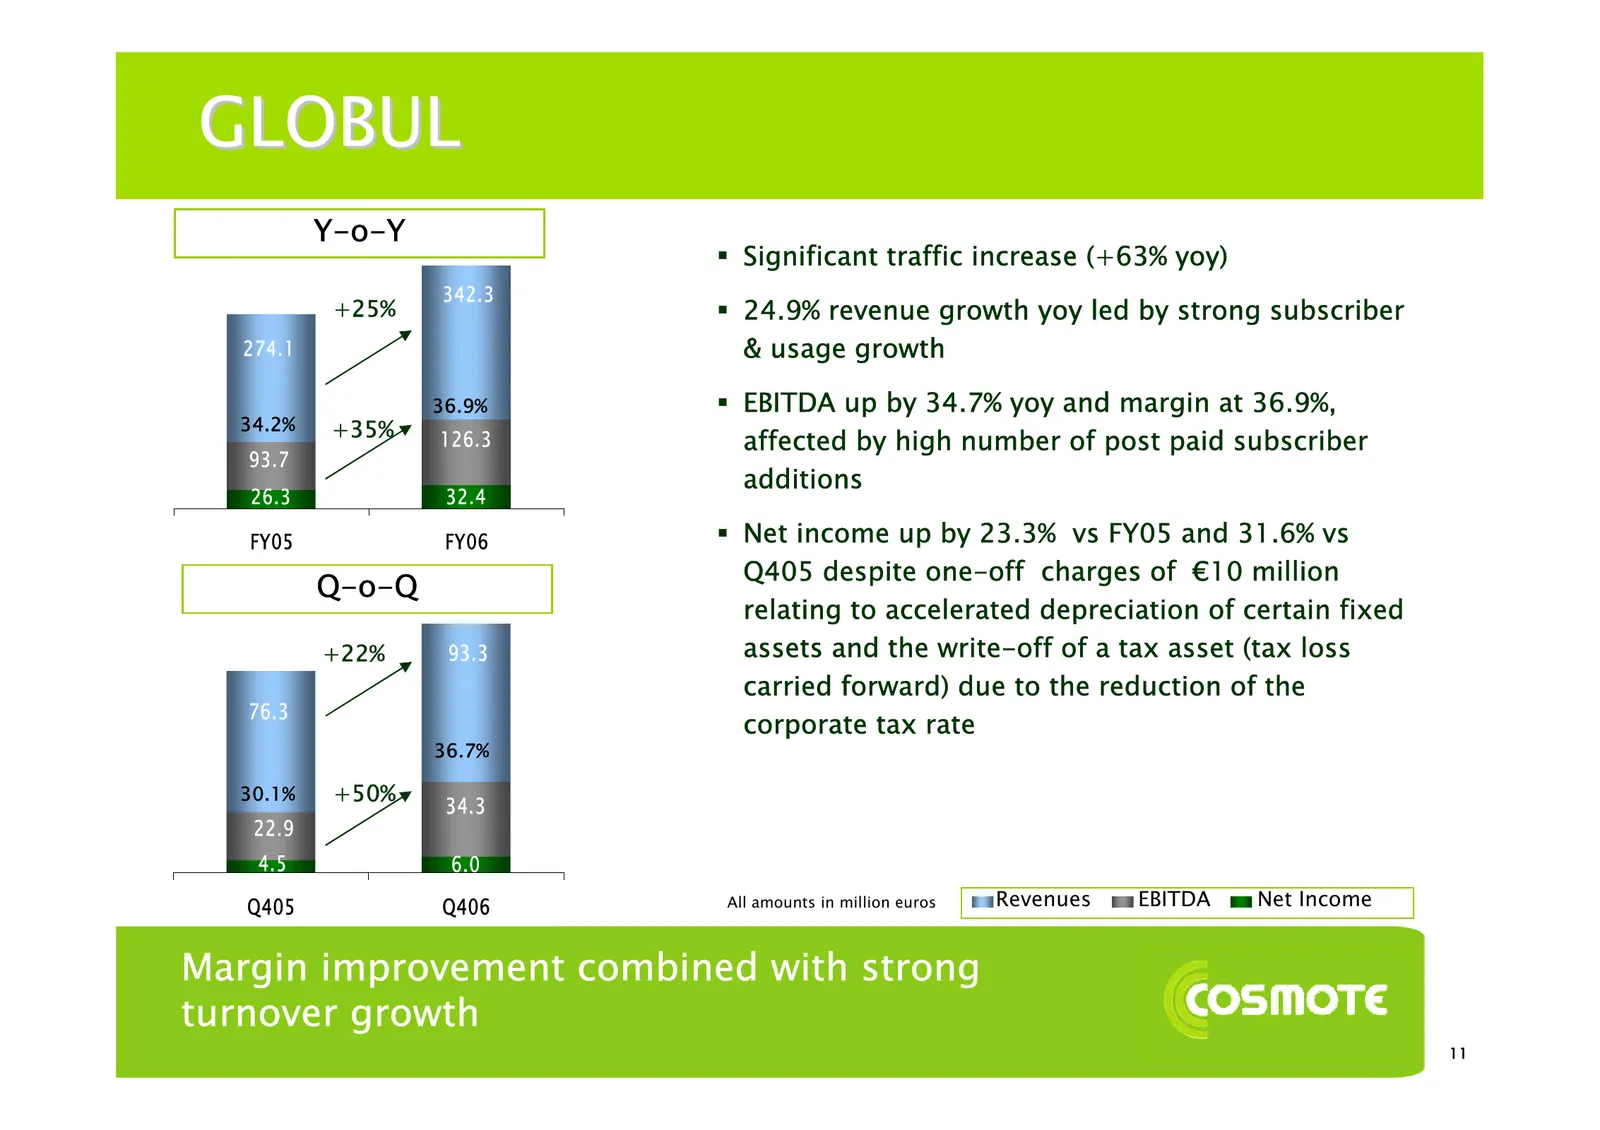
GLOBUL Y-o-Y Significant traffic increase (+63% yoy) 342.3 +25% 24.9% revenue growth yoy led by strong subscriber 274.1 & usage growth 36.9% EBITDA up by 34.7% yoy and margin at 36.9%, 34.2% +35% 126.3 affected by high number of post paid subscriber 93.7 additions 26.3 32.4 FY05 FY06 Net inc
Slide 14: COSMOFON
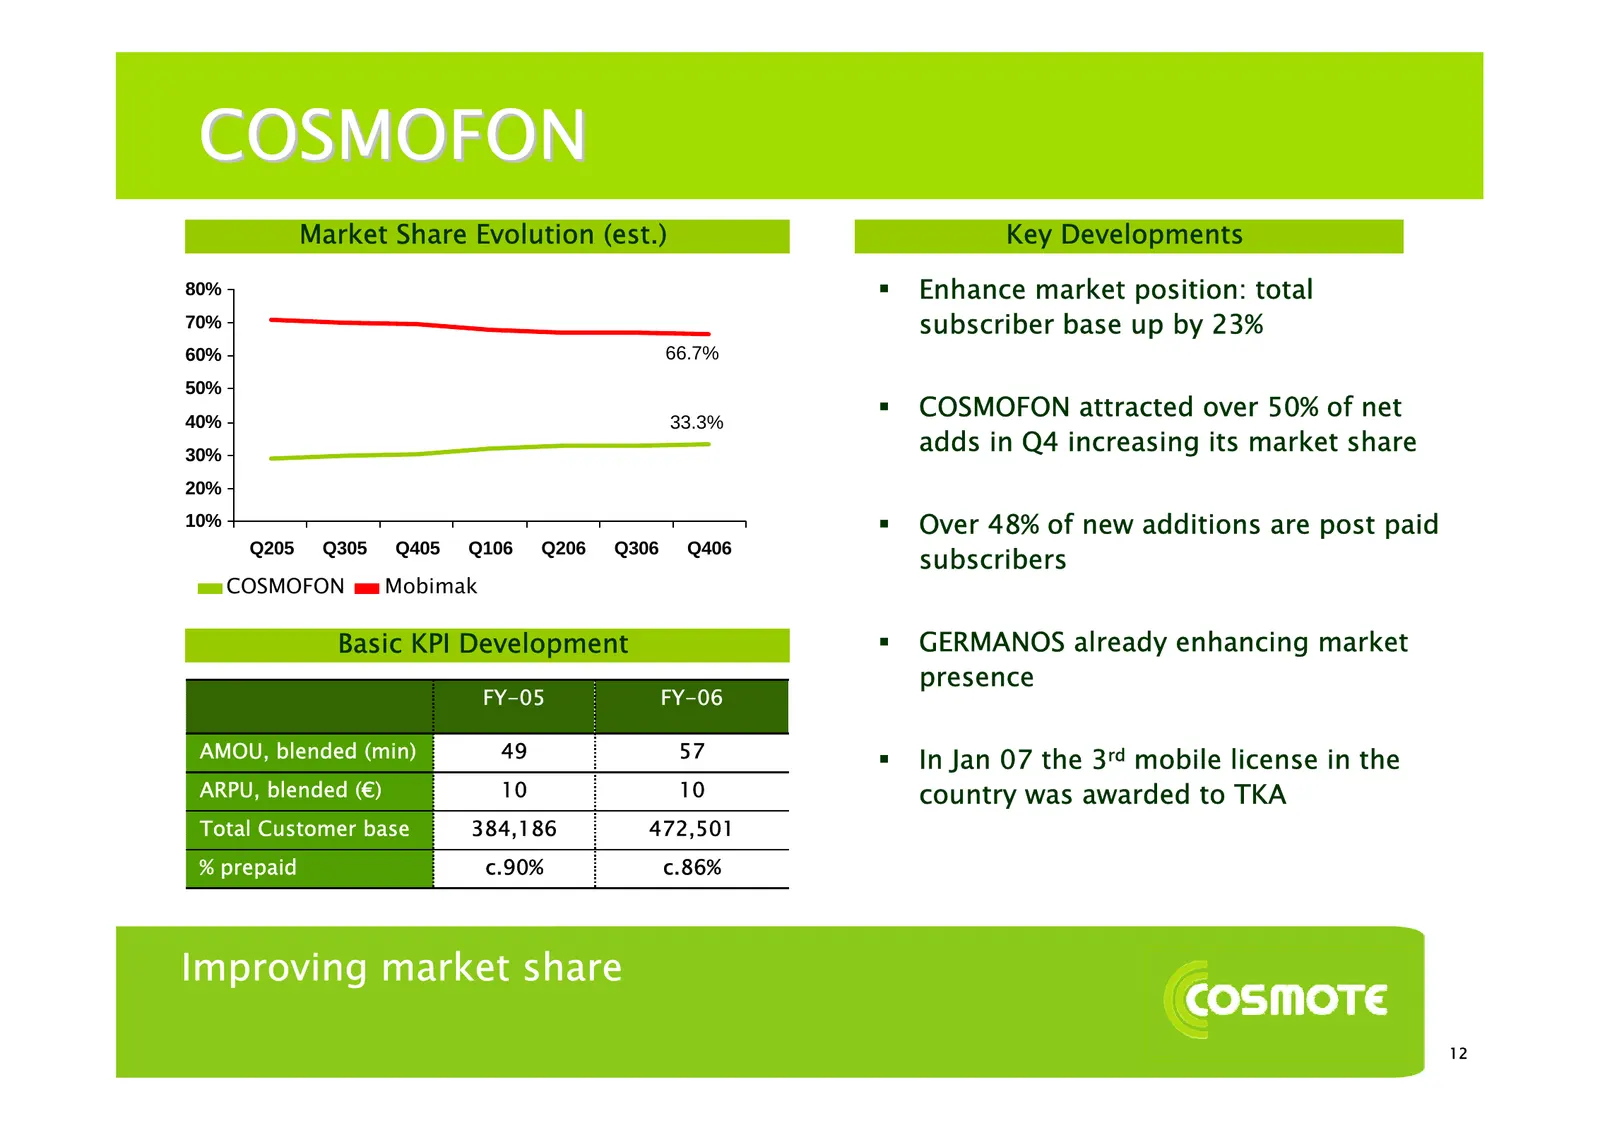
COSMOFON Market Share Evolution (est.) Key Developments 80% Enhance market position: total 70% subscriber base up by 23% 60% 66.7% 50% 40% 33.3% COSMOFON attracted over 50% of net 30% adds in Q4 increasing its market share 20% 10% Over 48% of new additions are post paid subscribers Q205 Q305 Q
Slide 15: COSMOFON
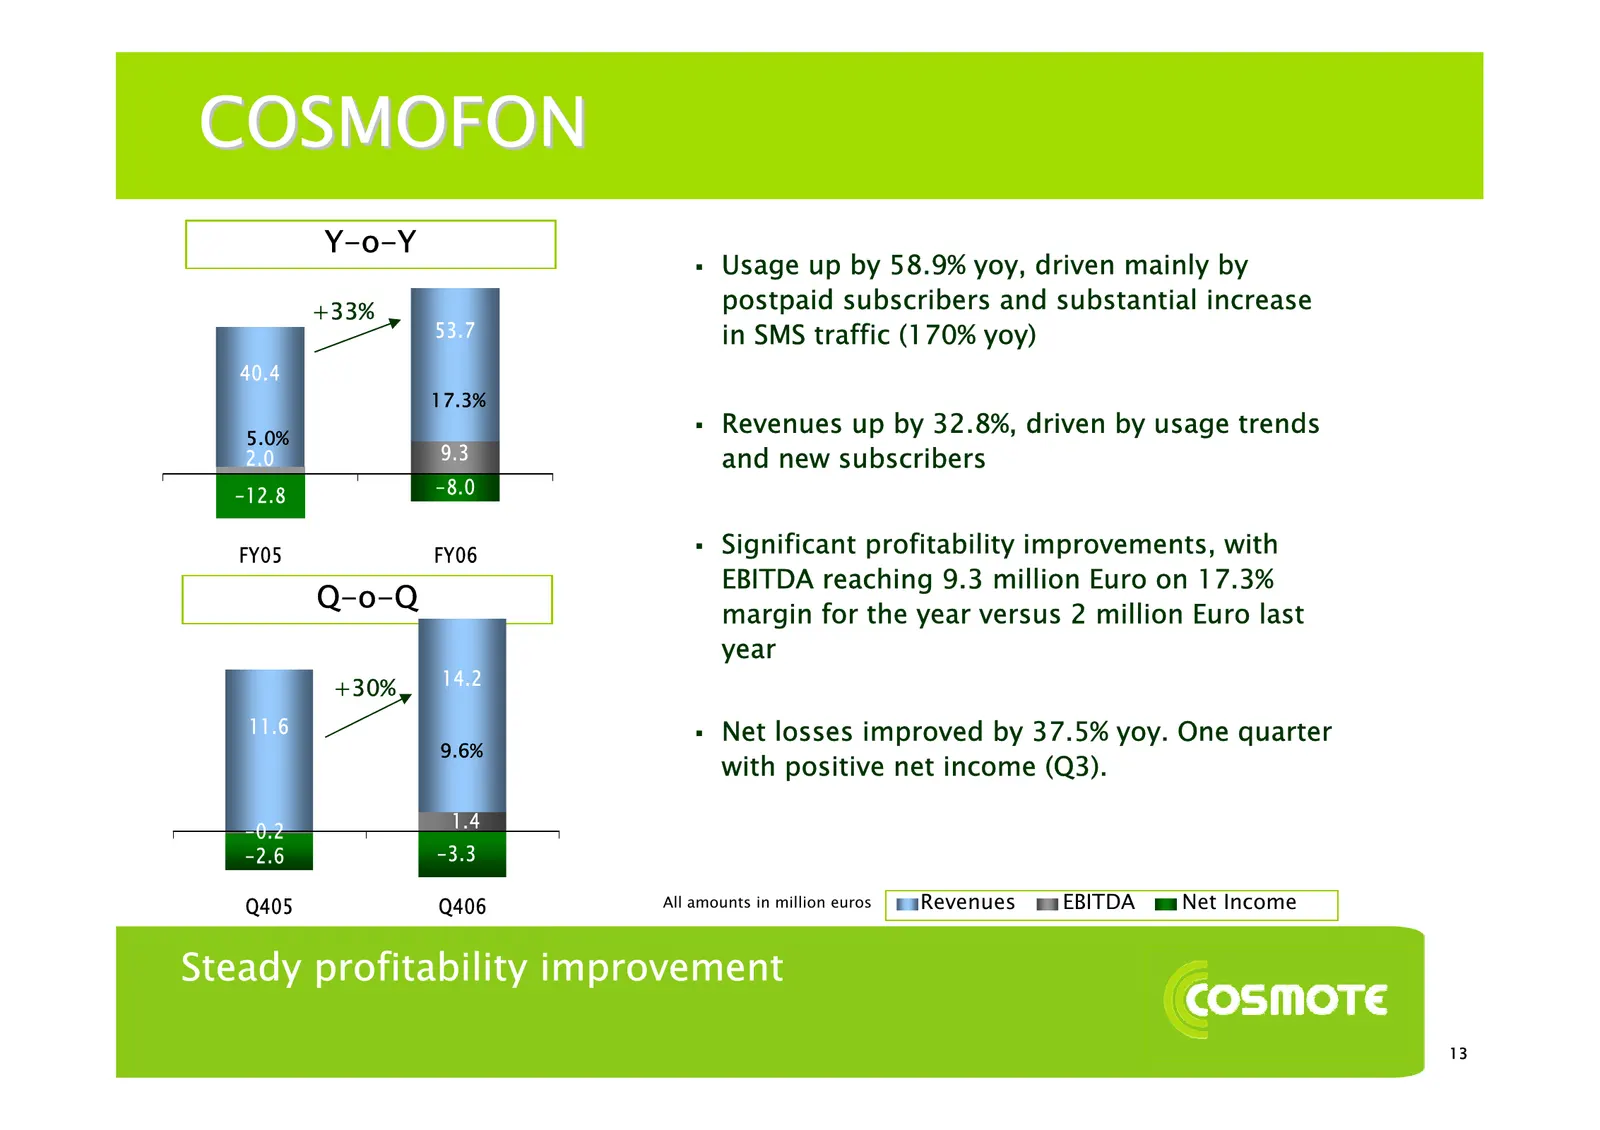
COSMOFON Y-o-Y Usage up by 58.9% yoy, driven mainly by +33% postpaid subscribers and substantial increase 53.7 in SMS traffic (170% yoy) 40.4 17.3% 5.0% Revenues up by 32.8%, driven by usage trends 2.0 9.3 and new subscribers -12.8 -8.0 FY05 FY06 Significant profitability improvements, with EB
Slide 16: COSMOTE Romania
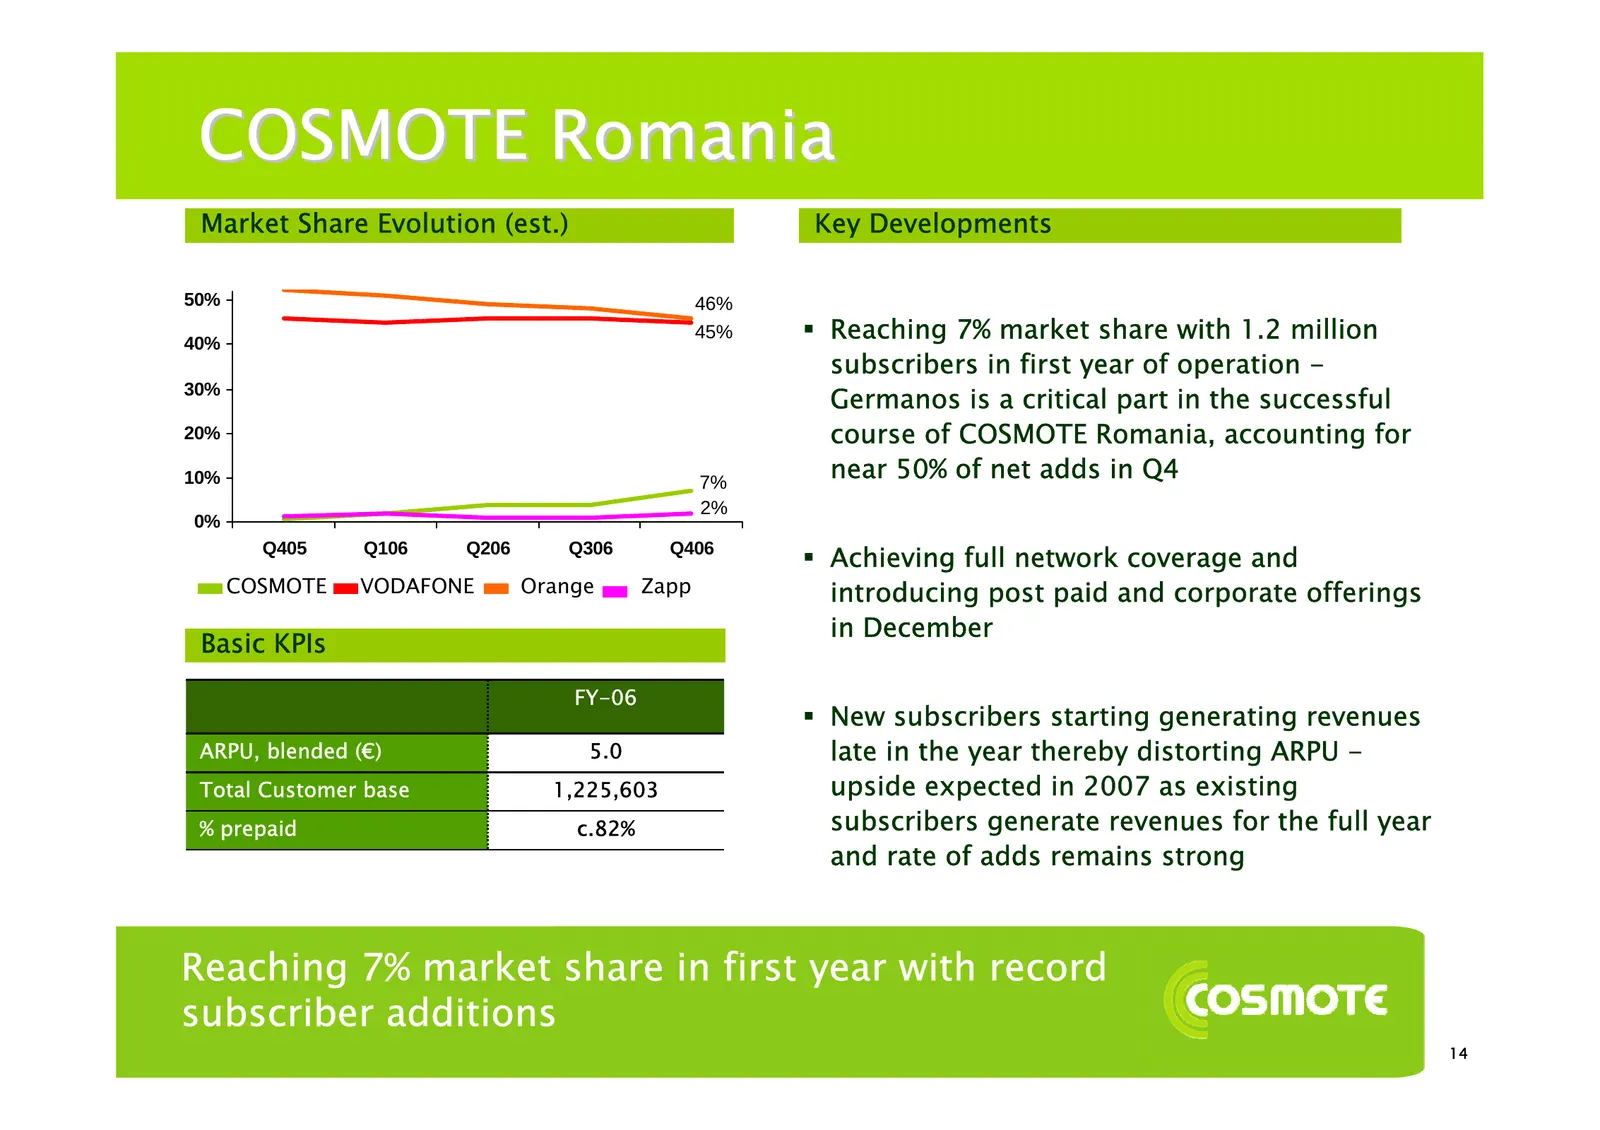
COSMOTE Romania Market Share Evolution (est.) Key Developments 50% 46% 40% 45% Reaching 7% market share with 1.2 million subscribers in first year of operation - 30% Germanos is a critical part in the successful 20% course of COSMOTE Romania, accounting for 10% 7% near 50% of net adds in Q4 2% 0%
Slide 17: COSMOTE Romania
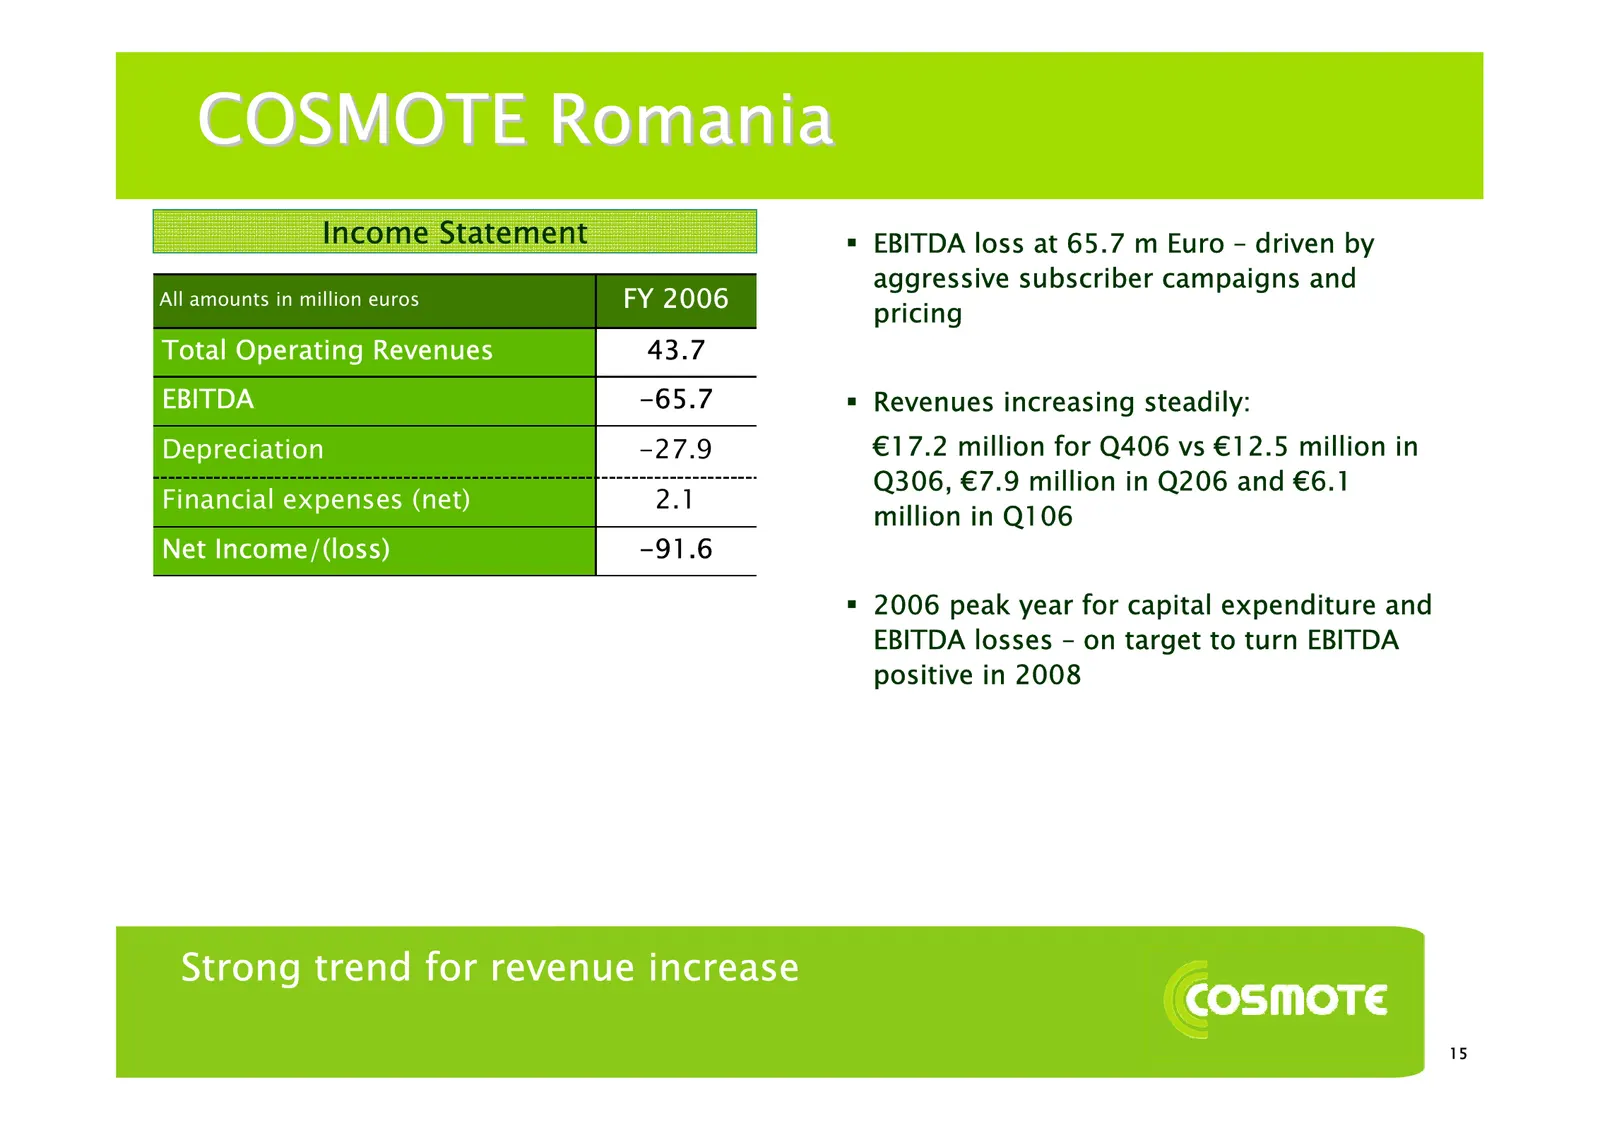
COSMOTE Romania Income Statement EBITDA loss at 65.7 m Euro – driven by aggressive subscriber campaigns and All amounts in million euros FY 2006 pricing Total Operating Revenues 43.7 EBITDA -65.7 Revenues increasing steadily: Depreciation -27.9 €17.2 million for Q406 vs €12.5 million in Q306, €7
Slide 18: GERMANOS
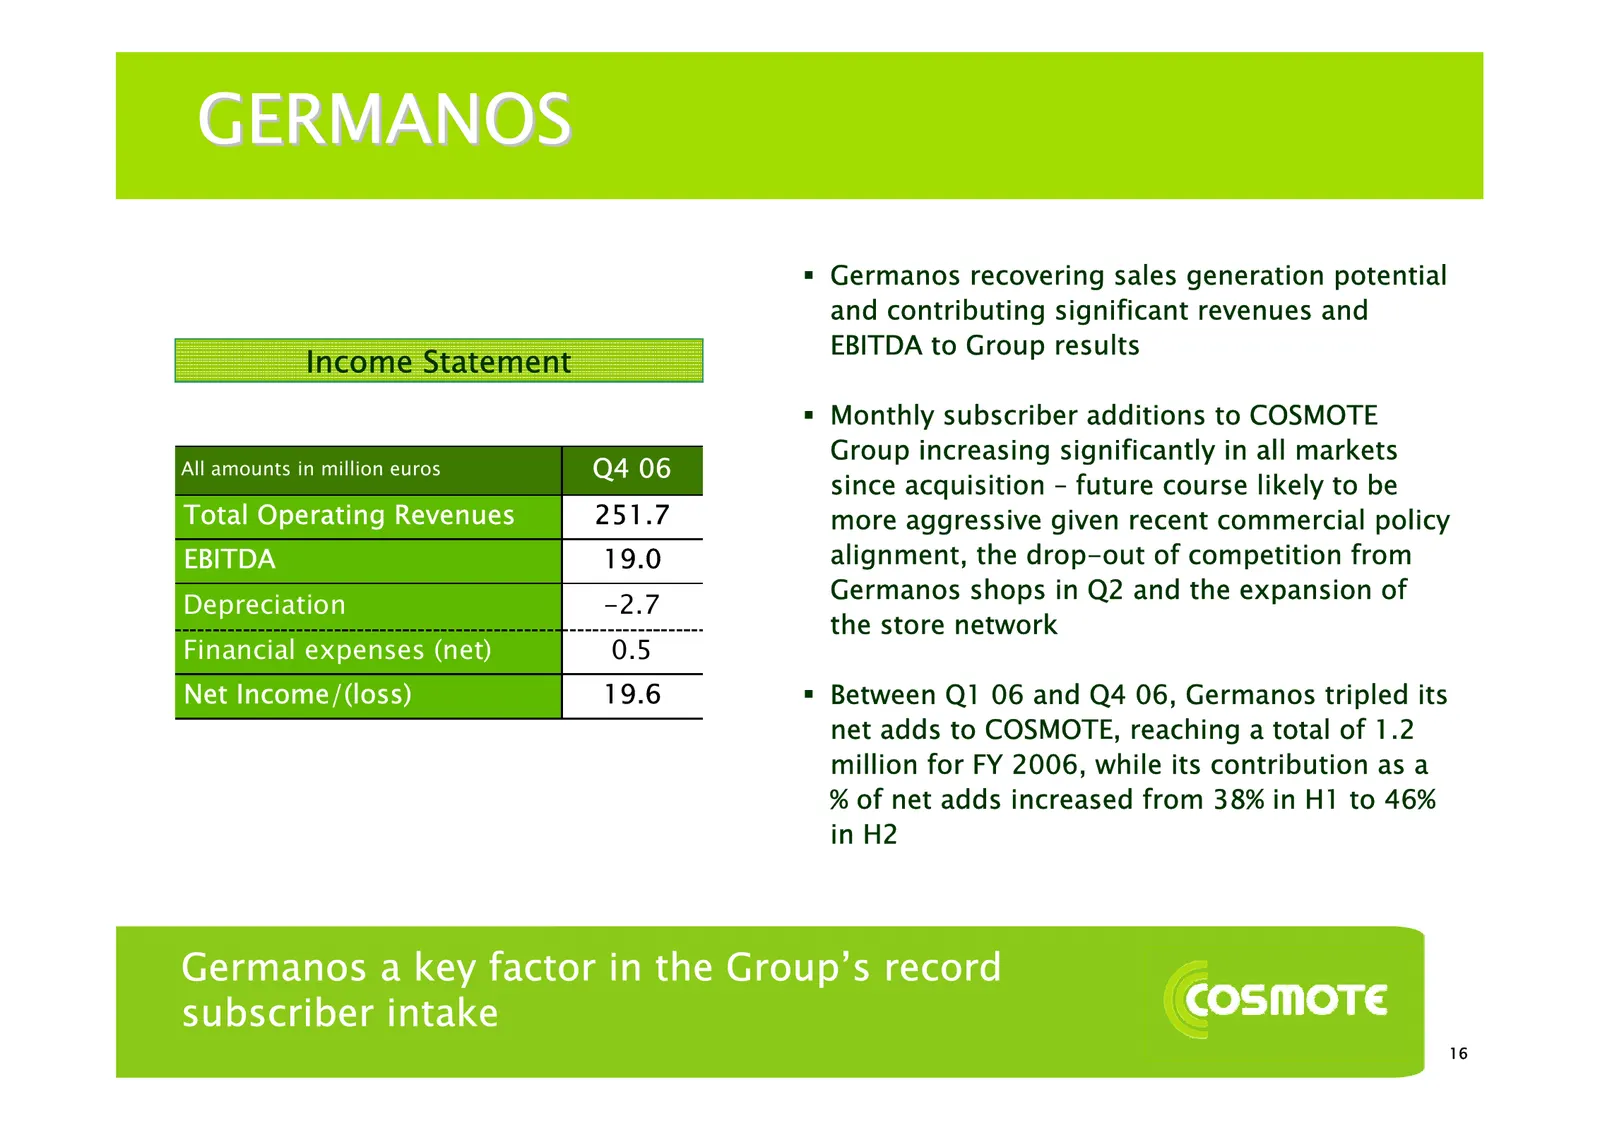
GERMANOS Germanos recovering sales generation potential and contributing significant revenues and EBITDA to Group results Income Statement Monthly subscriber additions to COSMOTE Group increasing significantly in all markets All amounts in million euros Q4 06 since acquisition – future course li
Slide 19: Group Outlook
Group Outlook COSMOTE
Slide 20: Group Outlook
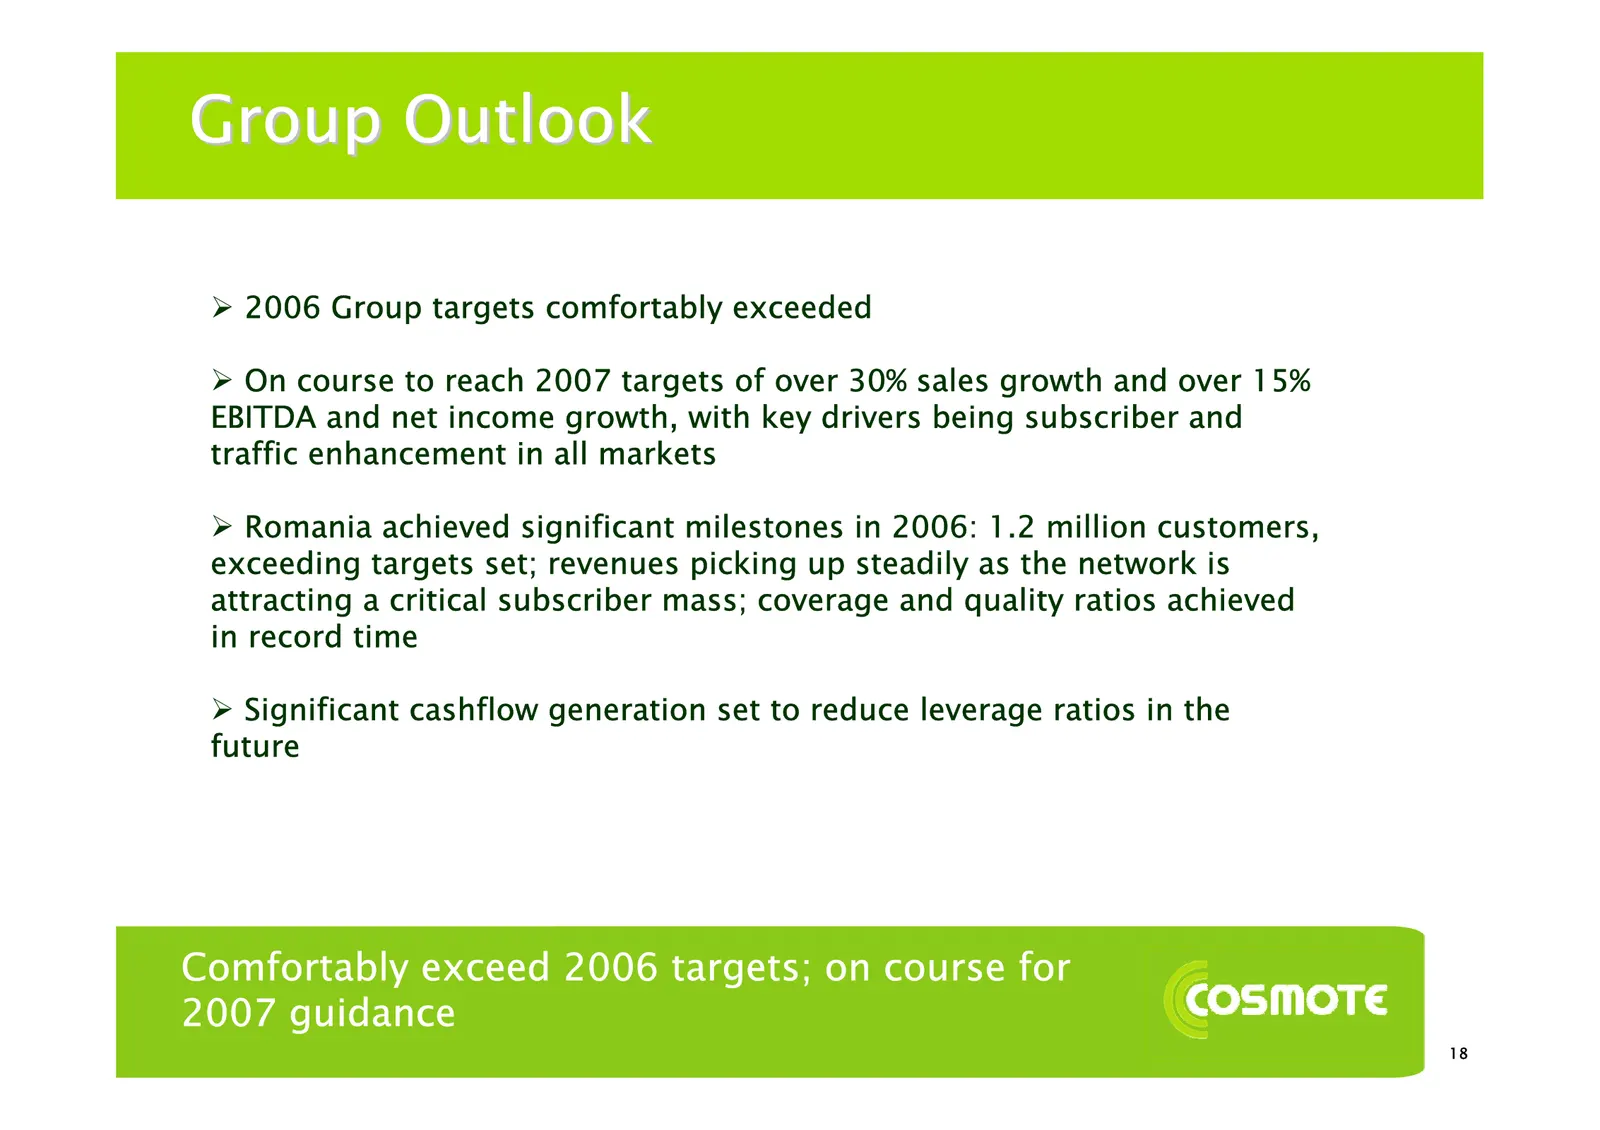
Group Outlook ¾ 2006 Group targets comfortably exceeded ¾ On course to reach 2007 targets of over 30% sales growth and over 15% EBITDA and net income growth, with key drivers being subscriber and traffic enhancement in all markets ¾ Romania achieved significant milestones in 2006: 1.2 million custom
Slide 21: Note on Forward-Looking Statements
NOTE ON FORWARD-LOOKING STATEMENTS Some of the statements in this document are "forward-looking statements". Forward-looking statements are derived from information that we currently have and assumptions that we make. Words such as "believes", "anticipates", "expects", “targets”, intends","seeks", "
Source: Internet Archive copy of cosmote.gr
More decks from Hellenic Telecommunications Organization SA
 OTE Group — Q2 2026 Earnings Presentation25 slides · July 2026
 OTE Group — Q1 2026 Earnings Presentation25 slides · May 2026
 Q4 2025 Earnings Presentation23 slides · Feb 26, 2026
 Q3 2025 Earnings Presentation23 slides · Nov 14, 2025
 Q2 2025 Earnings Presentation31 slides · Aug 6, 2025
 OTE Group — Q1 2025 Earnings Presentation31 slides · May 2025