Hellenic Telecommunications Organization SA · ATHEX:HTO
Hellenic Telecommunications Organization SA — Q4 2022 Earnings Presentation
30 slides from Hellenic Telecommunications Organization SA's earnings presentation, February 2023
Slide 1: OTE Group Q4 2022 Results
OTE Group Q4 2022 Results FEBRUARY 2023
Slide 2: Disclaimer
2 Disclaimer This presentation is provided to persons who are entitled to receive it in accordance with the laws and In addition to figures prepared in accordance with IFRS, OTE also presents alternative performance measures, regulations of appropriate jurisdictions. This presentation is provided for
Slide 3: Strategy: The 7 Pillars of our Strategic Plan
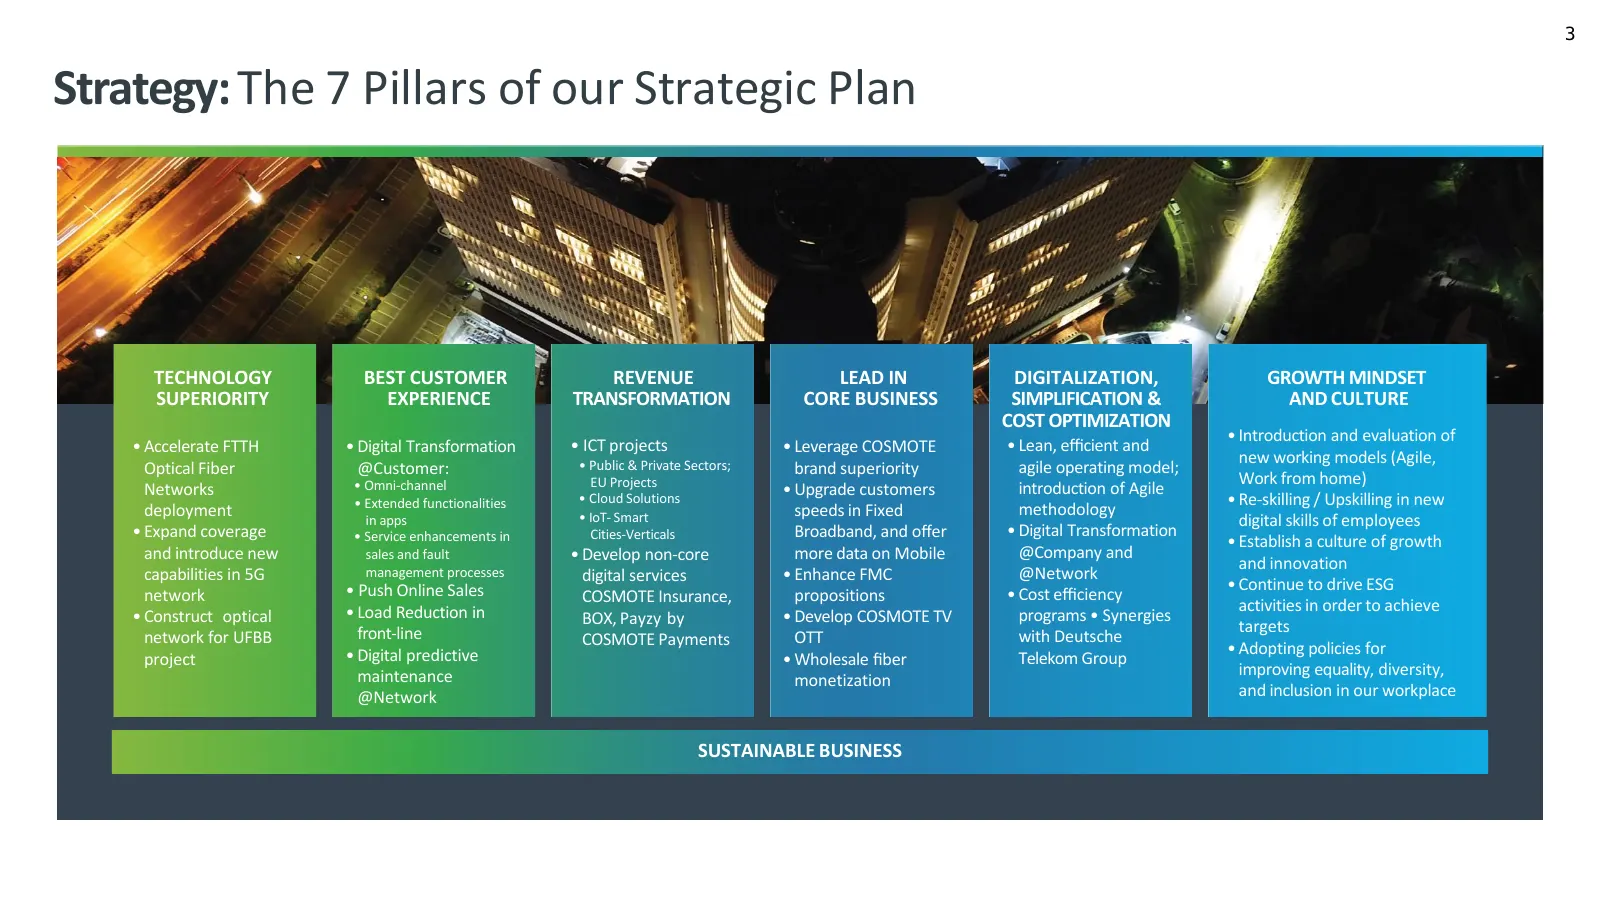
3 Strategy: The 7 Pillars of our Strategic Plan TECHNOLOGY BEST CUSTOMER REVENUE LEAD IN DIGITALIZATION, GROWTH MINDSET SUPERIORITY EXPERIENCE TRANSFORMATION CORE BUSINESS SIMPLIFICATION & AND CULTURE COST OPTIMIZATION • Introduction and evaluation of • Accelerate FTTH • Digital Transformation • ICT
Slide 4: Digital Transformation
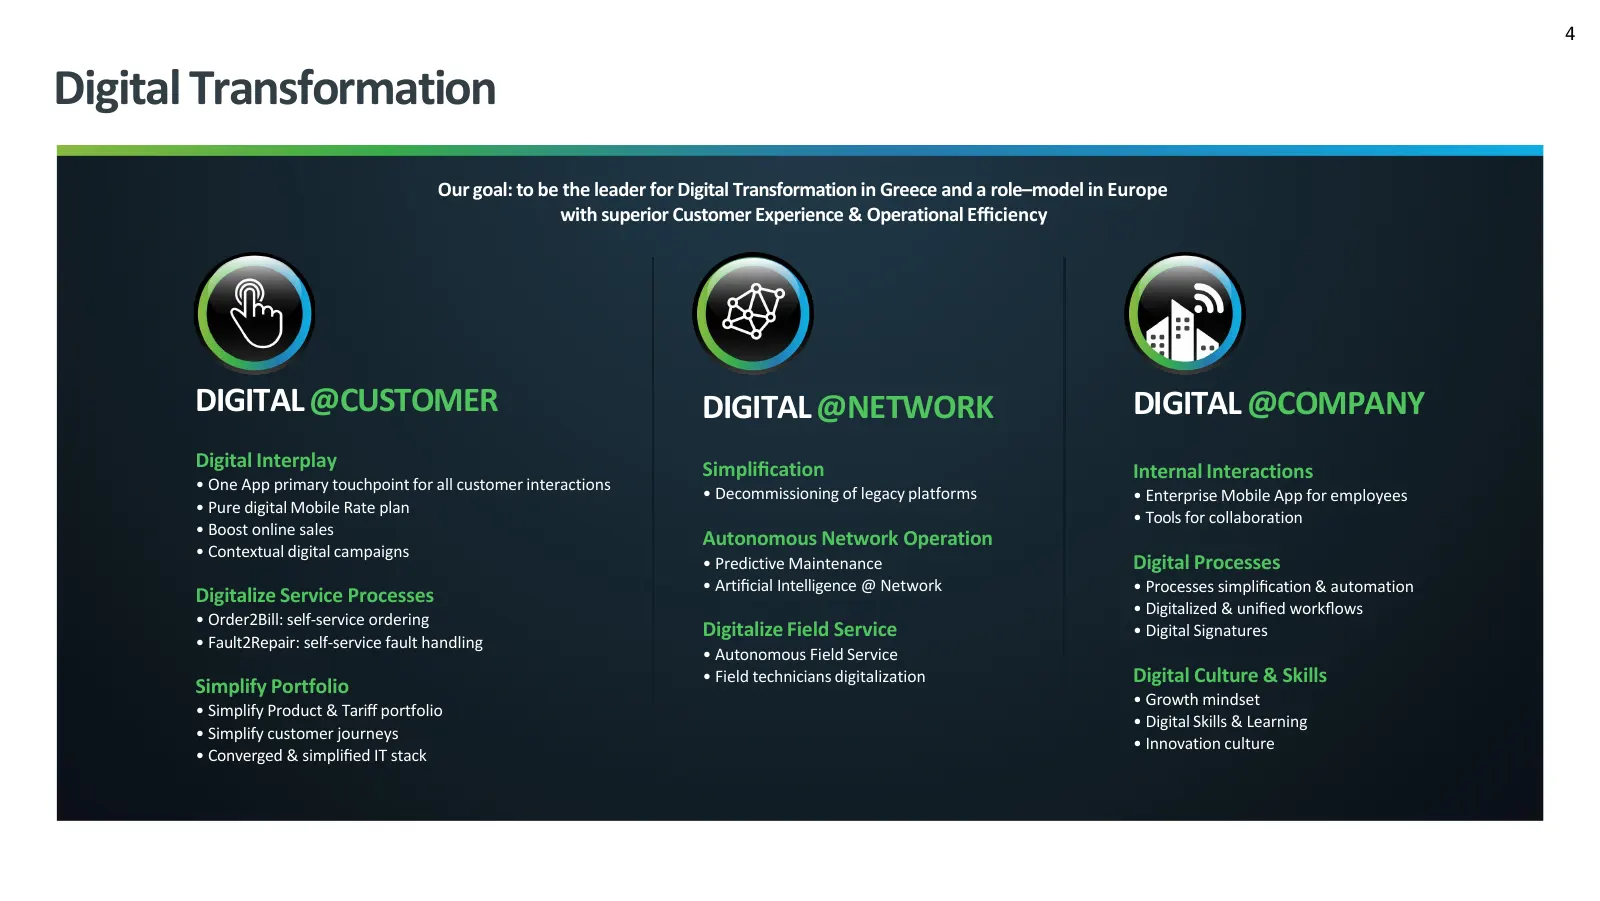
4 Digital Transformation Our goal: to be the leader for Digital Transformation in Greece and a role–model in Europe with superior Customer Experience & Operational Efficiency DIGITAL @CUSTOMER DIGITAL @NETWORK DIGITAL @COMPANY Digital Interplay Simplification Internal Interactions • One App primary tou
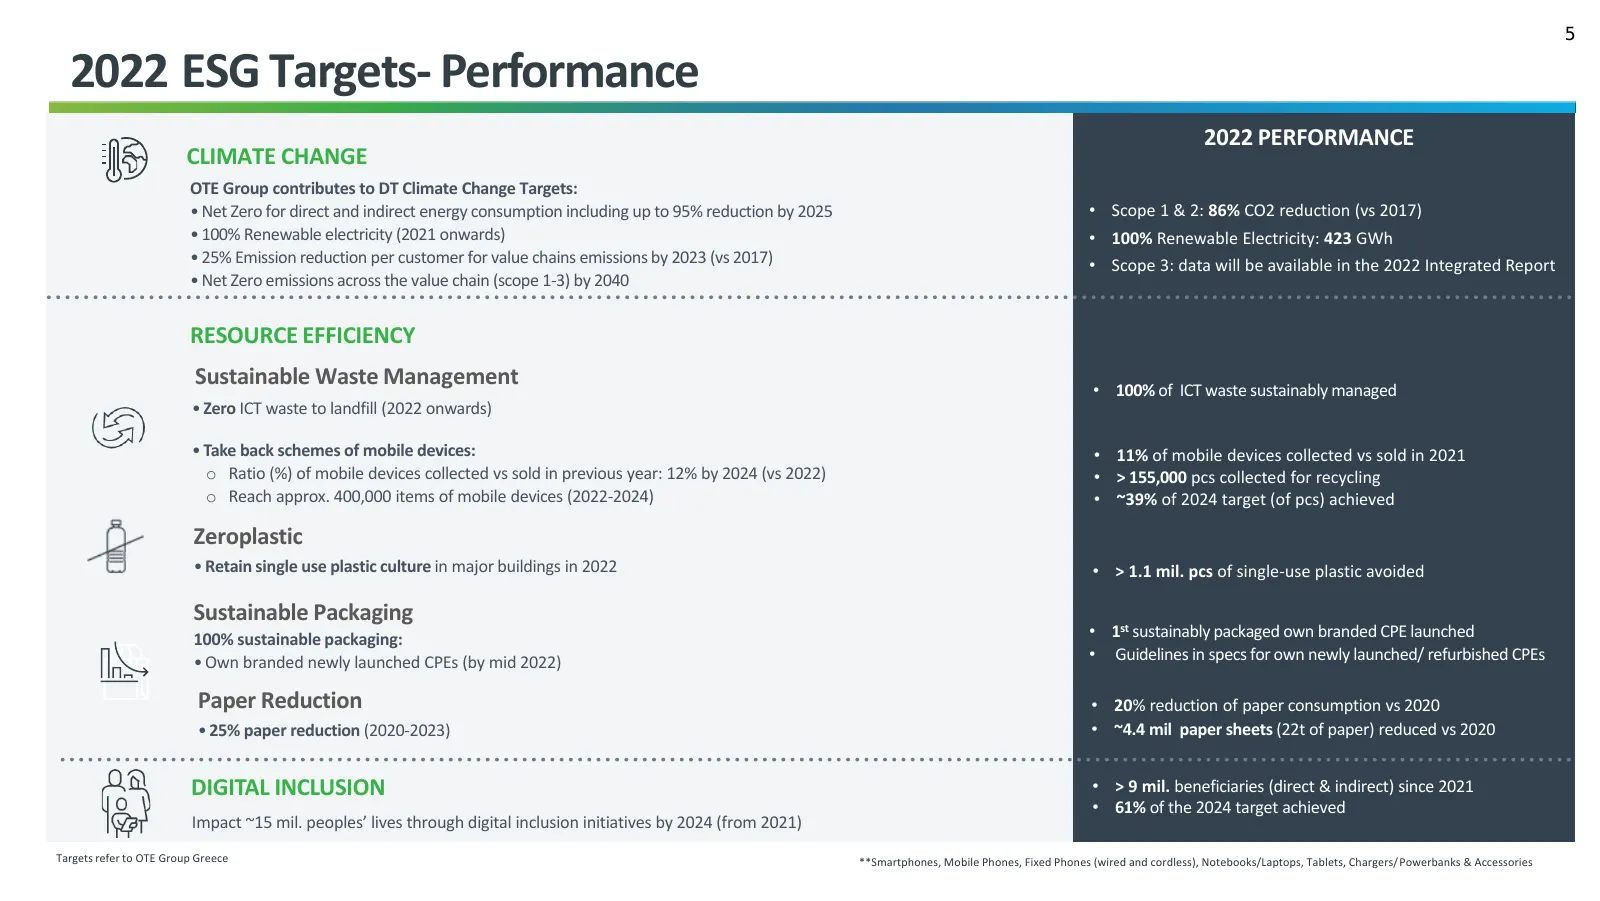
Slide 5: 2022 ESG Targets- Performance
5 2022 ESG Targets- Performance 2022 PERFORMANCE CLIMATE CHANGE OTE Group contributes to DT Climate Change Targets: • Net Zero for direct and indirect energy consumption including up to 95% reduction by 2025 • Scope 1 & 2: 86% CO2 reduction (vs 2017) • 100% Renewable electricity (2021 onwards) • 100
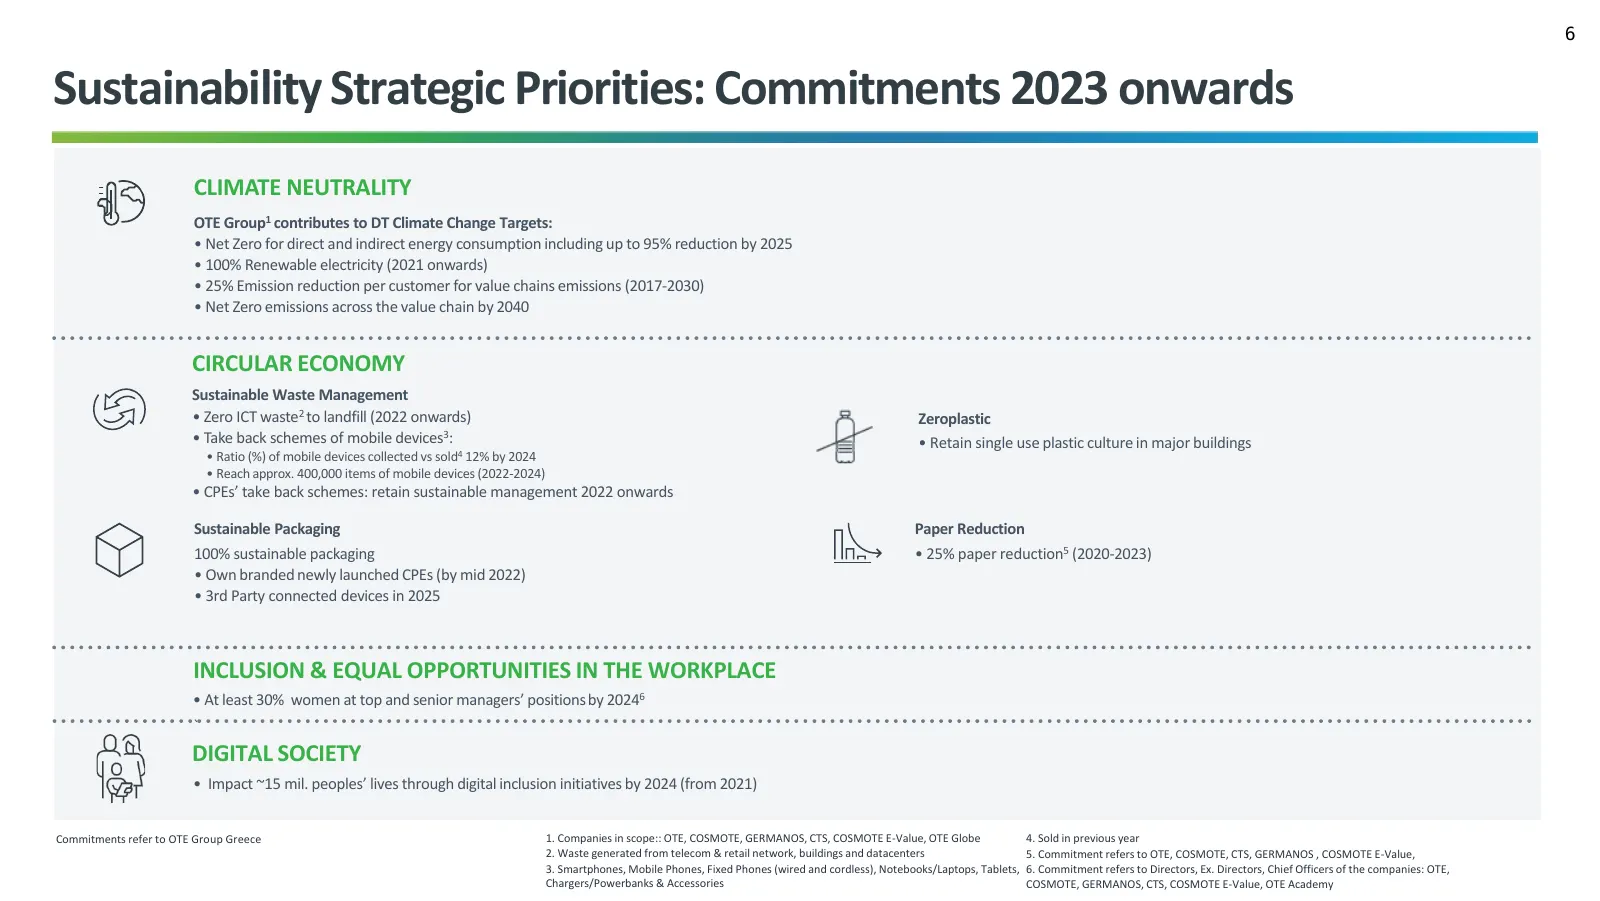
Slide 6: Sustainability Strategic Priorities: Commitments 2023 onwards
6 Sustainability Strategic Priorities: Commitments 2023 onwards CLIMATE NEUTRALITY OTE Group1 contributes to DT Climate Change Targets: • Net Zero for direct and indirect energy consumption including up to 95% reduction by 2025 • 100% Renewable electricity (2021 onwards) • 25% Emission reduction per
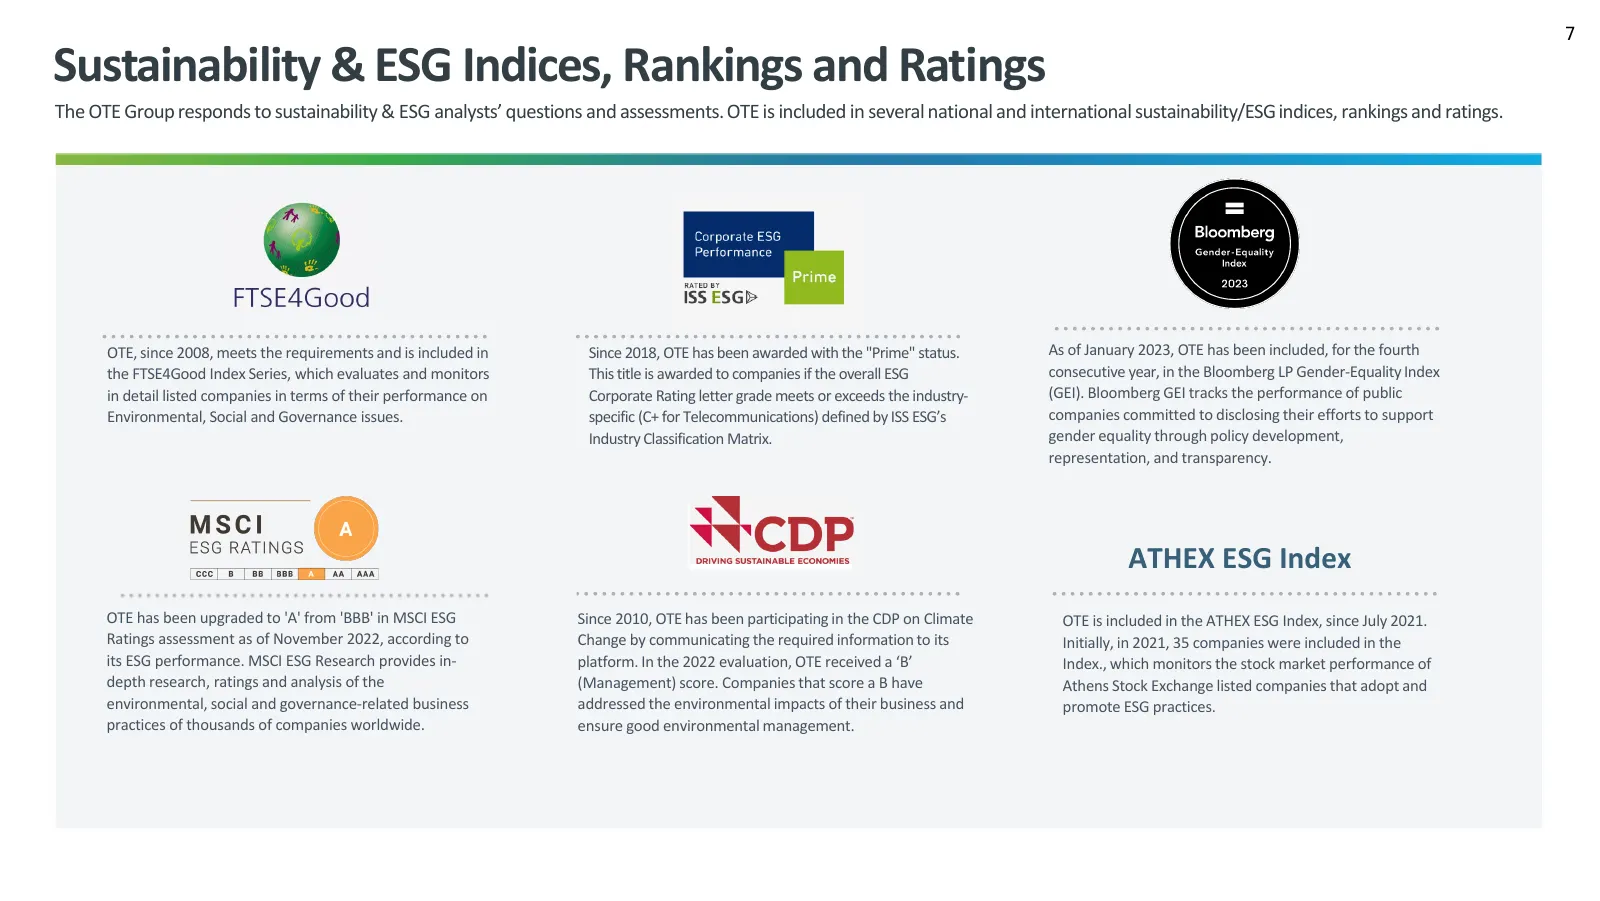
Slide 7: Sustainability & ESG Indices, Rankings and Ratings
7 Sustainability & ESG Indices, Rankings and Ratings The OTE Group responds to sustainability & ESG analysts’ questions and assessments. OTE is included in several national and international sustainability/ESG indices, rankings and ratings. OTE, since 2008, meets the requirements and is included in

Slide 8: Financial Review
OTE Group Q4 2022 Results Financial Review
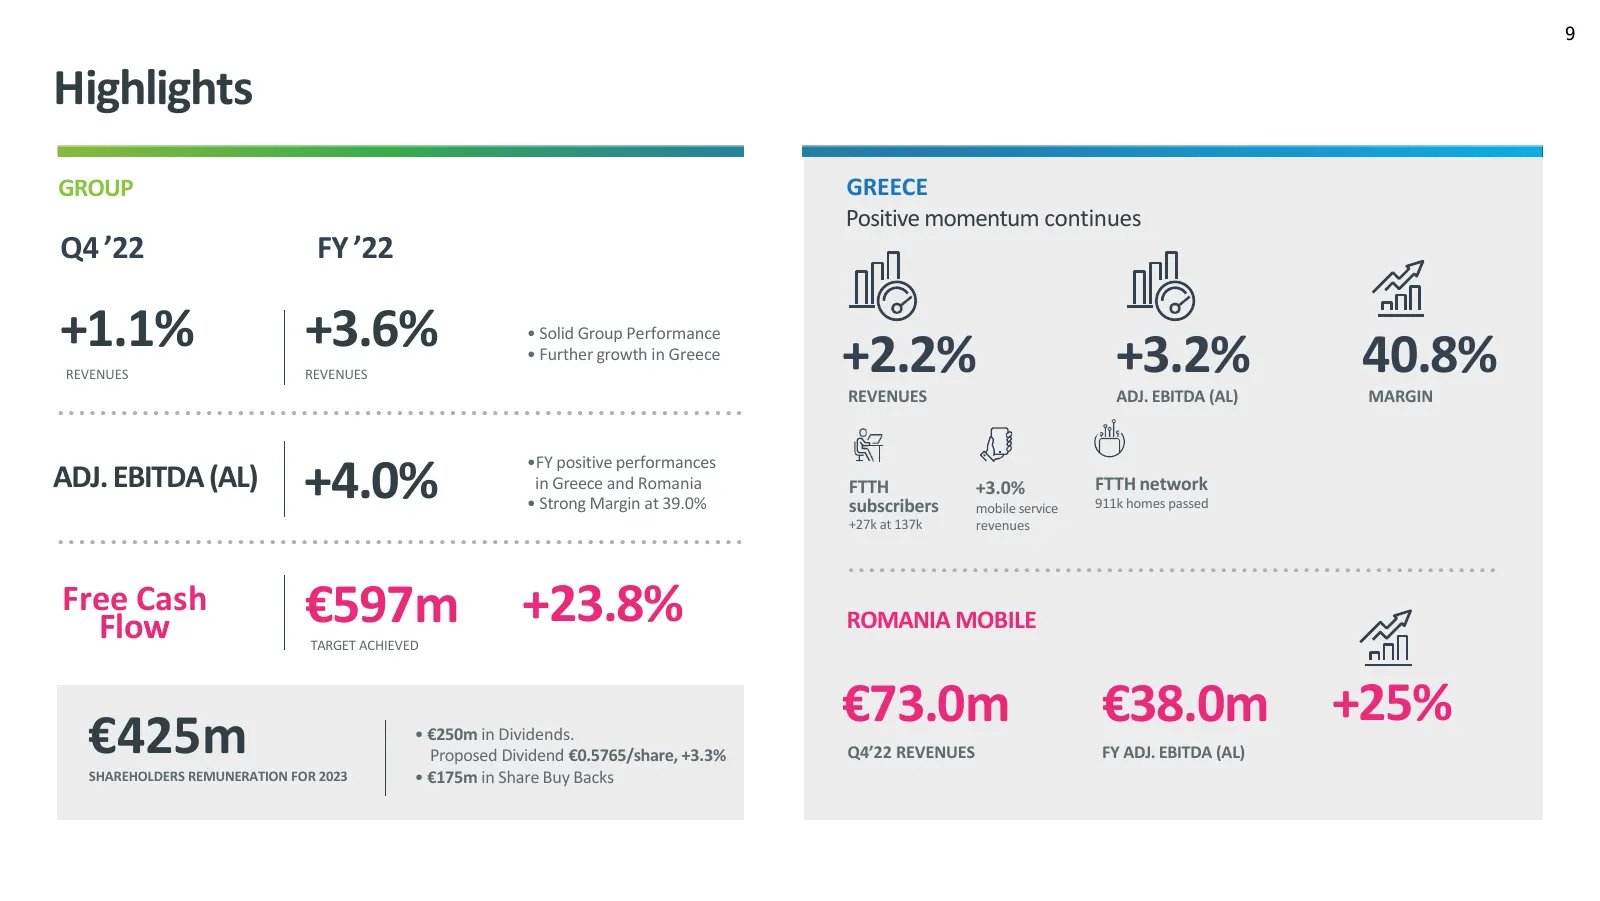
Slide 9: Highlights
9 Highlights GROUP GREECE Positive momentum continues Q4 ’22 FY ’22 +1.1% +3.6% • Solid Group Performance • Further growth in Greece +2.2% +3.2% 40.8% REVENUES REVENUES REVENUES ADJ. EBITDA (AL) MARGIN •FY positive performances ADJ. EBITDA (AL) +4.0% in Greece and Romania • Strong Margin at 39.0% FT
Slide 10: Group Overview
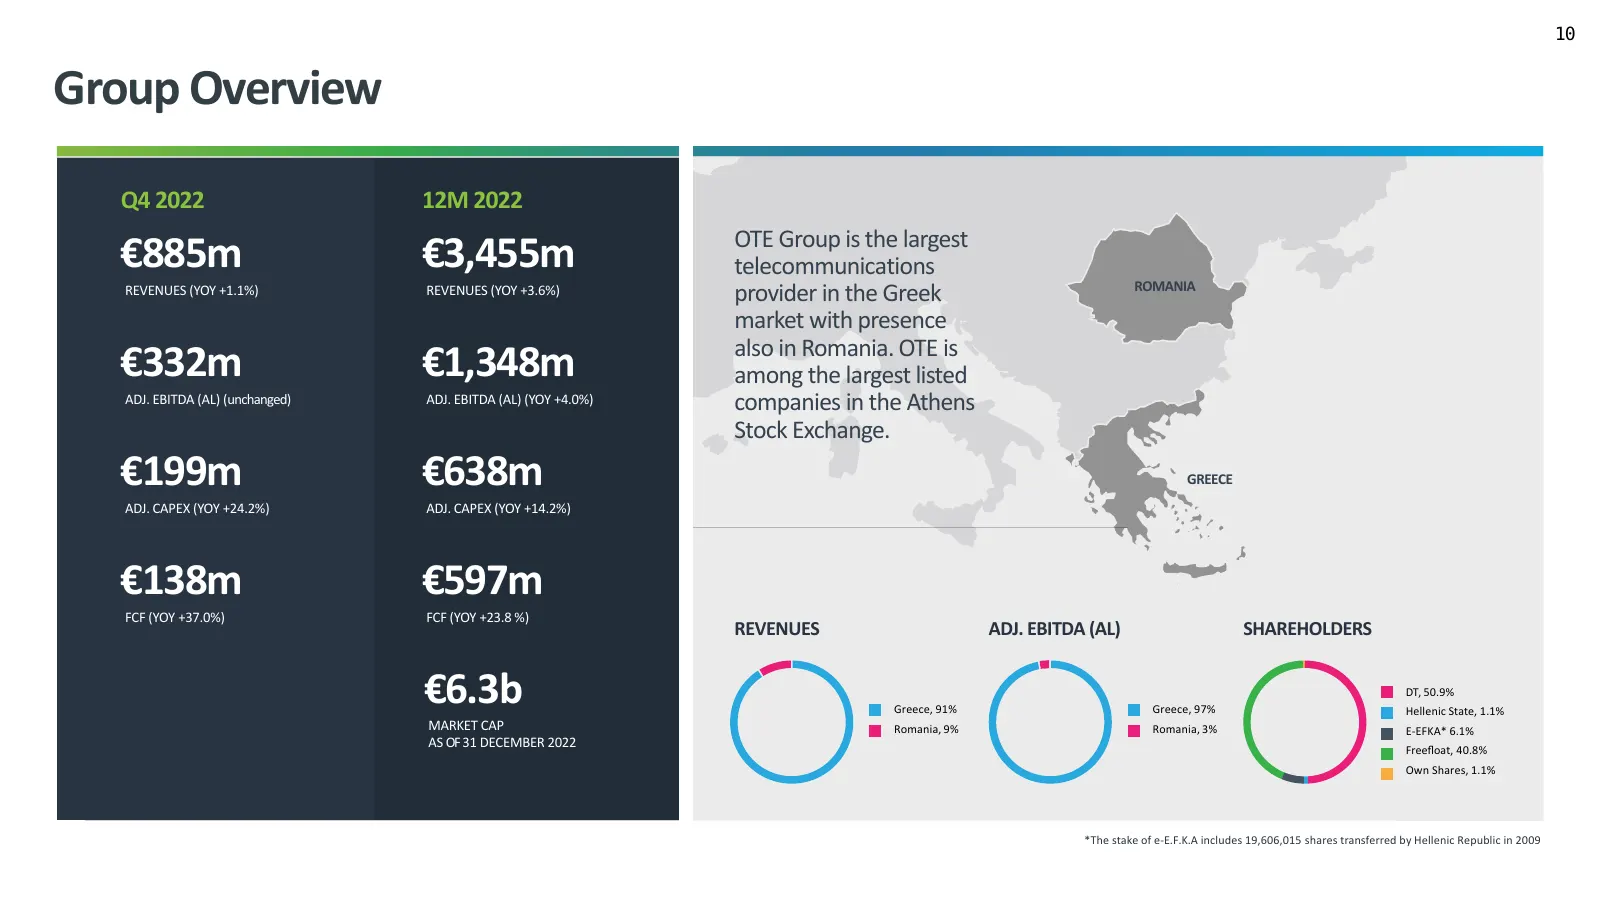
10 Group Overview Q4 2022 12M 2022 OTE Group is the largest €885m €3,455m telecommunications ROMANIA REVENUES (YOY +1.1%) REVENUES (YOY +3.6%) provider in the Greek market with presence also in Romania. OTE is €332m €1,348m among the largest listed ADJ. EBITDA (AL) (unchanged) ADJ. EBITDA (AL) (YOY
Slide 11: Revenues & Adj. EBITDA (AL)
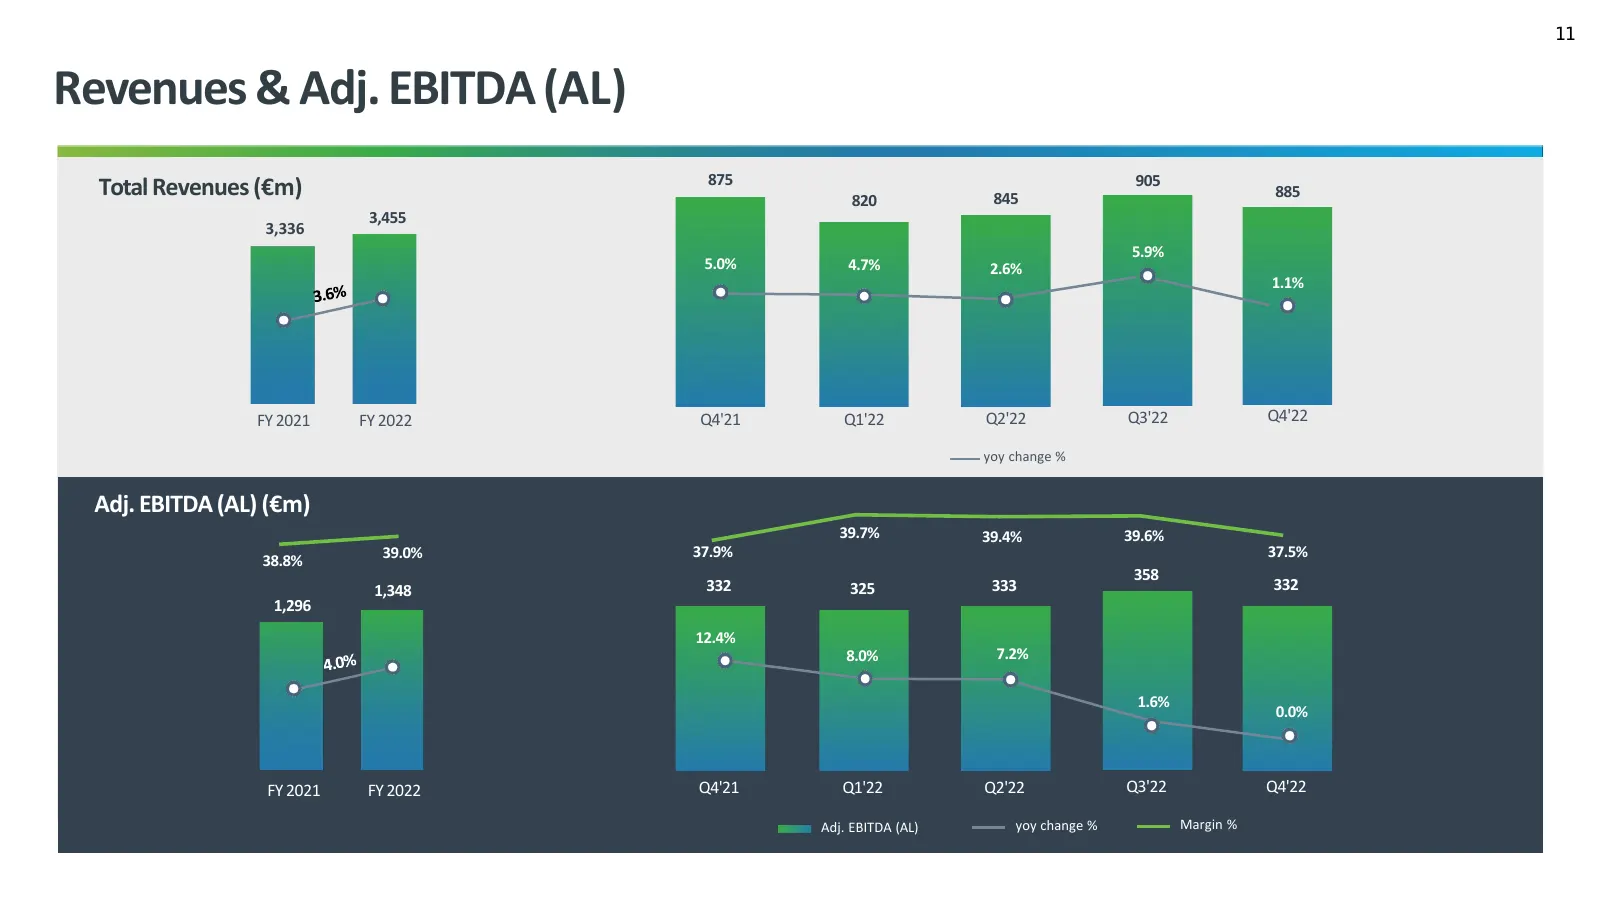
11 Revenues & Adj. EBITDA (AL) 875 905 Total Revenues (€m) 820 845 885 3,455 3,336 5.9% 5.0% 4.7% 2.6% 1.1% FY 2021 FY 2022 Q4'21 Q1'22 Q2'22 Q3'22 Q4'22 yoy change % Adj. EBITDA (AL) (€m) 39.7% 39.4% 39.6% 39.0% 37.9% 37.5% 38.8% 358 1,348 332 325 333 332 1,296 12.4% 8.0% 7.2% 1.6% 0.0% FY 2021 FY
Slide 12: Capex
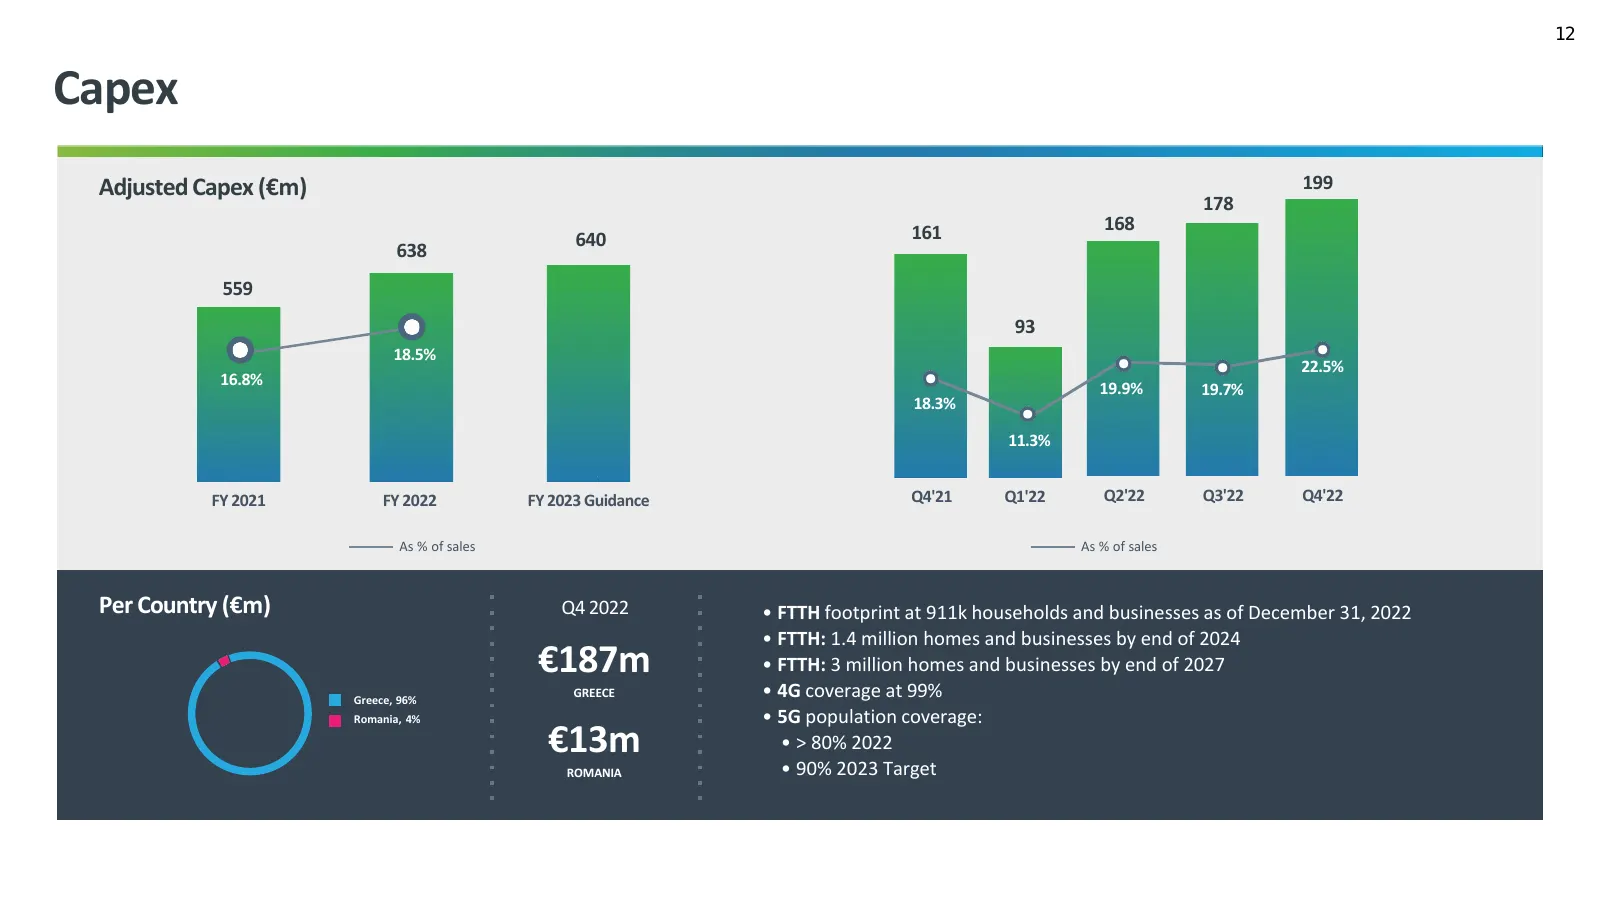
12 Capex Adjusted Capex (€m) 199 &!! $!!" # 178 %!* 161 ( !"$# 168 638 640%)! ( !" # 559 ' !"$# ' !" # 93 &!"$# 18.5% &!!" # 22.5% 16.8% 19.9% %!"$# 19.7% 18.3% %!" # 11.3% $!"# ! ! !"# FY 2021 FY 2022 FY 2023 Guidance Q4'21 Q1'22 Q2'22 Q3'22 Q4'22 As % of sales As % of sales Per Country (€m) Q4 202
Slide 13: Cashflow
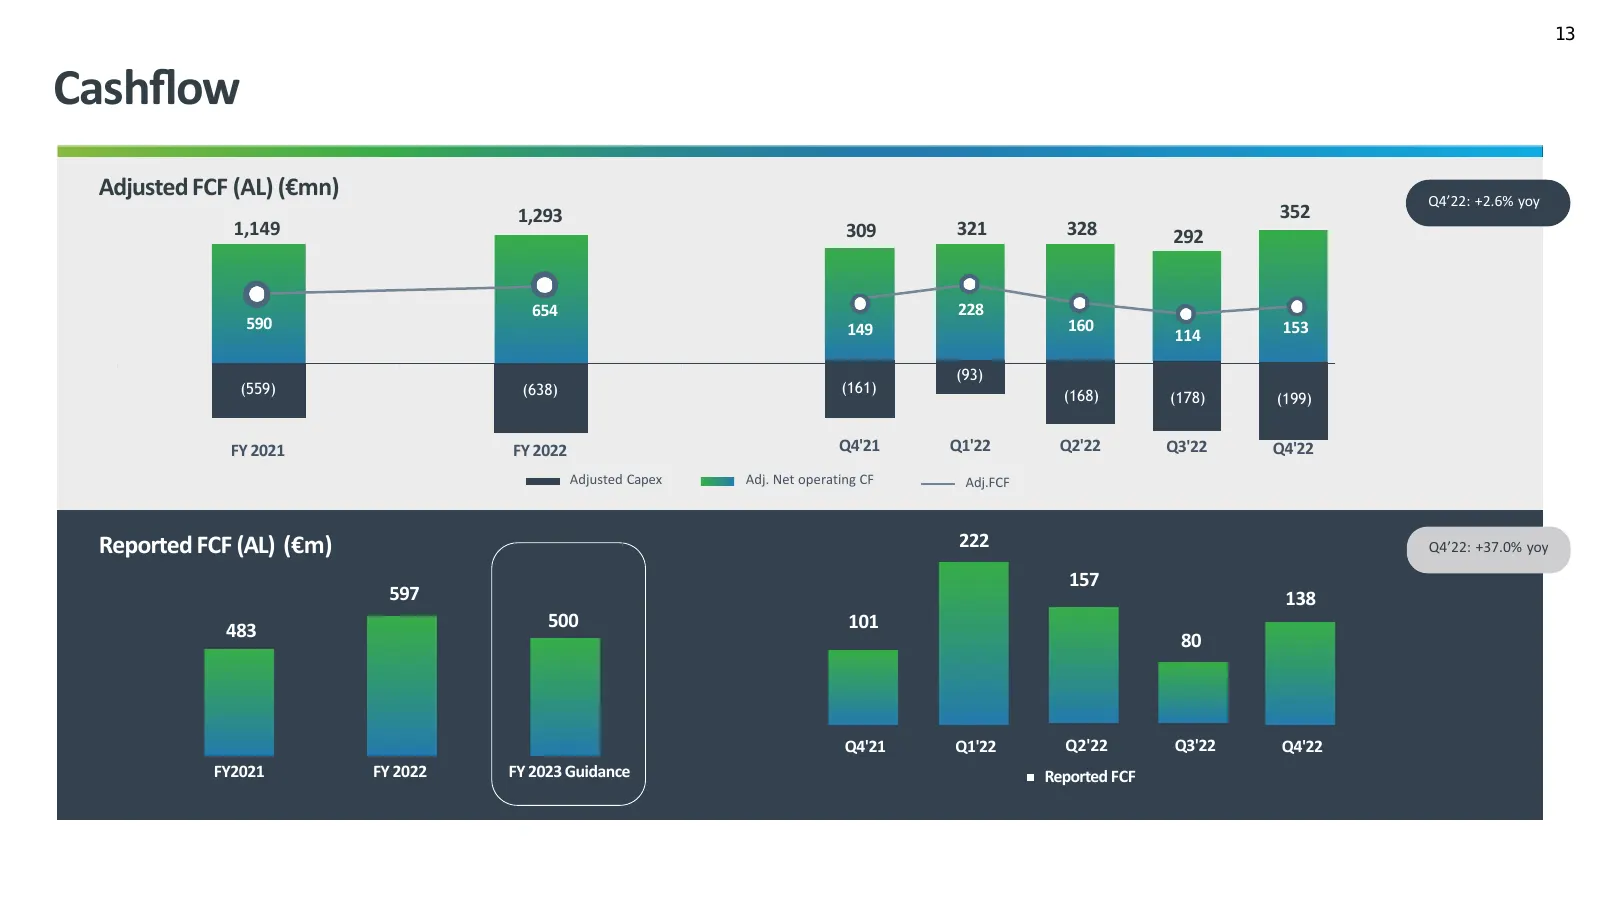
13 Cashflow Adjusted FCF (AL) (€mn) Q4’22: +2.6% yoy 1,293 352 1,149 309 321 328 292 654 228 590 149 160 153 114 (93) (559) (638) (161) (168) (178) (199) FY 2021 FY 2022 Q4'21 Q1'22 Q2'22 Q3'22 Q4'22 Adjusted Capex Adj. Net operating CF Adj.FCF Reported FCF (AL) (€m) 222 Q4’22: +37.0% yoy 157 597 138
Slide 14: Shareholder Remuneration Policy
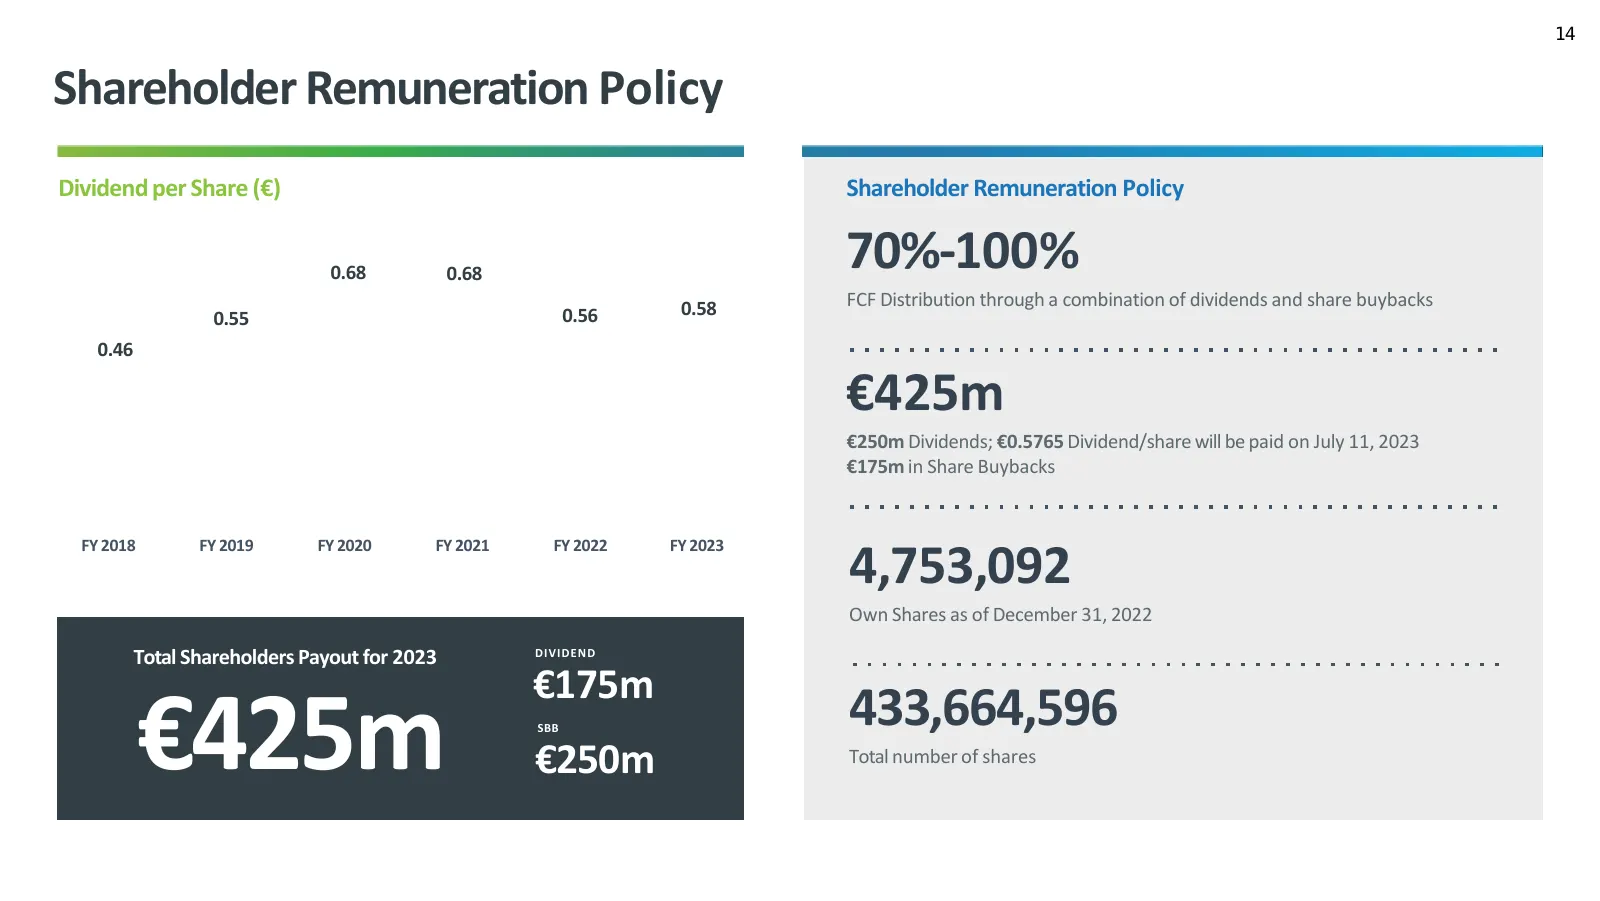
14 Shareholder Remuneration Policy Dividend per Share (€) Shareholder Remuneration Policy 0.68 0.68 70%-100% 0.58 FCF Distribution through a combination of dividends and share buybacks 0.55 0.56 0.46 €425m €250m Dividends; €0.5765 Dividend/share will be paid on July 11, 2023 €175m in Share Buybacks
Slide 15: Debt and Liquidity Profile
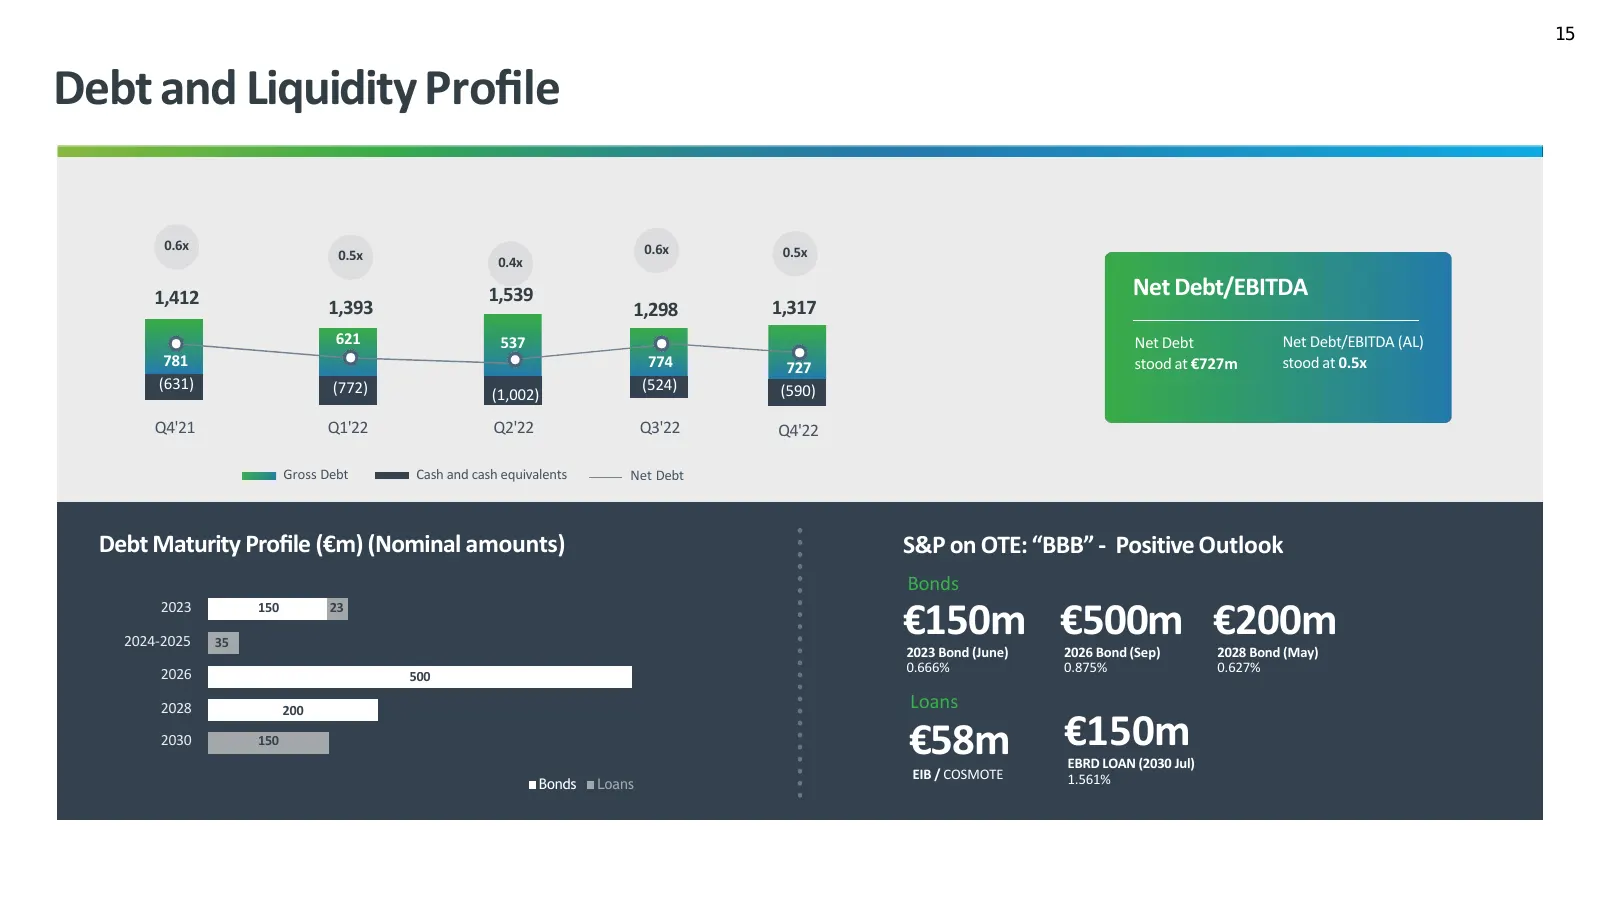
15 Debt and Liquidity Profile 0.6x 0.6x 0.5x 0.5x 0.4x 1,412 1,539 Net Debt/EBITDA 1,393 1,298 1,317 621 537 Net Debt Net Debt/EBITDA (AL) 781 774 727 stood at €727m stood at 0.5x (631) (772) (524) (590) (1,002) Q4'21 Q1'22 Q2'22 Q3'22 Q4'22 Gross Debt Cash and cash equivalents Net Debt Debt Maturity

Slide 16: Greece
OTE Group Q4 2022 Results Greece
Slide 17: Greece – Financial Overview
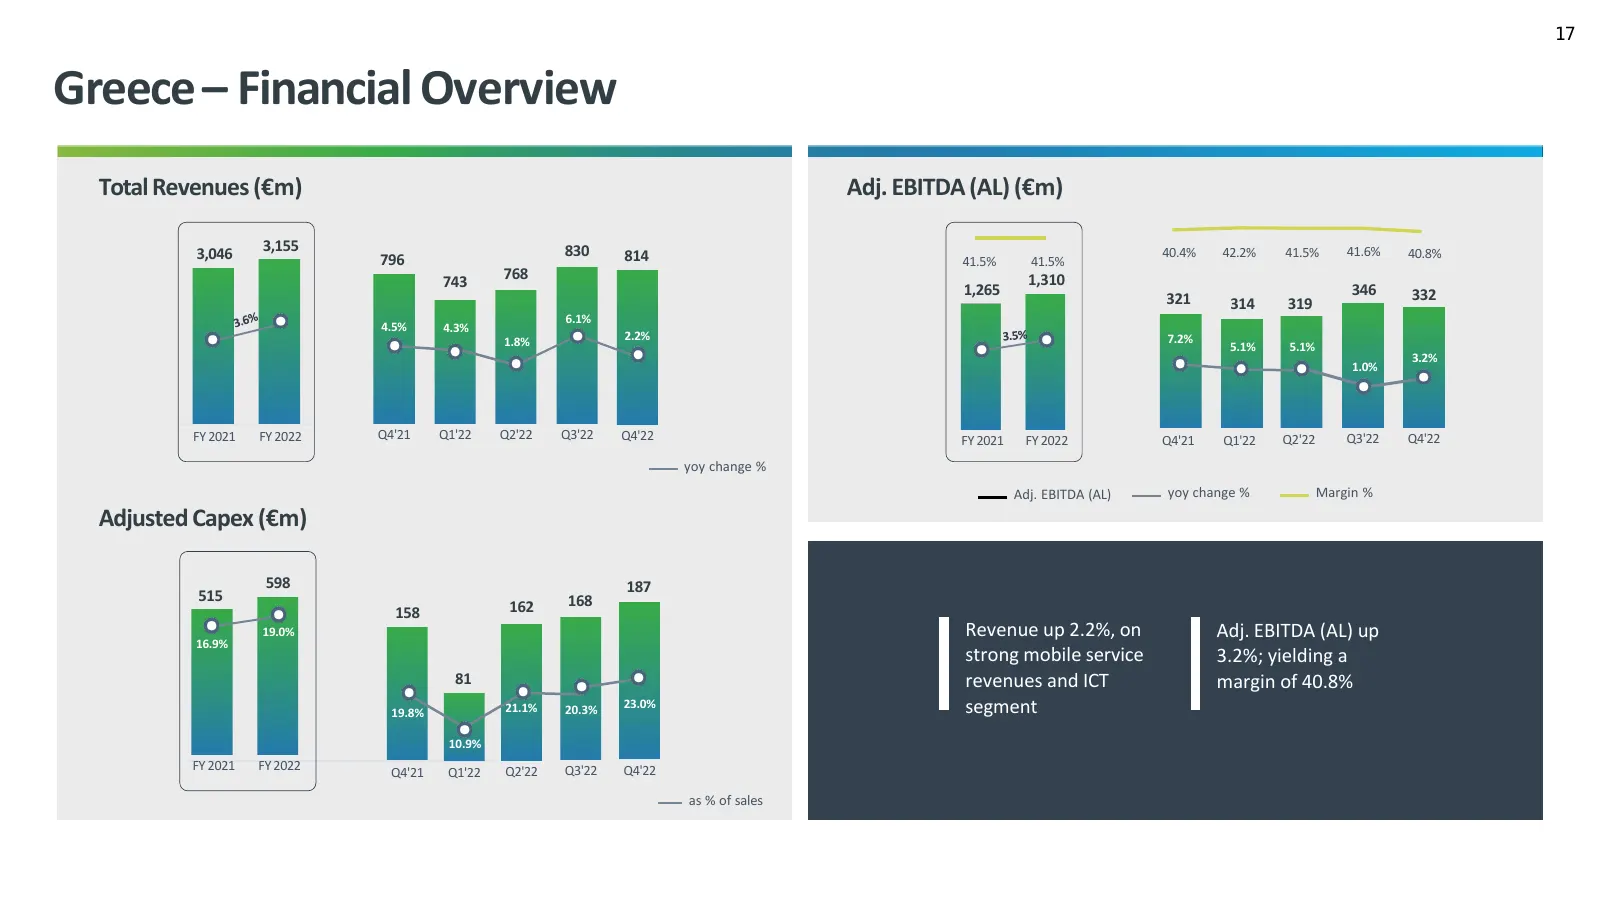
17 Greece – Financial Overview Total Revenues (€m) Adj. EBITDA (AL) (€m) 3,340 3,046 3,155 30.0% 830 40.4% 42.2% 41.5% 41.6% 40.8% 25.0% 796 814 41.5% 41.5% 2,840 20.0% 743 768 1,310 1,265 346 332 2,340 15.0% 321 314 319 6.1% 10.0% 4.5% 4.3% 1,840 5.0% 1.8% 2.2% 7.2% 0.0% 5.1% 5.1% 3.2% 1,340 - 5.0%
Slide 18: Greece – Financial Overview
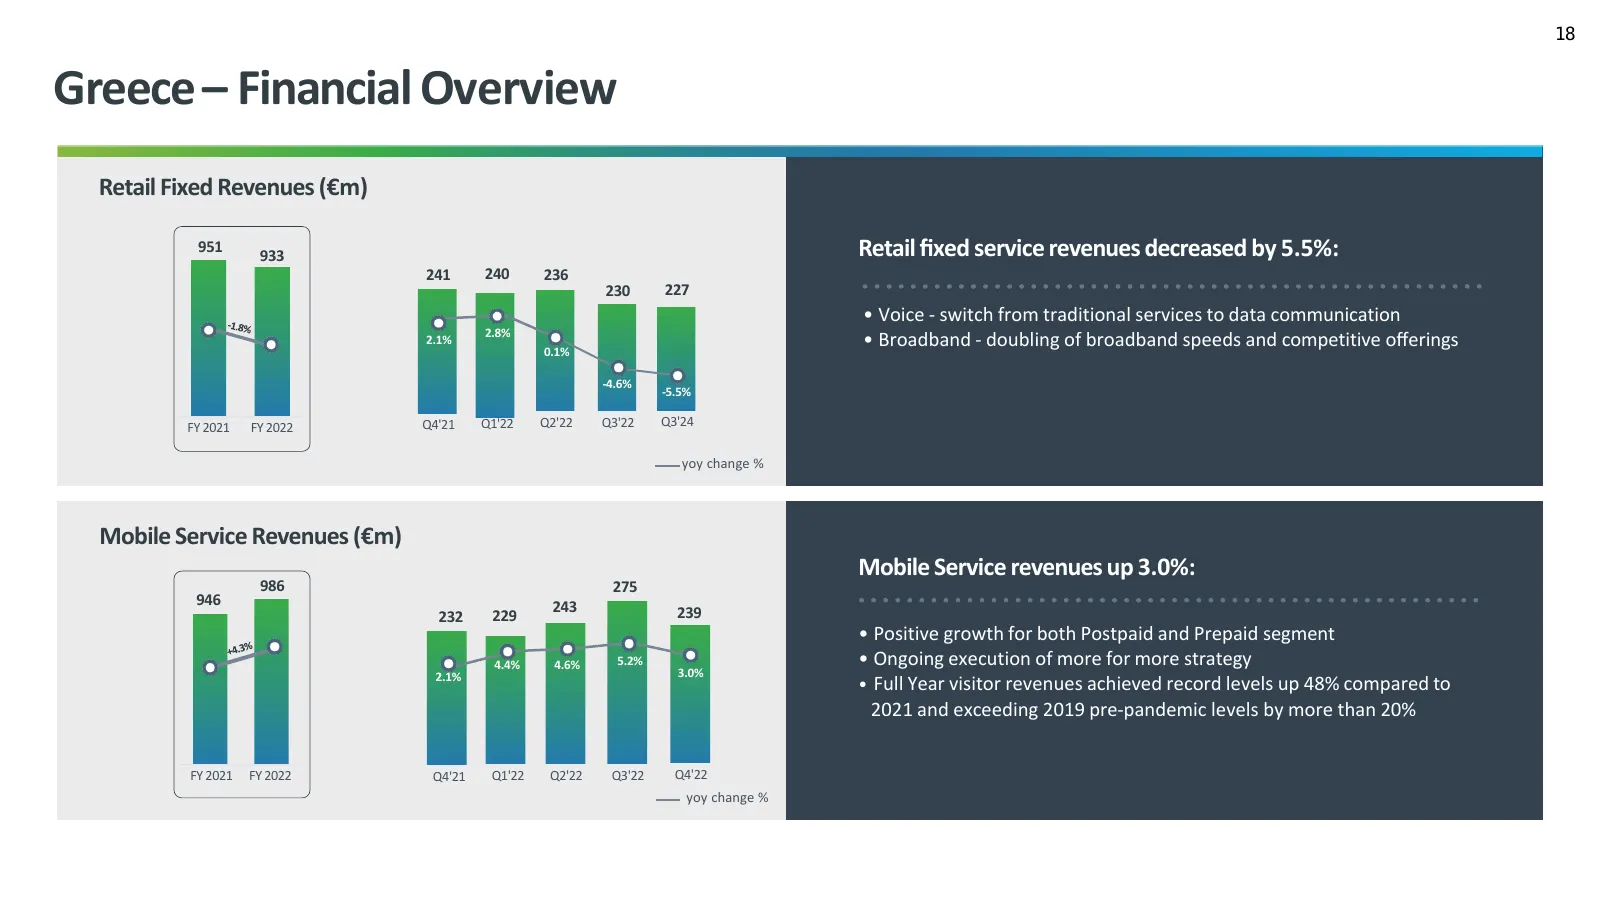
18 Greece – Financial Overview Retail Fixed Revenues (€m) 951 933 Retail fixed service revenues decreased by 5.5%: 241 240 236 230 227 • Voice - switch from traditional services to data communication 2.8% 2.1% 0.1% • Broadband - doubling of broadband speeds and competitive offerings -4.6% -5.5% FY 202
Slide 19: Greece – Fixed KPIs
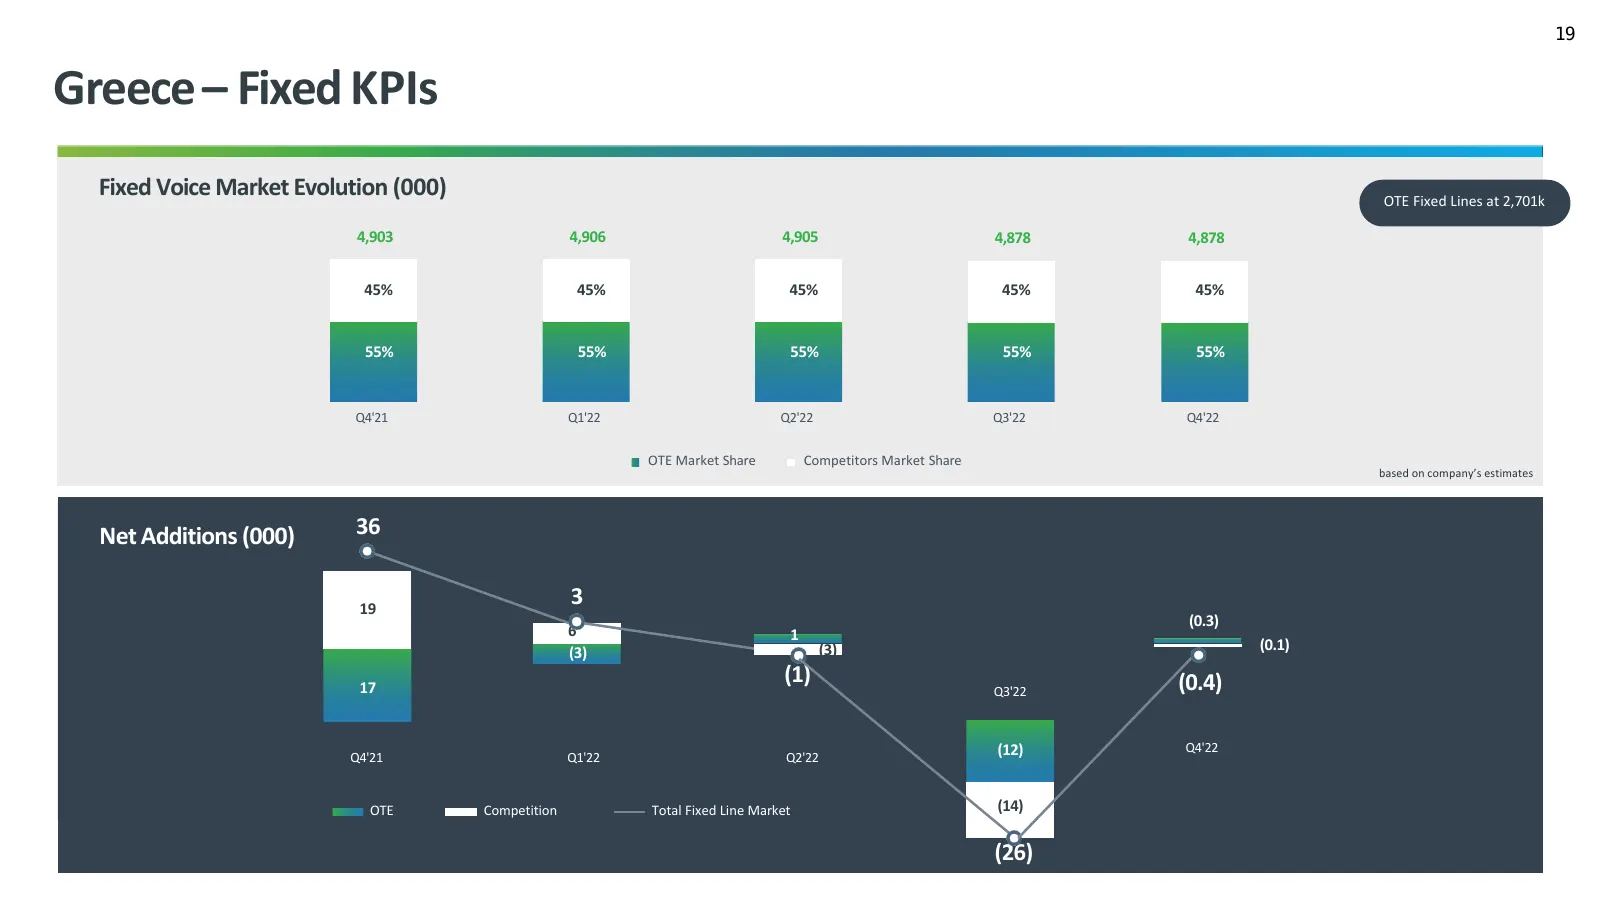
19 Greece – Fixed KPIs Fixed Voice Market Evolution (000) OTE Fixed Lines at 2,701k 4,903 4,906 4,905 4,878 4,878 45% 45% 45% 45% 45% 55% 55% 55% 55% 55% Q4'21 Q1'22 Q2'22 Q3'22 Q4'22 OTE Market Share Competitors Market Share based on company’s estimates Net Additions (000) 36 19 3 (0.3) 6 1 (3) (0.
Slide 20: Greece – Broadband KPIs
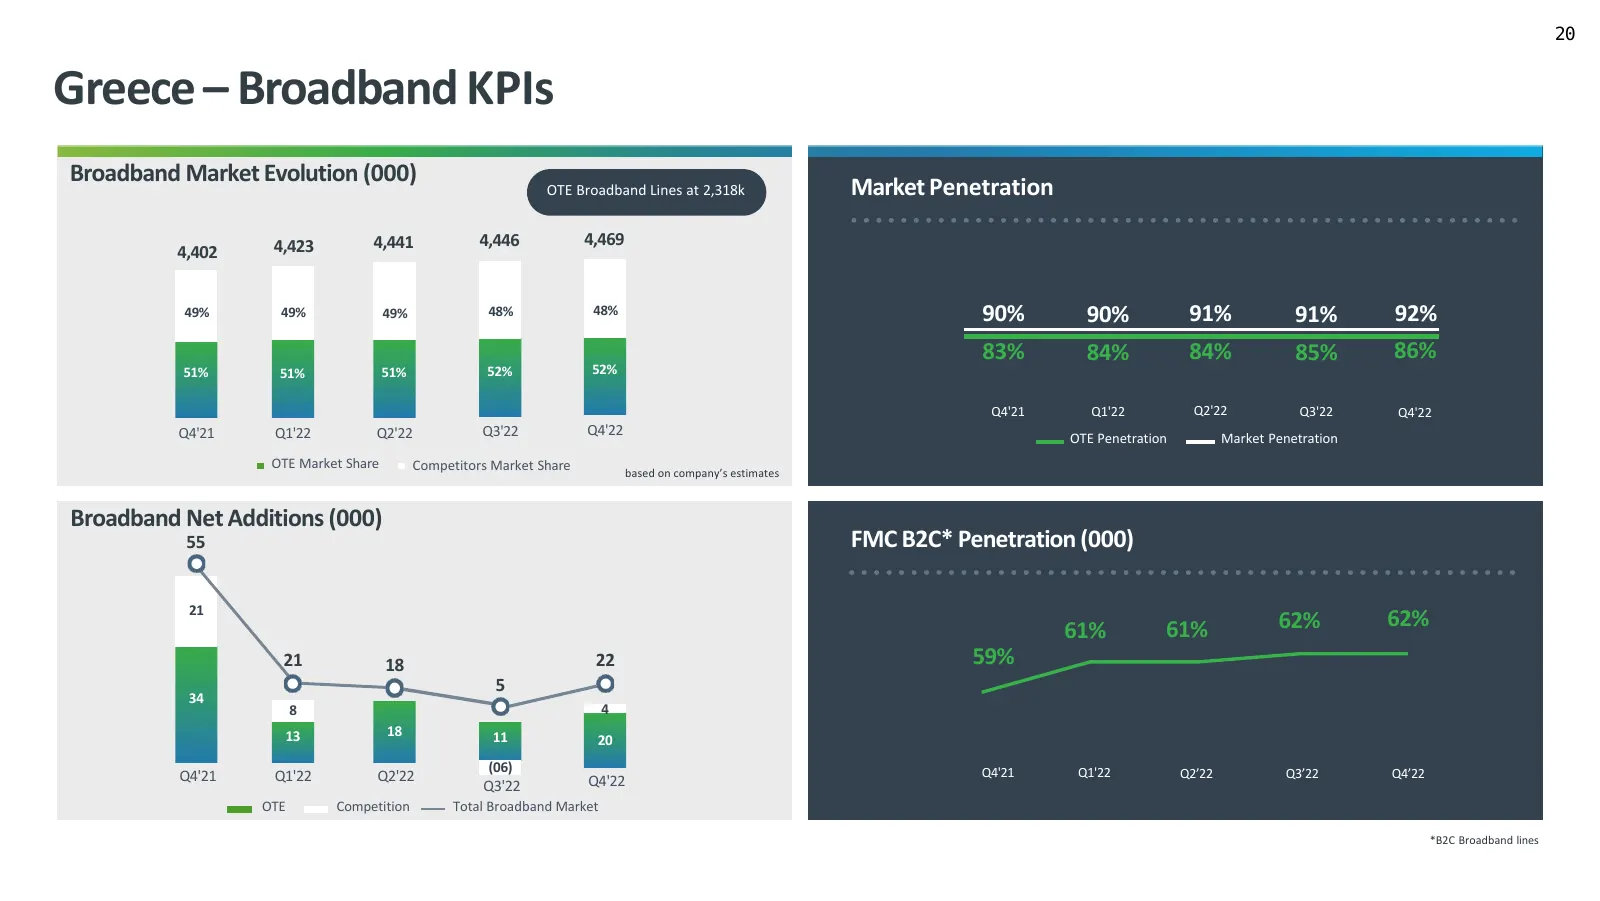
20 Greece – Broadband KPIs Broadband Market Evolution (000) OTE Broadband Lines at 2,318k Market Penetration 4,423 4,441 4,446 4,469 4,402 49% 49% 49% 48% 48% 90% 90% 91% 91% 92% 83% 84% 84% 85% 86% 51% 51% 51% 52% 52% Q4'21 Q1'22 Q2'22 Q3'22 Q4'22 Q4'21 Q1'22 Q2'22 Q3'22 Q4'22 OTE Penetration Marke
Slide 21: Greece – Fiber KPIs
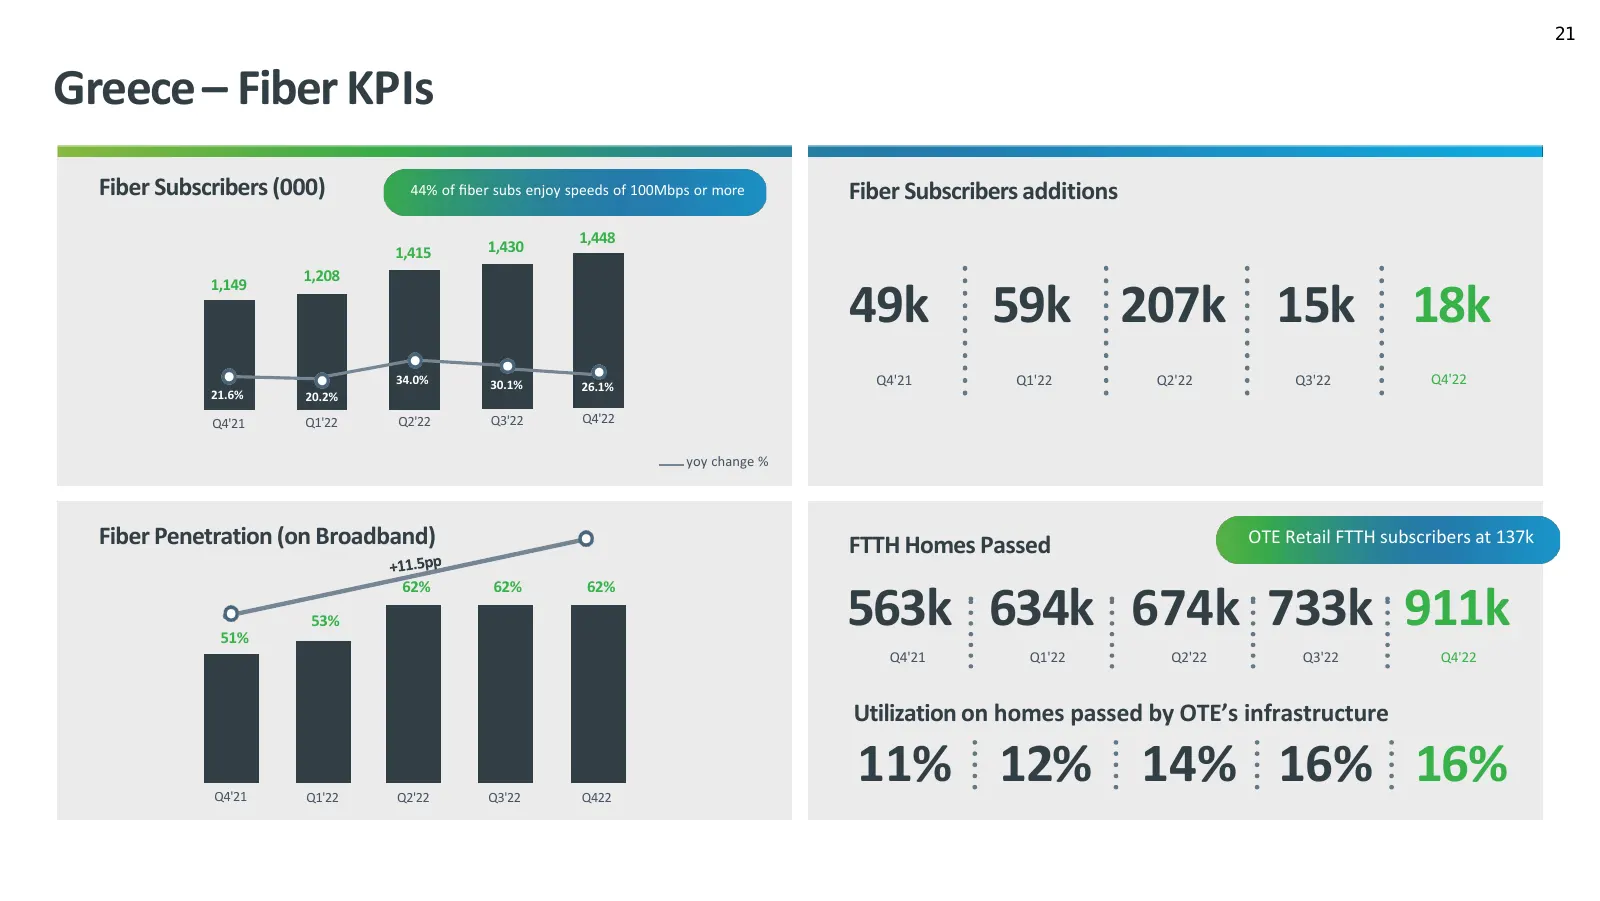
21 Greece – Fiber KPIs Fiber Subscribers (000) 44% of fiber subs enjoy speeds of 100Mbps or more Fiber Subscribers additions 1,448 1,415 1,430 1,208 1,149 49k 59k 207k 15k 18k 34.0% 30.1% 26.1% Q4'21 Q1'22 Q2'22 Q3'22 Q4'22 21.6% 20.2% Q4'21 Q1'22 Q2'22 Q3'22 Q4'22 yoy change % Fiber Penetration (on
Slide 22: Greece – COSMOTE TV
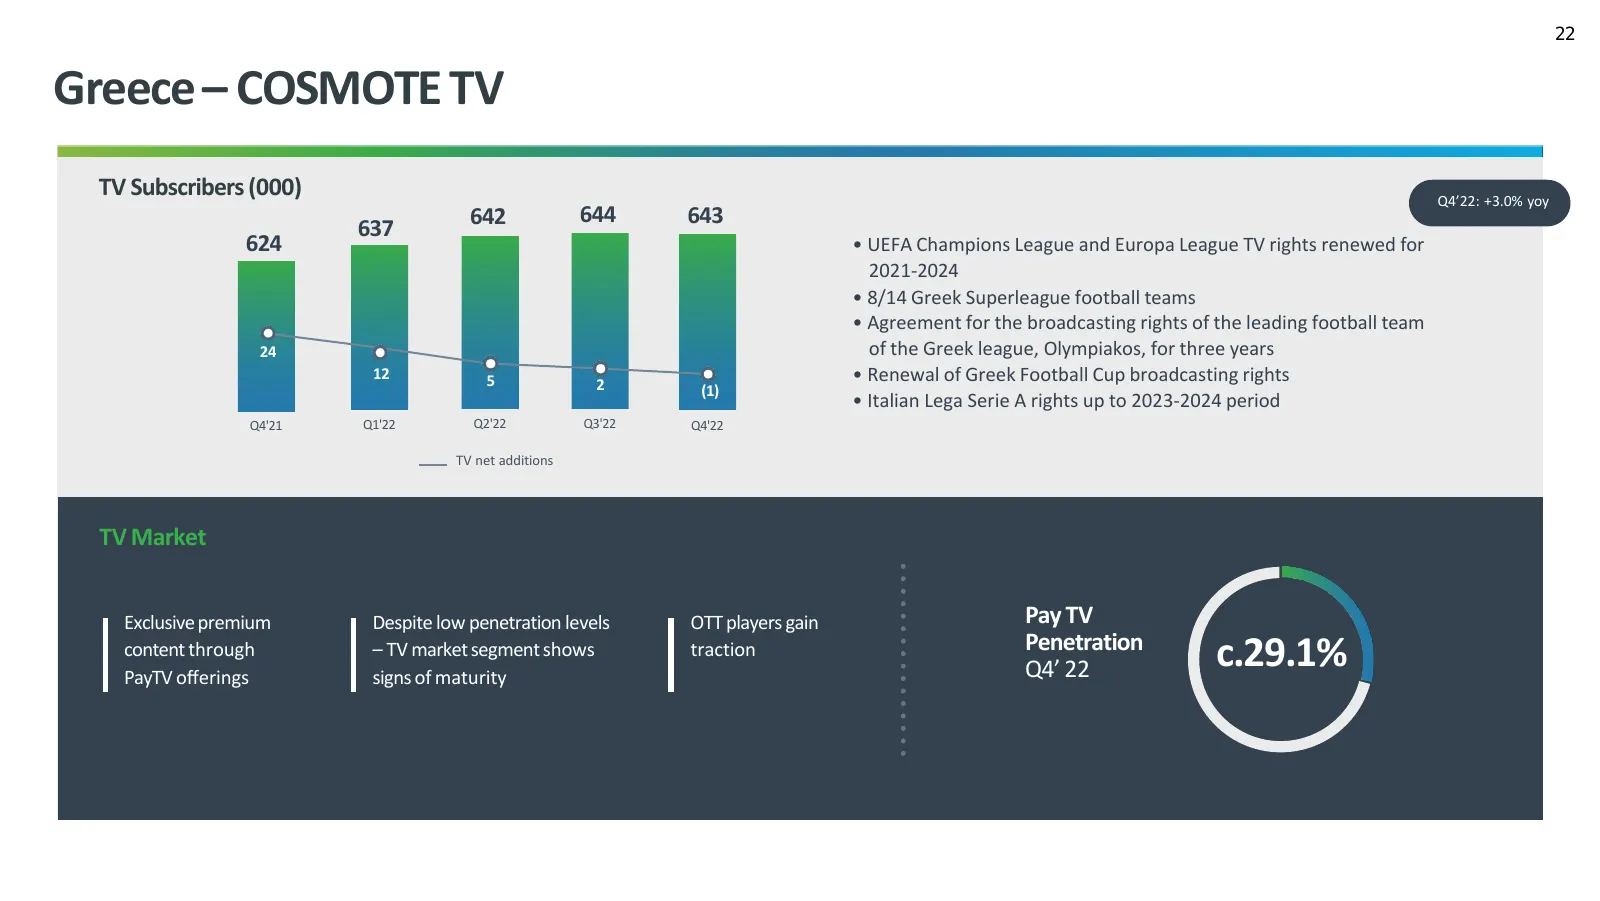
22 Greece – COSMOTE TV TV Subscribers (000) Q4’22: +3.0% yoy 642 644 643 637 624 • UEFA Champions League and Europa League TV rights renewed for 2021-2024 • 8/14 Greek Superleague football teams • Agreement for the broadcasting rights of the leading football team 24 of the Greek league, Olympiakos,
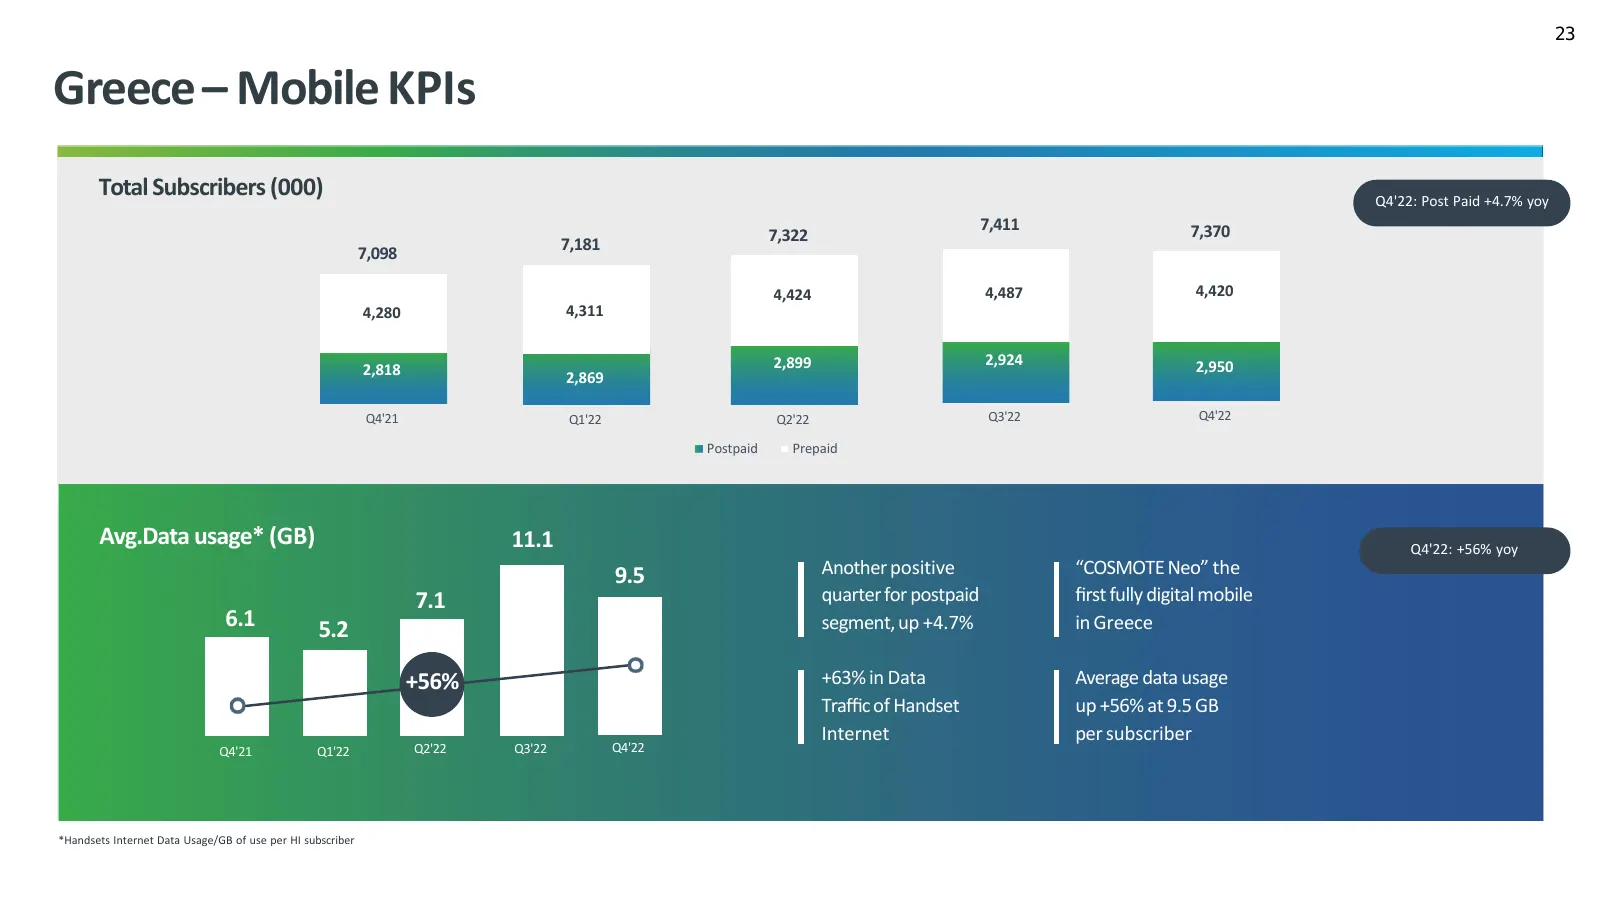
Slide 23: Greece – Mobile KPIs
23 Greece – Mobile KPIs Total Subscribers (000) Q4'22: Post Paid +4.7% yoy 7,411 7,370 7,322 7,181 7,098 4,424 4,487 4,420 4,280 4,311 2,899 2,924 2,950 2,818 2,869 Q4'21 Q1'22 Q2'22 Q3'22 Q4'22 Postpaid Prepaid Avg.Data usage* (GB) 11.1 Q4'22: +56% yoy 9.5 Another positive “COSMOTE Neo” the 7.1 qua
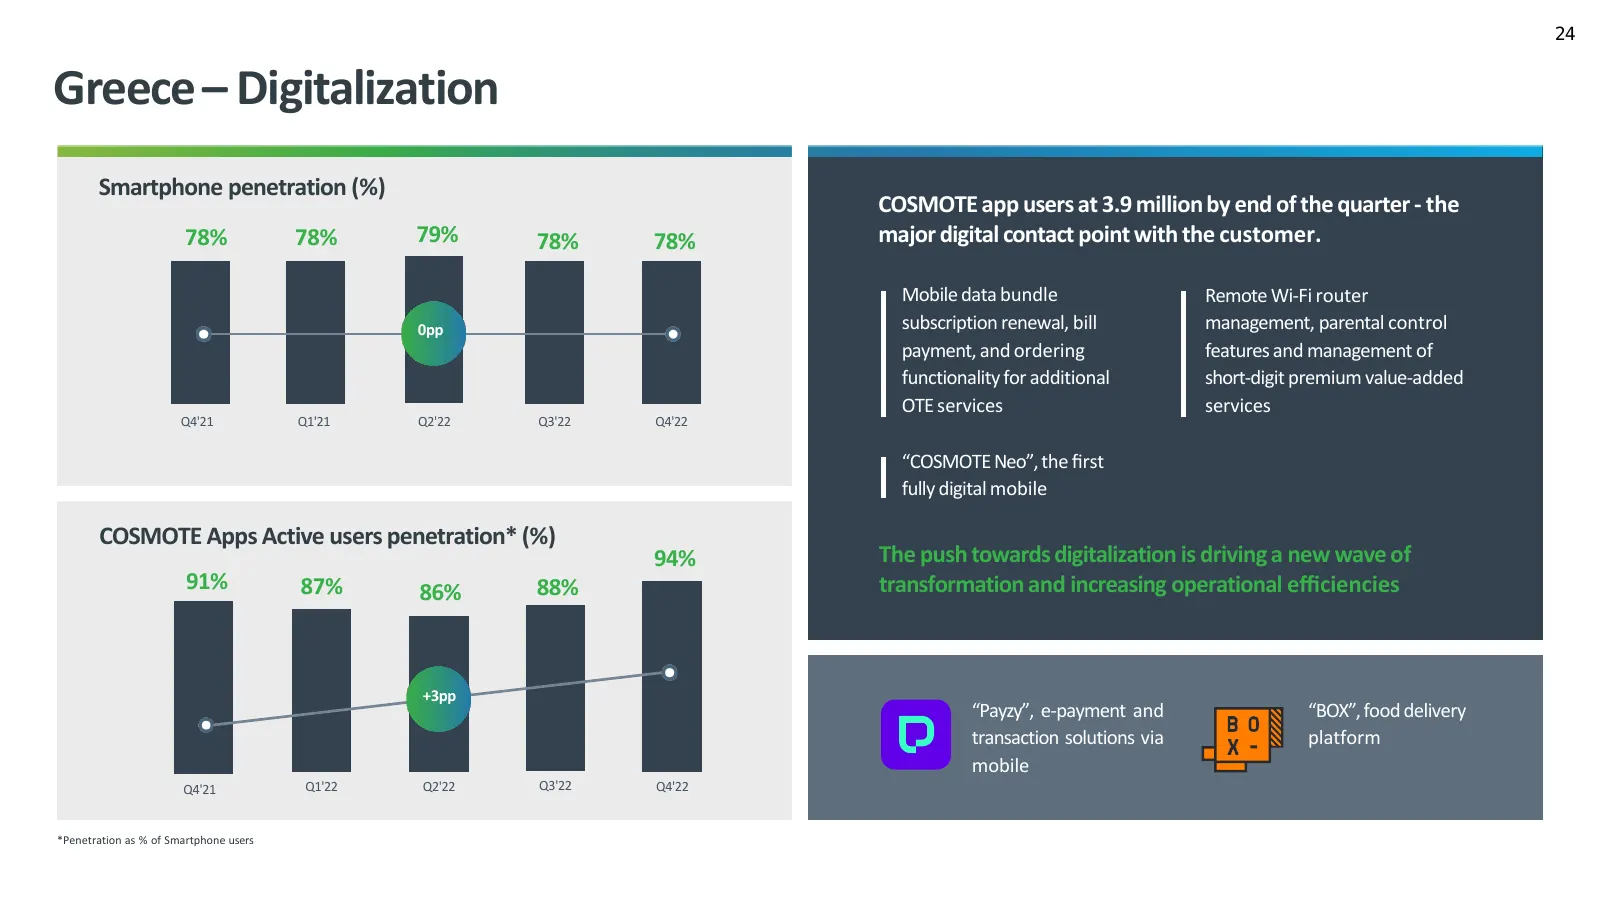
Slide 24: Greece – Digitalization
24 Greece – Digitalization Smartphone penetration (%) COSMOTE app users at 3.9 million by end of the quarter - the 78% 78% 79% 78% 78% major digital contact point with the customer. Mobile data bundle Remote Wi-Fi router 0pp subscription renewal, bill management, parental control payment, and orderi
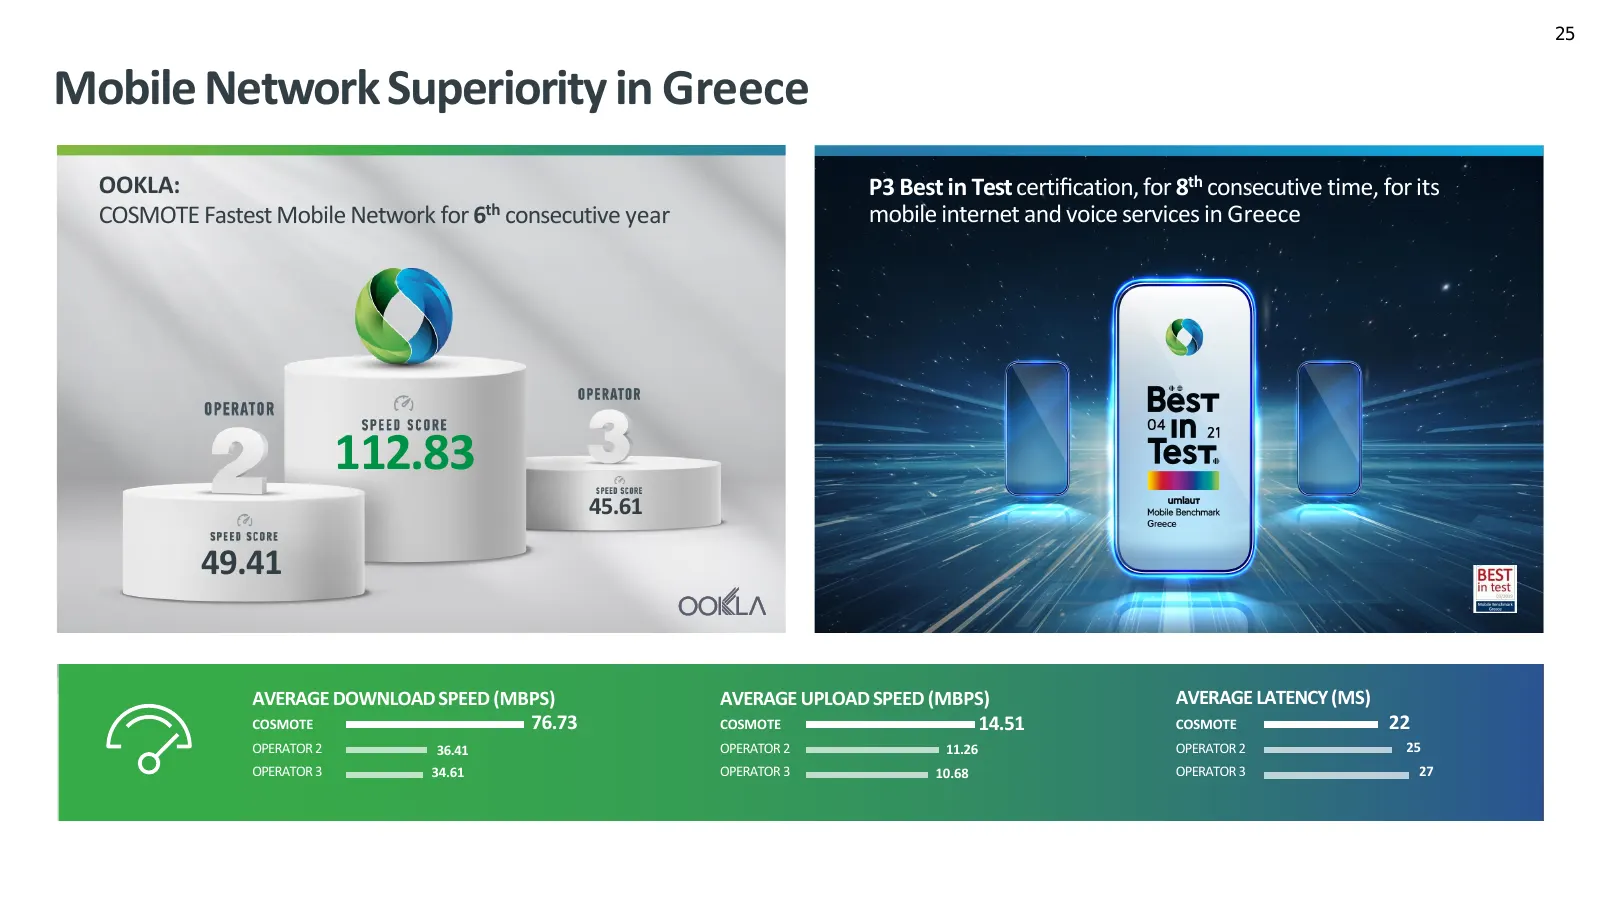
Slide 25: Mobile Network Superiority in Greece
25 Mobile Network Superiority in Greece OOKLA: P3 Best in Test certification, for 8th consecutive time, for its COSMOTE Fastest Mobile Network for 6th consecutive year mobile internet and voice services in Greece 112.83 45.61 49.41 AVERAGE DOWNLOAD SPEED (MBPS) AVERAGE UPLOAD SPEED (MBPS) AVERAGE LAT

Slide 26: Romania Mobile
OTE Group Q4 2022 Results Romania Mobile
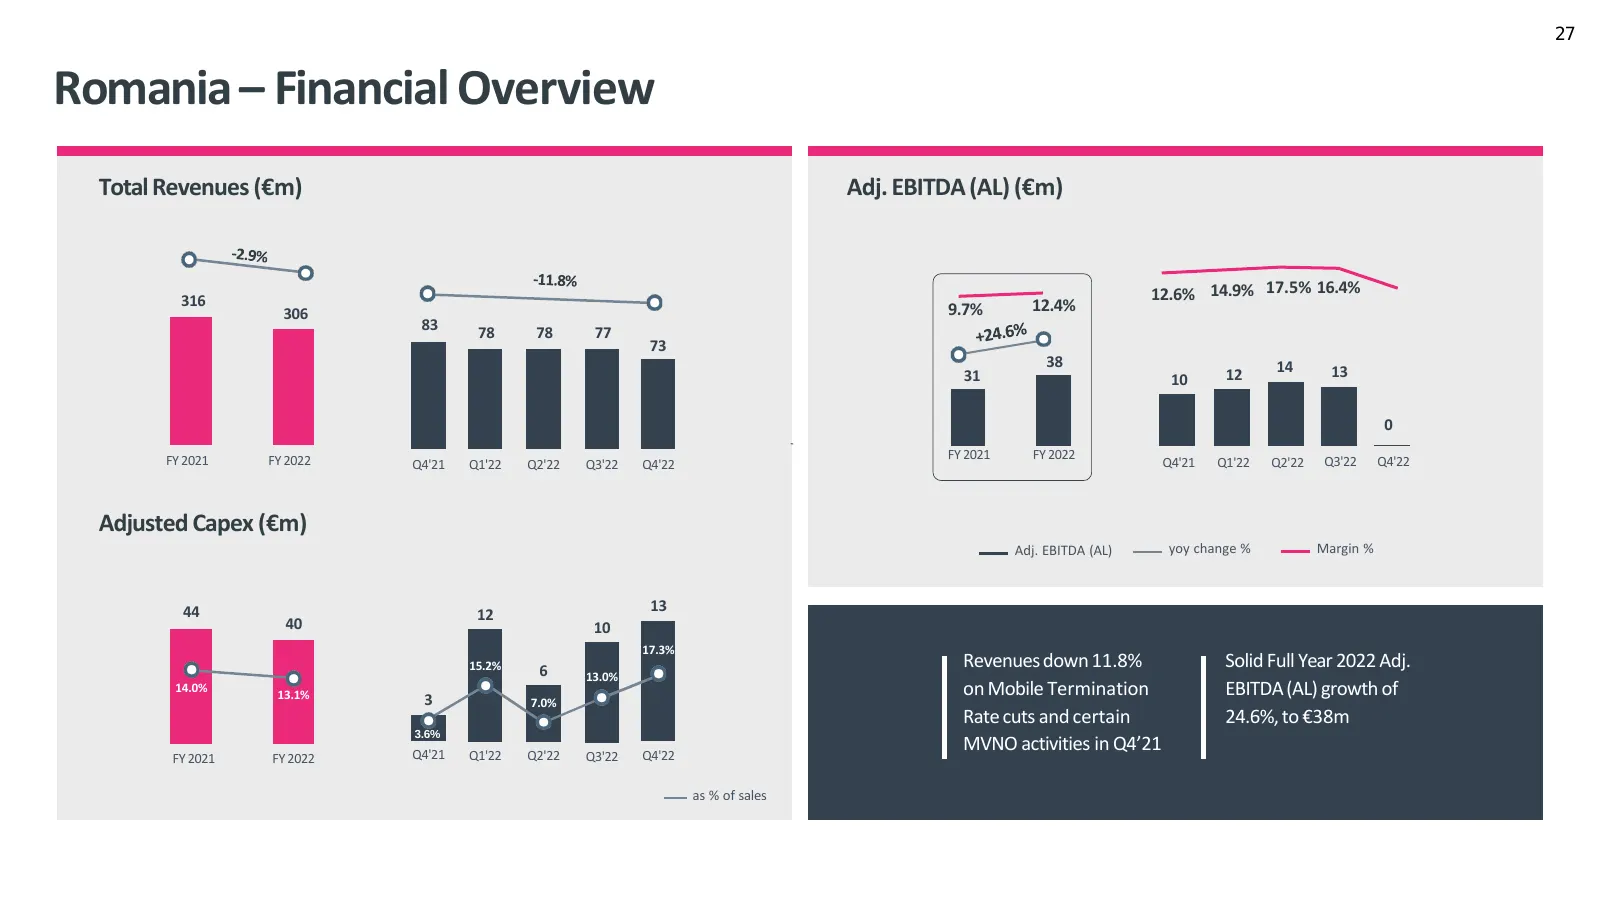
Slide 27: Romania – Financial Overview
27 Romania – Financial Overview Total Revenues (€m) Adj. EBITDA (AL) (€m) 316 12.6% 14.9% 17.5% 16.4% 306 9.7% 12.4% 83 78 78 77 73 38 14 31 12 13 10 0 FY 2021 FY 2022 FY 2021 FY 2022 Q4'21 Q1'22 Q2'22 Q3'22 Q4'22 Q4'21 Q1'22 Q2'22 Q3'22 Q4'22 Adjusted Capex (€m) Adj. EBITDA (AL) yoy change % Margin
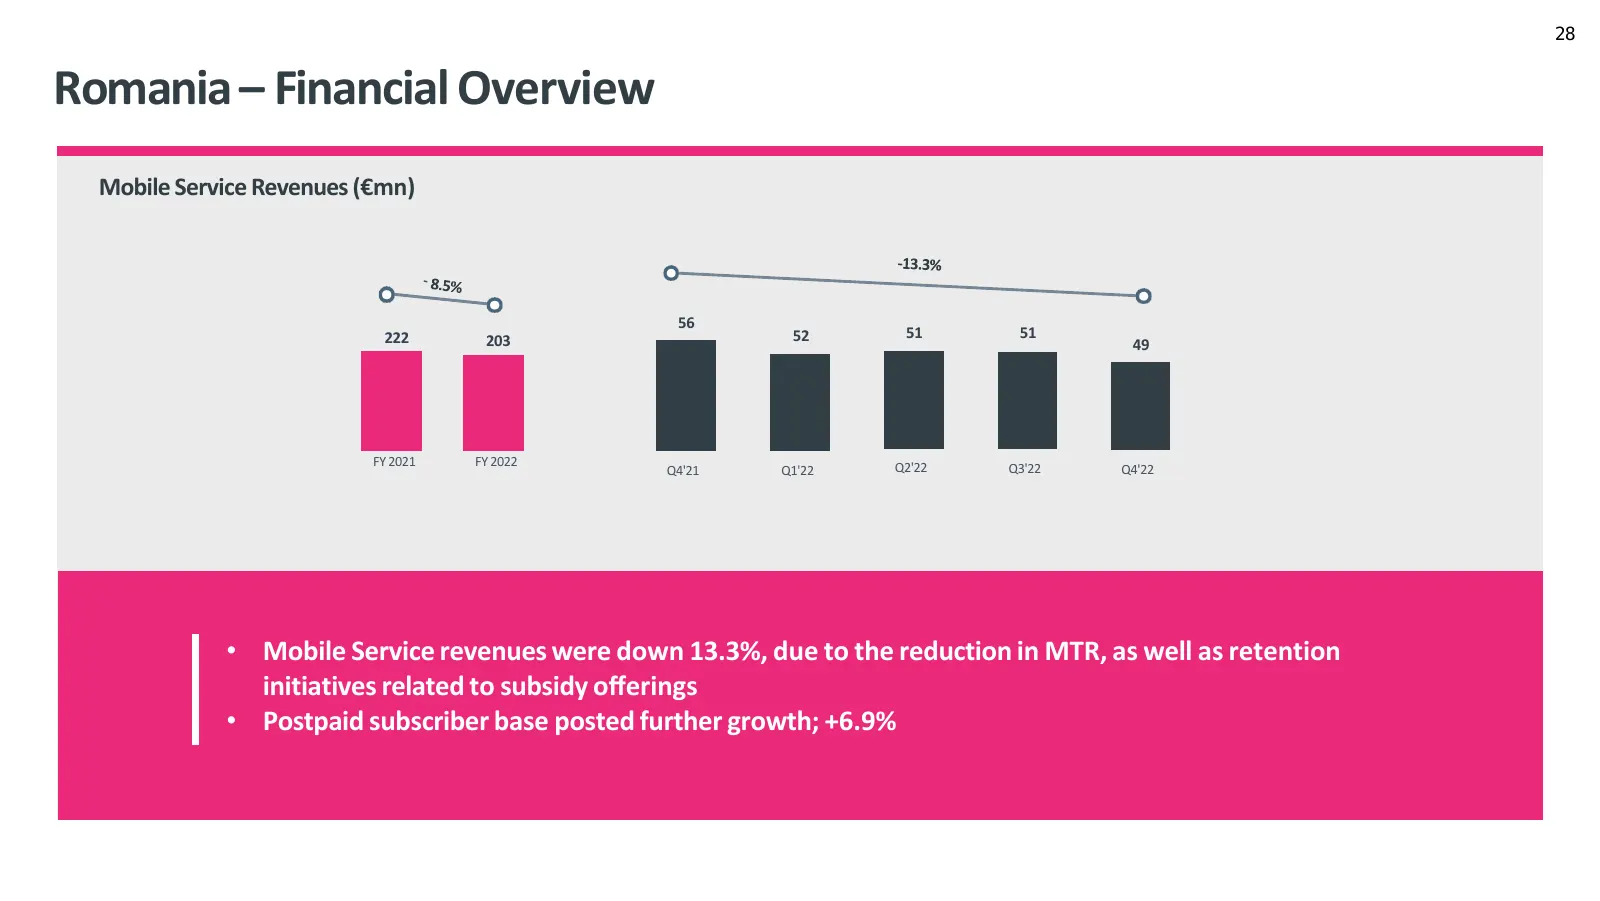
Slide 28: Romania – Financial Overview
28 Romania – Financial Overview Mobile Service Revenues (€mn) 56 222 203 52 51 51 49 FY 2021 FY 2022 Q2'22 Q4'21 Q1'22 Q3'22 Q4'22 • Mobile Service revenues were down 13.3%, due to the reduction in MTR, as well as retention initiatives related to subsidy offerings • Postpaid subscriber base posted fu
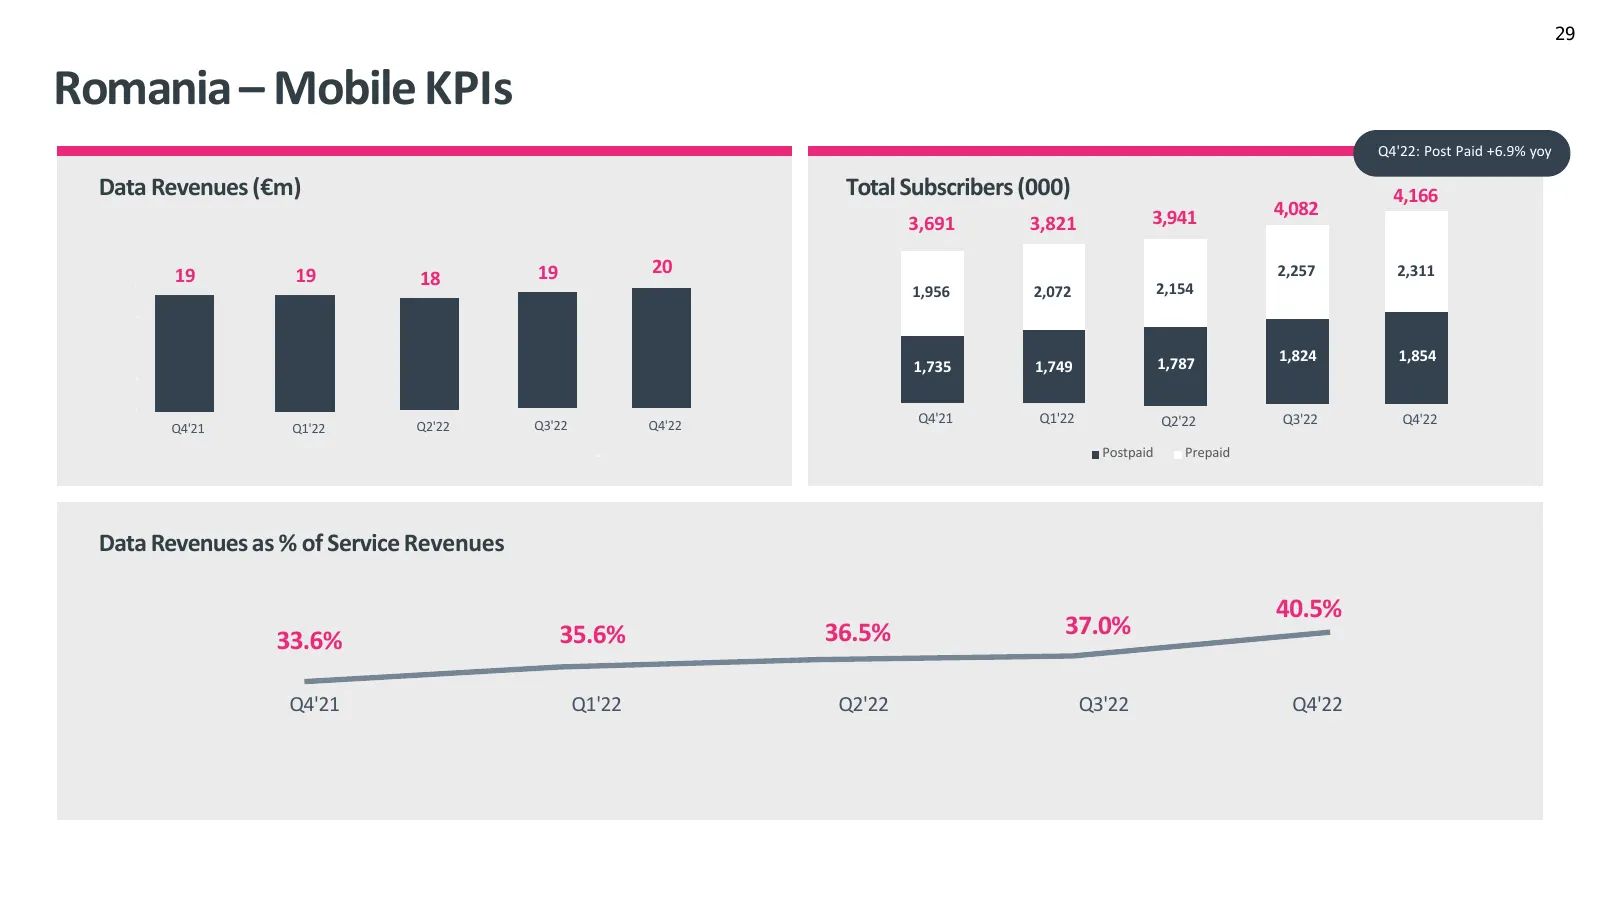
Slide 29: Romania – Mobile KPIs
29 Romania – Mobile KPIs Q4'22: Post Paid +6.9% yoy Data Revenues (€m) Total Subscribers (000) 4,166 3,941 4,082 3,691 3,821 !% 19 19 19 20 2,257 2,311 18 2,154 1,956 2,072 !# "% "# 1,787 1,824 1,854 % 1,735 1,749 # Q3'22 Q4'22 Q4'21 Q1'22 Q2'22 Q3'22 Q4'22 Q4'21 Q1'22 Q2'22 &# Postpaid Prepaid Data
Slide 30: THANK YOU
THANK YOU
Source: company website
More decks from Hellenic Telecommunications Organization SA
 OTE Group — Q2 2026 Earnings Presentation25 slides · July 2026
 OTE Group — Q1 2026 Earnings Presentation25 slides · May 2026
 Q4 2025 Earnings Presentation23 slides · Feb 26, 2026
 Q3 2025 Earnings Presentation23 slides · Nov 14, 2025
 Q2 2025 Earnings Presentation31 slides · Aug 6, 2025
 OTE Group — Q1 2025 Earnings Presentation31 slides · May 2025