Superior Drilling Products Inc
Superior Drilling Products — Q1 2021 Earnings Presentation
16 slides from Superior Drilling Products's earnings presentation, May 12, 2021
Slide 1: First Quarter 2021 Financial Results Conference Call
Wy SUPERIOR DRILLING PRODUCTS FIRST QUARTER 2021 FINANCIAL RESULTS CONFERENCE CALL May 12, 2021 NYSE American: SDPI www.sdpi.com
Slide 2: Safe Harbor Statement
SAFE HARBOR STATEMENT These slides contain forward-looking statements and information that are subject to a number of risks and uncertainties, many of which are beyond our control. All statements, other than statements of historical fact included in these slides and the accompanying oral presentatio
Slide 3: Troy Meier, Chairman and Chief Executive Officer
Wy SUPERIOR DRILLING PRODUCTS TROY MEIER CHAIRMAN AND CHIEF EXECUTIVE OFFICER ©2021 Superior Drilling Products
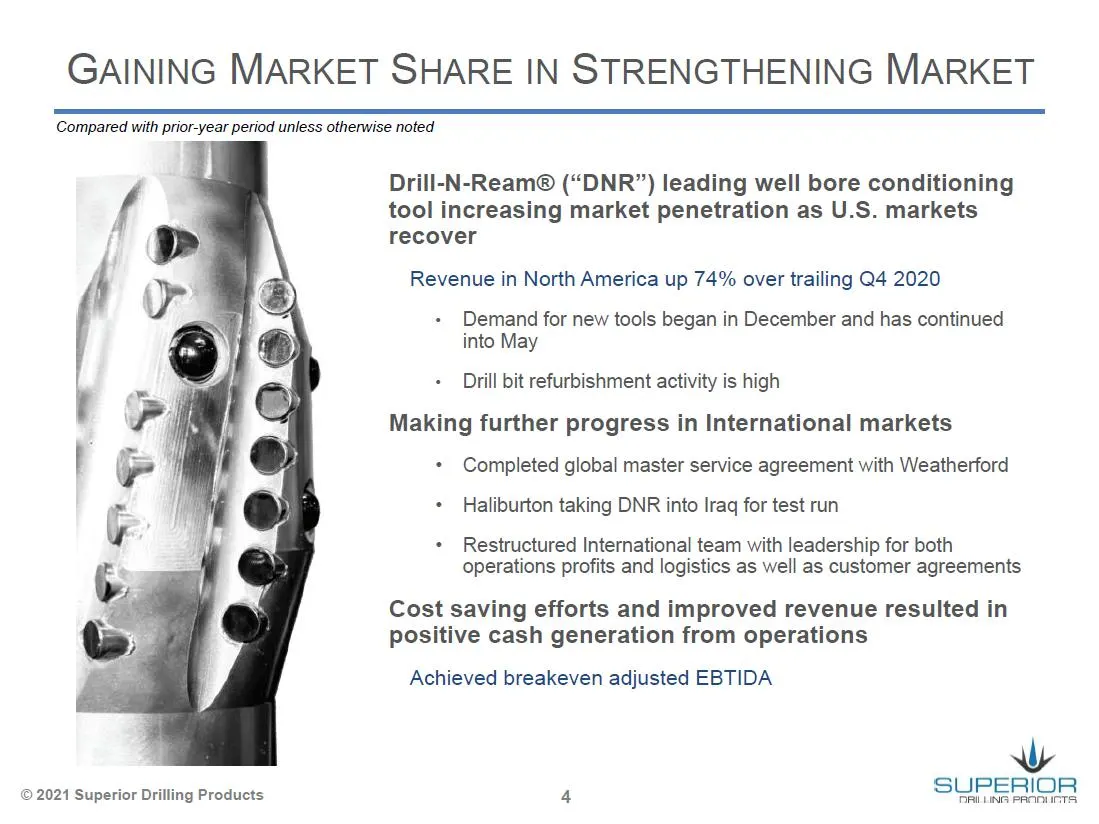
Slide 4: Gaining Market Share in Strengthening Market
GAINING MARKET SHARE IN STRENGTHENING MARKET Compared with prior-year period unless otherwise noted Drill-N-Ream® (“DNR”) leading well bore conditioning tool increasing market penetration as U.S. markets recover Revenue in North America up 74% over trailing Q4 2020 Demand for new tools began in Dece
Slide 5: Christopher Cashion, Chief Financial Officer
Wy SUPERIOR DRILLING PRODUCTS CHRISTOPHER CASHION CHIEF FINANCIAL OFFICER
Slide 6: Revenue
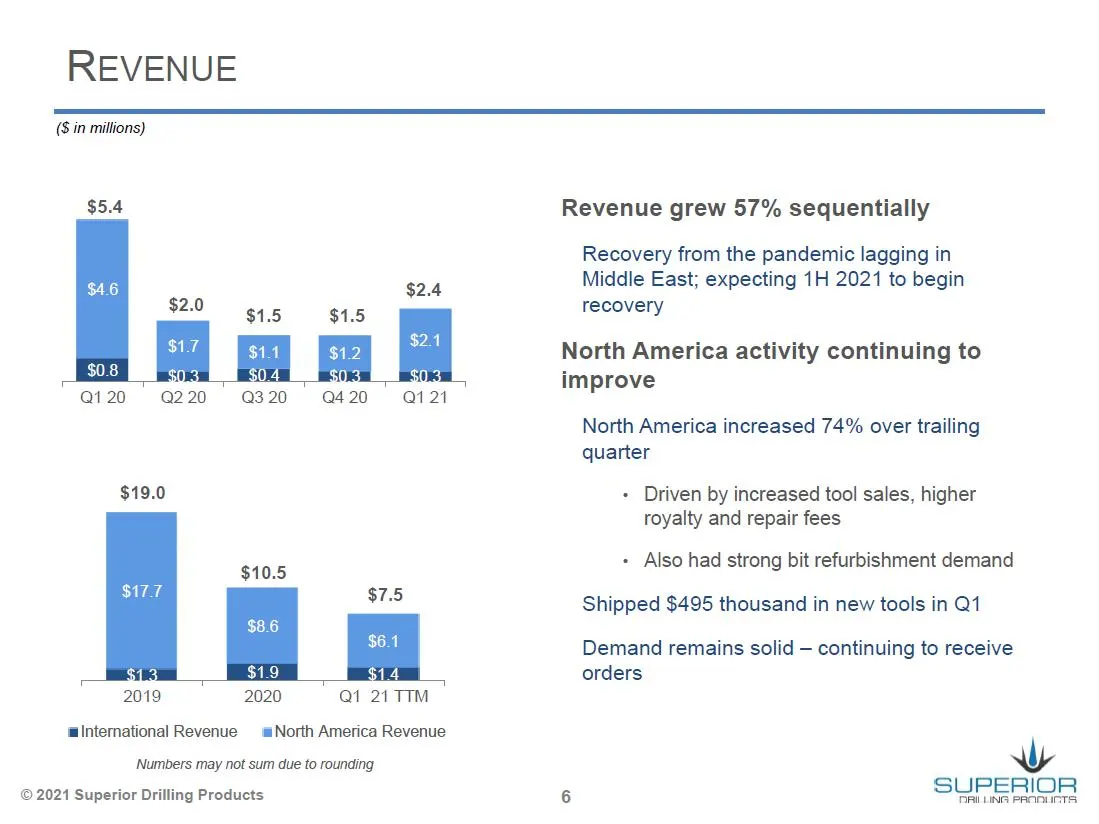
REVENUE (8 in millions) $5.4 Q120 Q220 Q3 20 Q420 Qi2i $19.0 $10.5, S177 $8.6 $13 $1.9 2019 2020 Qi 21TT™ ‘alntemational Revenue North America Revenue Numbers may not sum due to rounding © 2021 Superior Drilling Products Revenue grew 57% sequentially Recovery from the pandemic lagging in Middle East
Slide 7: Tool and Contract Services Revenue
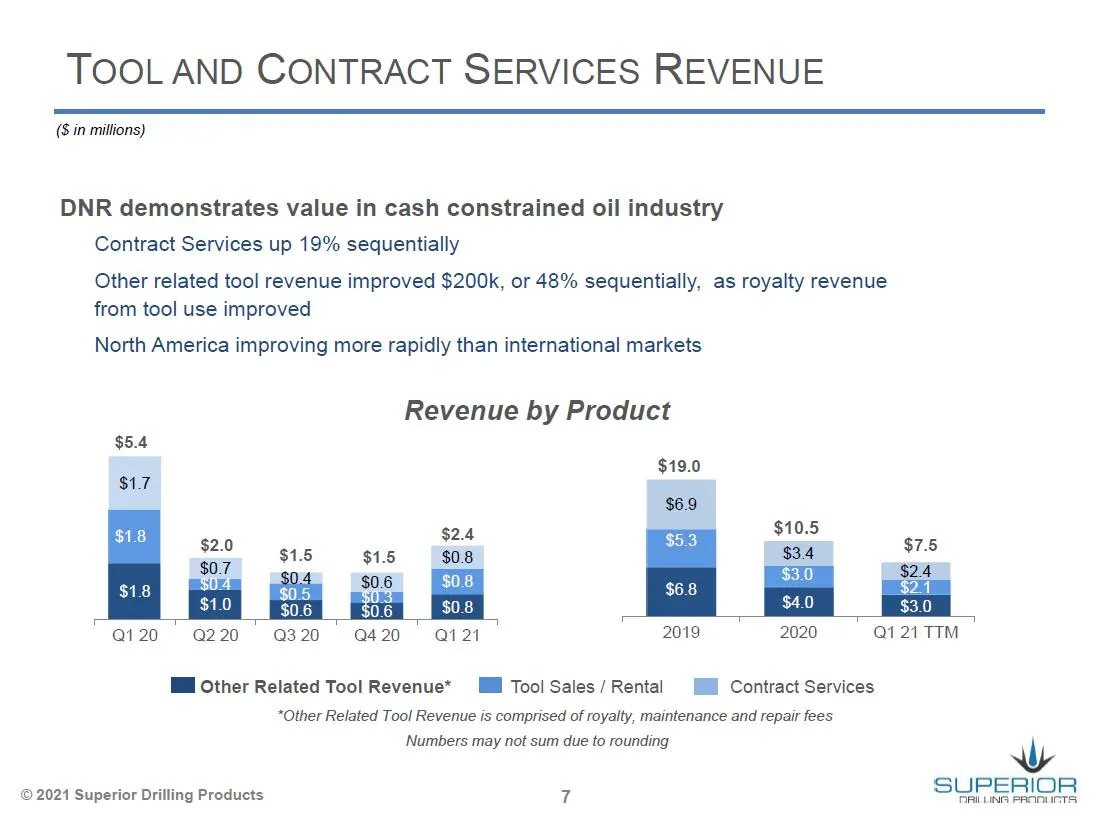
TOOL AND CONTRACT SERVICES REVENUE (8 in millions) DNR demonstrates value in cash constrained oil industry Contract Services up 19% sequentially Other related tool revenue improved $200k, or 48% sequentially, as royalty revenue from tool use improved North America improving more rapidly than interna
Slide 8: Reduced Cost and Operational Structure
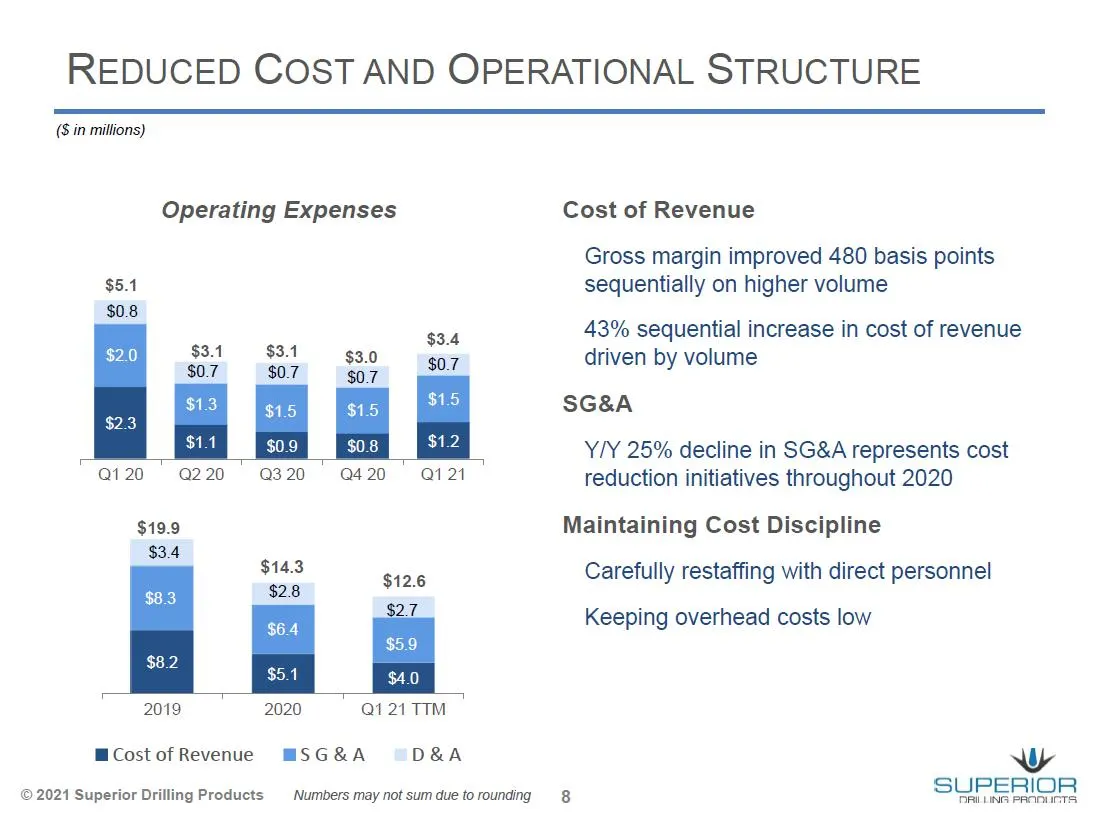
REDUCED COST AND OPERATIONAL STRUCTURE (8 in millions) Operating Expenses Cost of Revenue Gross margin improved 480 basis points sequentially on higher volume 43% sequential increase in cost of revenue driven by volume SG&A YIY 25% decline in SG&A represents cost Q120, 220 0320 4200 Q121 reduction i
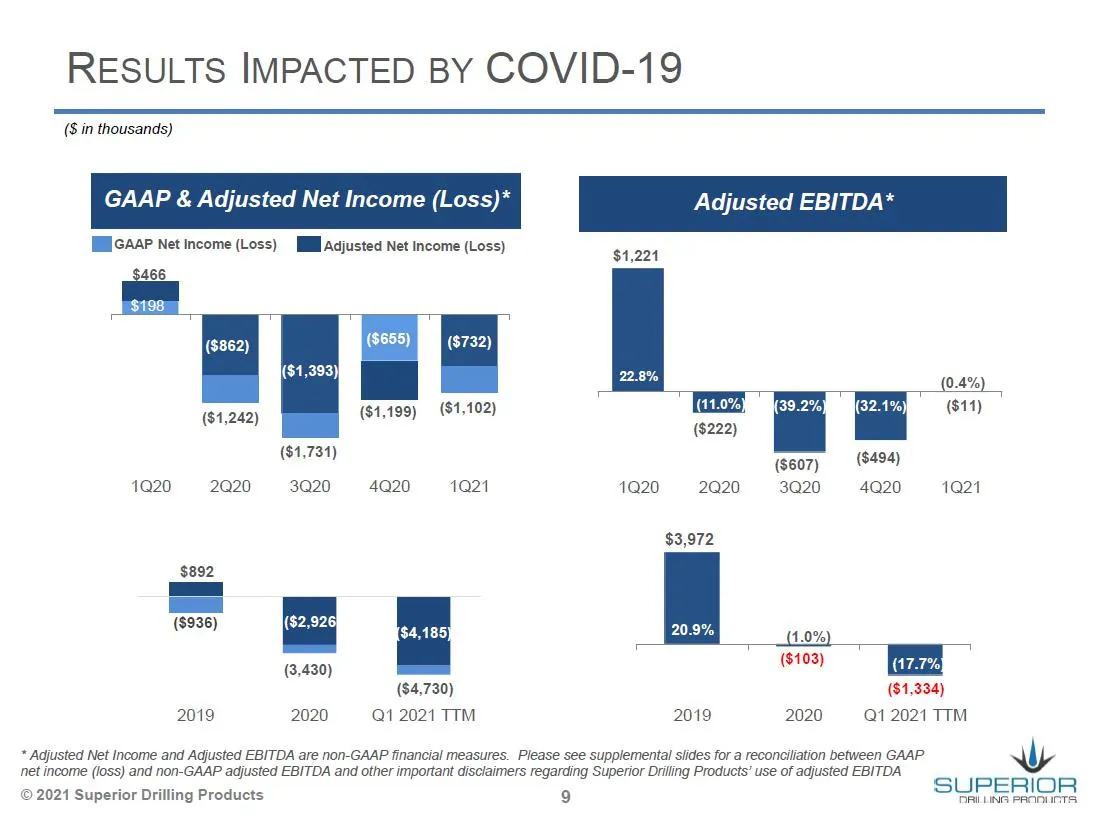
Slide 9: Results Impacted by COVID-19
RESULTS IMPACTED BY COVID-19 (8 in thousands) GAAP & Adjusted Net Income (Loss)* Adjusted EBITDA* Mlicaop Net income (Loss) [ll Adjusted Net Income (Loss) $1,224 ($655) ($732) a28% (0.4%) ($1,242) ($1,199) ($1,102) 39.2%) ($11) (222) $1,731 f ) (seo7) ($494) 1920 2020 3020 «4020 = 1021 1920 2020 302
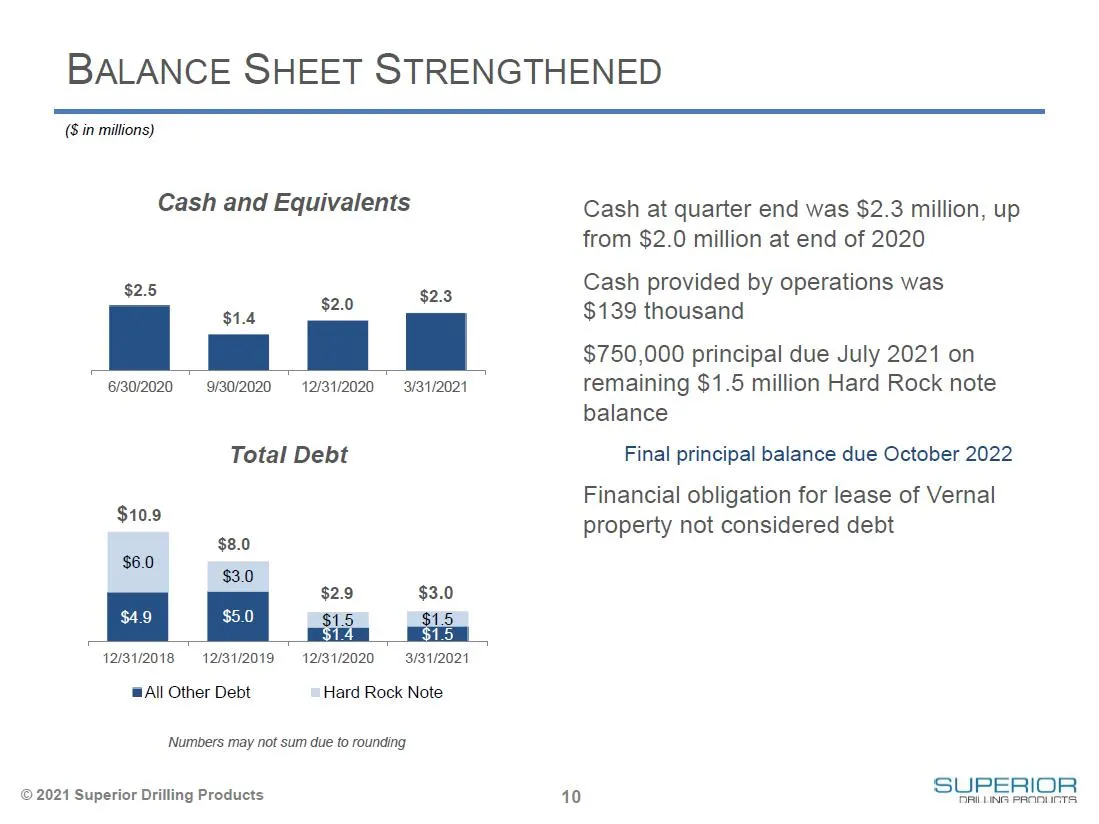
Slide 10: Balance Sheet Strengthened
BALANCE SHEET STRENGTHENED ($ in millions) Cash and Equivalents ints $2.0 $2.3 $1.4 6/30/2020 © 9/30/2020 12/31/2020 3/31/2021 Total Debt $10.9 $8.0 $6.0 wa $2.9 $3.0 $49 $5.0 $15 $15 14 $15 12/31/2018 12/31/2019 12/31/2020 3/31/2021 BAIl Other Debt Hard Rock Note Numbers may not sum due to rounding
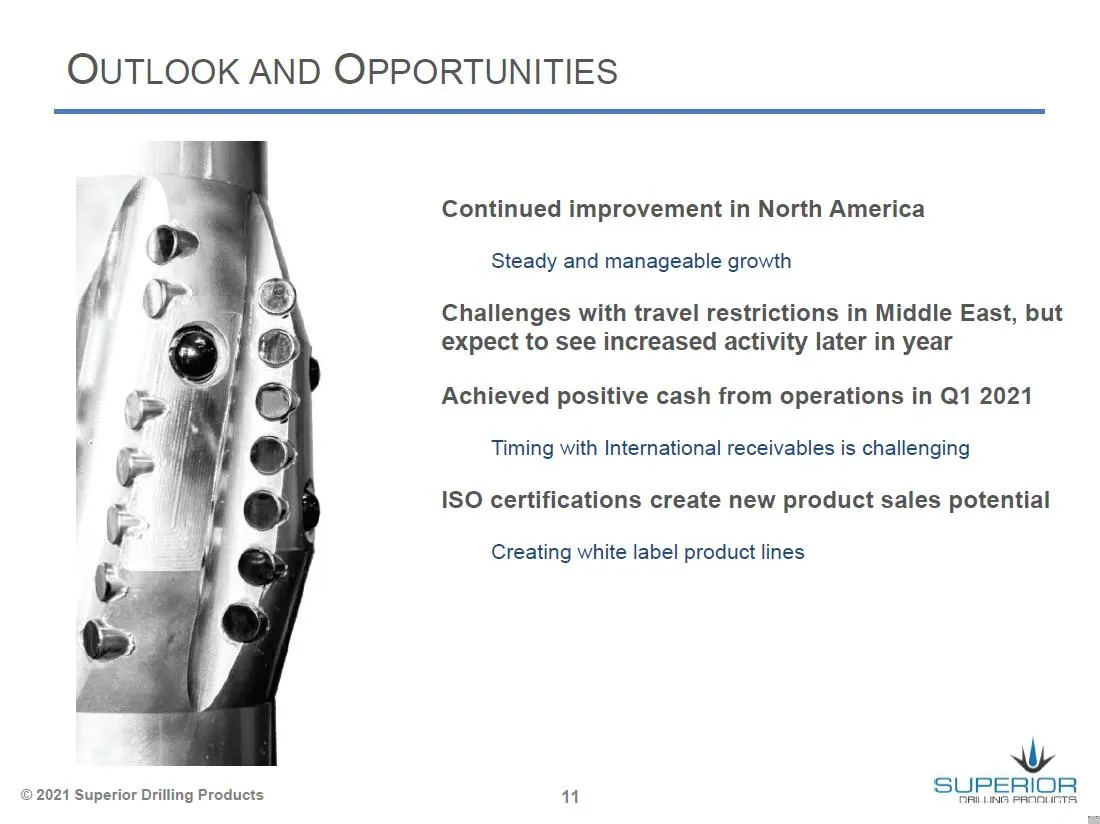
Slide 11: Outlook and Opportunities
OUTLOOK AND OPPORTUNITIES Continued improvement in North America Steady and manageable growth Challenges with travel restrictions in Middle East, but expect to see increased activity later in year Achieved positive cash from operations in Q1 2021 Timing with International receivables is challenging
Slide 12: Supplemental Information
Wy SUPERIOR DRILLING PRODUCTS SUPPLEMENTAL INFORMATION
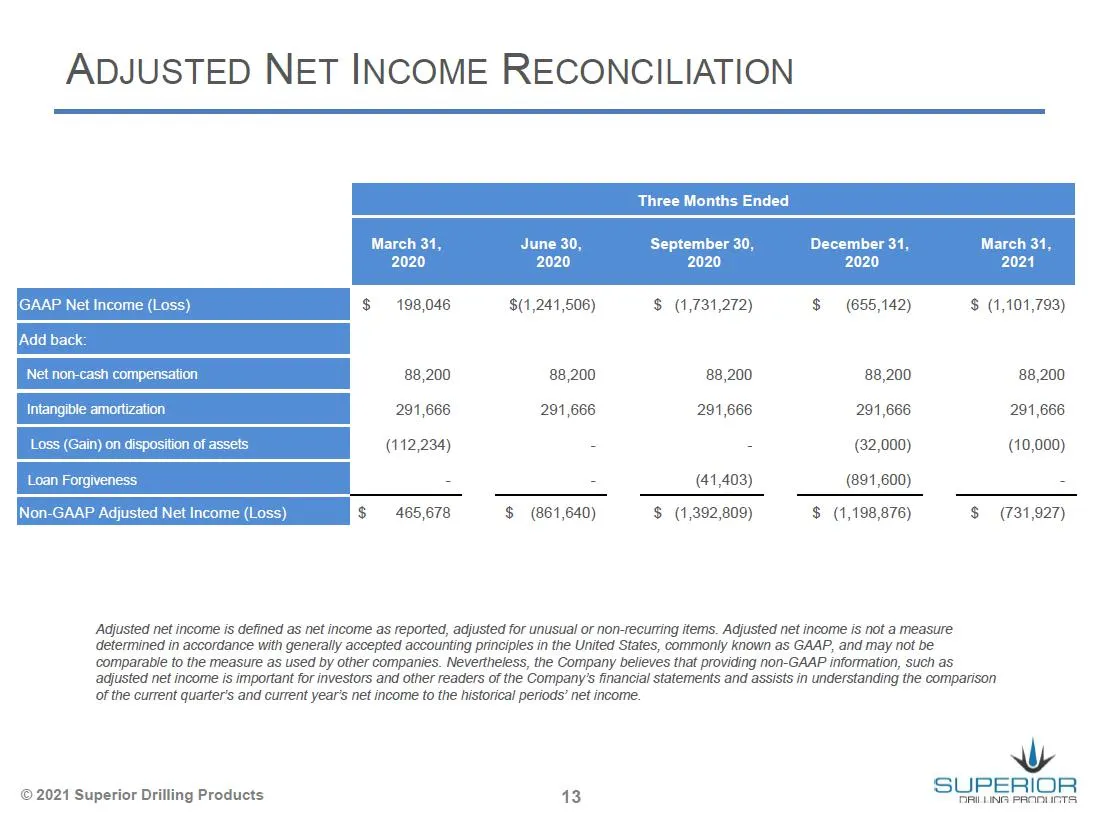
Slide 13: Adjusted Net Income Reconciliation
ADJUSTED NET INCOME RECONCILIATION Three Months Ended September 30, 2020 December 31, 2020 a : Non-GAAP Adjusted Net Income (Loss) $ 198,046 $(1,241,506) $ (1,731,272) $ (655,142) $ (1,101,793) 88,200 88,200 88,200 88,200 88,200 291,666 291,666 291,666 291,666 291,666 (112,234) = = (32,000) (10,000)
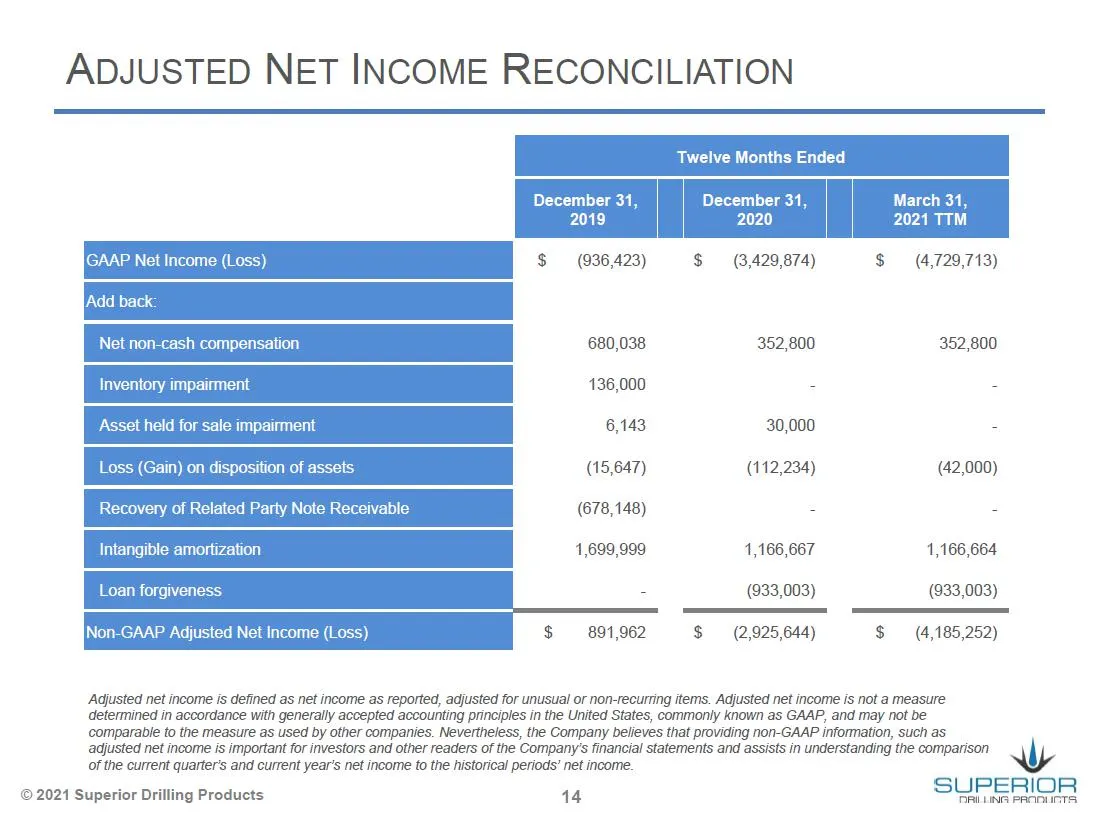
Slide 14: Adjusted Net Income Reconciliation
ADJUSTED NET INCOME RECONCILIATION 2021 TTM $ (936,423) $ (3,429,874) $ (4,729,713) Recovery of Related Party Note Receivable (678,148) # 2 Loan forgiveness - (933,003) (933,003) Non-GAAP Adjusted Net Income (Loss) $ 891,962 $ (2,925,644) $ (4,185,252) Adjusted net income is defined as net income as
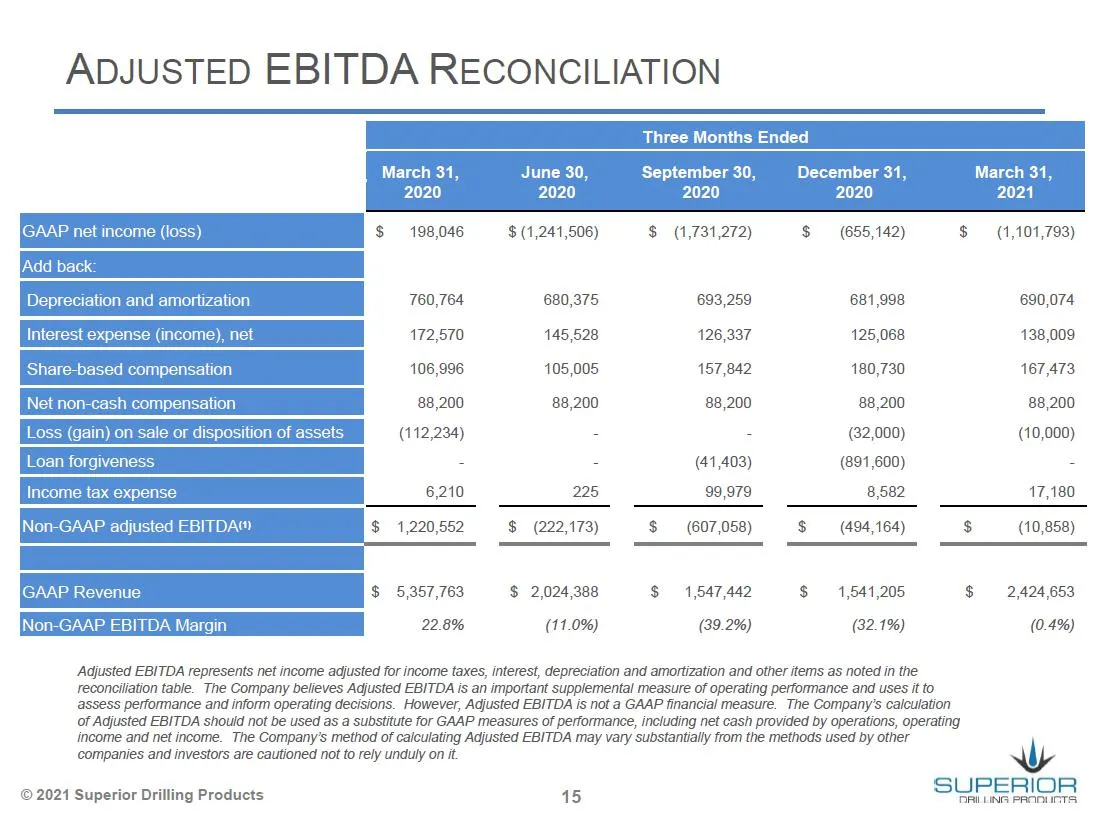
Slide 15: Adjusted EBITDA Reconciliation
ADJUSTED EBITDA RECONCILIATION March 31, June 30, September 30, December 31, March 31, 2020 2020 2020 $ 198,046 $ (1,241,506) $ (1,731,272) $ (655,142) $ (1,101,793) 760,764 680,375 693,259 681,998 690,074 172,570 145,528 126,337 125,068 138,009 106,996 105,005 157,842 180,730 167,473 Net non-cash c
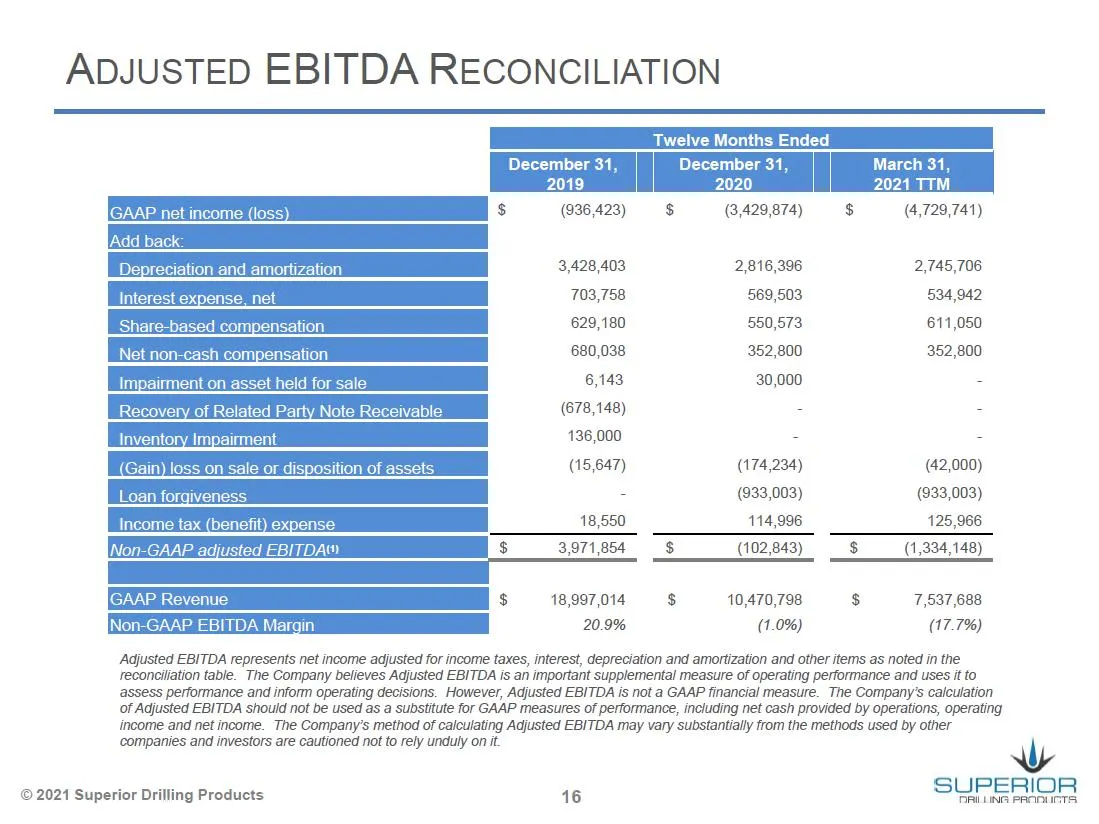
Slide 16: Adjusted EBITDA Reconciliation
ADJUSTED EBITDA RECONCILIATION 2019 2020 2021 TTM $ (936,423) $$ (3,429,874) $ (4,729,741) 3,428,403 2,816,396 2,745,706 703,758 569,503 534,042 629,180 360,573 611,050 Net non-cash compensation 680,038 352,800 352,800 Impairment on asset held for sale 6,143 30,000 - (678,148) - - Inventory Imy 136,
Source: SEC EDGAR · 8-K filed May 12, 2021
More decks from Superior Drilling Products Inc
 Q3 2023 Earnings Presentation12 slides · Nov 9, 2023
 Q2 2023 Earnings Presentation12 slides · Aug 14, 2023
 Q1 2023 Earnings Presentation12 slides · May 15, 2023
 FY2022 Earnings Presentation13 slides · Mar 10, 2023
 Q3 2022 Earnings Presentation12 slides · Nov 14, 2022
 MicroCap Rodeo Windy City Roundup 202220 slides · Oct 12, 2022