SoftTech Engineers Ltd. · NSE:SOFTTECH
SoftTech Engineers — Q3 FY2025-26 Earnings Presentation
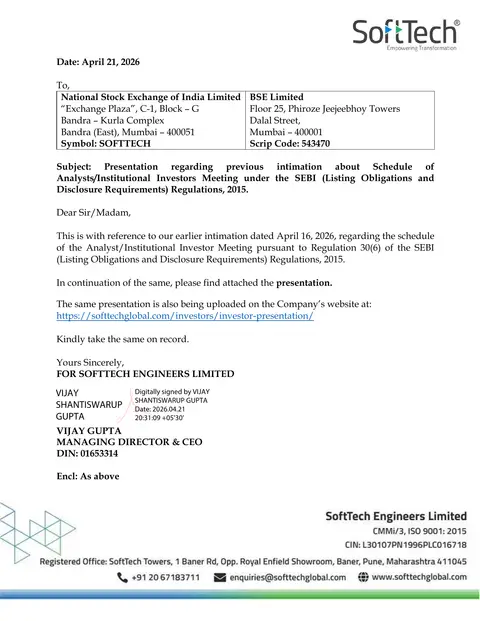
21 slides from SoftTech Engineers's earnings presentation, Apr 21, 2026

Slide 1: SoftTech Engineers Limited Q3 / 9M 2025-26 Investor Presentation
SoftTech Engineers Limited Q3 / 9M – 2025-26 Investor Presentation www.softtechglobal.com
Slide 2: Disclaimer
Disclaimer This presentation and the accompanying slides (the “Presentation”), have been prepared by SoftTech Engineers Limited (the “Company”) solely for information purposes and do not constitute any offer, recommendation, or invitation to purchase or subscribe to any securities and shall not form
Slide 3: Contents of Presentation
Contant of Presentation 1 Operational Review 2 Financial Results – Standalone & Consolidated 3 Strategic Review for Future Growth All Values are Rs. In Crore / 3

Slide 4: Operational Review
Operational Review
Slide 5: Operational Success
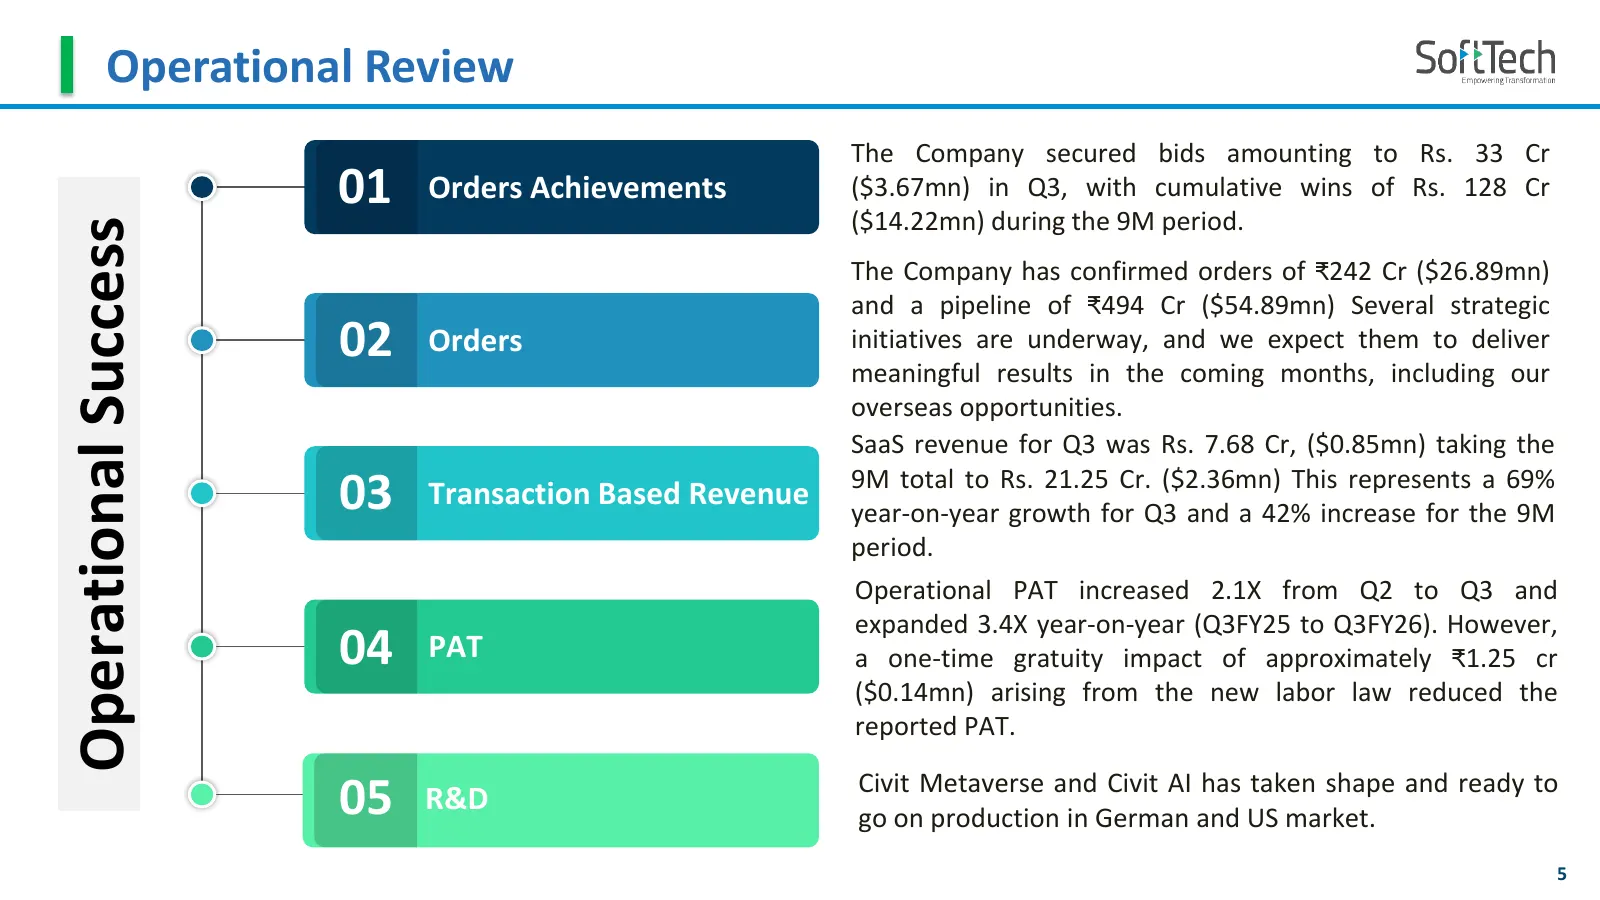
Operational Review The Company secured bids amounting to Rs. 33 Cr 01 Orders Achievements ($3.67mn) in Q3, with cumulative wins of Rs. 128 Cr ($14.22mn) during the 9M period. Operational Success The Company has confirmed orders of ₹242 Cr ($26.89mn) and a pipeline of ₹494 Cr ($54.89mn) Several strat
Slide 6: Standalone Financial
Standalone Financial
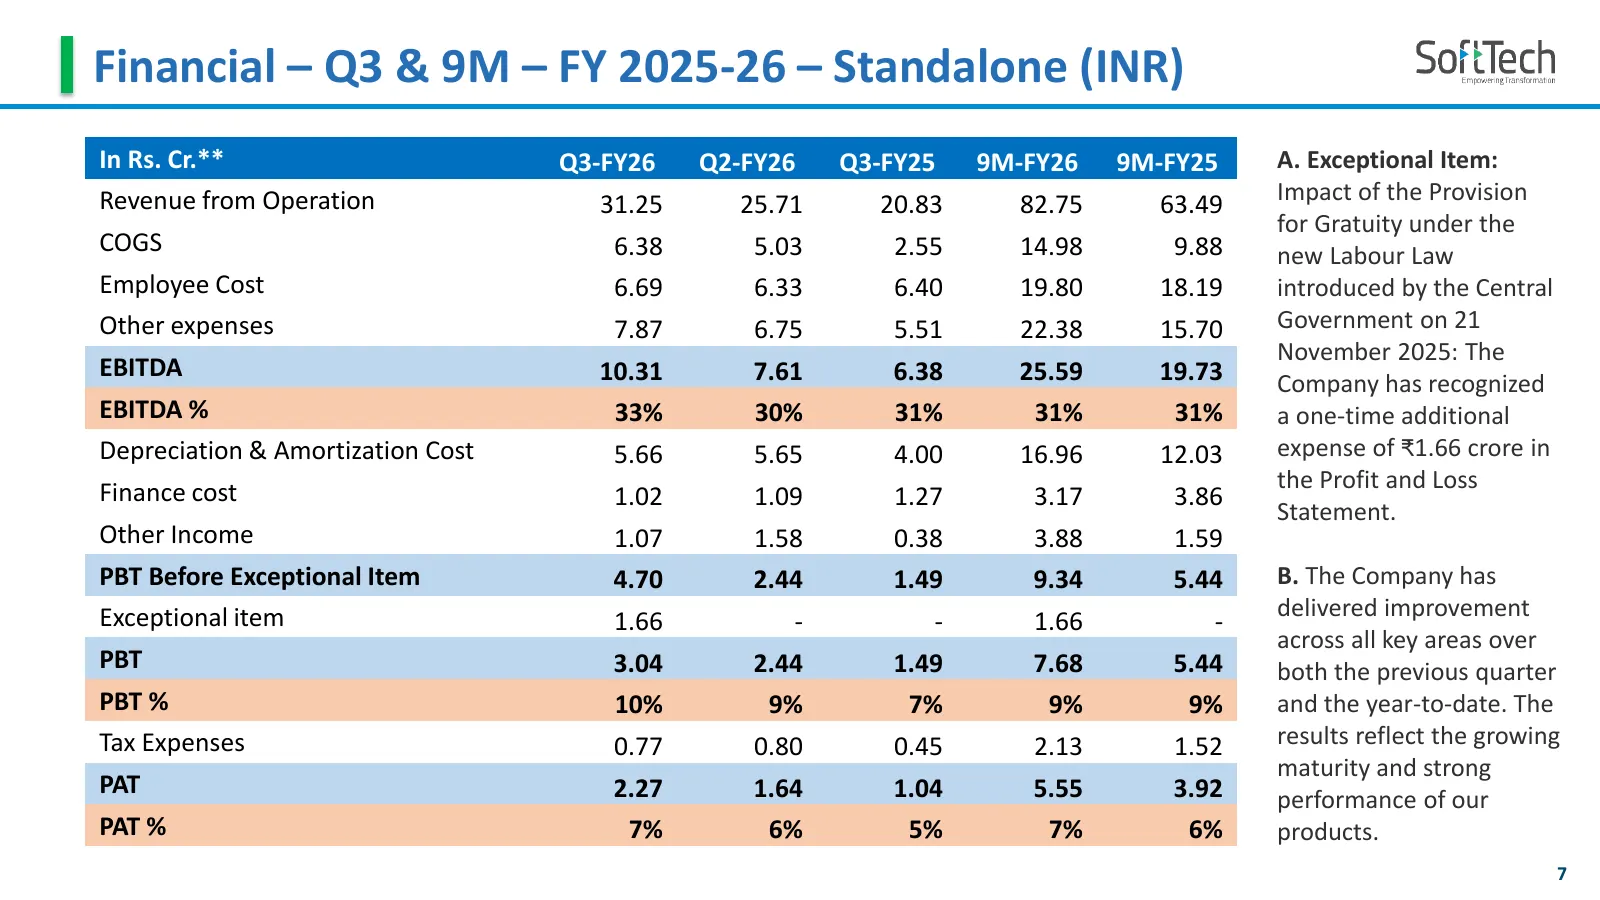
Slide 7: Financial – Q3 & 9M – FY 2025-26 – Standalone (INR)
Financial – Q3 & 9M – FY 2025-26 – Standalone (INR) In Rs. Cr.** Q3-FY26 Q2-FY26 Q3-FY25 9M-FY26 9M-FY25 A. Exceptional Item: Revenue from Operation 31.25 25.71 20.83 82.75 63.49 Impact of the Provision for Gratuity under the COGS 6.38 5.03 2.55 14.98 9.88 new Labour Law Employee Cost 6.69 6.33 6.40
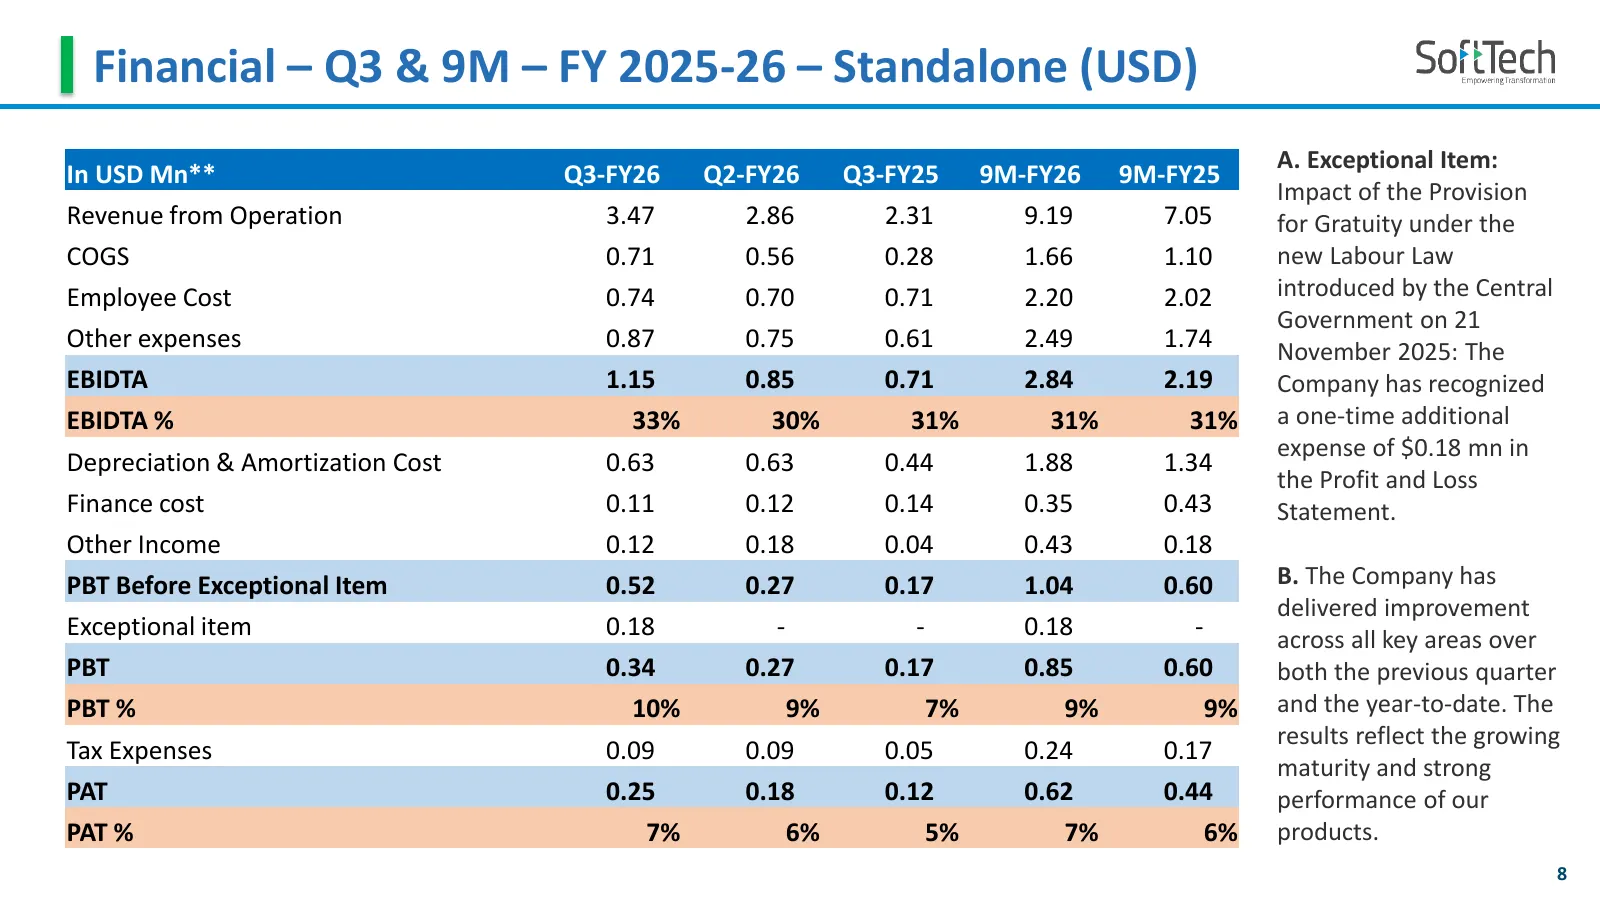
Slide 8: Financial – Q3 & 9M – FY 2025-26 – Standalone (USD)
Financial – Q3 & 9M – FY 2025-26 – Standalone (USD) A. Exceptional Item: In USD Mn** Q3-FY26 Q2-FY26 Q3-FY25 9M-FY26 9M-FY25 Impact of the Provision Revenue from Operation 3.47 2.86 2.31 9.19 7.05 for Gratuity under the COGS 0.71 0.56 0.28 1.66 1.10 new Labour Law Employee Cost 0.74 0.70 0.71 2.20 2
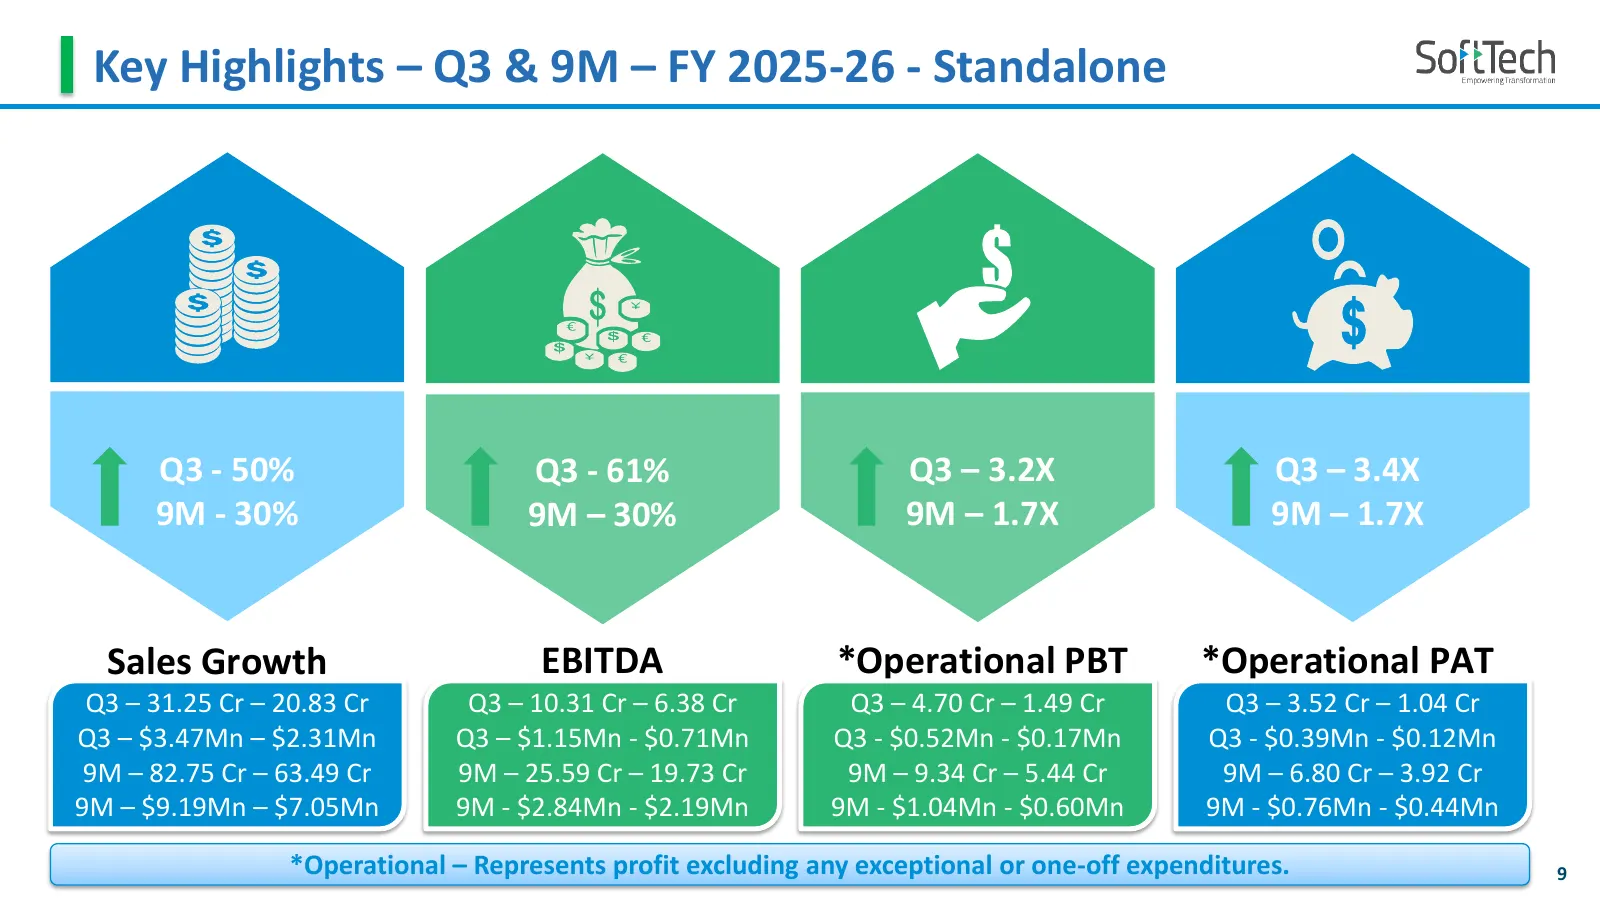
Slide 9: Key Highlights – Q3 & 9M – FY 2025-26 - Standalone
Key Highlights – Q3 & 9M – FY 2025-26 - Standalone Q3 - 50% Q3 - 61% Q3 – 3.2X Q3 – 3.4X 9M - 30% 9M – 30% 9M – 1.7X 9M – 1.7X Sales Growth EBITDA *Operational PBT *Operational PAT Q3 – 31.25 Cr – 20.83 Cr Q3 – 10.31 Cr – 6.38 Cr Q3 – 4.70 Cr – 1.49 Cr Q3 – 3.52 Cr – 1.04 Cr Q3 – $3.47Mn – $2.31Mn Q
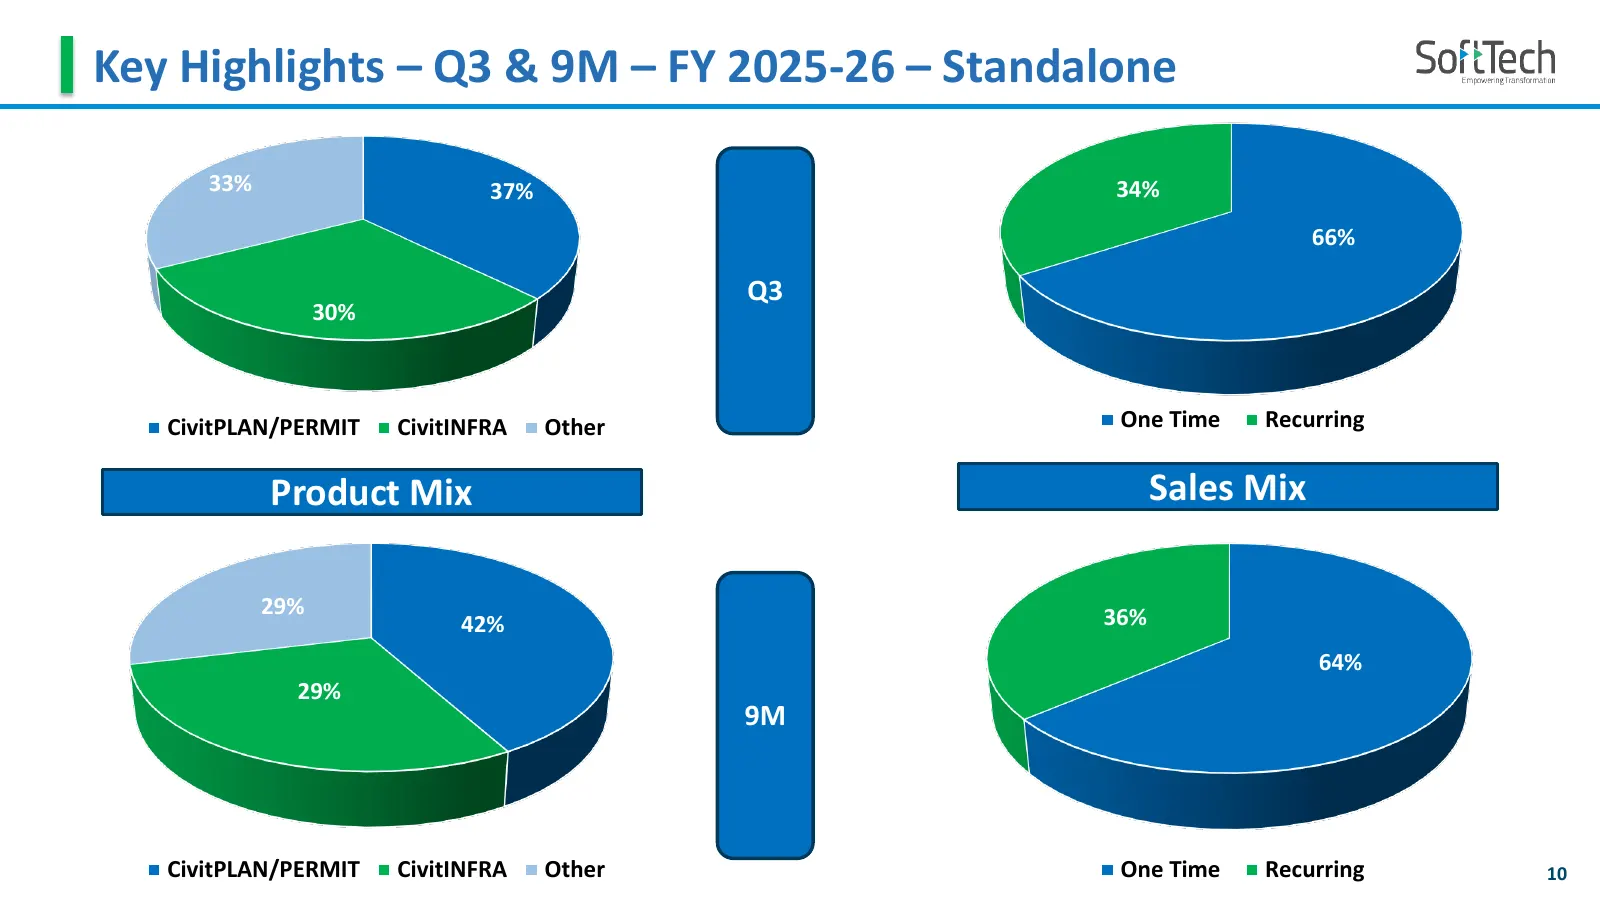
Slide 10: Key Highlights – Q3 & 9M – FY 2025-26 – Standalone
Key Highlights – Q3 & 9M – FY 2025-26 – Standalone 33% 37% 34% 66% Q3 30% CivitPLAN/PERMIT CivitINFRA Other One Time Recurring Product Mix Sales Mix 29% 36% 42% 64% 29% 9M CivitPLAN/PERMIT CivitINFRA Other One Time Recurring 10

Slide 11: Consolidated Financial
2 i ts ad solidated Financial
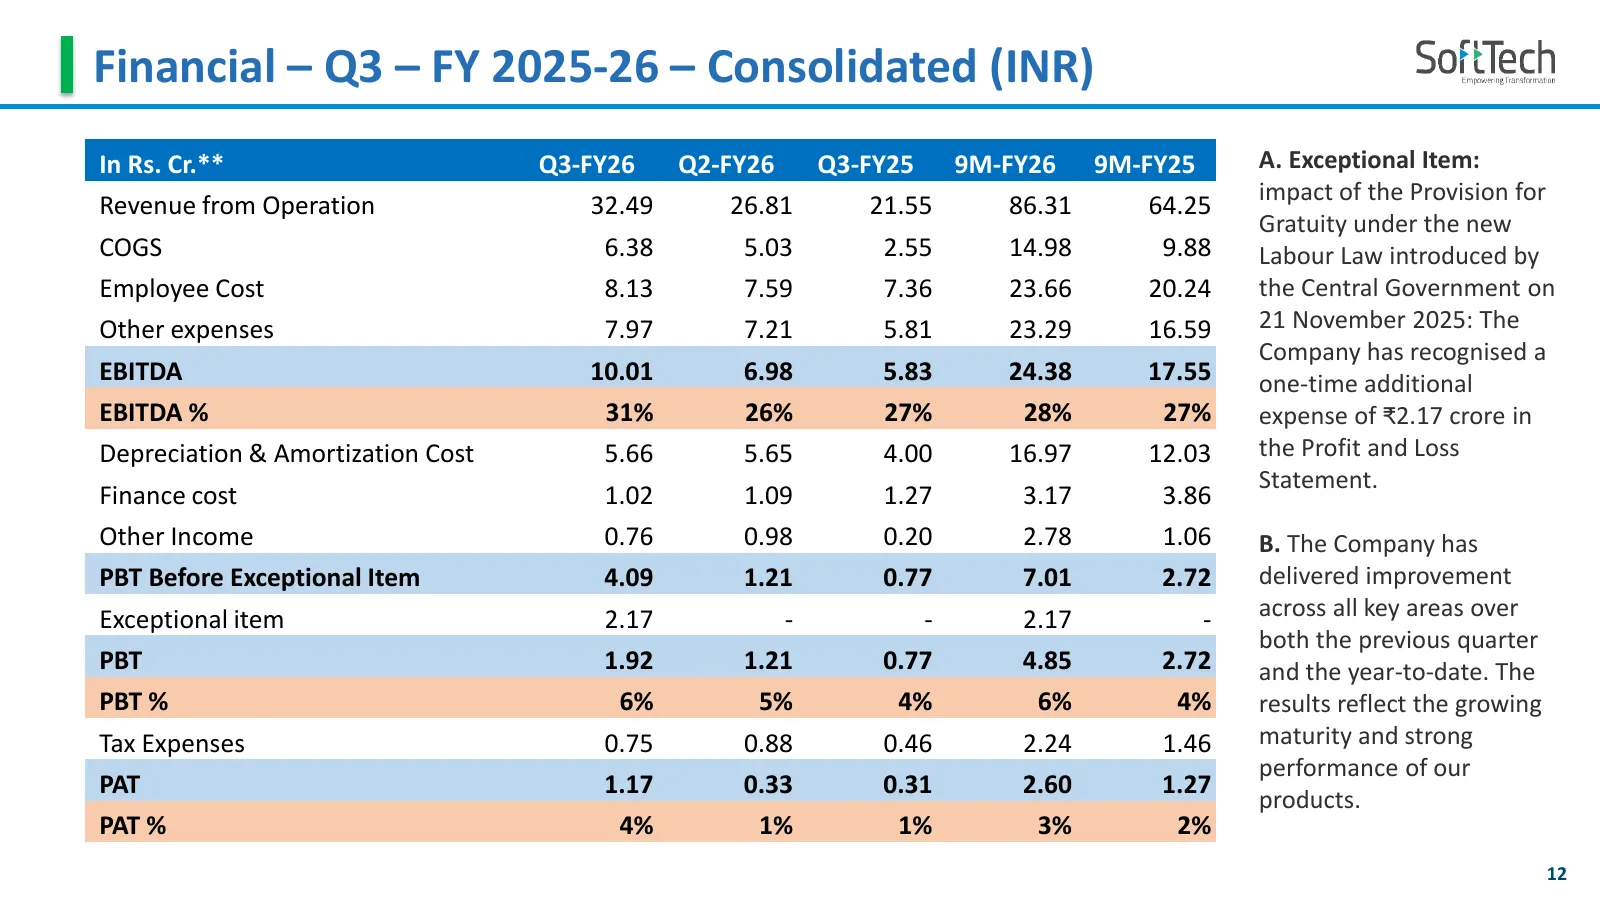
Slide 12: Financial – Q3 – FY 2025-26 – Consolidated (INR)
Financial – Q3 – FY 2025-26 – Consolidated (INR) In Rs. Cr.** Q3-FY26 Q2-FY26 Q3-FY25 9M-FY26 9M-FY25 A. Exceptional Item: impact of the Provision for Revenue from Operation 32.49 26.81 21.55 86.31 64.25 Gratuity under the new COGS 6.38 5.03 2.55 14.98 9.88 Labour Law introduced by Employee Cost 8.1
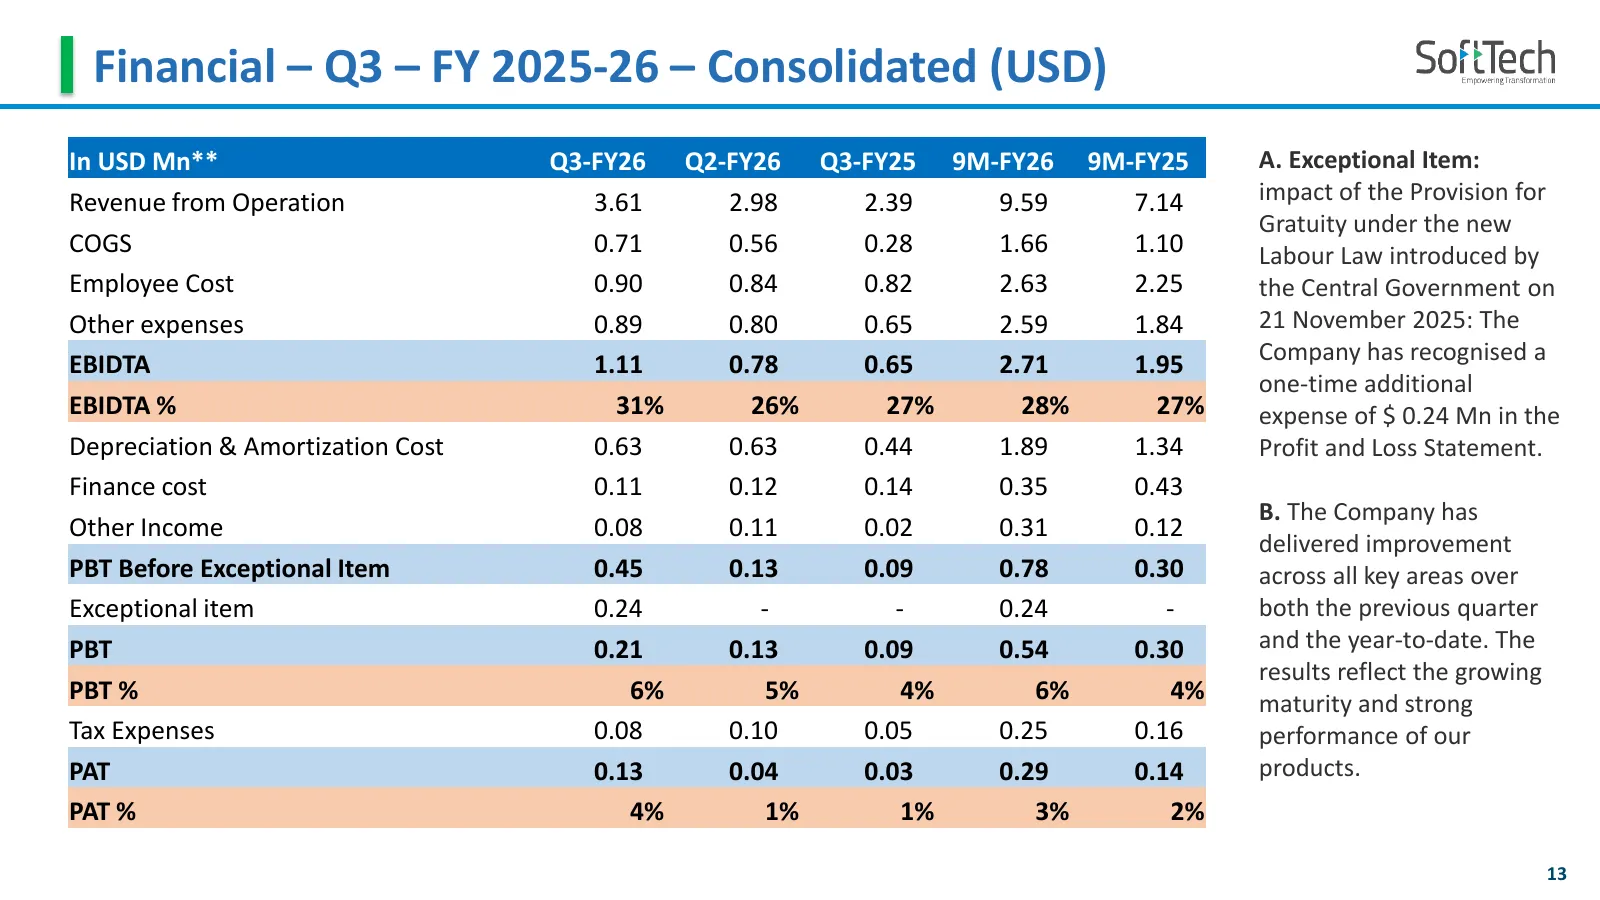
Slide 13: Financial – Q3 – FY 2025-26 – Consolidated (USD)
Financial – Q3 – FY 2025-26 – Consolidated (USD) In USD Mn** Q3-FY26 Q2-FY26 Q3-FY25 9M-FY26 9M-FY25 A. Exceptional Item: Revenue from Operation 3.61 2.98 2.39 9.59 7.14 impact of the Provision for Gratuity under the new COGS 0.71 0.56 0.28 1.66 1.10 Labour Law introduced by Employee Cost 0.90 0.84
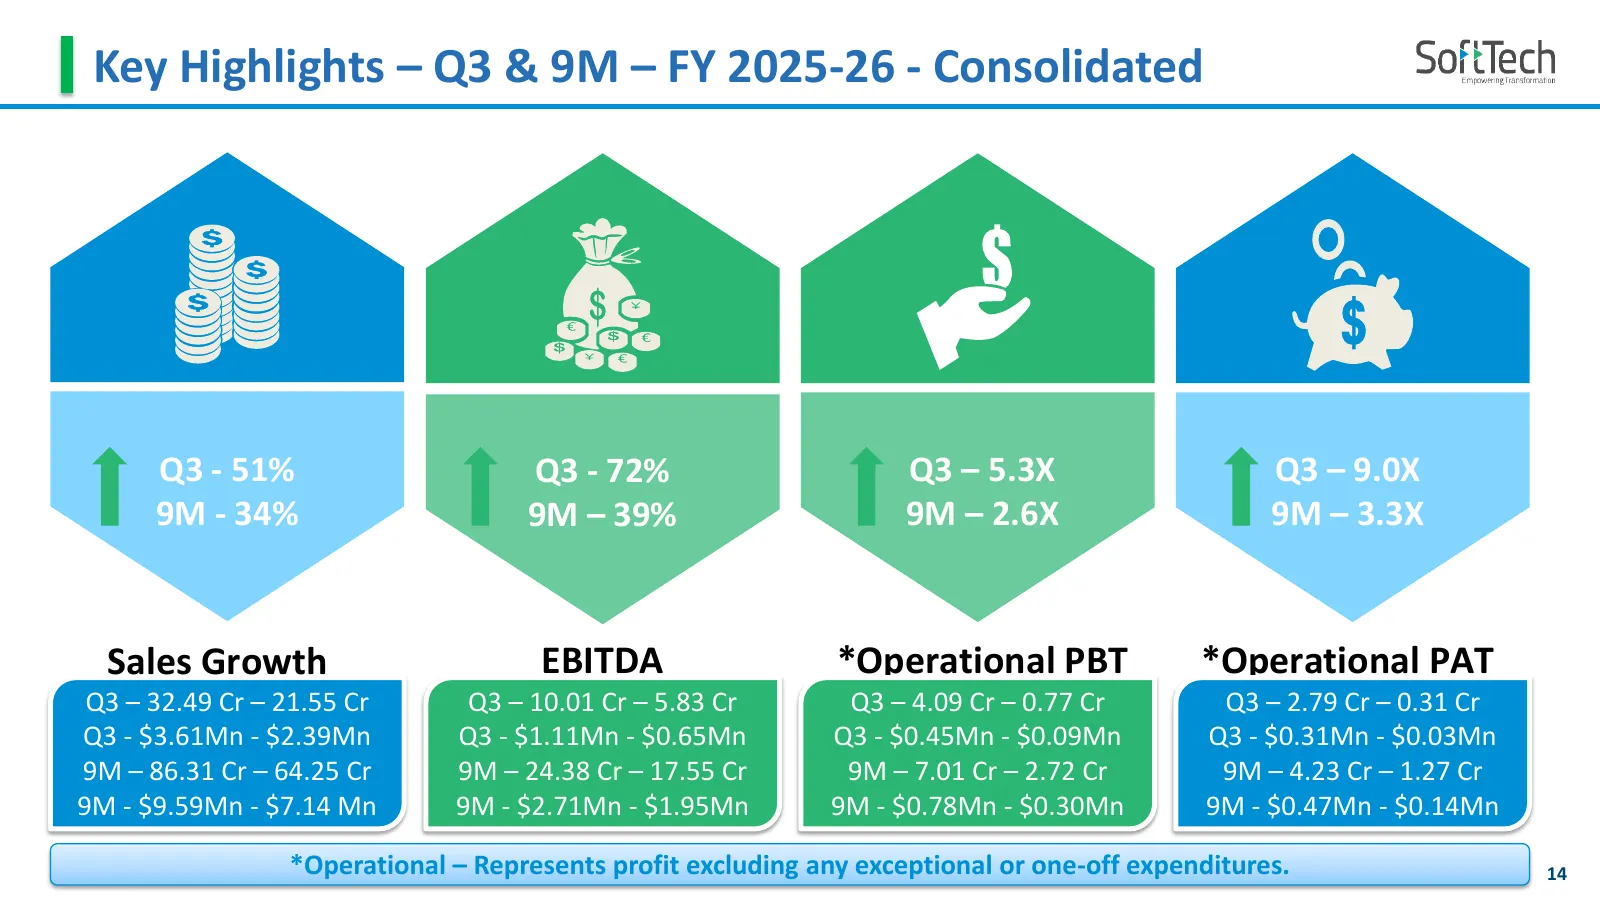
Slide 14: Key Highlights – Q3 & 9M – FY 2025-26 - Consolidated
Key Highlights – Q3 & 9M – FY 2025-26 - Consolidated Q3 - 51% Q3 - 72% Q3 – 5.3X Q3 – 9.0X 9M - 34% 9M – 39% 9M – 2.6X 9M – 3.3X Sales Growth EBITDA *Operational PBT *Operational PAT Q3 – 32.49 Cr – 21.55 Cr Q3 – 10.01 Cr – 5.83 Cr Q3 – 4.09 Cr – 0.77 Cr Q3 – 2.79 Cr – 0.31 Cr Q3 - $3.61Mn - $2.39Mn

Slide 15: Strategic Review for Future Growth
Operational Review Strategic Review for Future Growth
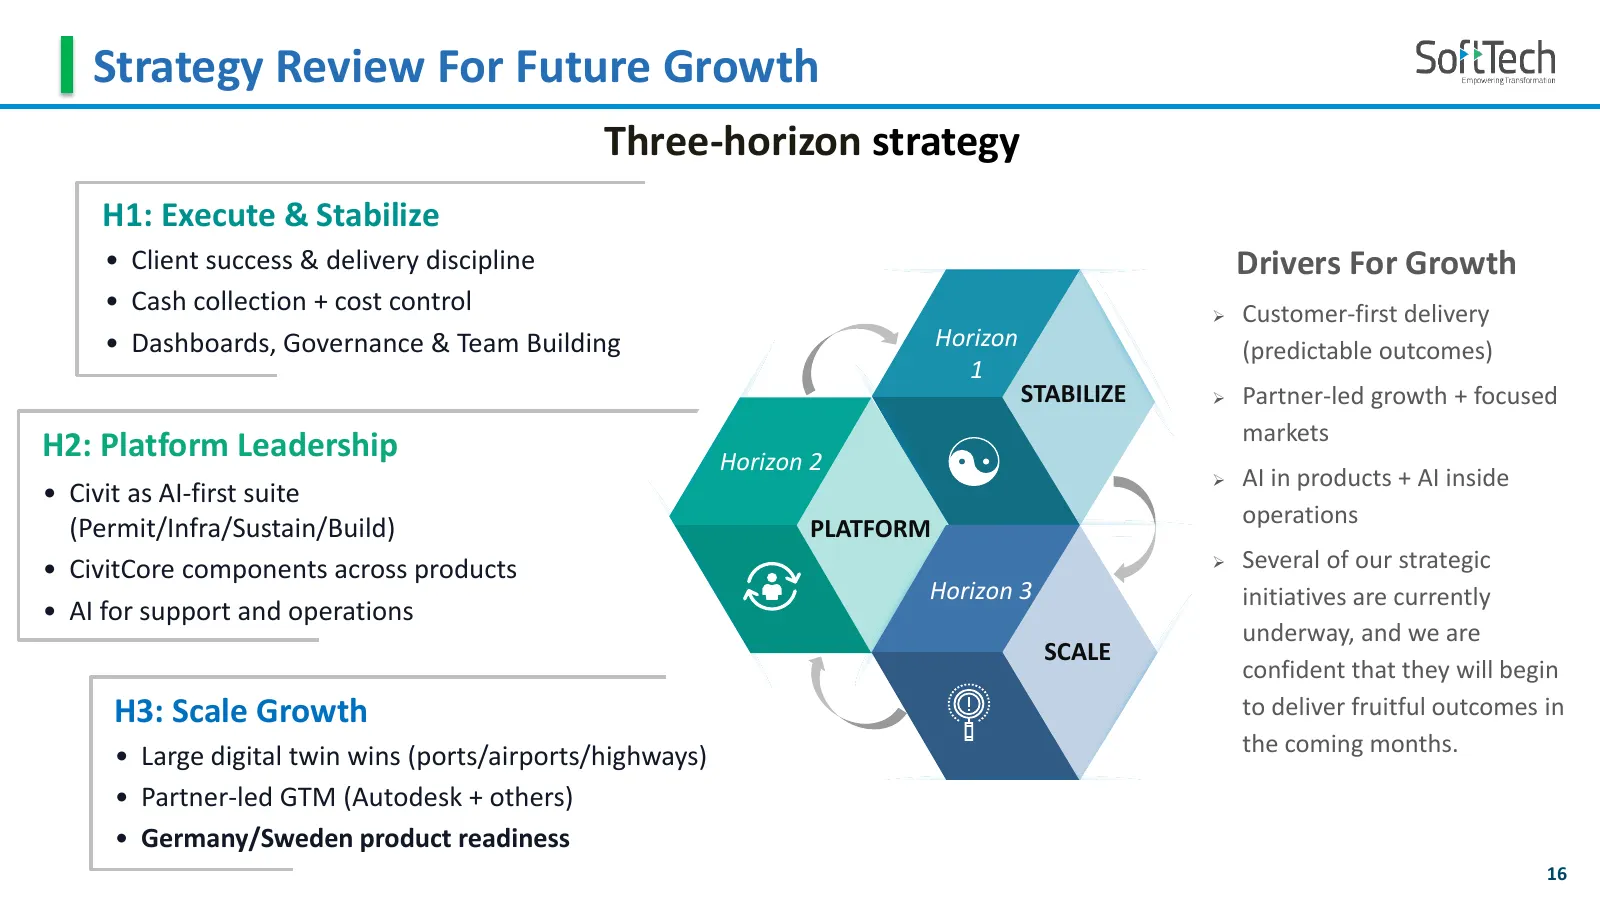
Slide 16: Strategy Review For Future Growth
Strategy Review For Future Growth Three-horizon strategy H1: Execute & Stabilize • Client success & delivery discipline Drivers For Growth • Cash collection + cost control ➢ Customer-first delivery • Dashboards, Governance & Team Building Horizon (predictable outcomes) 1 STABILIZE ➢ Partner-led grow
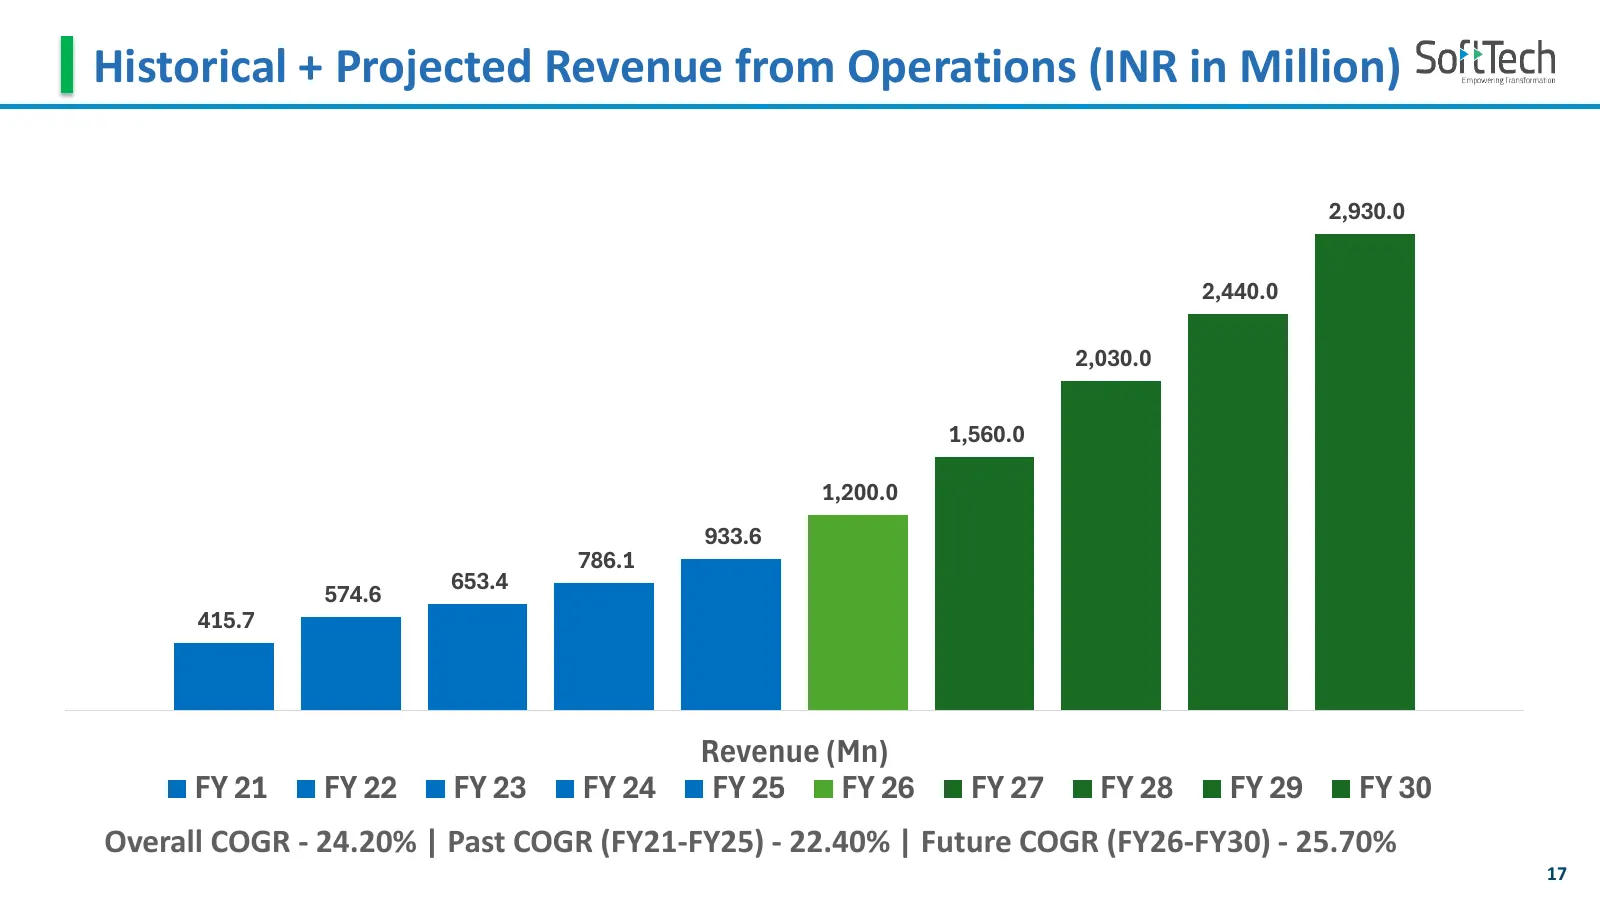
Slide 17: Historical + Projected Revenue from Operations (INR in Million)
Historical + Projected Revenue from Operations (INR in Million) 2,930.0 2,440.0 2,030.0 1,560.0 1,200.0 933.6 786.1 653.4 574.6 415.7 Revenue (Mn) FY 21 FY 22 FY 23 FY 24 FY 25 FY 26 FY 27 FY 28 FY 29 FY 30 Overall COGR - 24.20% | Past COGR (FY21-FY25) - 22.40% | Future COGR (FY26-FY30) - 25.70% 17
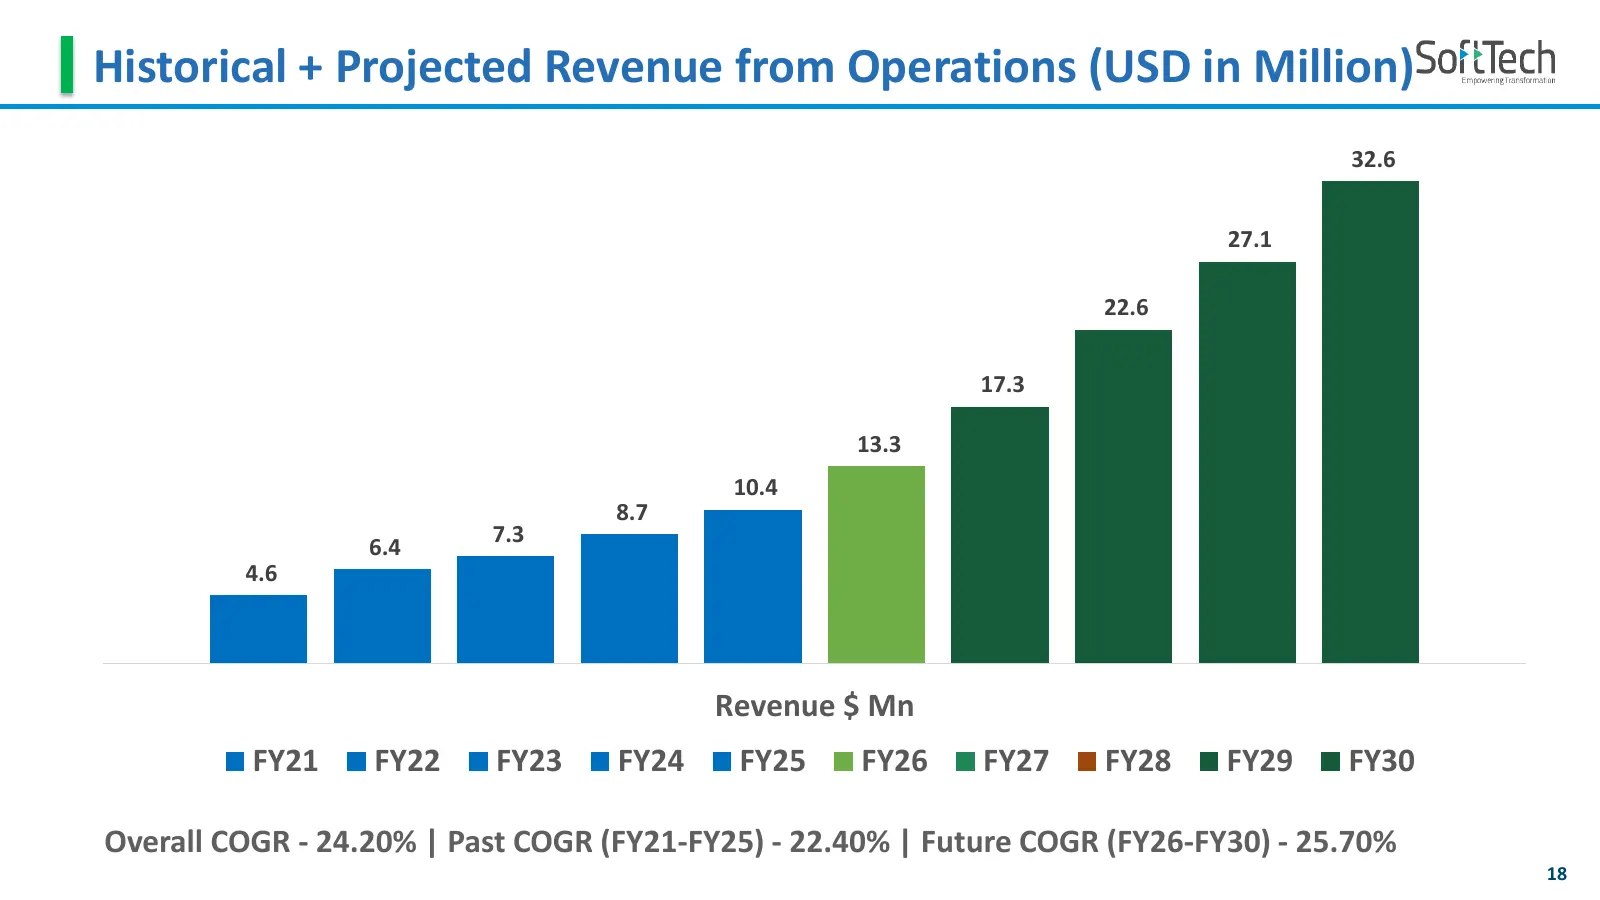
Slide 18: Historical + Projected Revenue from Operations (USD in Million)
Historical + Projected Revenue from Operations (USD in Million) 32.6 27.1 22.6 17.3 13.3 10.4 8.7 7.3 6.4 4.6 Revenue $ Mn FY21 FY22 FY23 FY24 FY25 FY26 FY27 FY28 FY29 FY30 Overall COGR - 24.20% | Past COGR (FY21-FY25) - 22.40% | Future COGR (FY26-FY30) - 25.70% 18
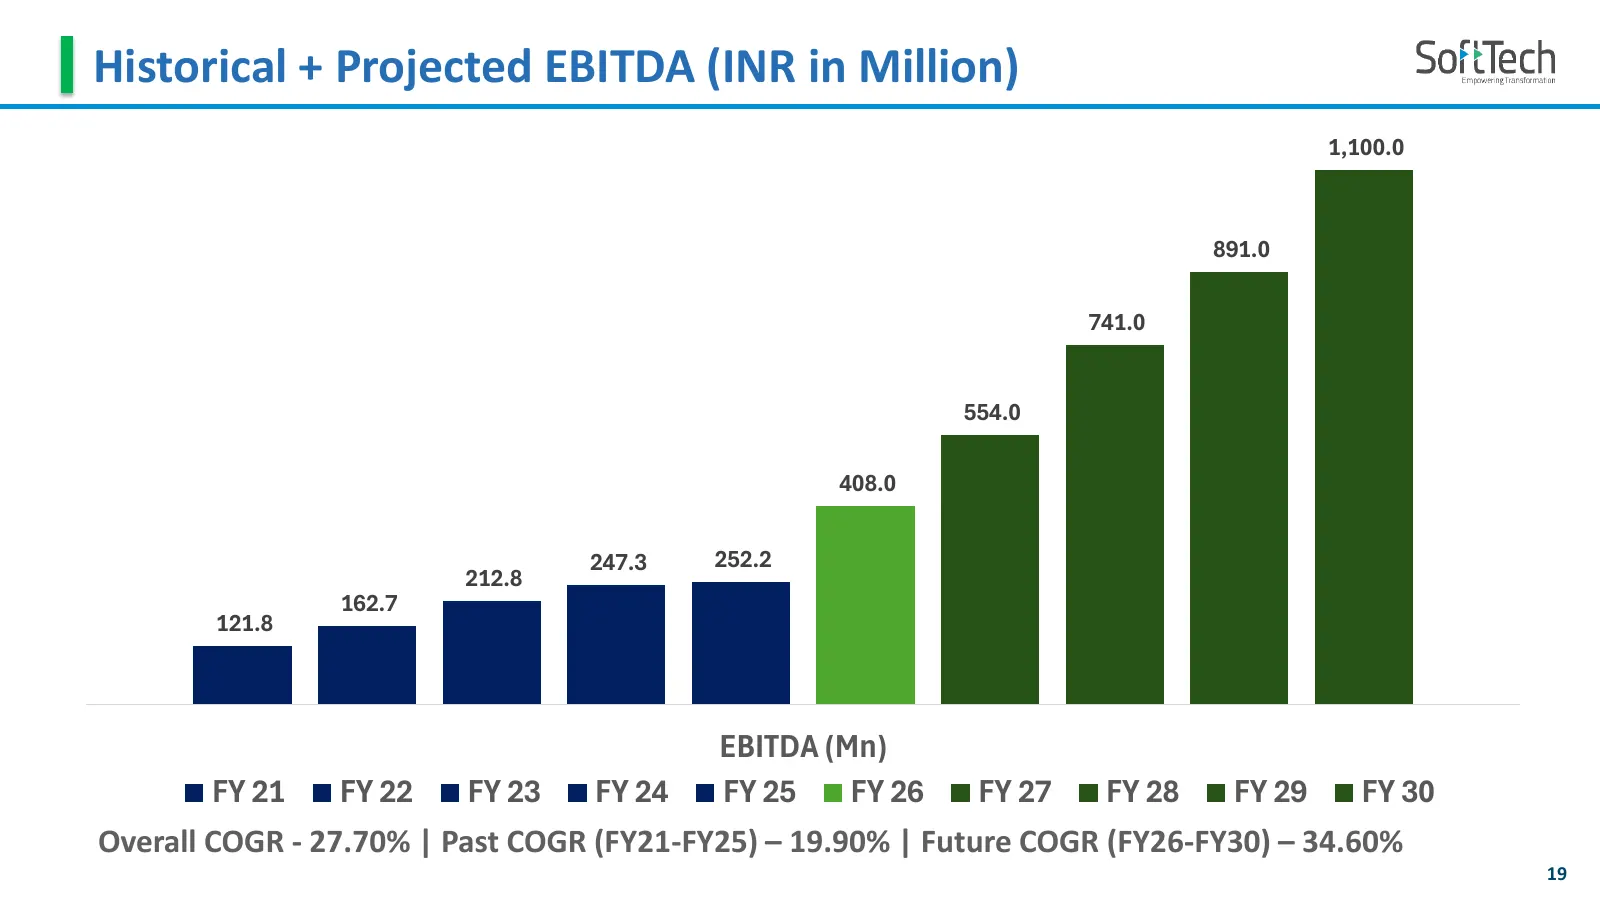
Slide 19: Historical + Projected EBITDA (INR in Million)
Historical + Projected EBITDA (INR in Million) 1,100.0 891.0 741.0 554.0 408.0 247.3 252.2 212.8 162.7 121.8 EBITDA (Mn) FY 21 FY 22 FY 23 FY 24 FY 25 FY 26 FY 27 FY 28 FY 29 FY 30 Overall COGR - 27.70% | Past COGR (FY21-FY25) – 19.90% | Future COGR (FY26-FY30) – 34.60% 19
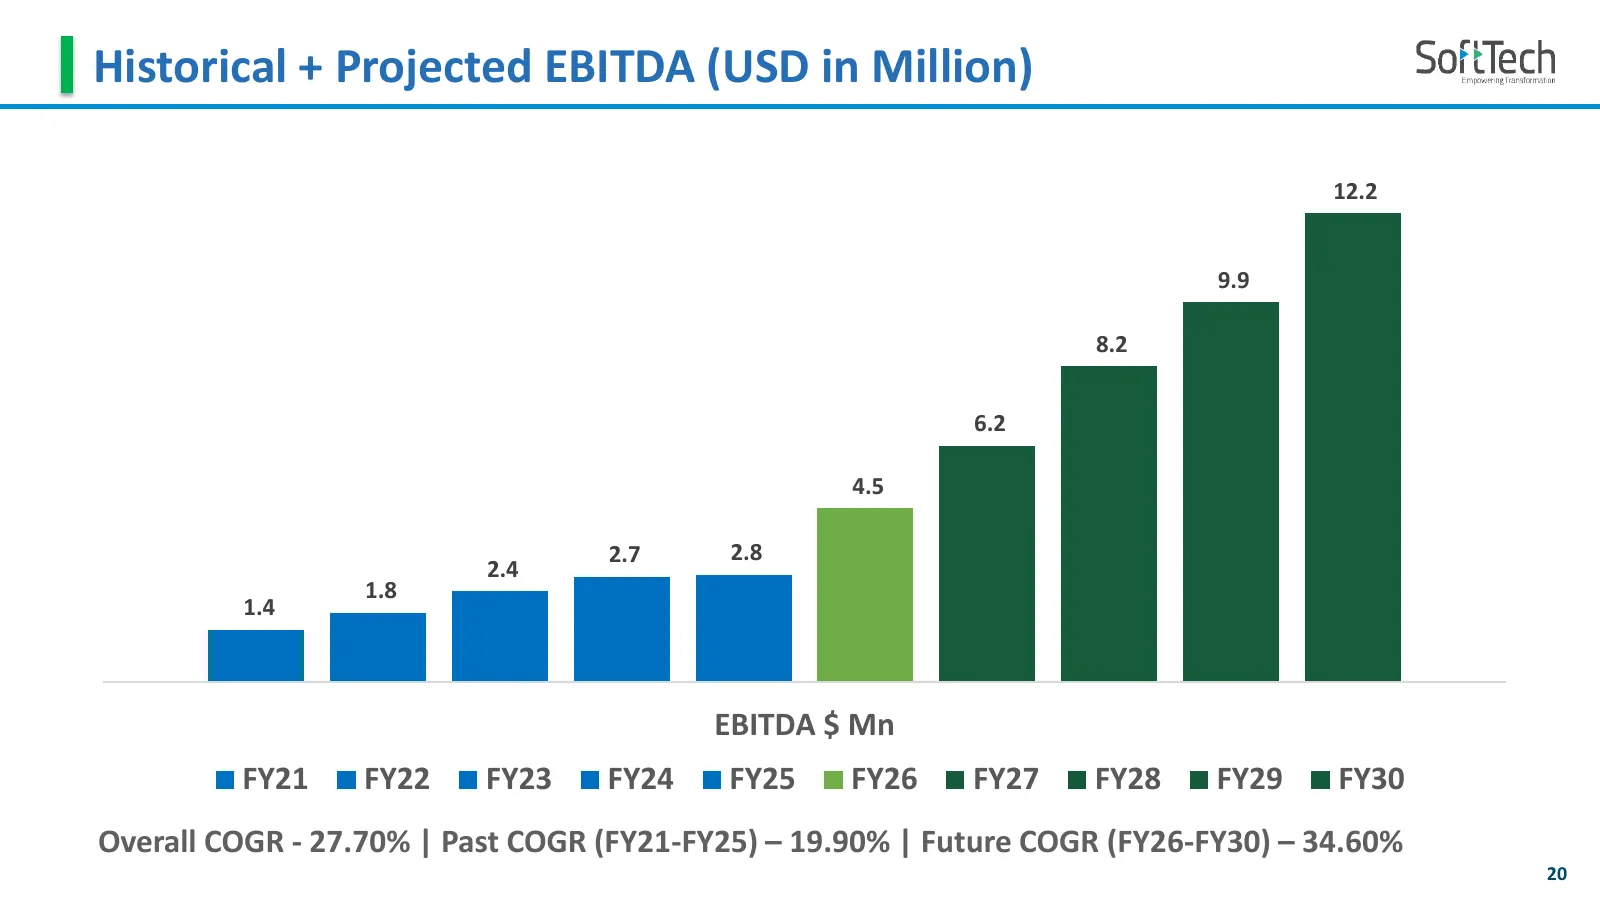
Slide 20: Historical + Projected EBITDA (USD in Million)
Historical + Projected EBITDA (USD in Million) 12.2 9.9 8.2 6.2 4.5 2.7 2.8 2.4 1.8 1.4 EBITDA $ Mn FY21 FY22 FY23 FY24 FY25 FY26 FY27 FY28 FY29 FY30 Overall COGR - 27.70% | Past COGR (FY21-FY25) – 19.90% | Future COGR (FY26-FY30) – 34.60% 20
Slide 21: Thank you
Thank you Company Contact: Deepak Bang Chief Financial Officer SoftTech Engineers Limited compliance@softtech-engr.com Investor Relation Contact: Ms Priya Sen Go India Advisors Priya@goindiaadvisors.com
Source: company website
More decks from SoftTech Engineers Ltd.
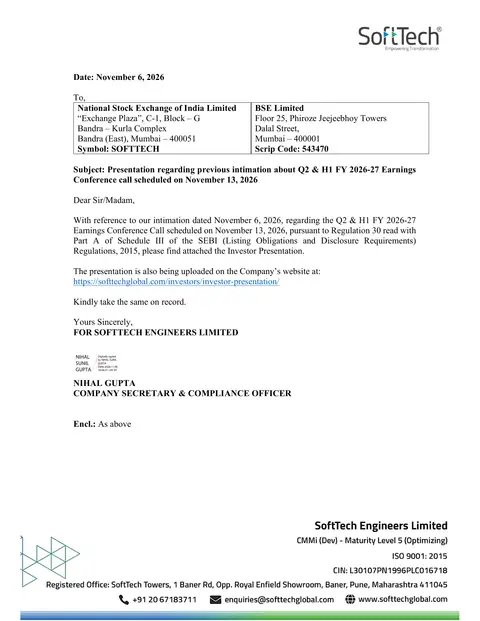 H1 FY2026-27 Earnings Presentation18 slides · Nov 6, 2026
 H1 FY2026-27 Earnings Presentation17 slides · November 2026
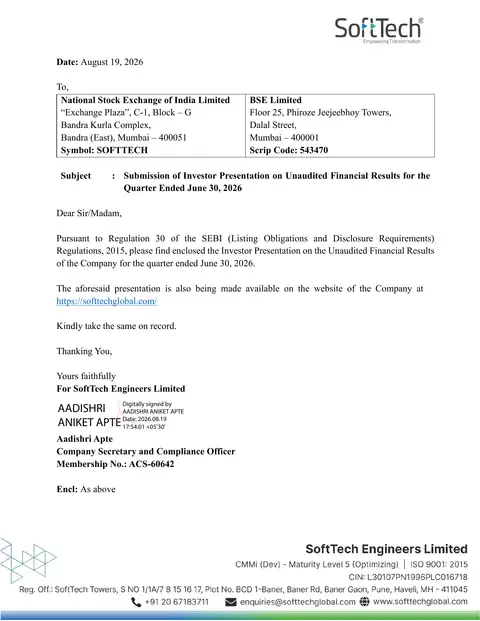 Q1 FY2026-27 Earnings Presentation20 slides · Aug 19, 2026
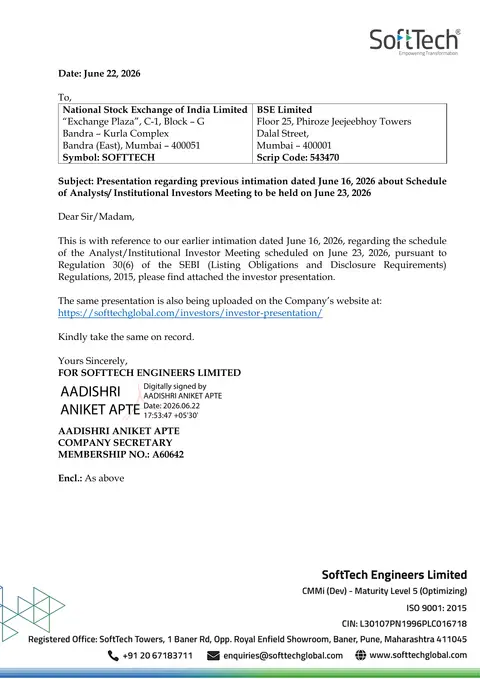 Investor Presentation (June 2026)21 slides · Jun 22, 2026
 Q3 FY2025-26 Earnings Presentation22 slides · Apr 21, 2026
 Q3 FY2025-26 Earnings Presentation18 slides · Feb 16, 2026