SoftTech Engineers Ltd. · NSE:SOFTTECH
SoftTech Engineers — H1 FY2026-27 Earnings Presentation
17 slides from SoftTech Engineers's earnings presentation, November 2026

Slide 1: SoftTech Engineers Limited Investor Presentation
SoftTech Engineers Limited Investor Presentation Q2 / H1 FY 2026–27 – Financial Result Pioneering Smarter Solutions for Digital Transformation in Urban Infrastructure, Smart Cities and the Construction Industry
Slide 2: Forward-Looking Statements & Disclaimer
Forward-Looking Statements & Disclaimer This presentation and the accompanying slides (the “Presentation”), have been prepared by SoftTech Engineers Limited (the “Company”) solely for information purposes and do not constitute any offer, recommendation, or invitation to purchase or subscribe to any
Slide 3: Index
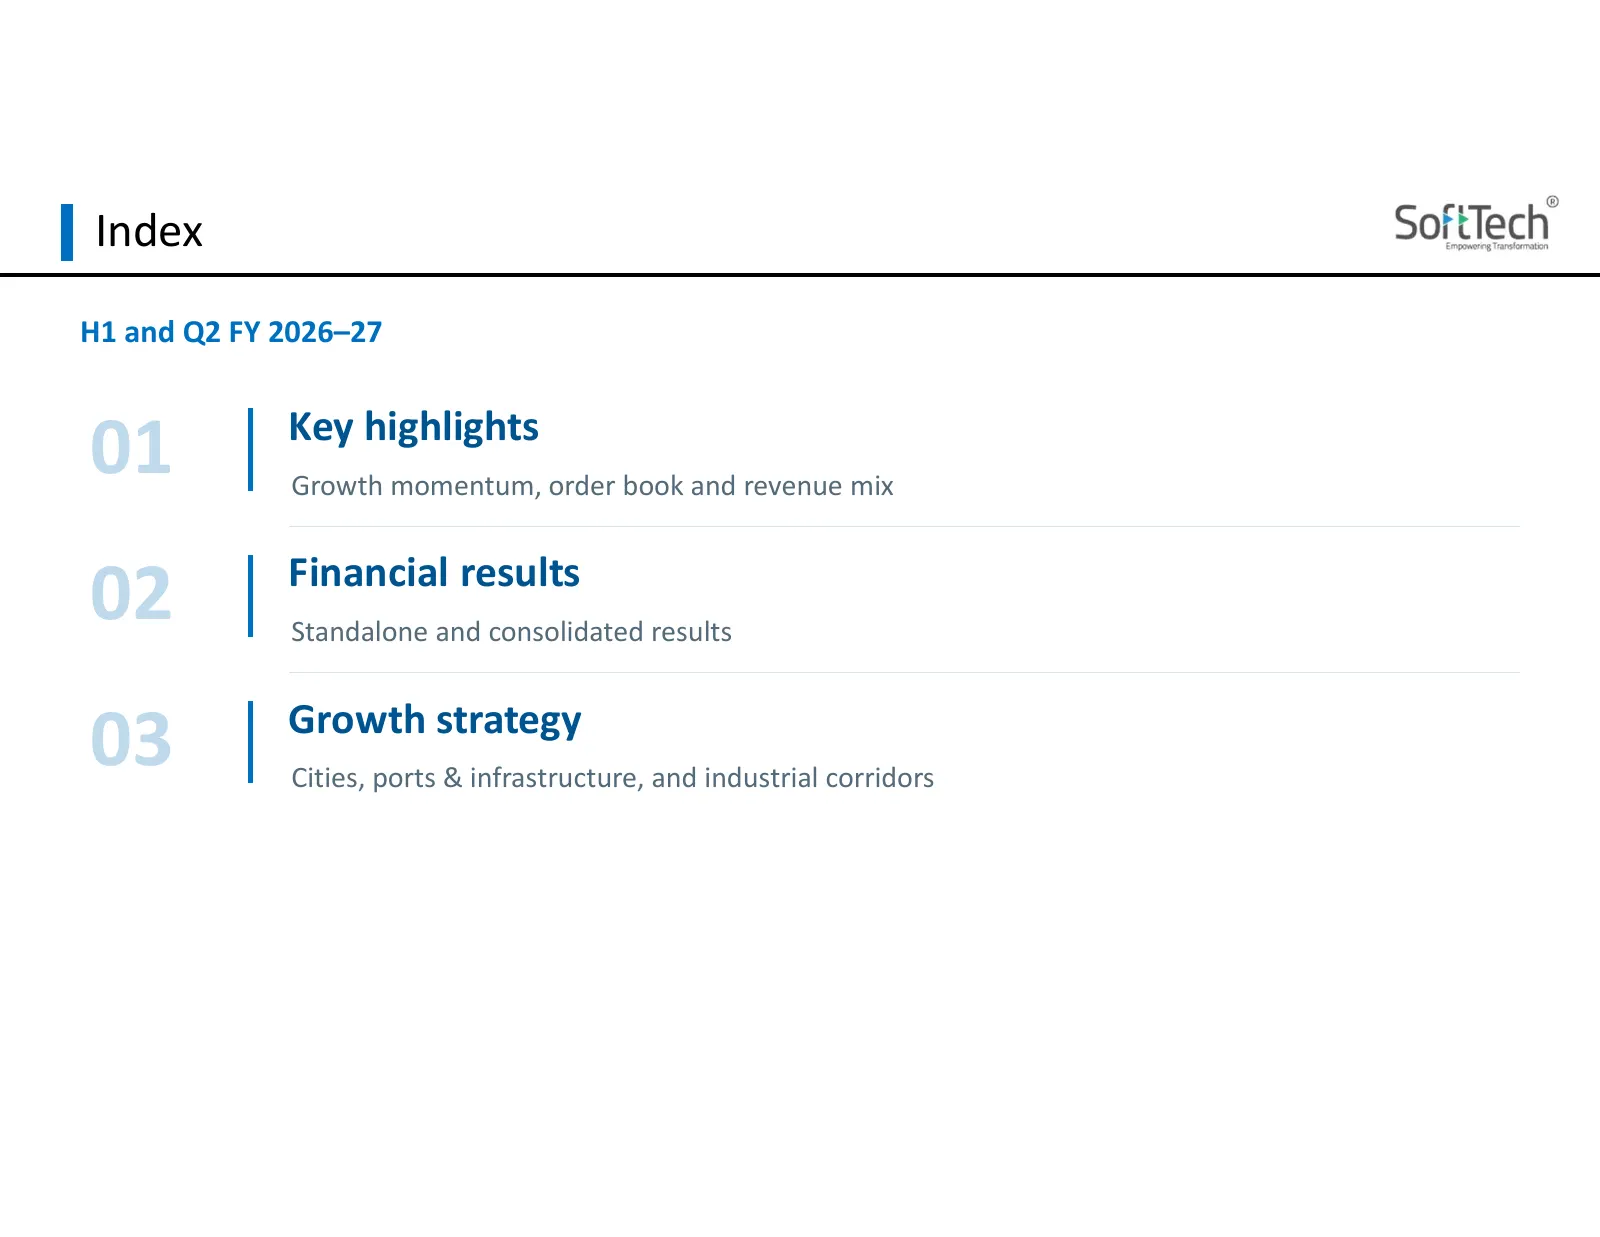
Index H1 and Q2 FY 2026–27 01 Key highlights Growth momentum, order book and revenue mix 02 Financial results Standalone and consolidated results 03 Growth strategy Cities, ports & infrastructure, and industrial corridors
Slide 4: Key highlights
Board presentation Key highlights Growth momentum, order book and revenue mix H1 and Q2 FY 2026–27
Slide 5: Key highlights: Orders and sales pipeline
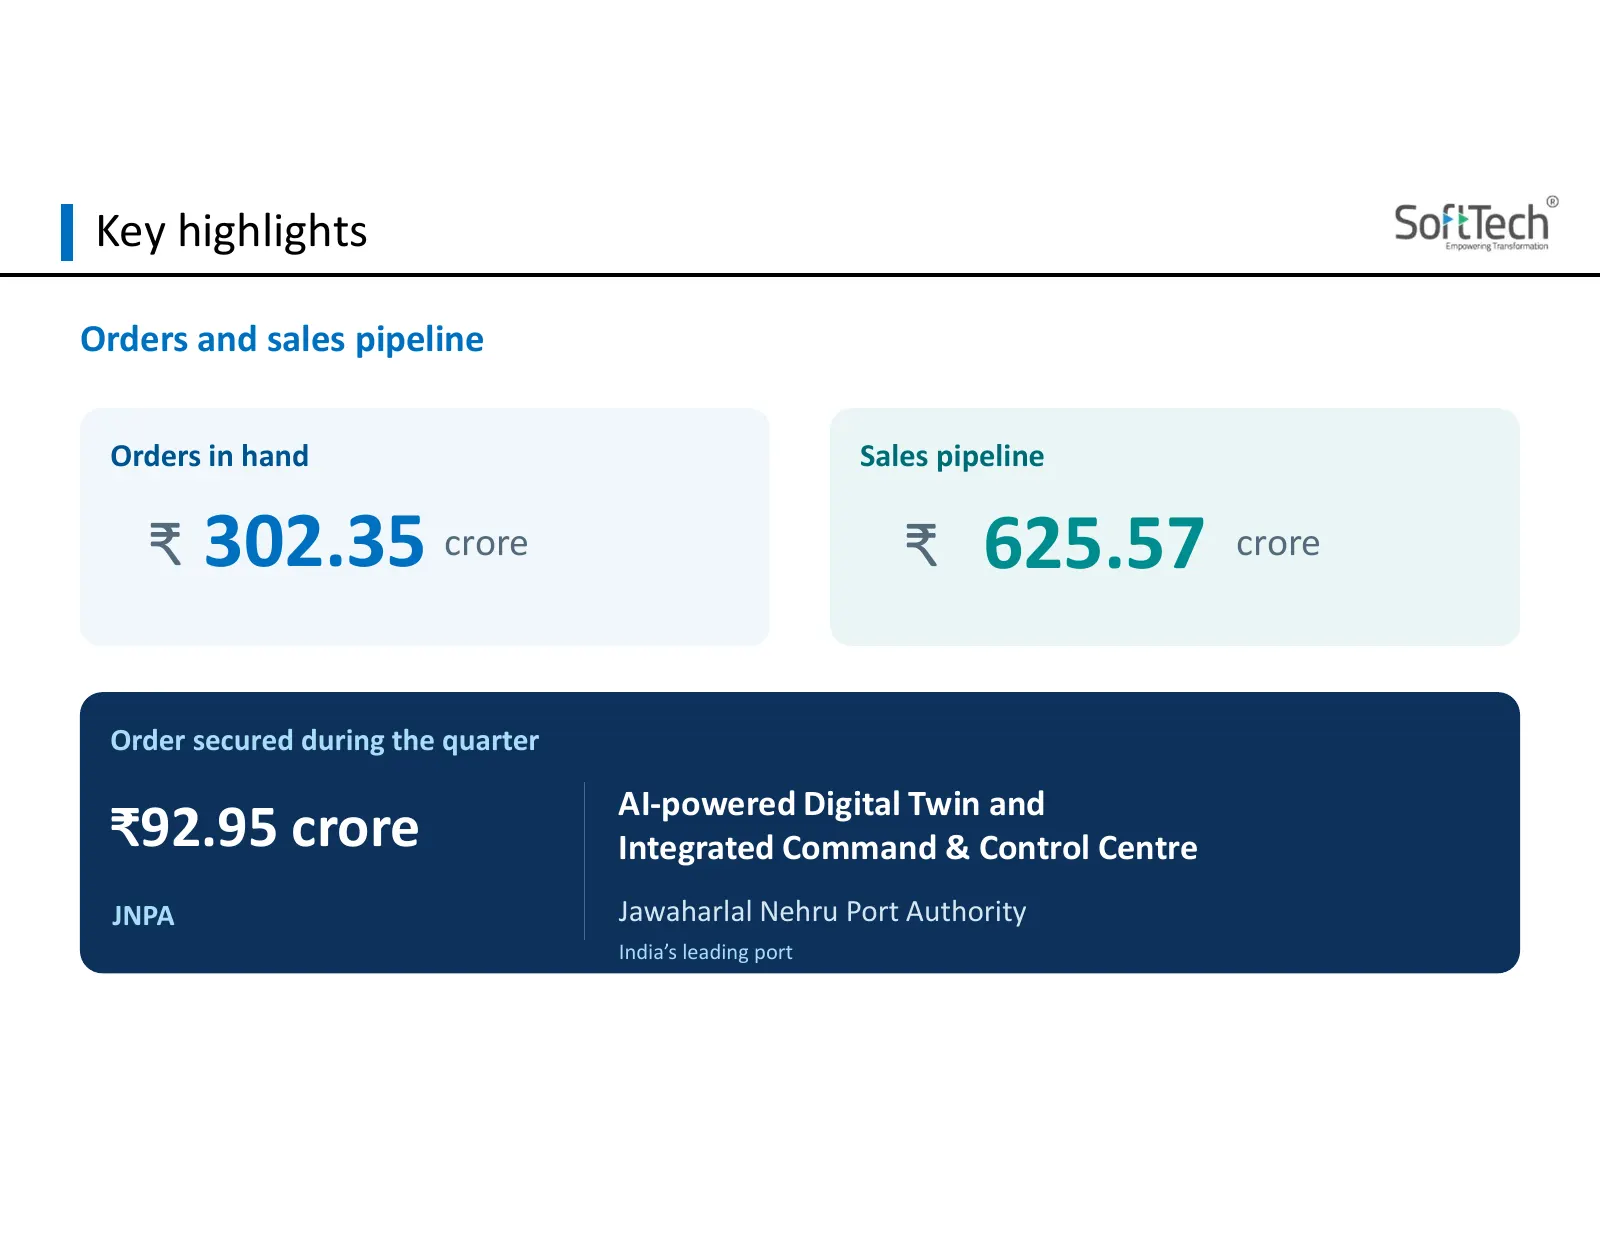
Key highlights Orders and sales pipeline Orders in hand Sales pipeline ₹ 302.35 crore ₹ 625.57 crore Order secured during the quarter AI-powered Digital Twin and ₹92.95 crore Integrated Command & Control Centre JNPA Jawaharlal Nehru Port Authority India’s leading port
Slide 6: Performance at a glance: Standalone
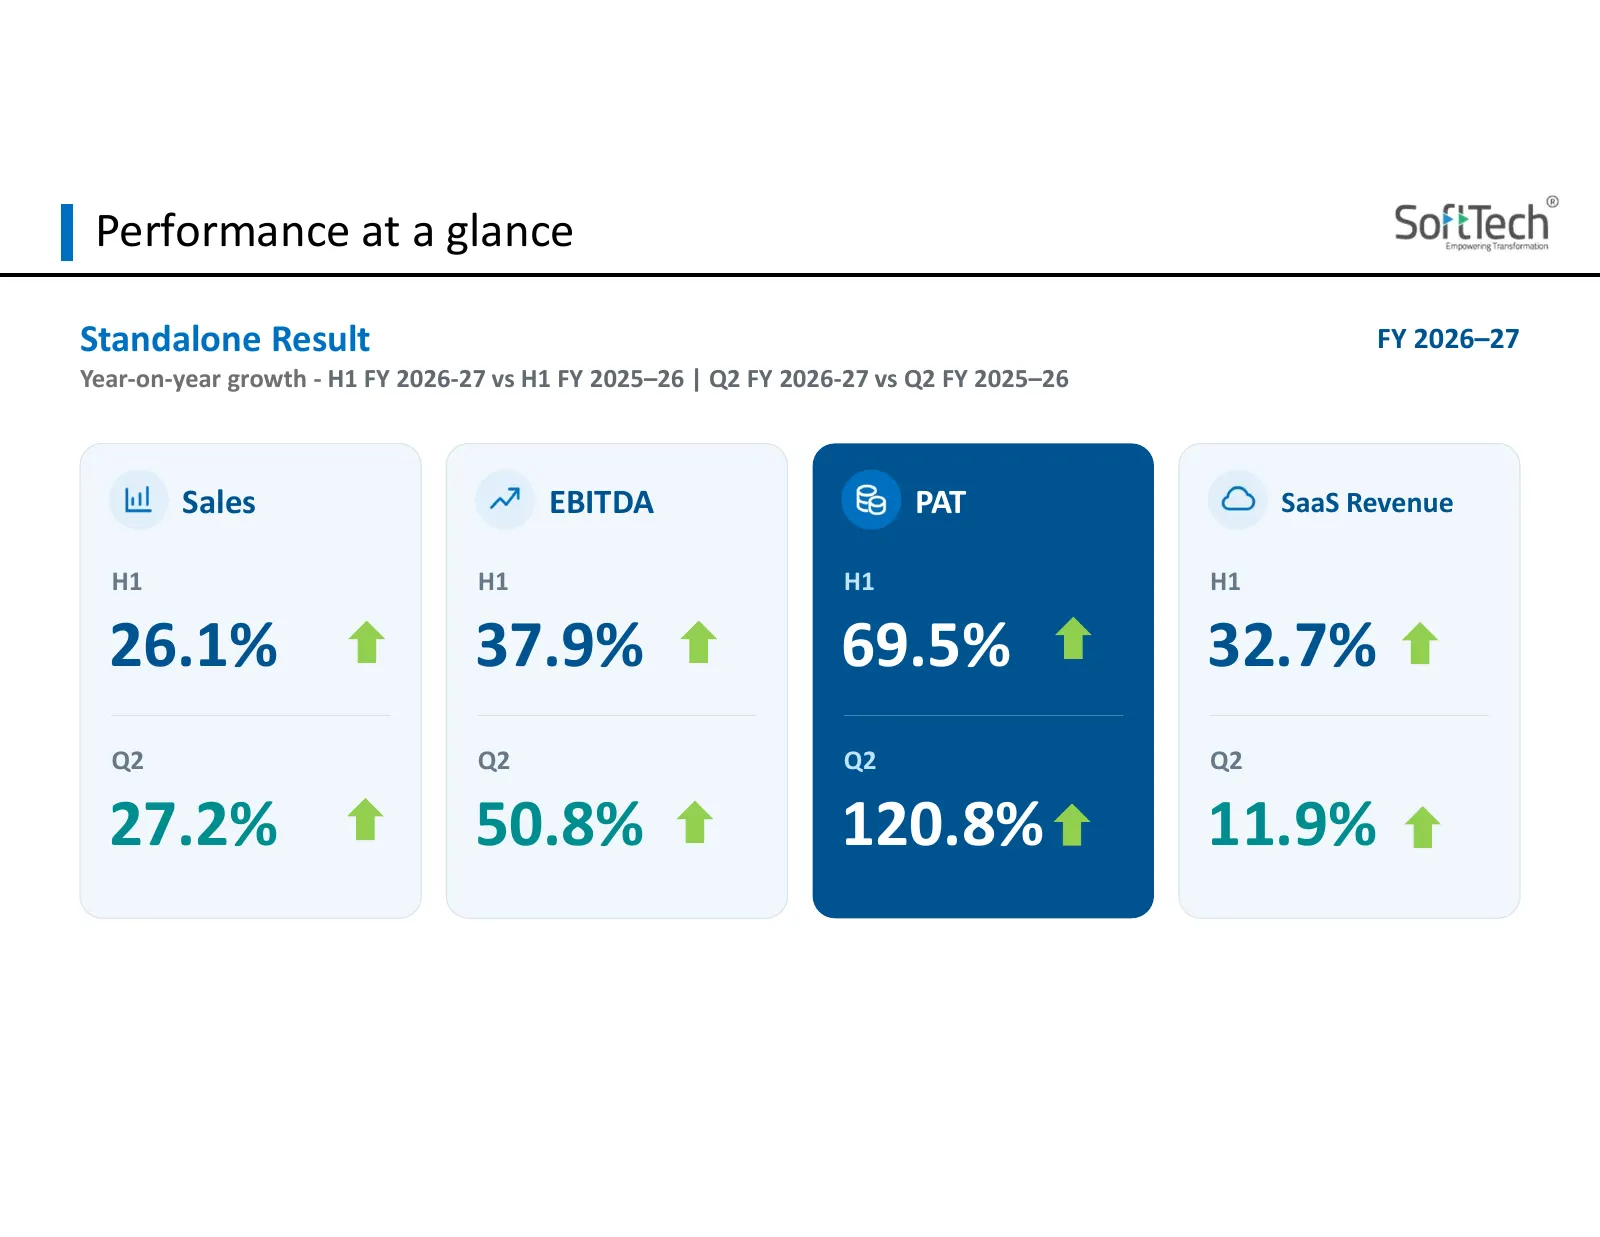
Performance at a glance Standalone Result FY 2026–27 Year-on-year growth - H1 FY 2026-27 vs H1 FY 2025–26 | Q2 FY 2026-27 vs Q2 FY 2025–26 Sales EBITDA PAT SaaS Revenue H1 H1 H1 H1 26.1% 37.9% 69.5% 32.7% Q2 Q2 Q2 Q2 27.2% 50.8% 120.8% 11.9%
Slide 7: Performance at a glance: Consolidated
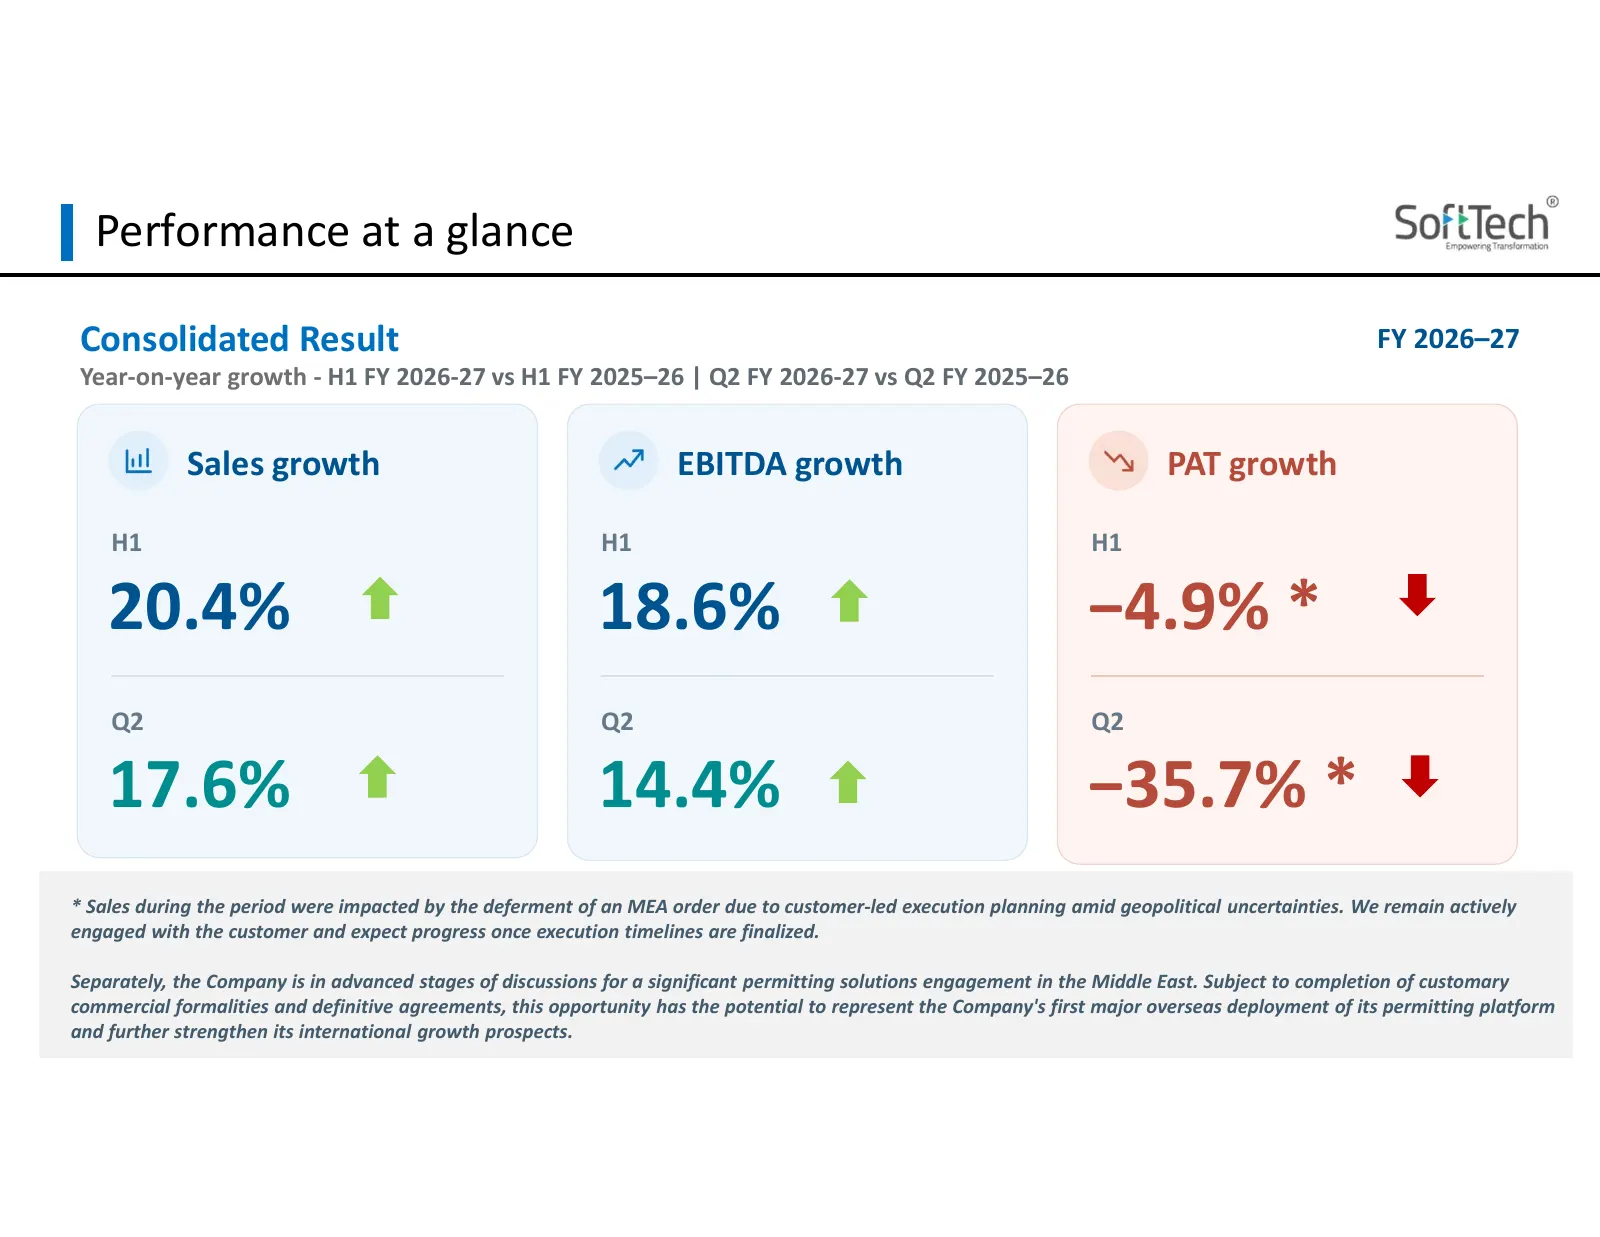
Performance at a glance Consolidated Result FY 2026–27 Year-on-year growth - H1 FY 2026-27 vs H1 FY 2025–26 | Q2 FY 2026-27 vs Q2 FY 2025–26 Sales growth EBITDA growth PAT growth H1 H1 H1 20.4% 18.6% −4.9% * Q2 Q2 Q2 17.6% 14.4% −35.7% * * Sales during the period were impacted by the deferment of an
Slide 8: Revenue Mix
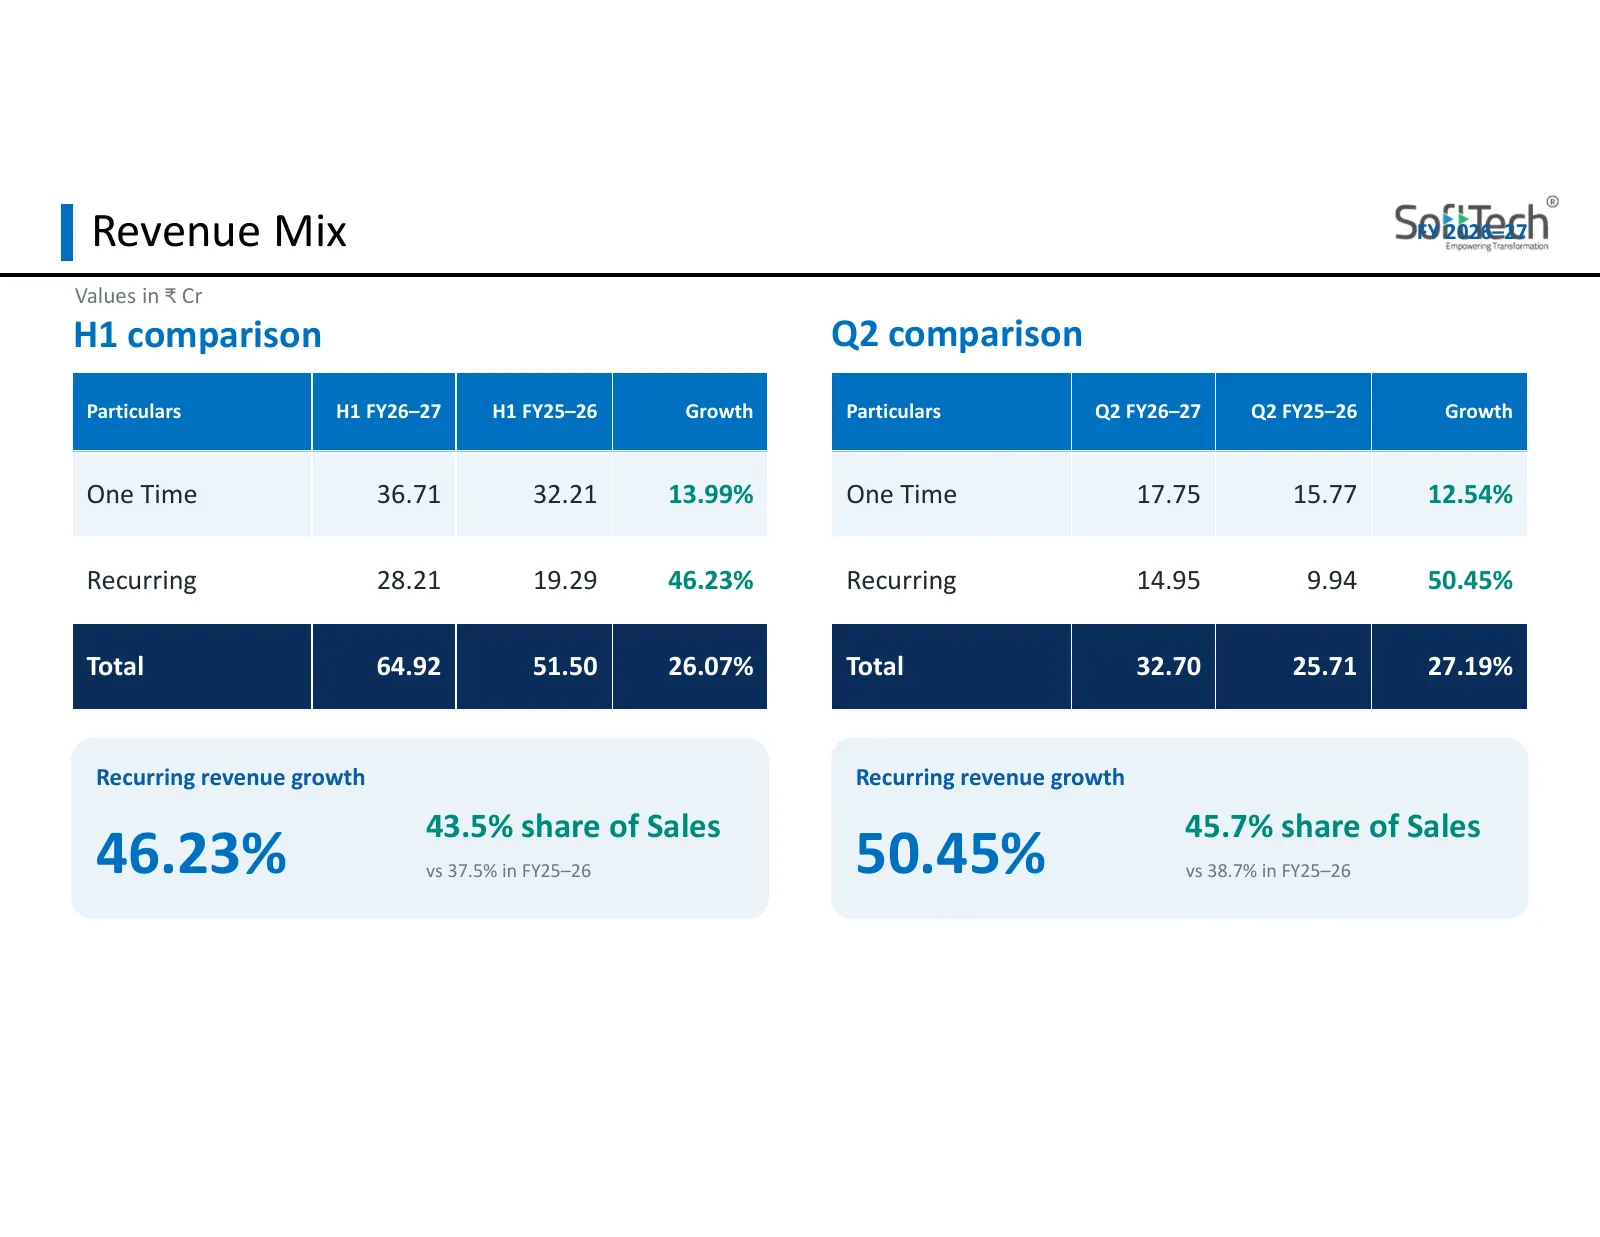
Revenue Mix FY 2026–27 Values in ₹ Cr H1 comparison Q2 comparison Particulars H1 FY26–27 H1 FY25–26 Growth Particulars Q2 FY26–27 Q2 FY25–26 Growth One Time 36.71 32.21 13.99% One Time 17.75 15.77 12.54% Recurring 28.21 19.29 46.23% Recurring 14.95 9.94 50.45% Total 64.92 51.50 26.07% Total 32.70 25
Slide 9: Product mix
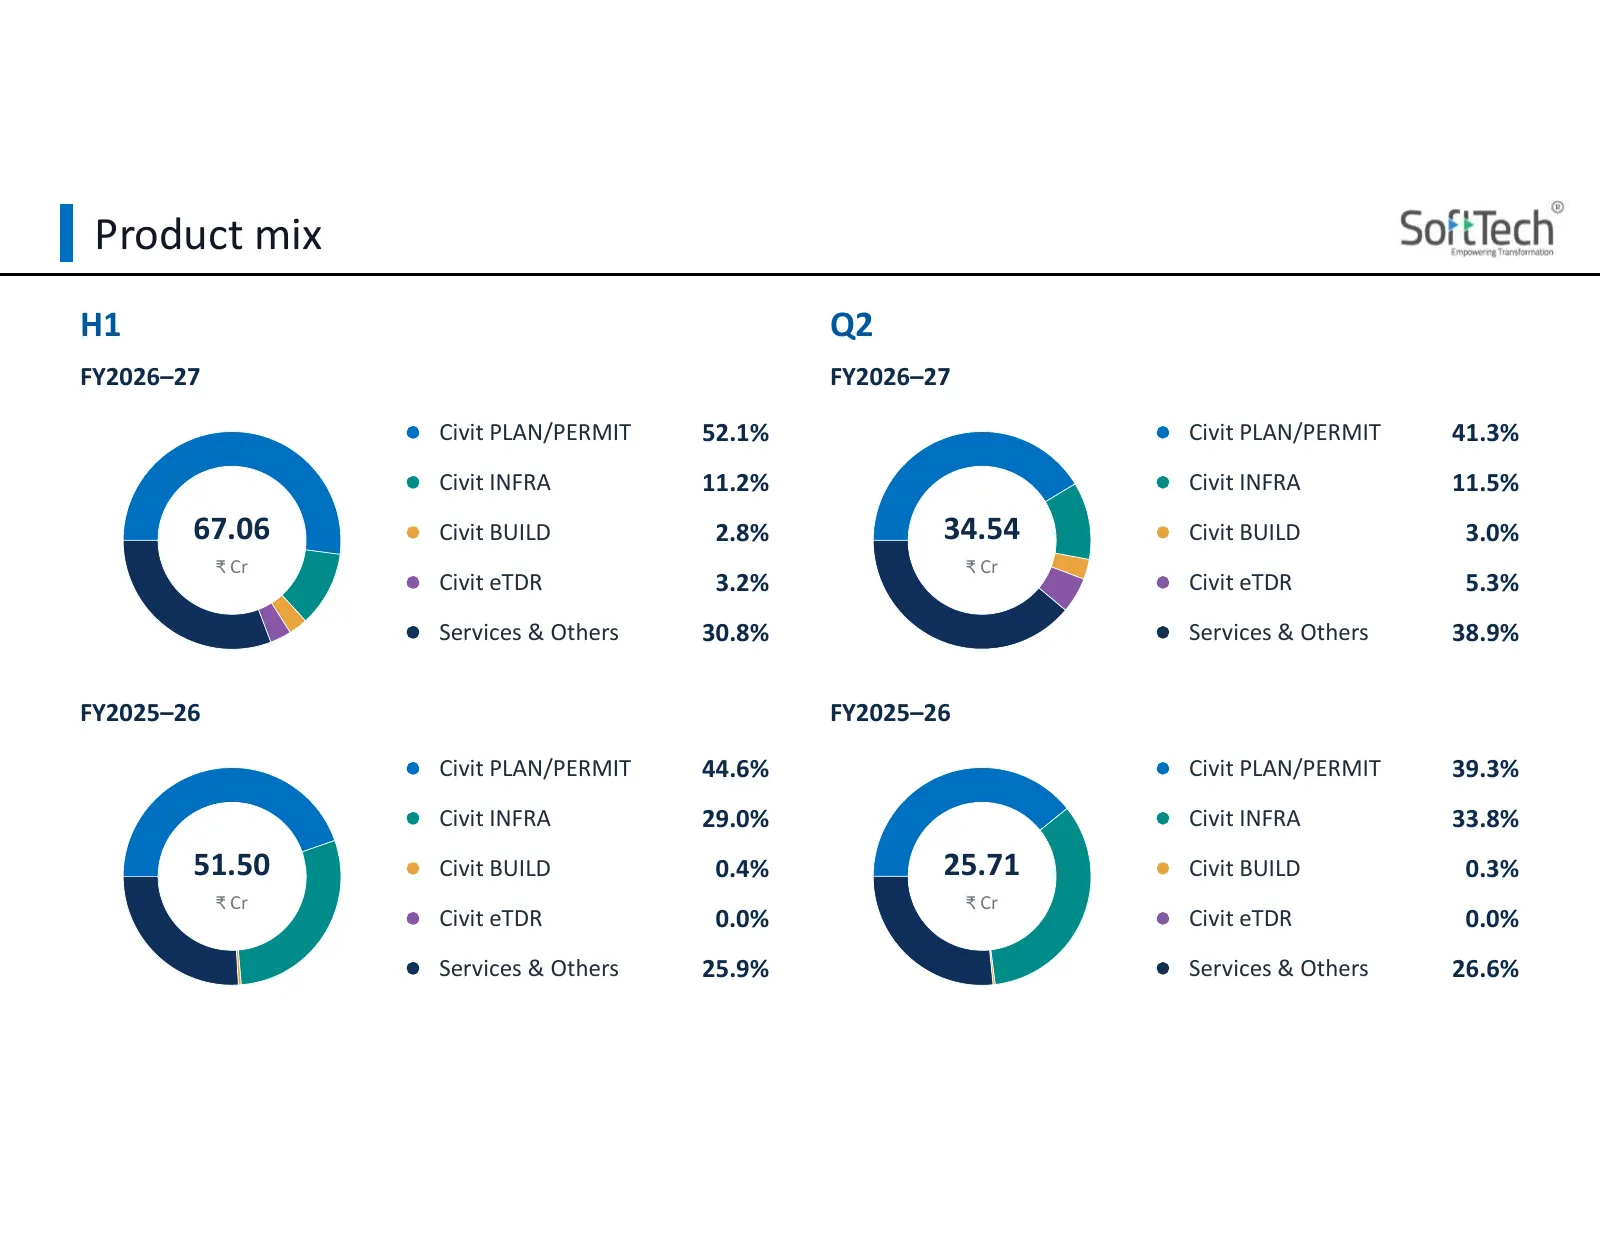
Product mix H1 Q2 FY2026–27 FY2026–27 Civit PLAN/PERMIT 52.1% Civit PLAN/PERMIT 41.3% Civit INFRA 11.2% Civit INFRA 11.5% 67.06 Civit BUILD 2.8% 34.54 Civit BUILD 3.0% ₹ Cr ₹ Cr Civit eTDR 3.2% Civit eTDR 5.3% Services & Others 30.8% Services & Others 38.9% FY2025–26 FY2025–26 Civit PLAN/PERMIT 44.6
Slide 10: Financial results
Financial results Standalone and consolidated results H1 and Q2 FY 2026–27
Slide 11: Q2 and H1 KPI Dashboard: Standalone
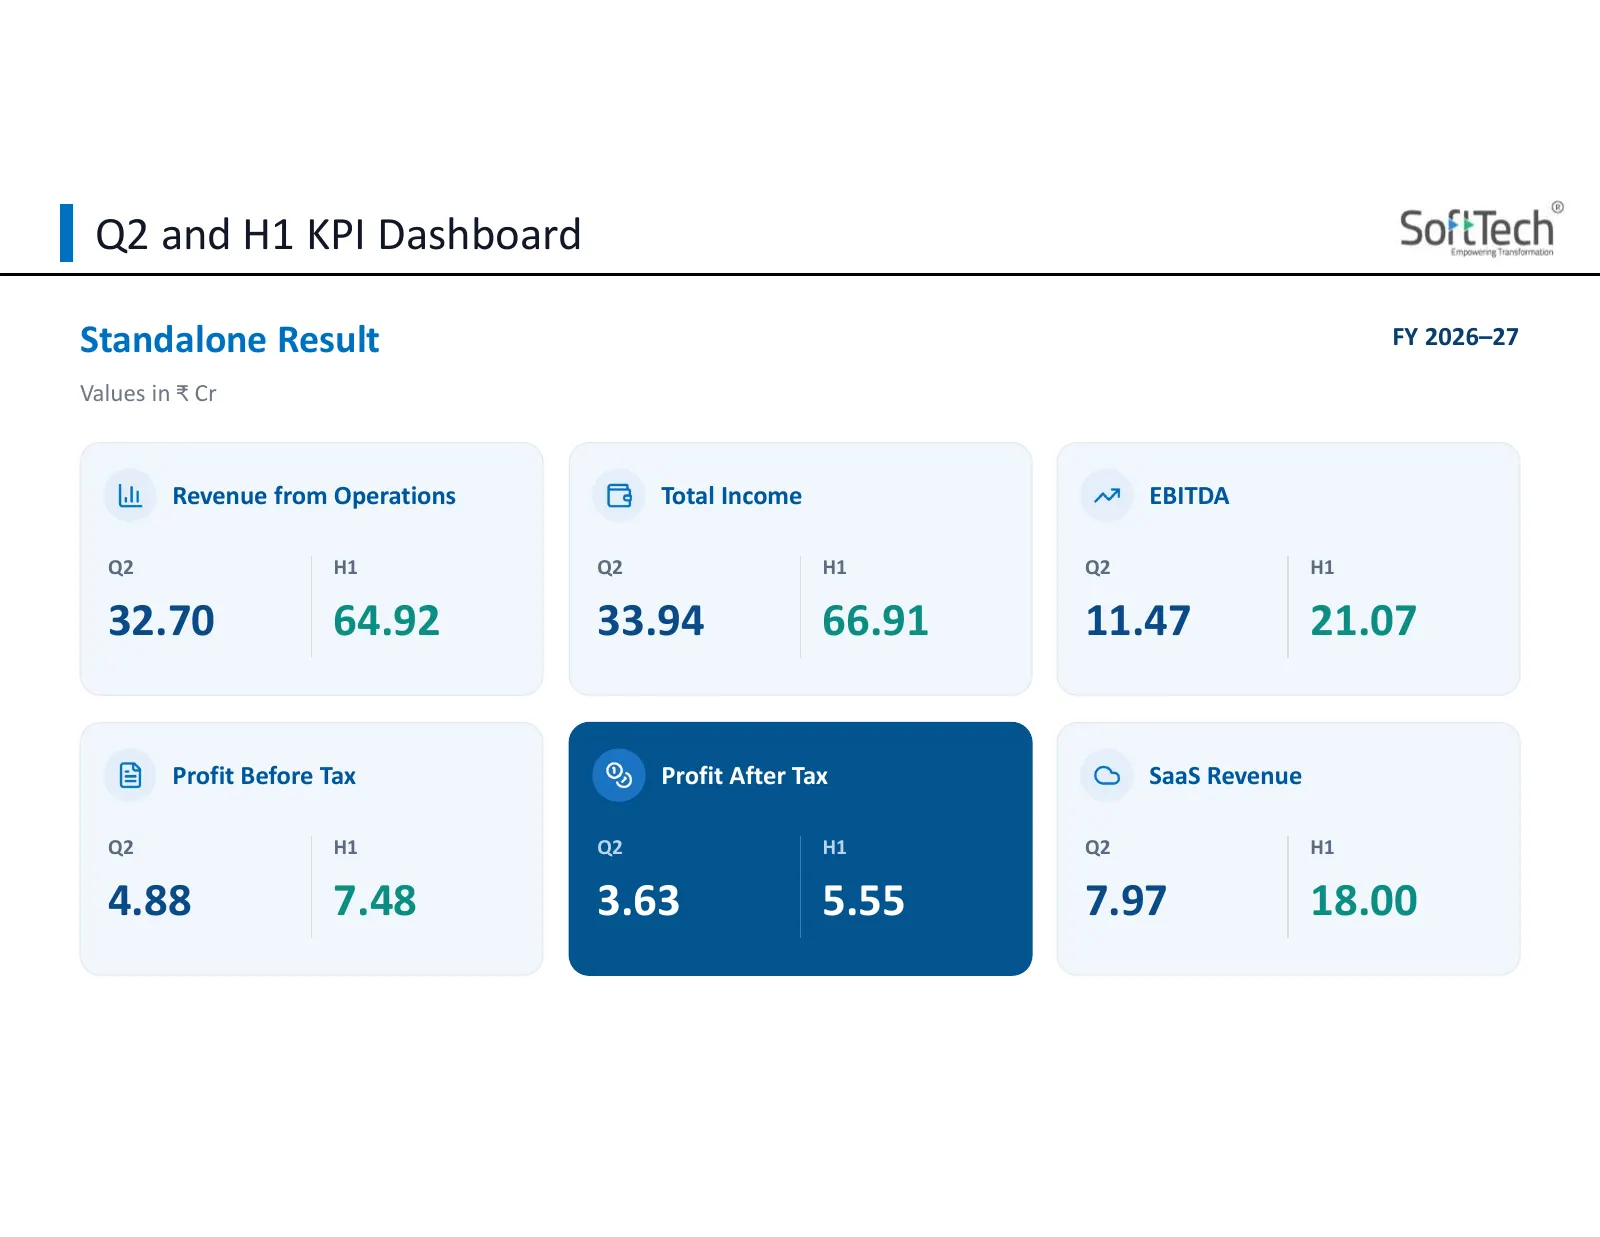
Q2 and H1 KPI Dashboard Standalone Result FY 2026–27 Values in ₹ Cr Revenue from Operations Total Income EBITDA Q2 H1 Q2 H1 Q2 H1 32.70 64.92 33.94 66.91 11.47 21.07 Profit Before Tax Profit After Tax SaaS Revenue Q2 H1 Q2 H1 Q2 H1 4.88 7.48 3.63 5.55 7.97 18.00
Slide 12: Standalone financial performance
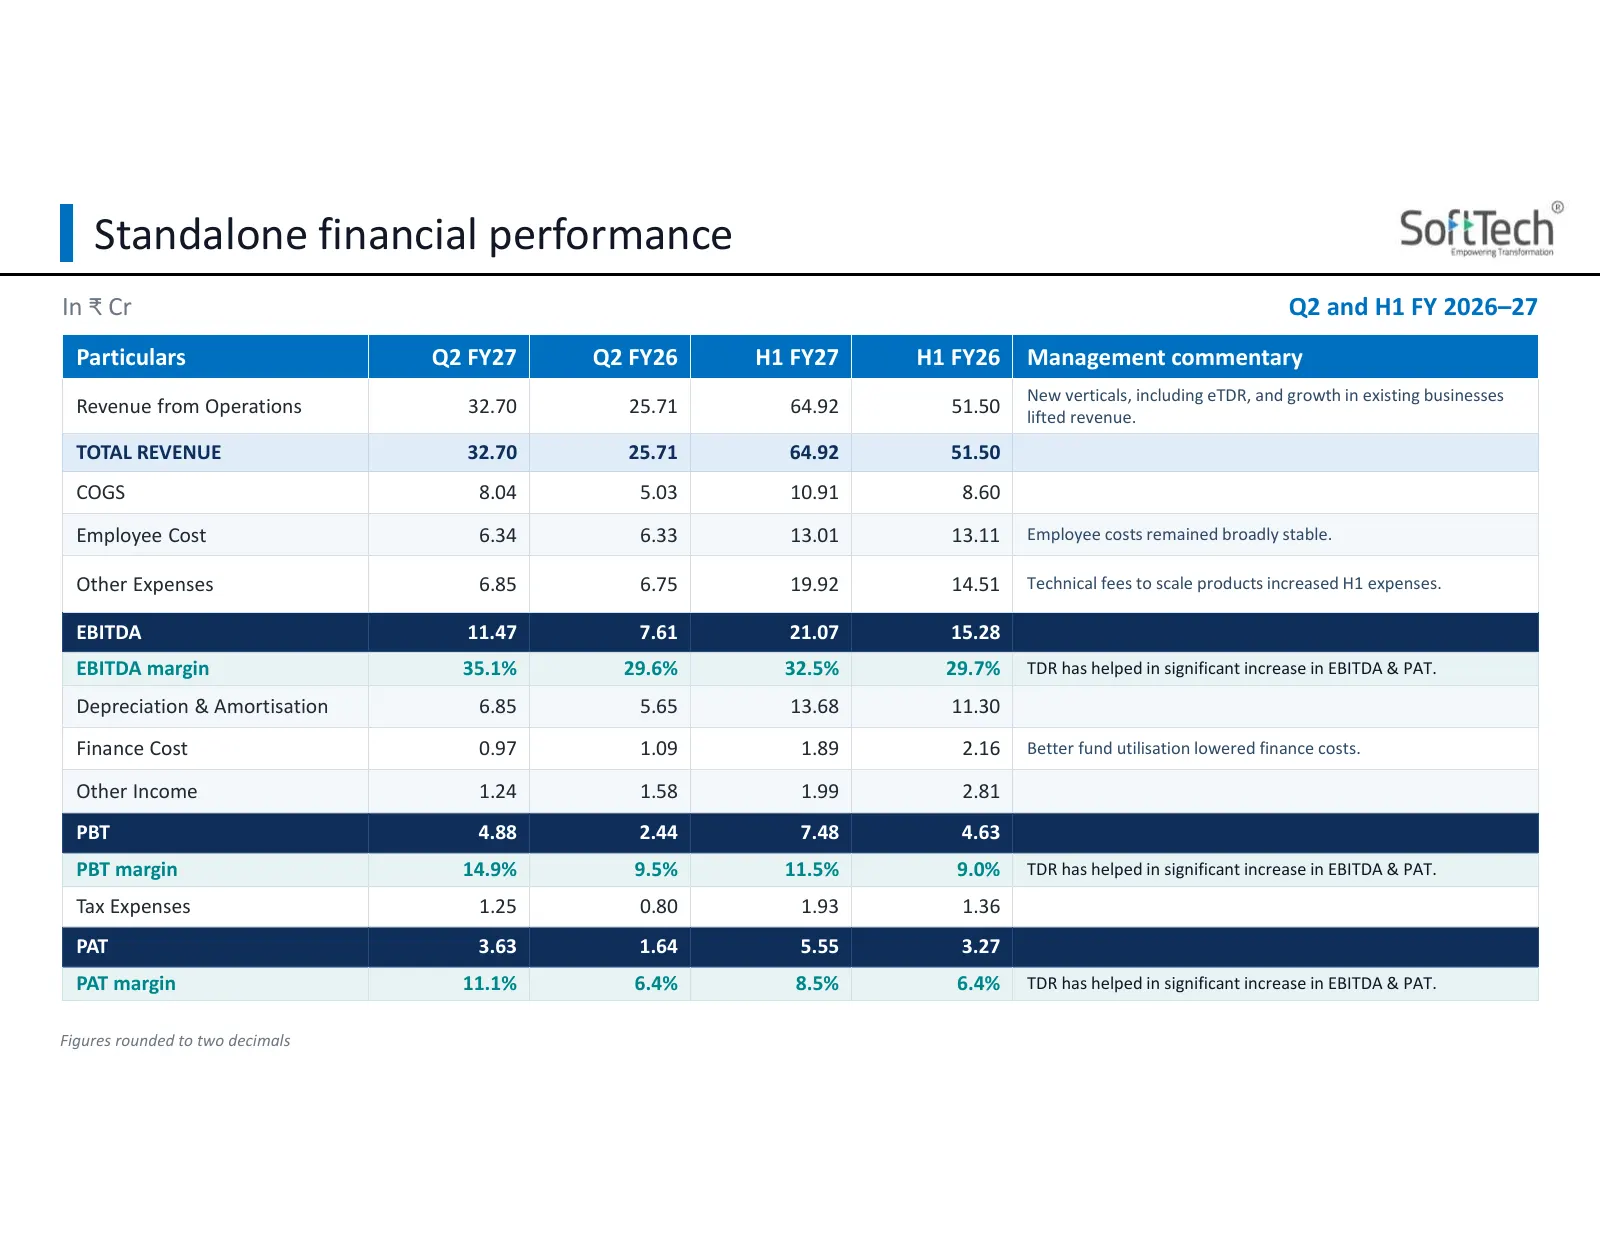
Standalone financial performance In ₹ Cr Q2 and H1 FY 2026–27 Particulars Q2 FY27 Q2 FY26 H1 FY27 H1 FY26 Management commentary New verticals, including eTDR, and growth in existing businesses Revenue from Operations 32.70 25.71 64.92 51.50 lifted revenue. TOTAL REVENUE 32.70 25.71 64.92 51.50 COGS
Slide 13: Q2 and H1 KPI Dashboard: Consolidated
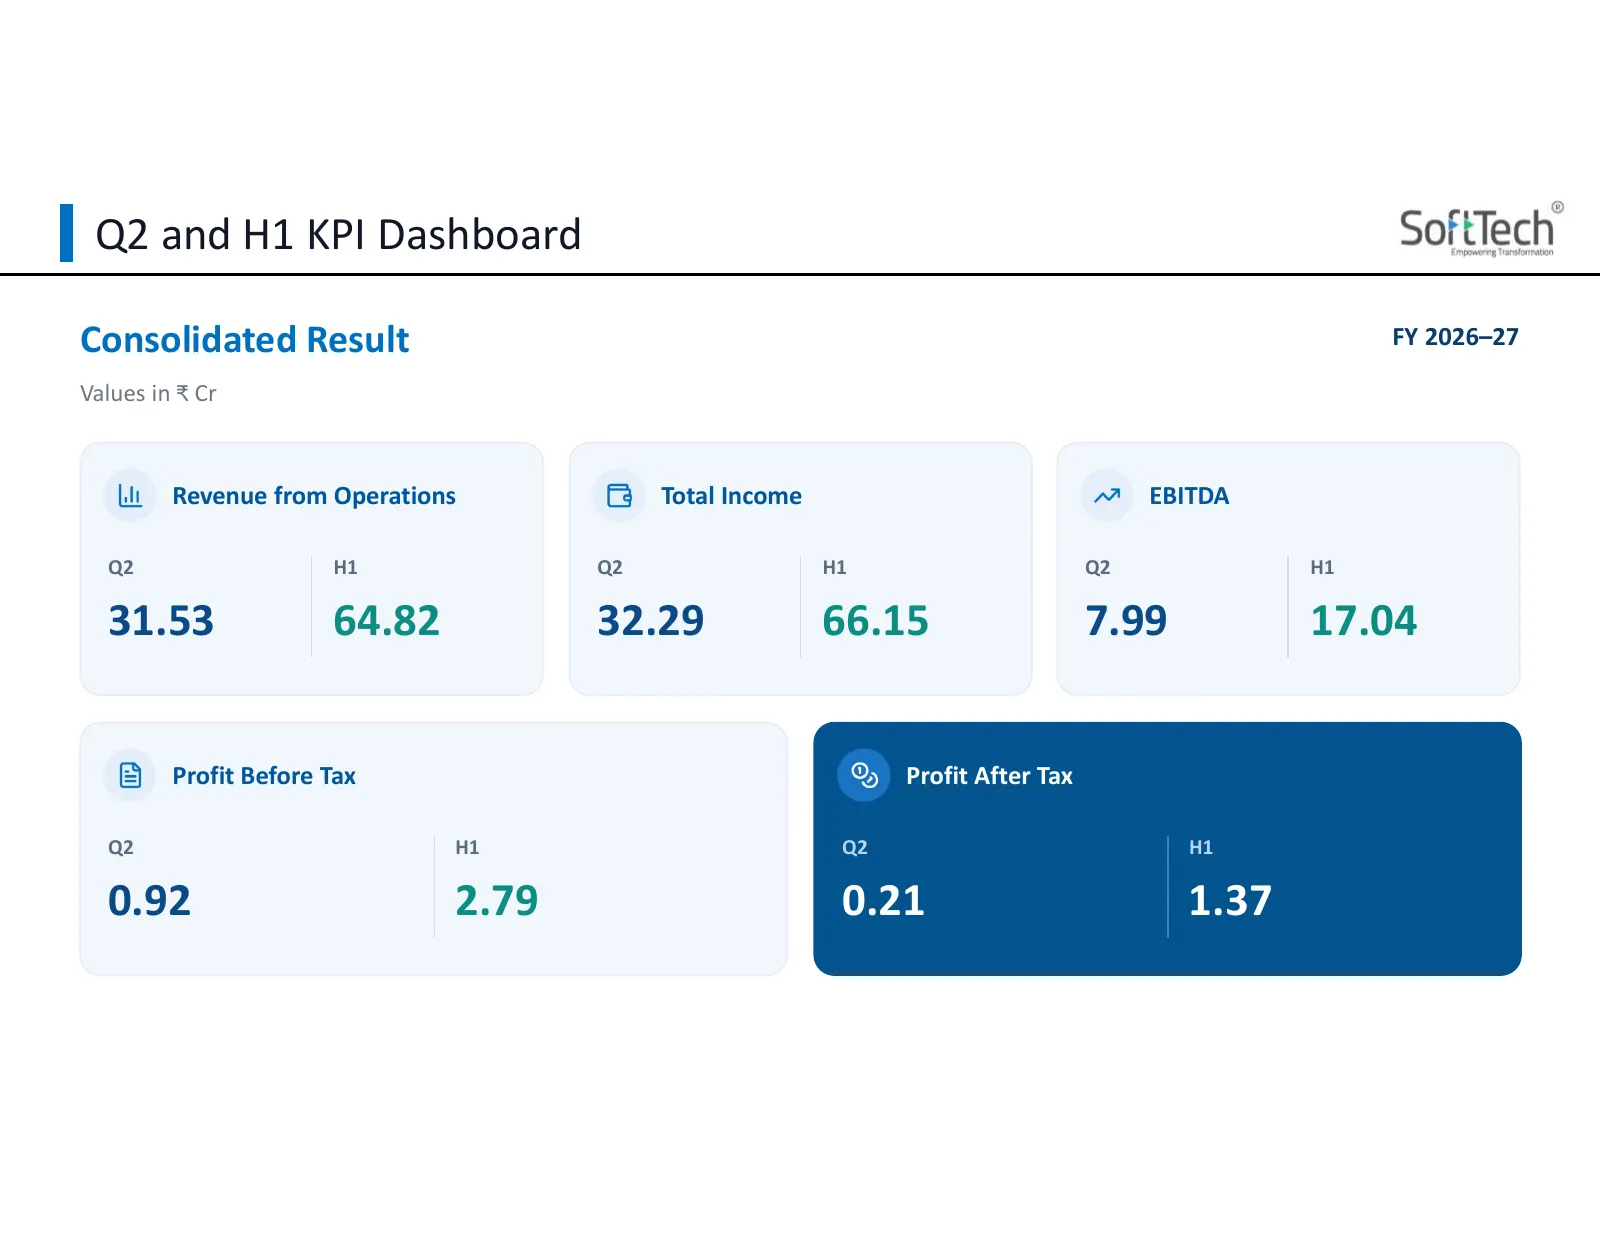
Q2 and H1 KPI Dashboard Consolidated Result FY 2026–27 Values in ₹ Cr Revenue from Operations Total Income EBITDA Q2 H1 Q2 H1 Q2 H1 31.53 64.82 32.29 66.15 7.99 17.04 Profit Before Tax Profit After Tax Q2 H1 Q2 H1 0.92 2.79 0.21 1.37
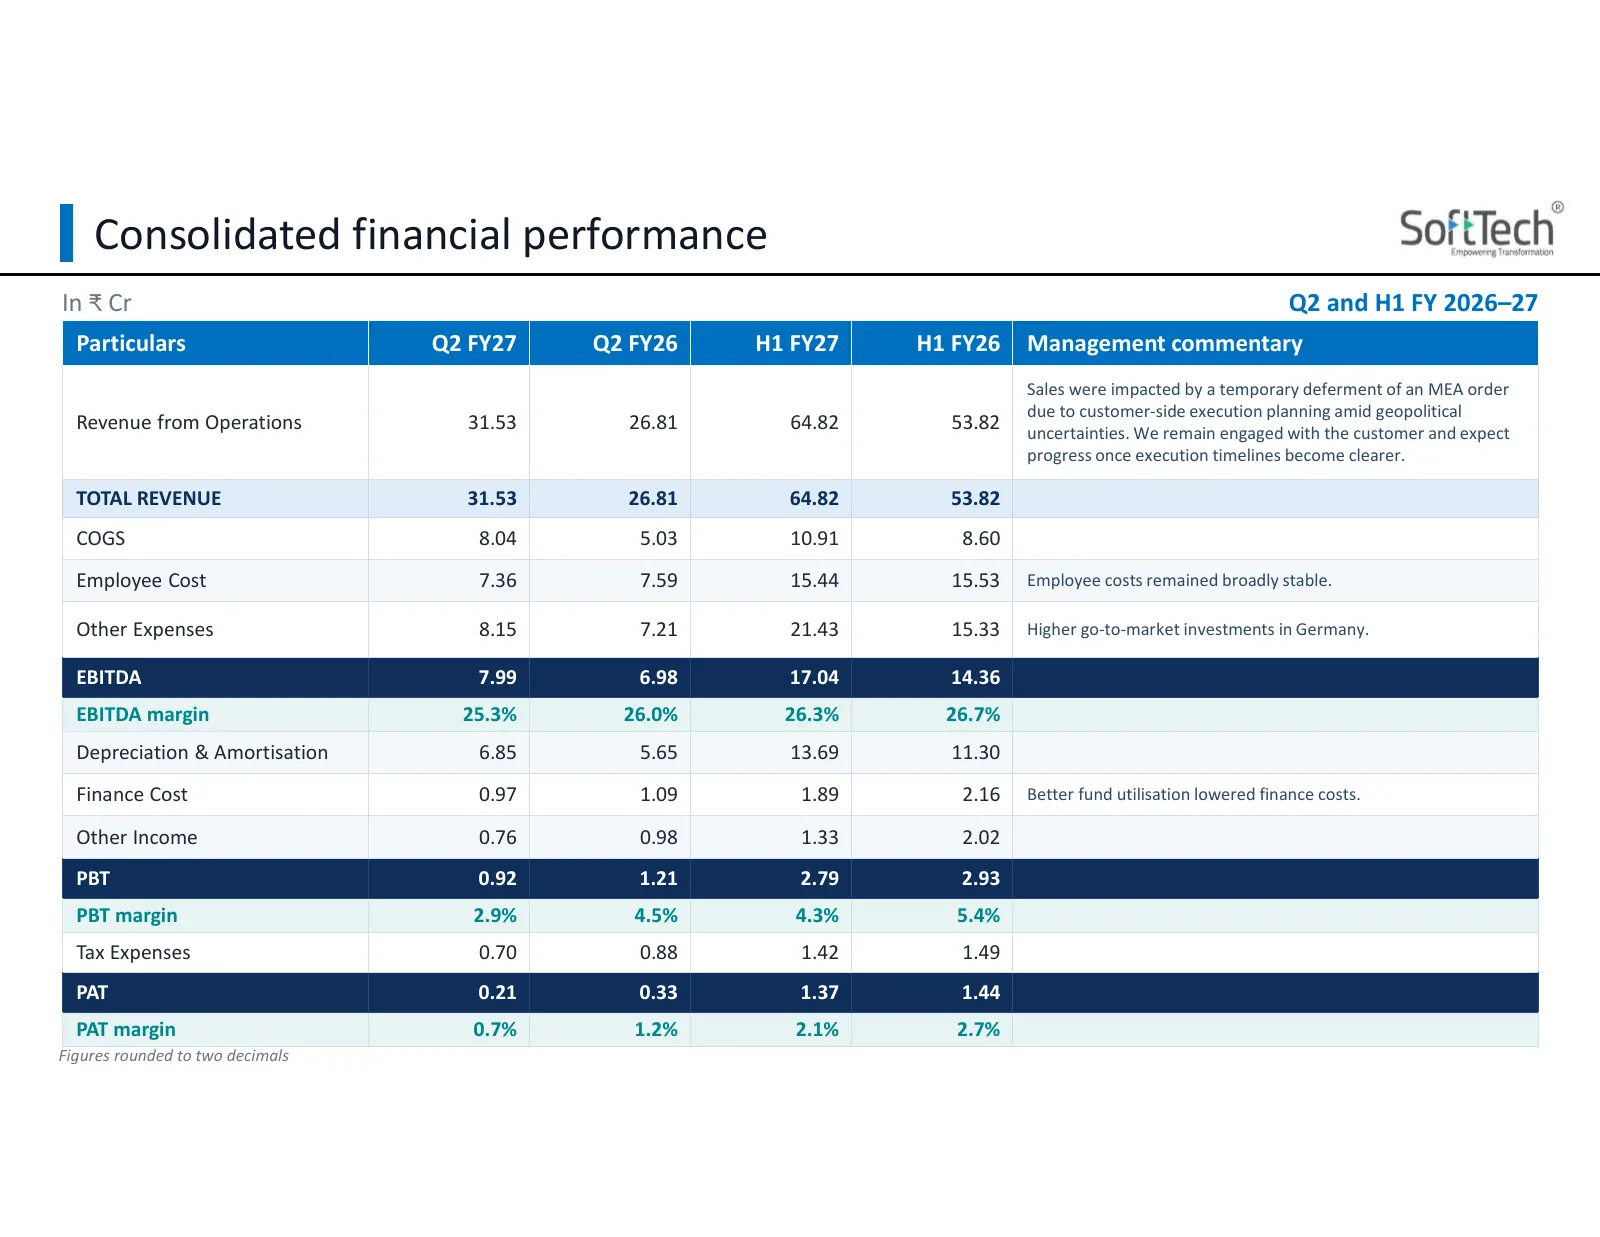
Slide 14: Consolidated financial performance
Consolidated financial performance In ₹ Cr Q2 and H1 FY 2026–27 Particulars Q2 FY27 Q2 FY26 H1 FY27 H1 FY26 Management commentary Sales were impacted by a temporary deferment of an MEA order due to customer-side execution planning amid geopolitical Revenue from Operations 31.53 26.81 64.82 53.82 unc
Slide 15: Growth strategy
Growth strategy Cities, ports & infrastructure, and industrial corridors
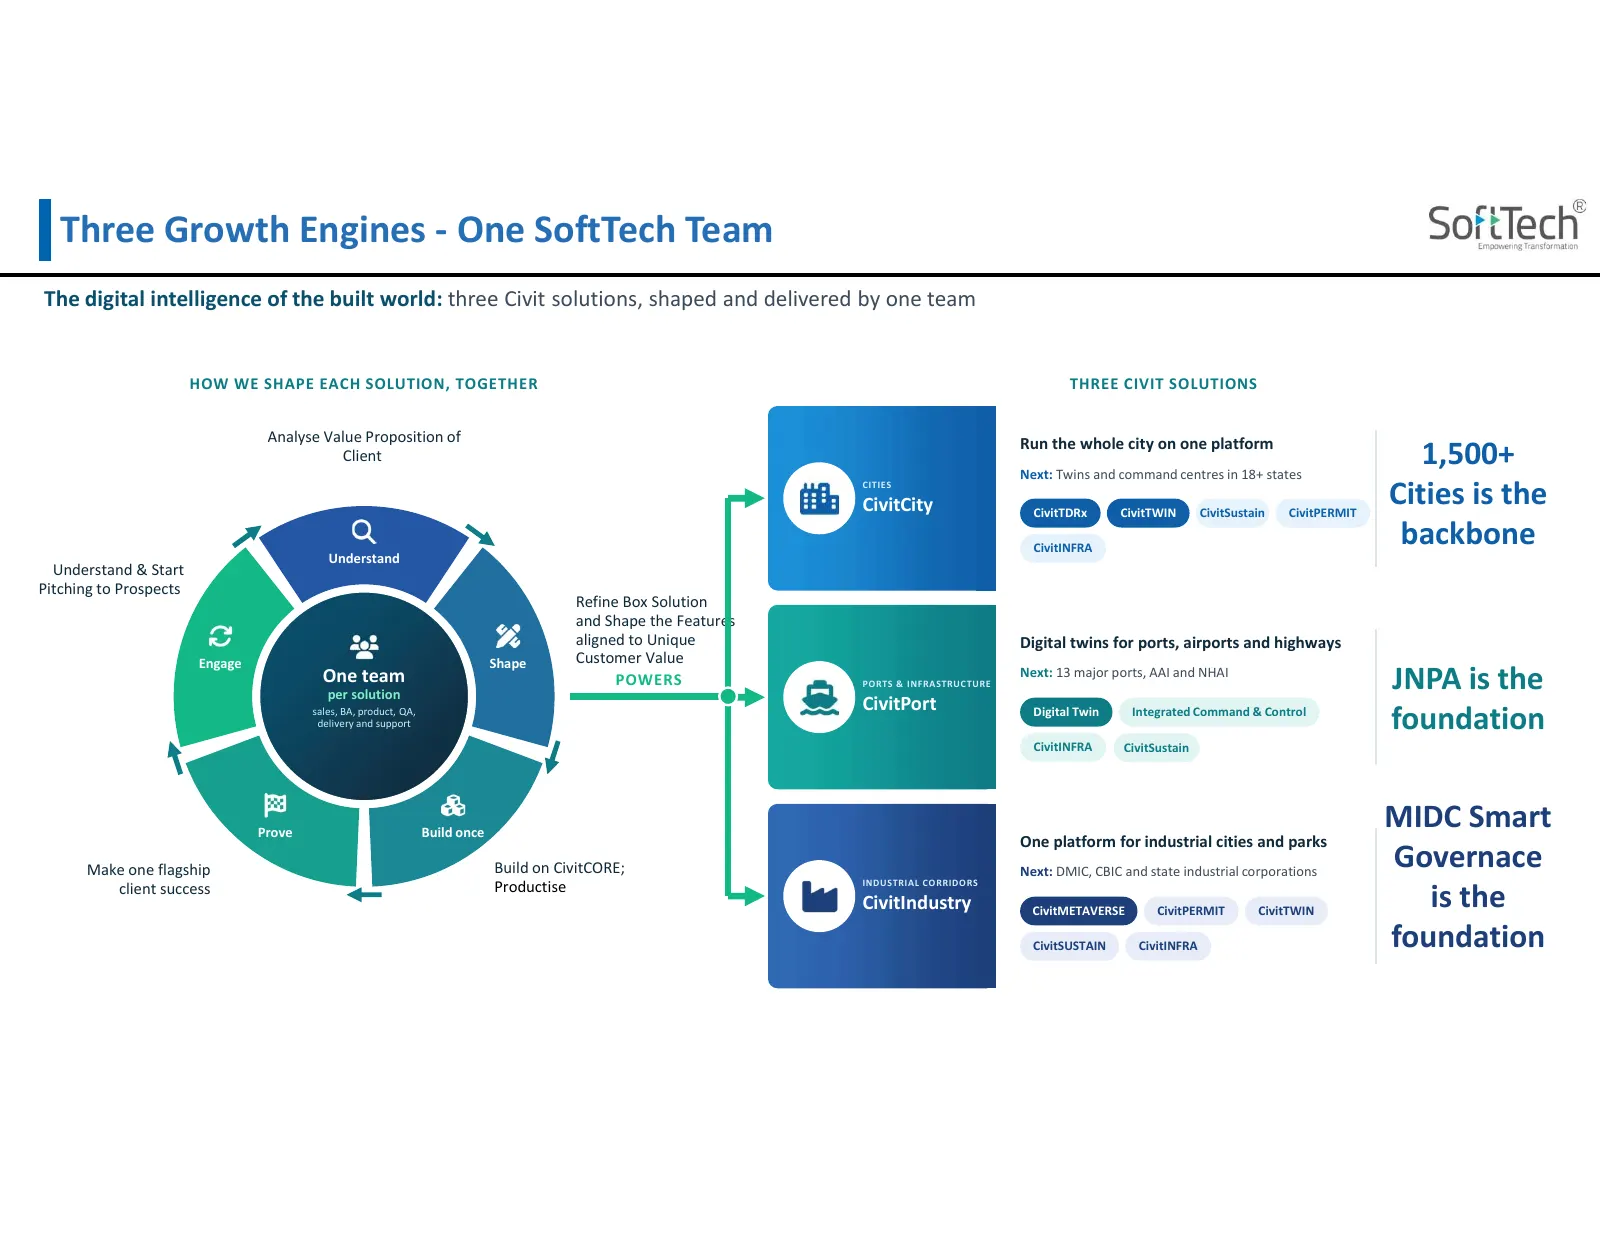
Slide 16: Three Growth Engines - One SoftTech Team
Three Growth Engines - One SoftTech Team The digital intelligence of the built world: three Civit solutions, shaped and delivered by one team HOW WE SHAPE EACH SOLUTION, TOGETHER THREE CIVIT SOLUTIONS Analyse Value Proposition of Run the whole city on one platform Client Next: Twins and command cent
Slide 17: Thank You
Thank You SoftTech Engineers Limited SoftTech Towers, 1 Baner Road, Baner, Pune, Maharashtra 411045, India | +91 020 6718 3711 www.softtechglobal.com Company Contact: Investor Relation Contact: Mr Nihal Gupta Ms Priya Sen Company Secretary Go India Advisors SoftTech Engineers Limited Priya@goindiaad
Source: company website
More decks from SoftTech Engineers Ltd.
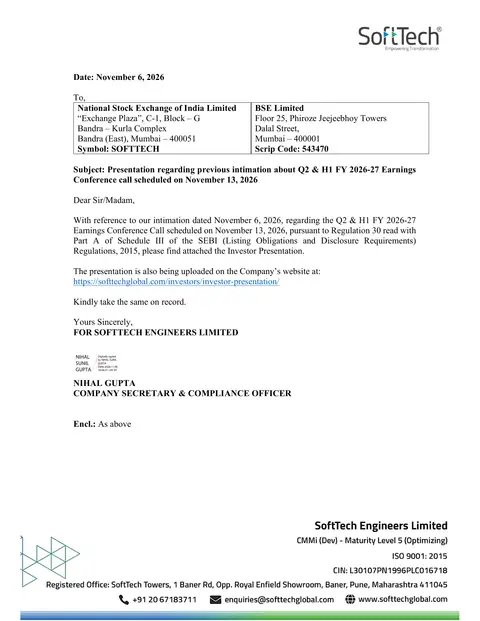 H1 FY2026-27 Earnings Presentation18 slides · Nov 6, 2026
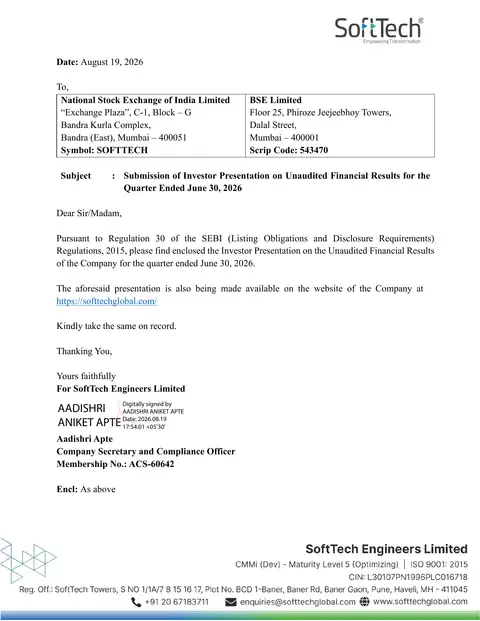 Q1 FY2026-27 Earnings Presentation20 slides · Aug 19, 2026
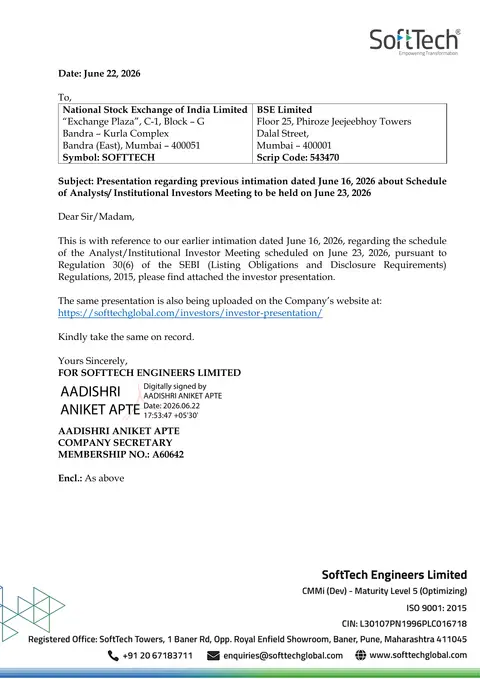 Investor Presentation (June 2026)21 slides · Jun 22, 2026
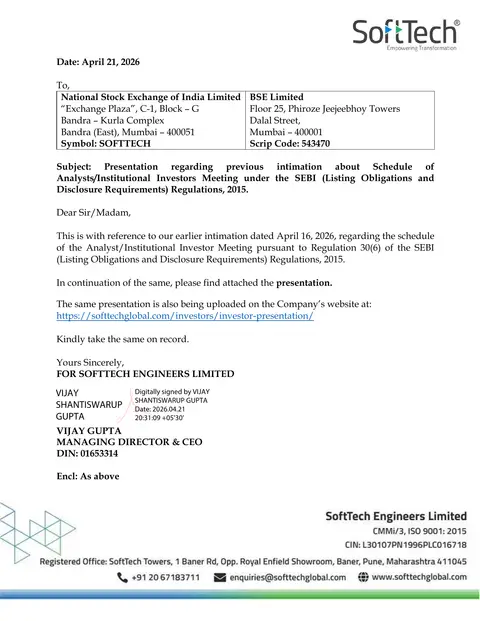 Q3 FY2025-26 Earnings Presentation22 slides · Apr 21, 2026
 Q3 FY2025-26 Earnings Presentation21 slides · Apr 21, 2026
 Q3 FY2025-26 Earnings Presentation18 slides · Feb 16, 2026