M3, Inc. · TSE:2413
M3 — FY2022 Q2 Earnings Presentation
42 slides from M3's earnings presentation, November 2022

Slide 1: M3, Inc. Presentation Material
M3, Inc. Presentation Material November 2022 Copyright © 2022 M3, Inc. All rights reserved. 0
Slide 2: Forward-looking statements disclaimer
The following presentation contains forecasts, future plans, management targets and other forward-looking projections relating to M3, Inc. and/or its group. These statements are drawn from assumptions of future events based on data currently available to us, and there exist possibilities that such a
Slide 3: FY2022 Q2 Consolidated Results
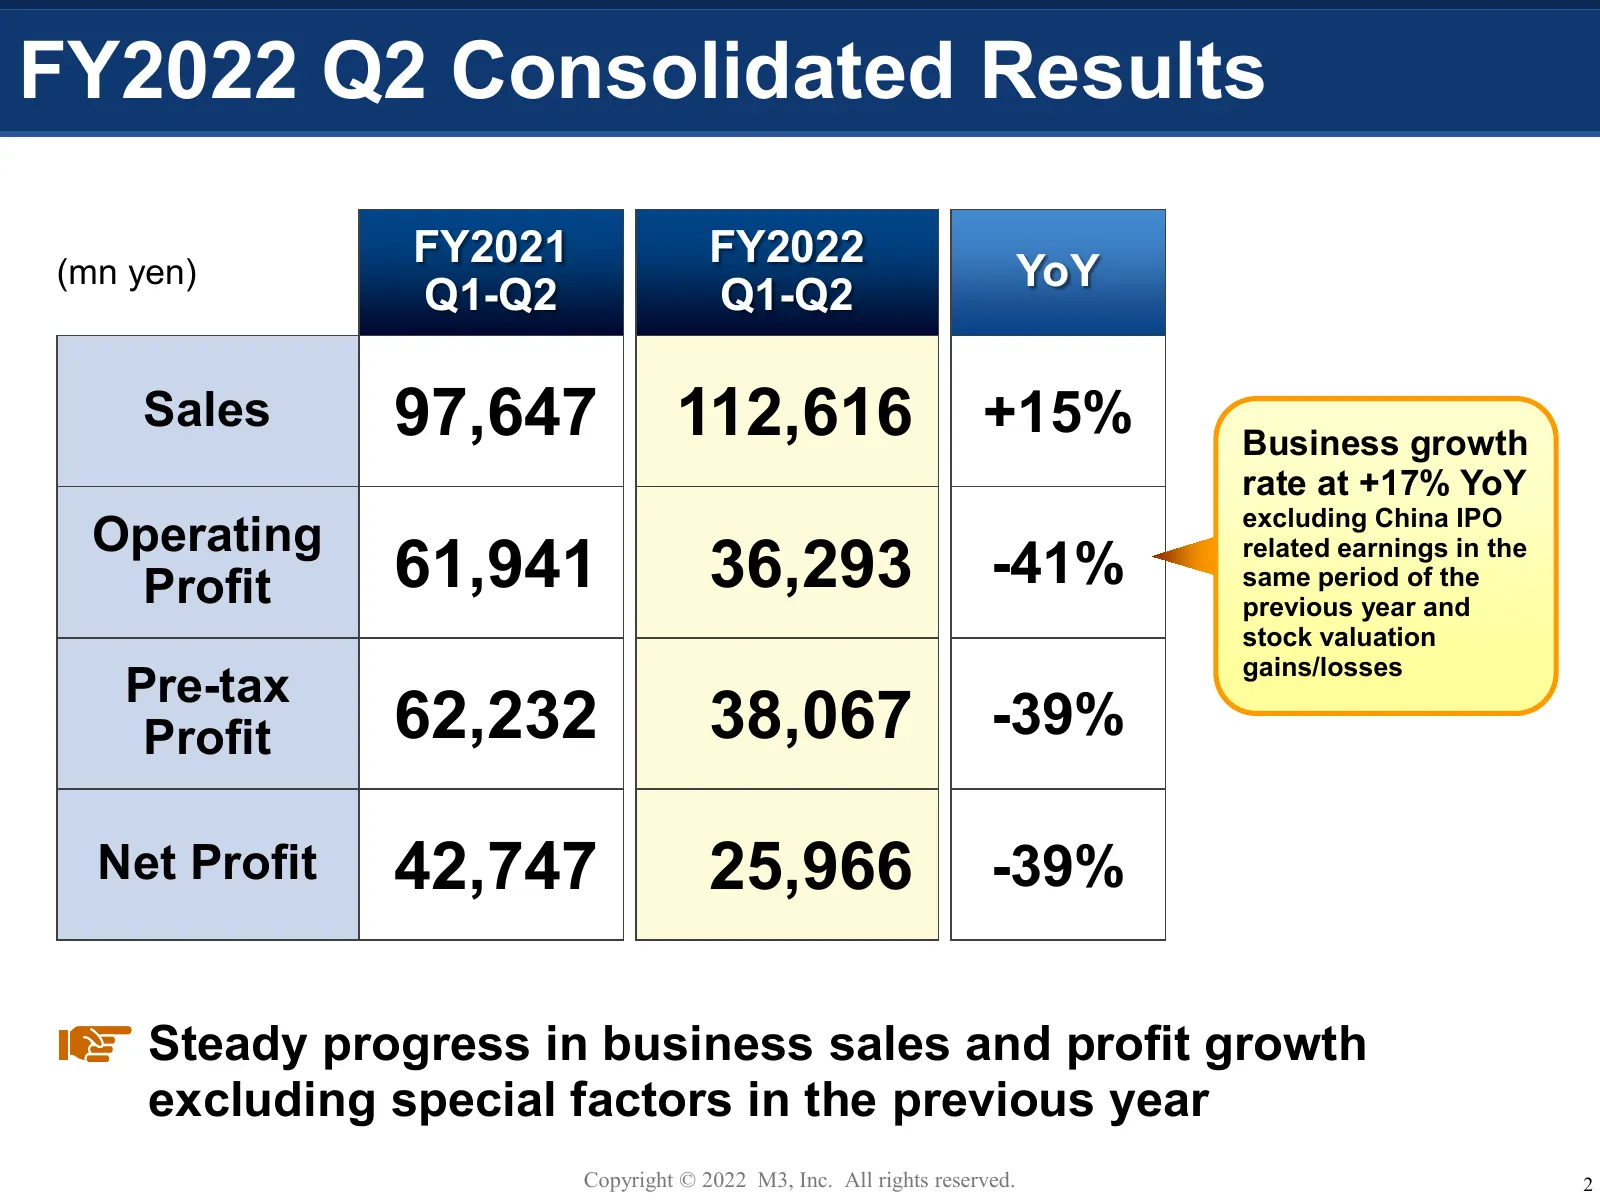
FY2022 Q2 Consolidated Results FY2021 FY2022 (mn yen) YoY Q1-Q2 Q1-Q2 Sales 97,647 112,616 +15% Business growth rate at +17% YoY excluding China IPO Operating Profit 61,941 36,293 -41% related earnings in the same period of the previous year and stock valuation gains/losses Pre-tax Profit 62,232 38,
Slide 4: FY2022 Q2 Consolidated Results by Segment
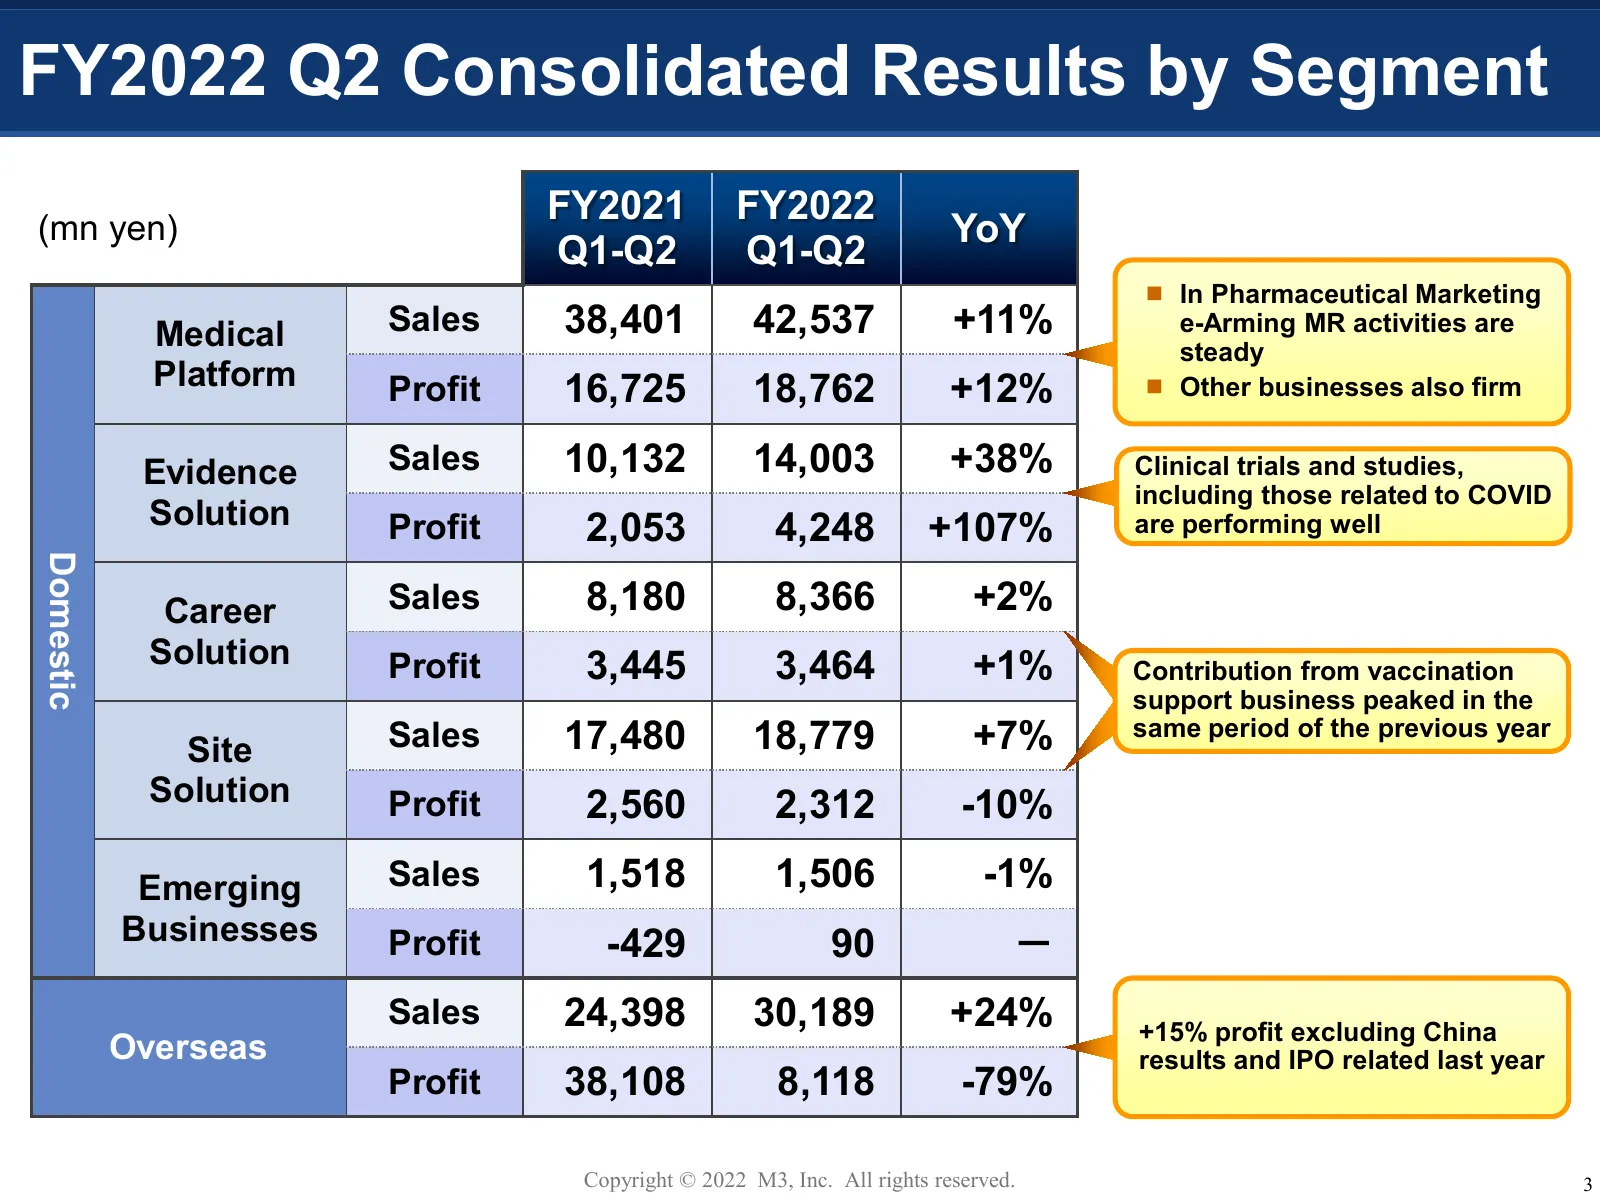
FY2022 Q2 Consolidated Results by Segment FY2021 FY2022 (mn yen) YoY Q1-Q2 Q1-Q2 In Pharmaceutical Marketing Medical Sales 38,401 42,537 +11% e-Arming MR activities are steady Platform Profit 16,725 18,762 +12% Other businesses also firm Evidence Sales 10,132 14,003 +38% Clinical trials and stud
Slide 5: M3's Triple Growth Engine + CSV
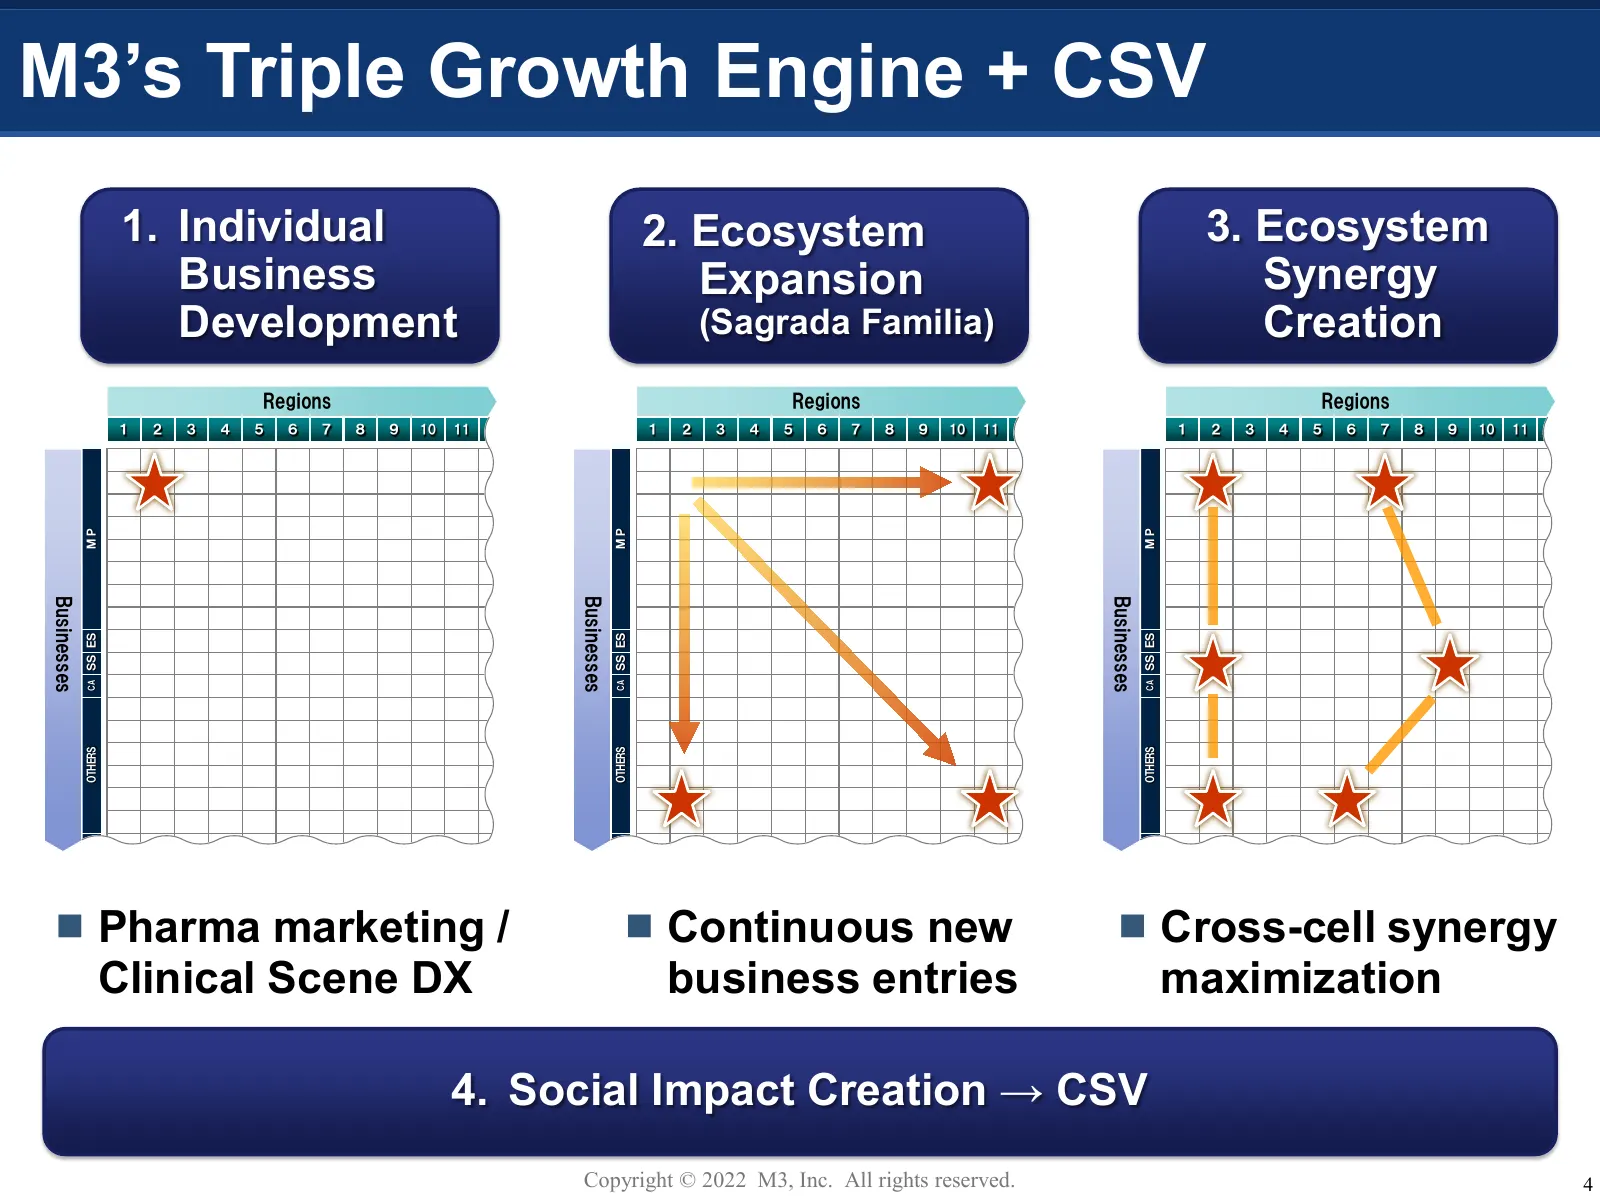
M3’s Triple Growth Engine + CSV 1. Individual 2. Ecosystem 3. Ecosystem Business Expansion Synergy Development (Sagrada Familia) Creation Regions Regions Regions 1 2 3 4 5 6 7 8 9 10 11 1 2 3 4 5 6 7 8 9 10 11 1 2 3 4 5 6 7 8 9 10 11 MP MP MP Businesses Businesses Businesses SS ES SS ES SS ES CA CA
Slide 6: Growth Engine 1: Individual Business Development
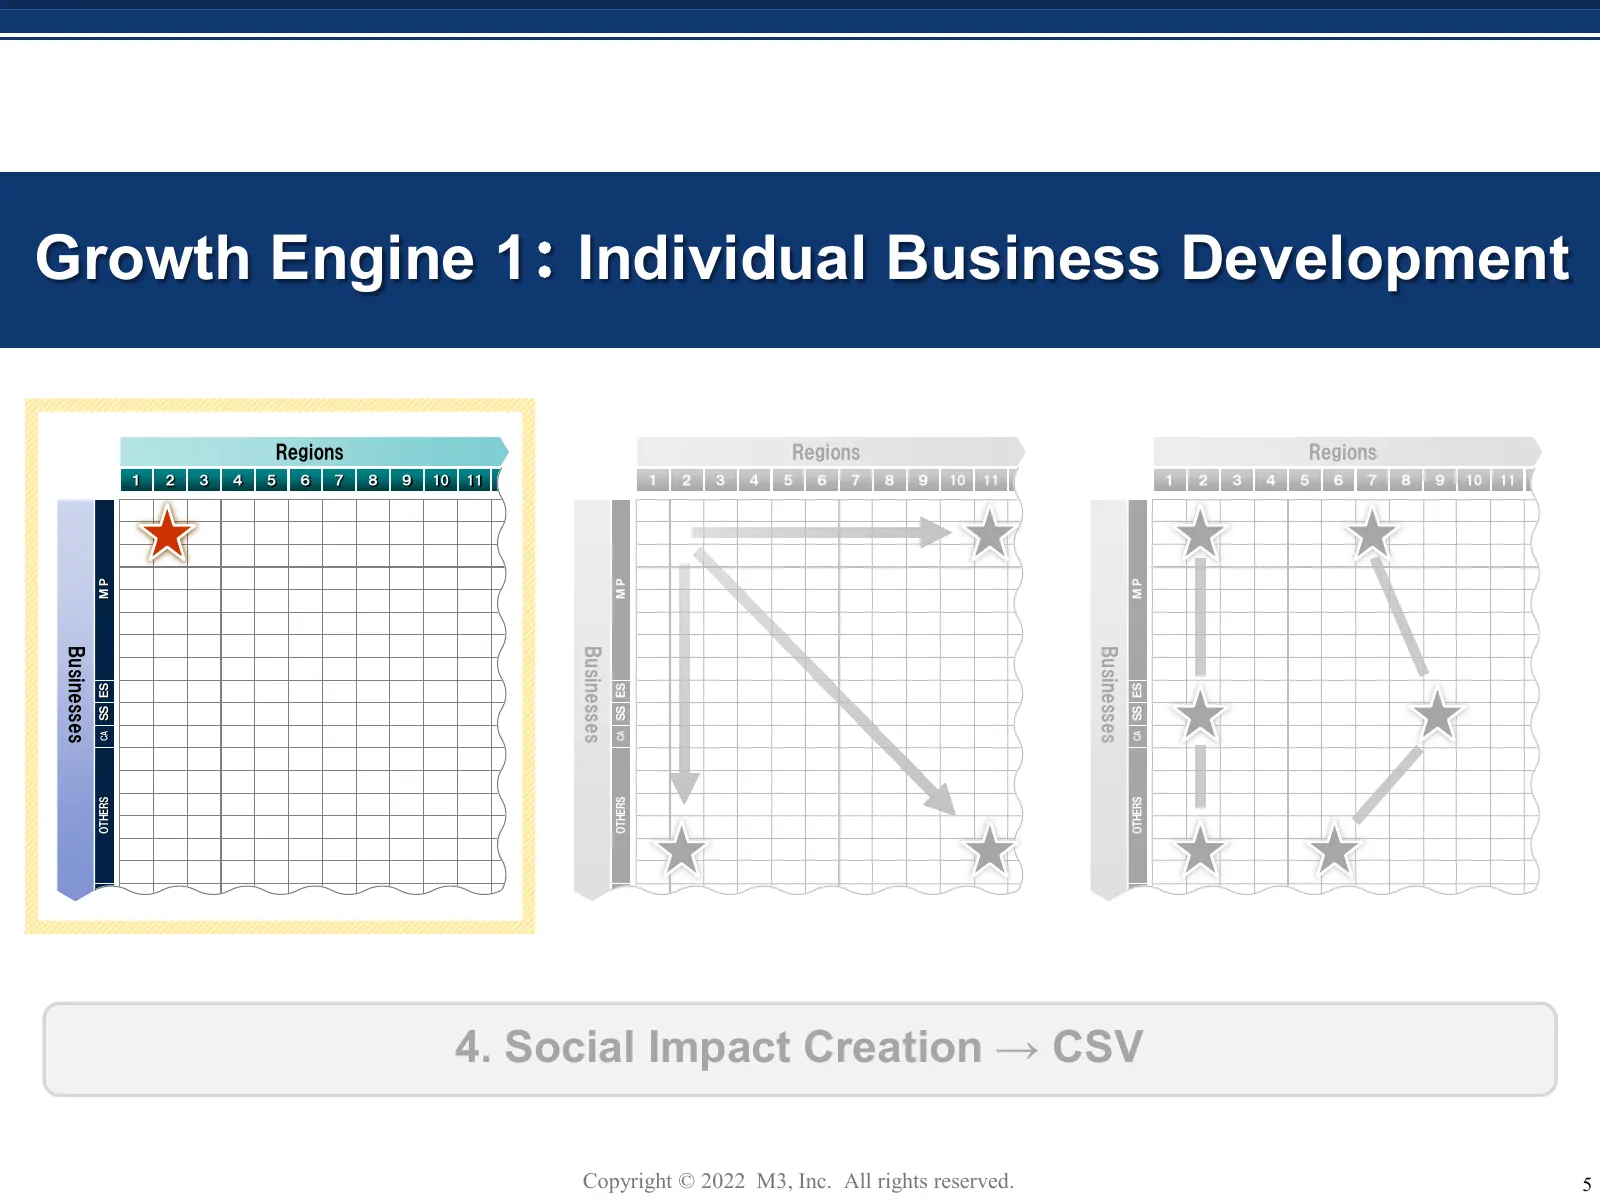
Growth Engine 1: Individual Business Development Regions Regions Regions 1 2 3 4 5 6 7 8 9 10 11 1 2 3 4 5 6 7 8 9 10 11 1 2 3 4 5 6 7 8 9 10 11 MP MP MP Businesses Businesses Businesses SS ES SS ES SS ES CA CA CA OTHERS OTHERS OTHERS 4. Social Impact Creation → CSV Copyright © 2022 M3, Inc. All rig
Slide 7: FY2022 Q2 Overview
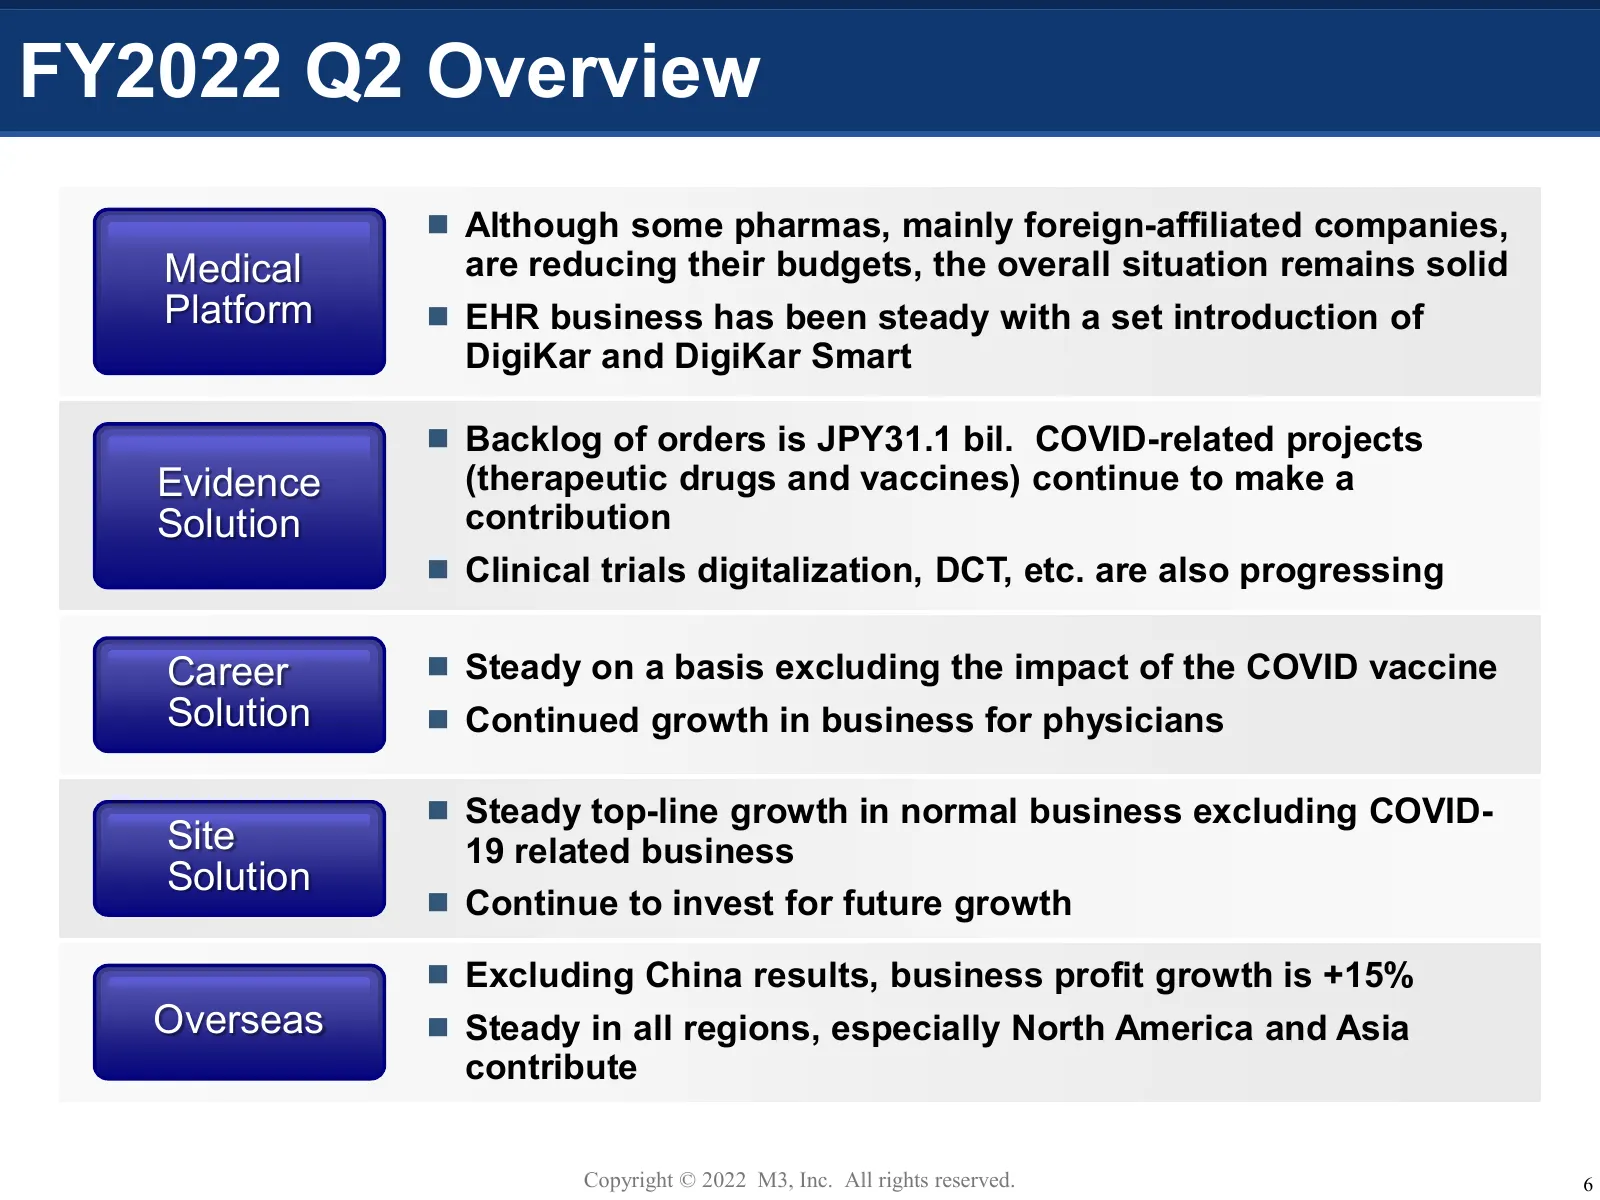
FY2022 Q2 Overview Although some pharmas, mainly foreign-affiliated companies, Medical are reducing their budgets, the overall situation remains solid Platform EHR business has been steady with a set introduction of DigiKar and DigiKar Smart Backlog of orders is JPY31.1 bil. COVID-related proj
Slide 8: Pharmaceutical Sales & Marketing DX
Pharmaceutical Sales & Marketing DX Copyright © 2022 M3, Inc. All rights reserved. 7
Slide 9: Pharma Marketing Cost and TAM for M3
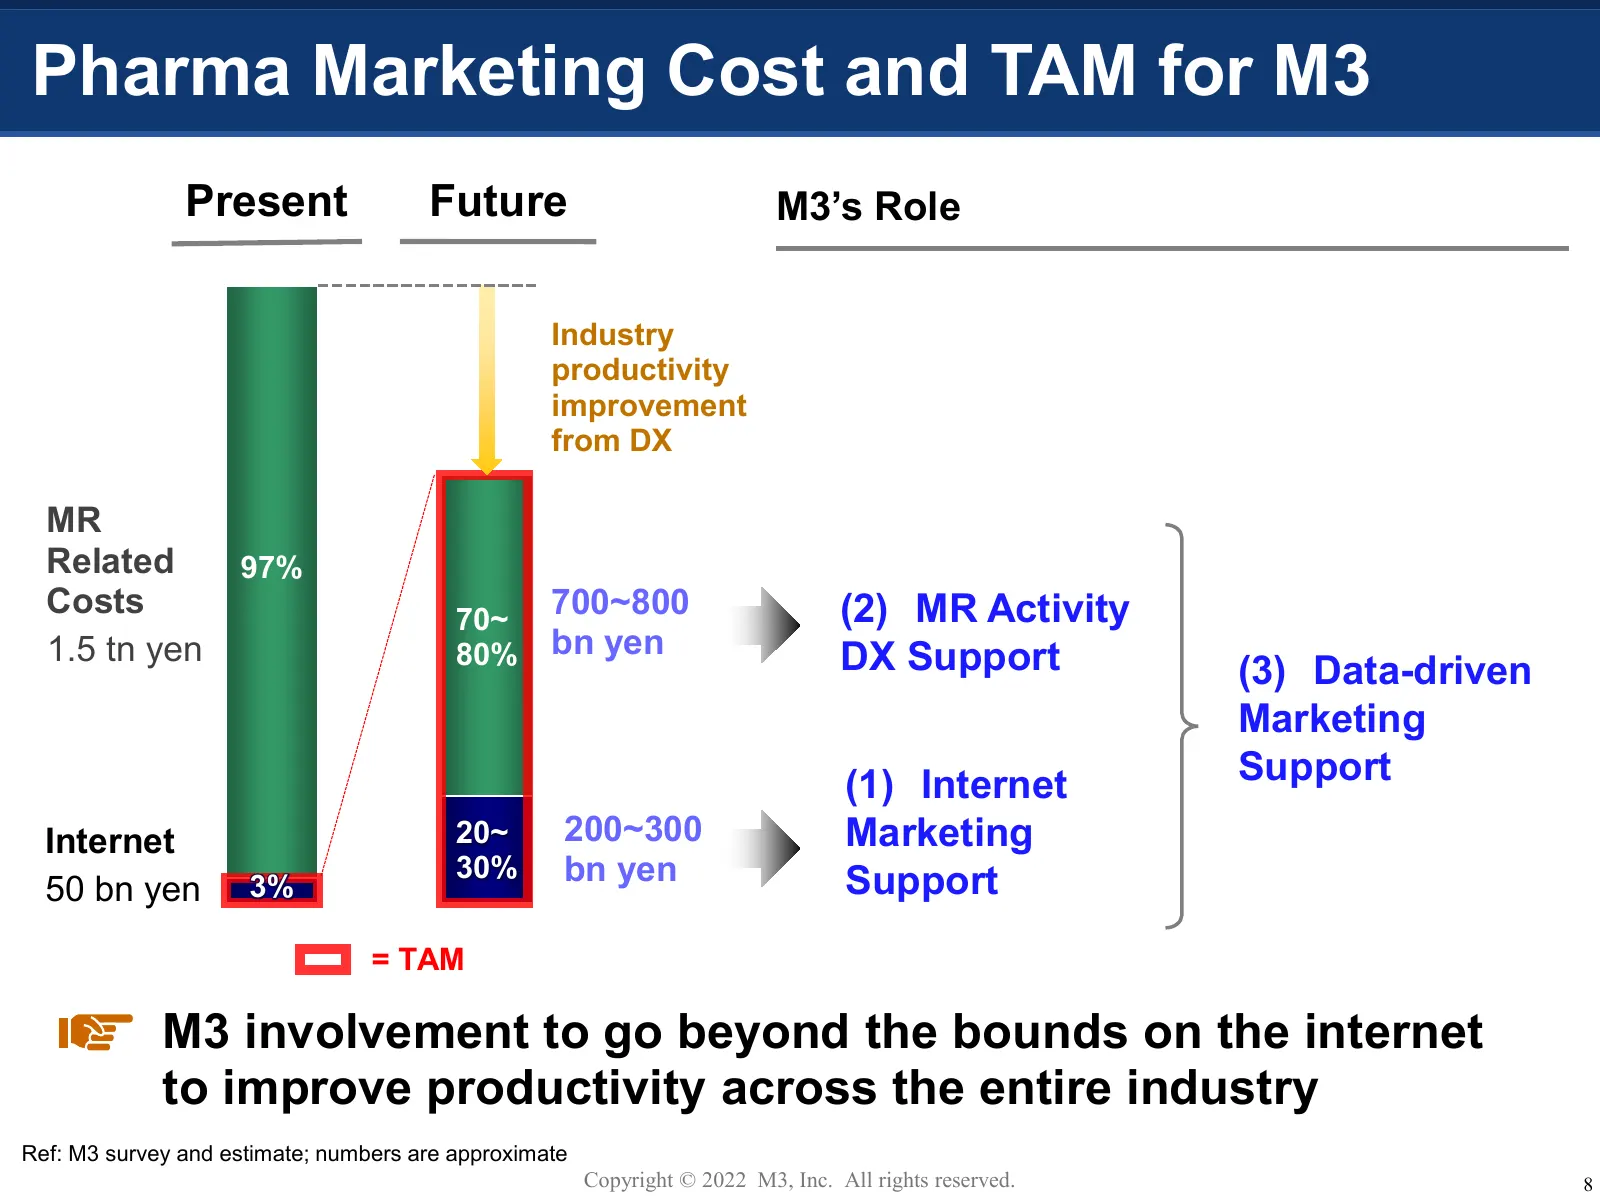
Pharma Marketing Cost and TAM for M3 Present Future M3’s Role Industry productivity improvement from DX MR Related 97% Costs 70~ 700~800 (2) MR Activity 1.5 tn yen 80% bn yen DX Support (3) Data-driven Marketing (1) Internet Support Internet 20~ 200~300 Marketing 30% bn yen Support 50 bn yen 3% = TA
Slide 10: Trend of Domestic Pharmaceutical Sales Reps (MRs)
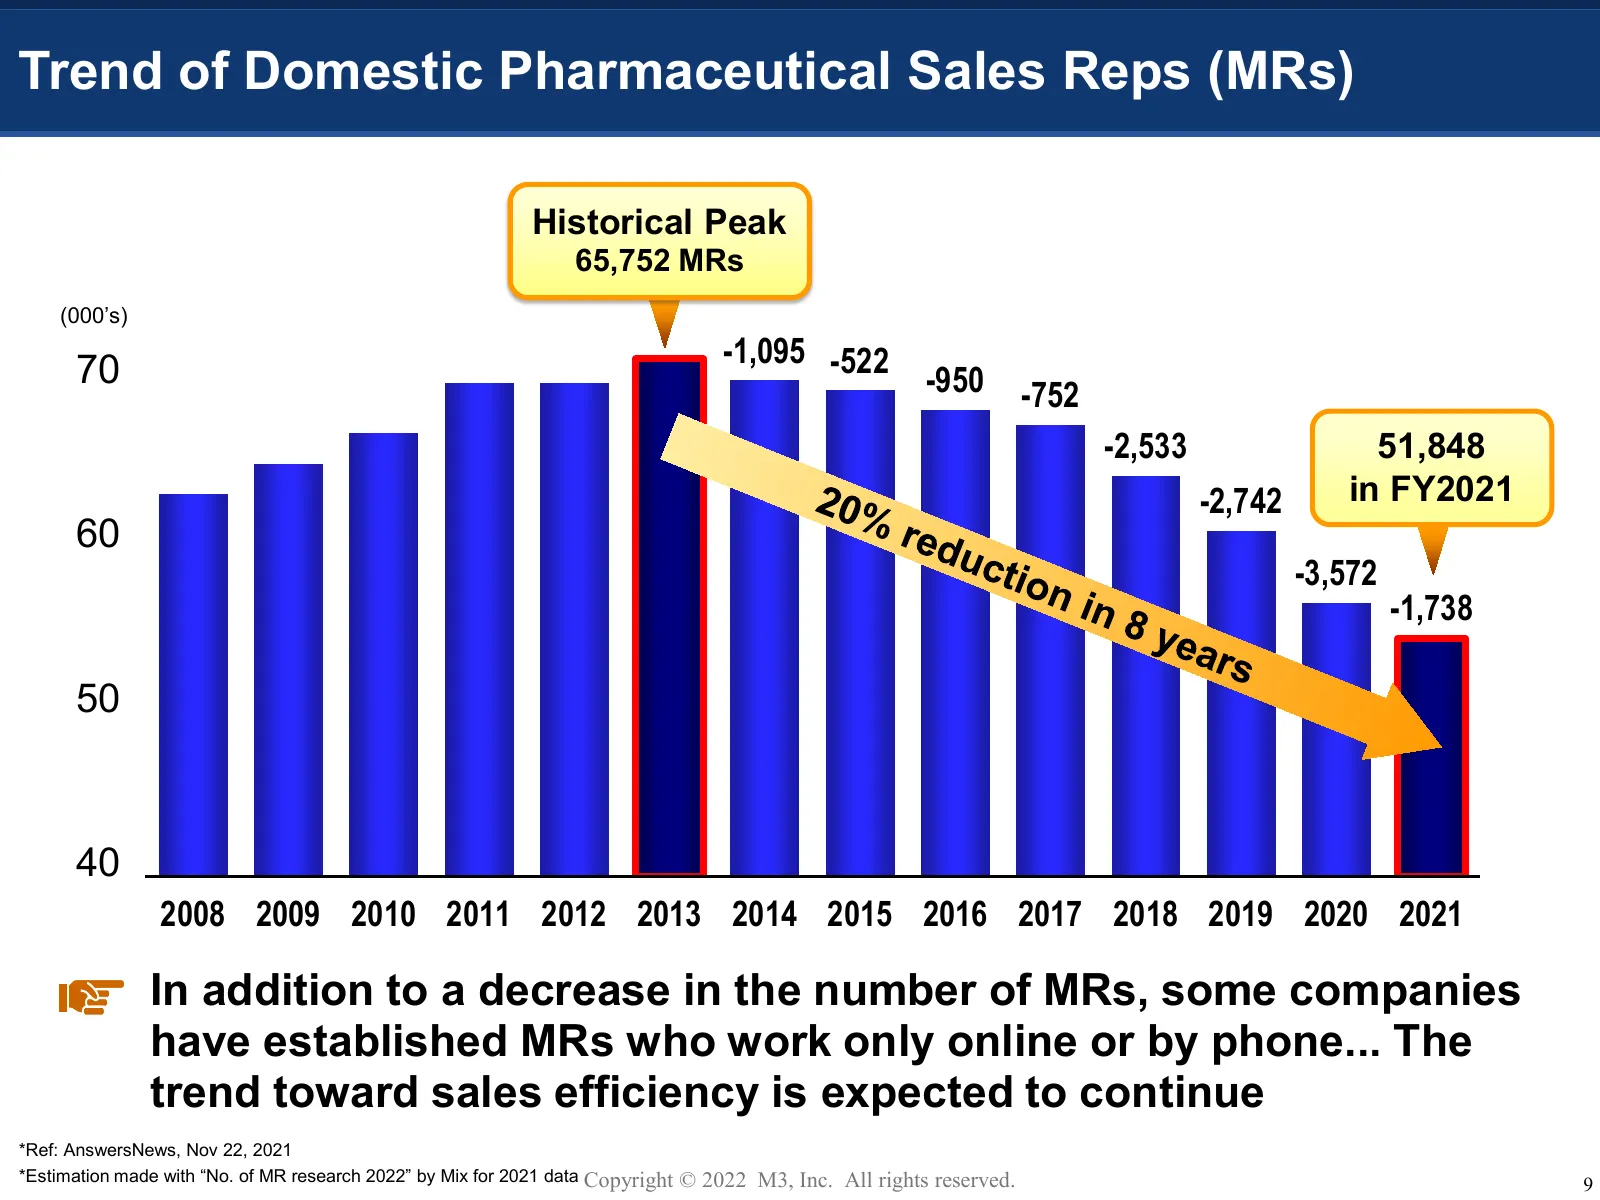
Trend of Domestic Pharmaceutical Sales Reps (MRs) Historical Peak 65,752 MRs (000’s) -1,095 -522 70 -950 -752 -2,533 51,848 -2,742 in FY2021 60 -3,572 -1,738 50 40 2008 2009 2010 2011 2012 2013 2014 2015 2016 2017 2018 2019 2020 2021 In addition to a decrease in the number of MRs, some companies hav
Slide 11: Professional Staff Fortification Plan
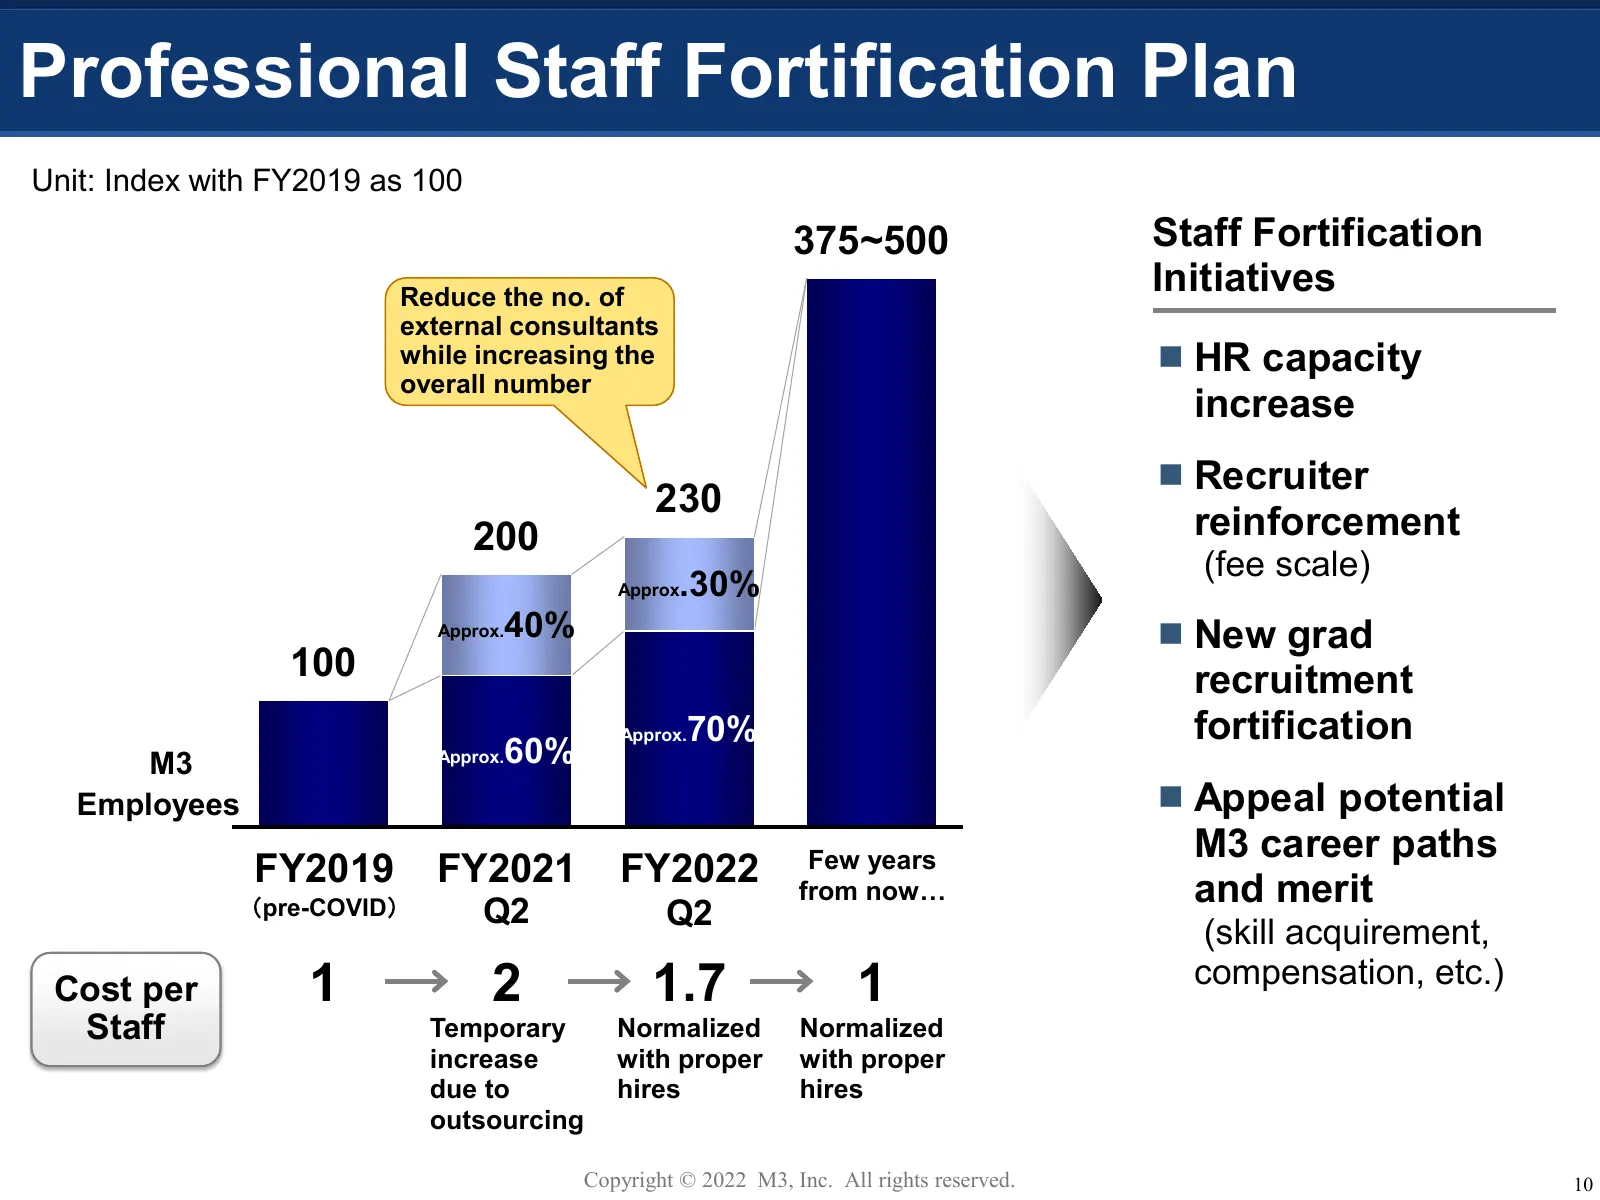
Professional Staff Fortification Plan Unit: Index with FY2019 as 100 375~500 Staff Fortification Reduce the no. of Initiatives external consultants while increasing the HR capacity overall number increase Recruiter 230 200 reinforcement (fee scale) Approx .30% Approx. 40% New grad 100 recruitm
Slide 12: Capacity Improvement of Professional M3 Staff
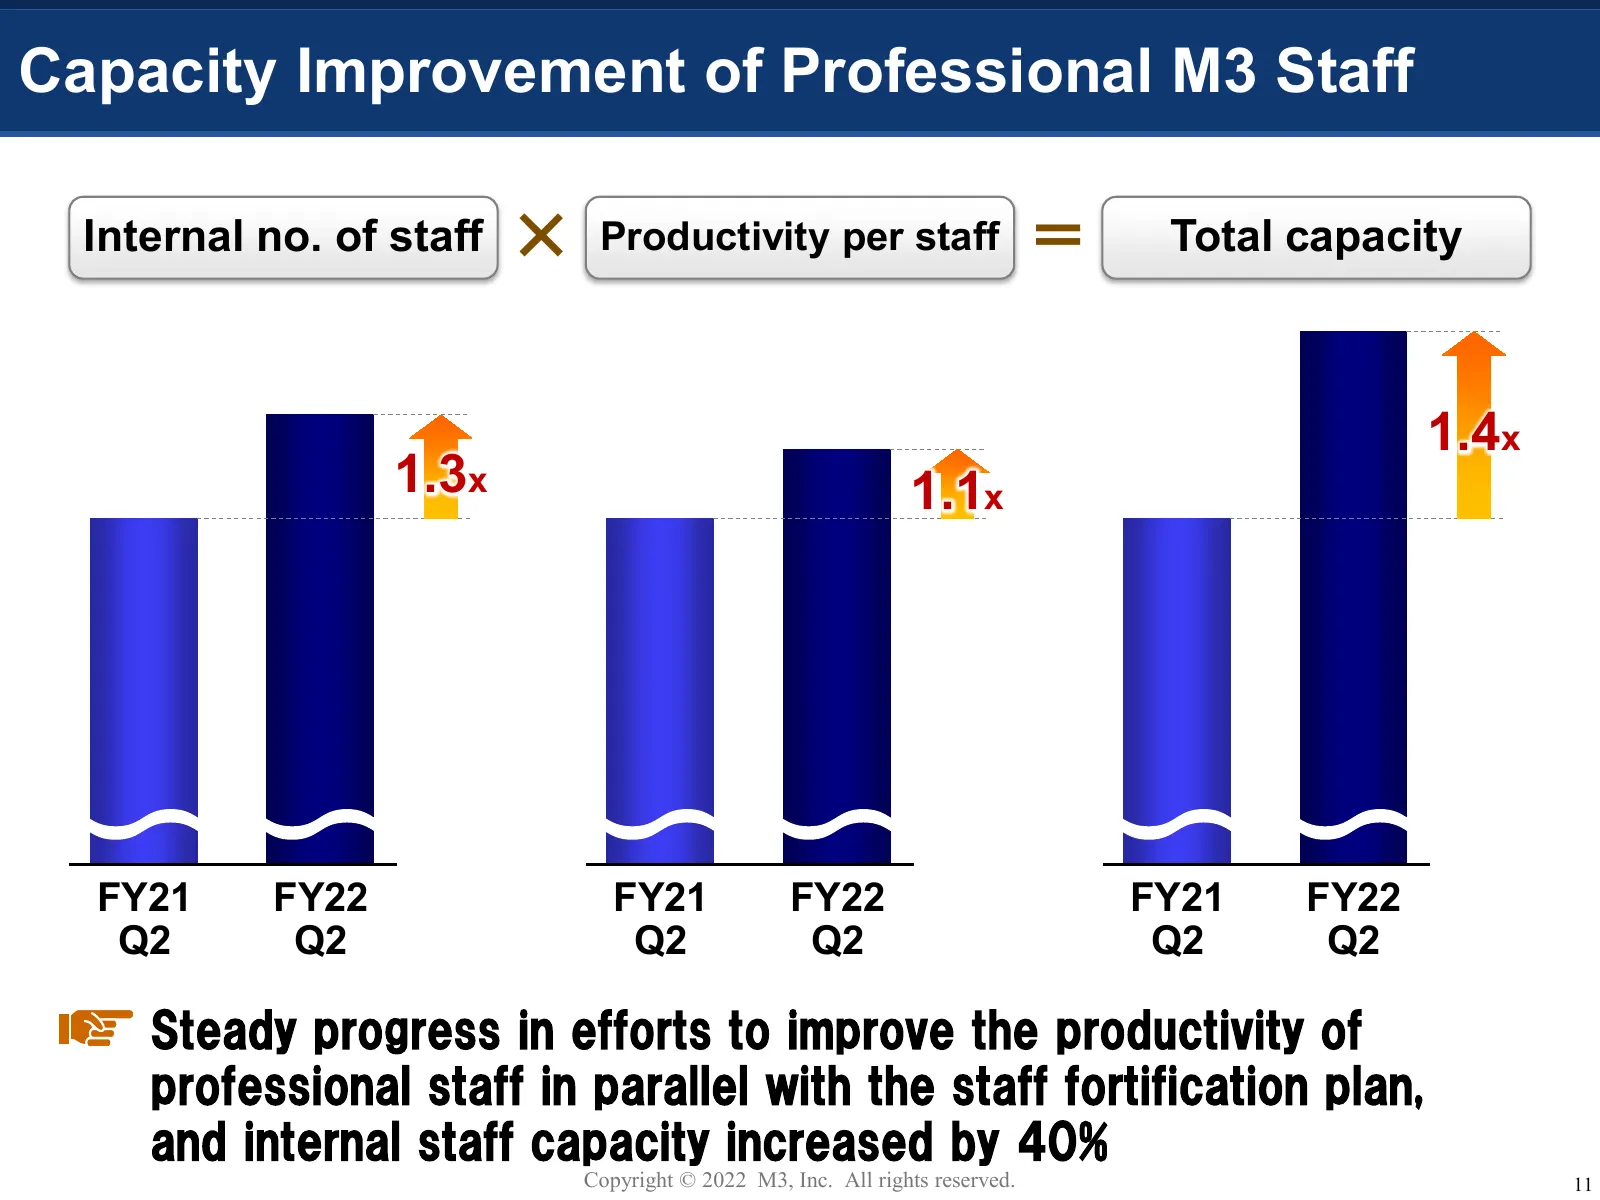
Capacity Improvement of Professional M3 Staff Internal no. of staff × Productivity per staff = Total capacity 1.4x 1.3x 1.1x FY21 FY22 FY21 FY22 FY21 FY22 Q2 Q2 Q2 Q2 Q2 Q2 Steady progress in efforts to improve the productivity of professional staff in parallel with the staff fortification plan, and
Slide 13: Hiring Progress of M3 Professionals
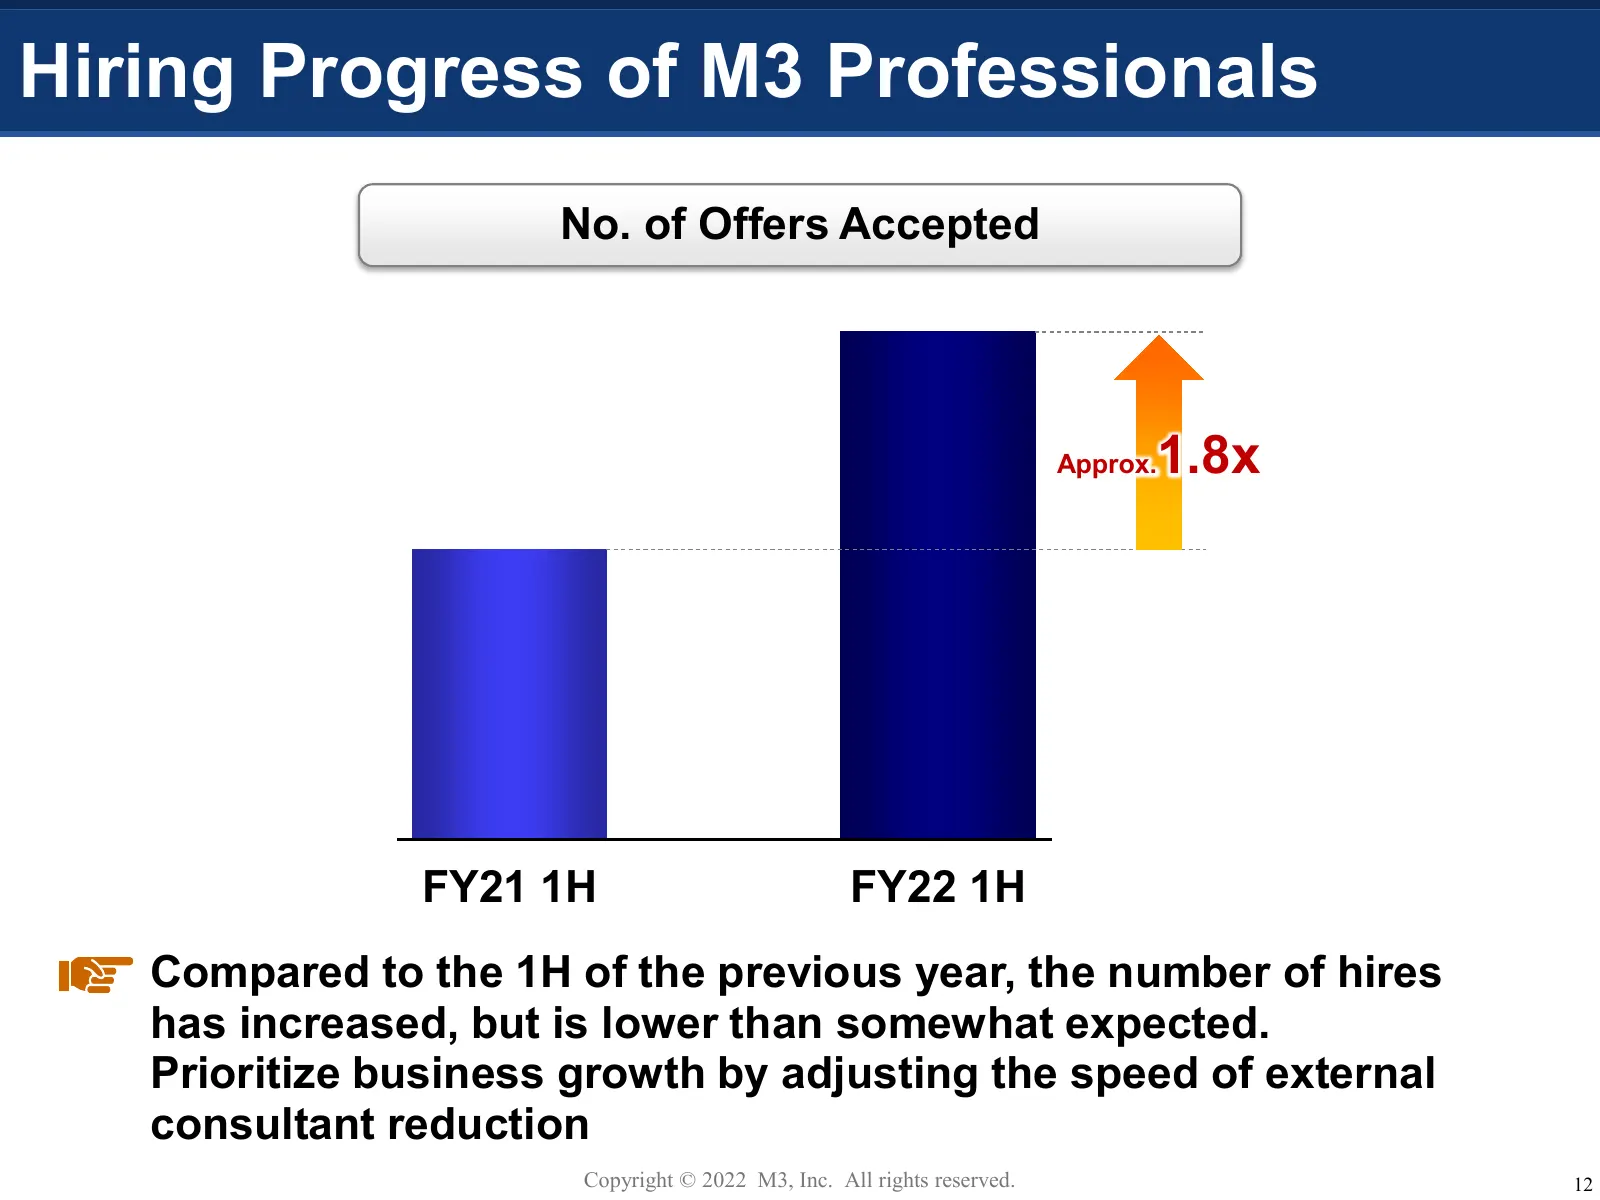
Hiring Progress of M3 Professionals No. of Offers Accepted Approx. 1.8x FY21 1H FY22 1H Compared to the 1H of the previous year, the number of hires has increased, but is lower than somewhat expected. Prioritize business growth by adjusting the speed of external consultant reduction Copyright © 2022
Slide 14: DX of the Clinical Scene
DX of the Clinical Scene Copyright © 2022 M3, Inc. All rights reserved. 13
Slide 15: Potential in DX of Clinics
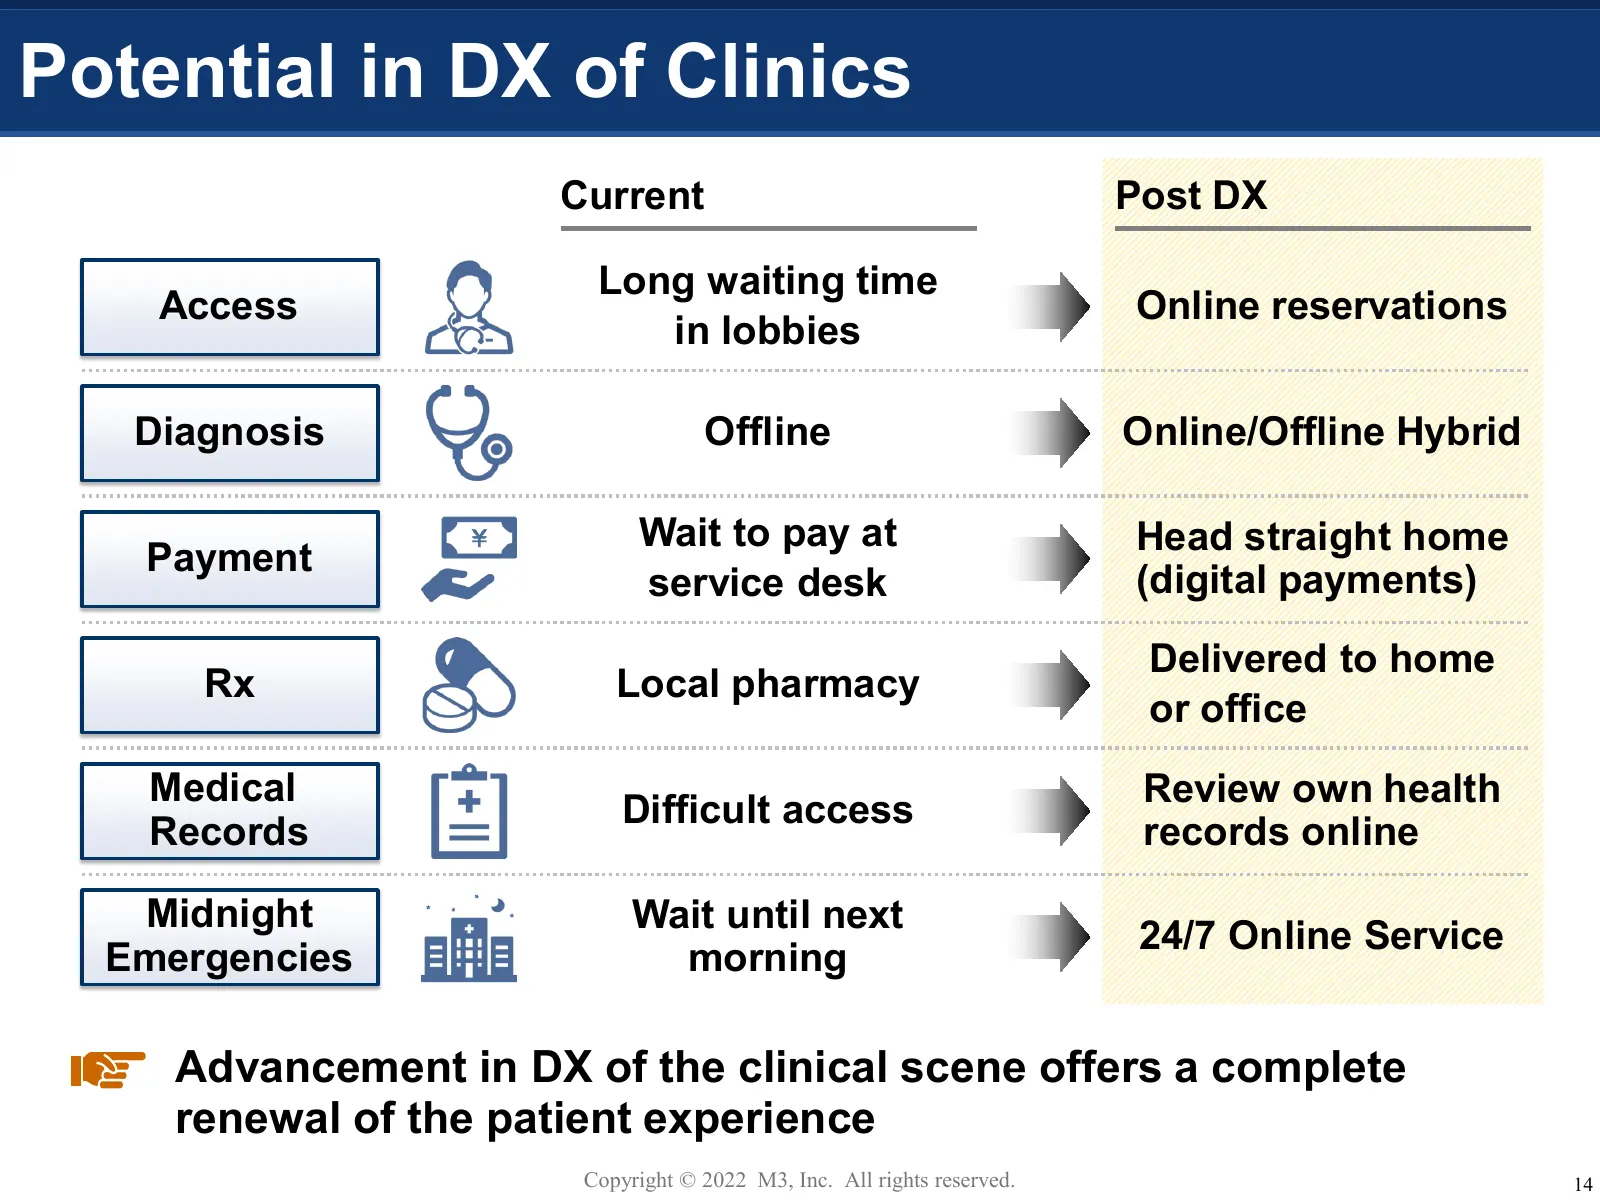
Potential in DX of Clinics Current Post DX Long waiting time Access Online reservations in lobbies Diagnosis Offline Online/Offline Hybrid Wait to pay at Head straight home Payment service desk (digital payments) Delivered to home Rx Local pharmacy or office Medical Review own health Difficult acces
Slide 16: M3 DigiKar EHR Growth
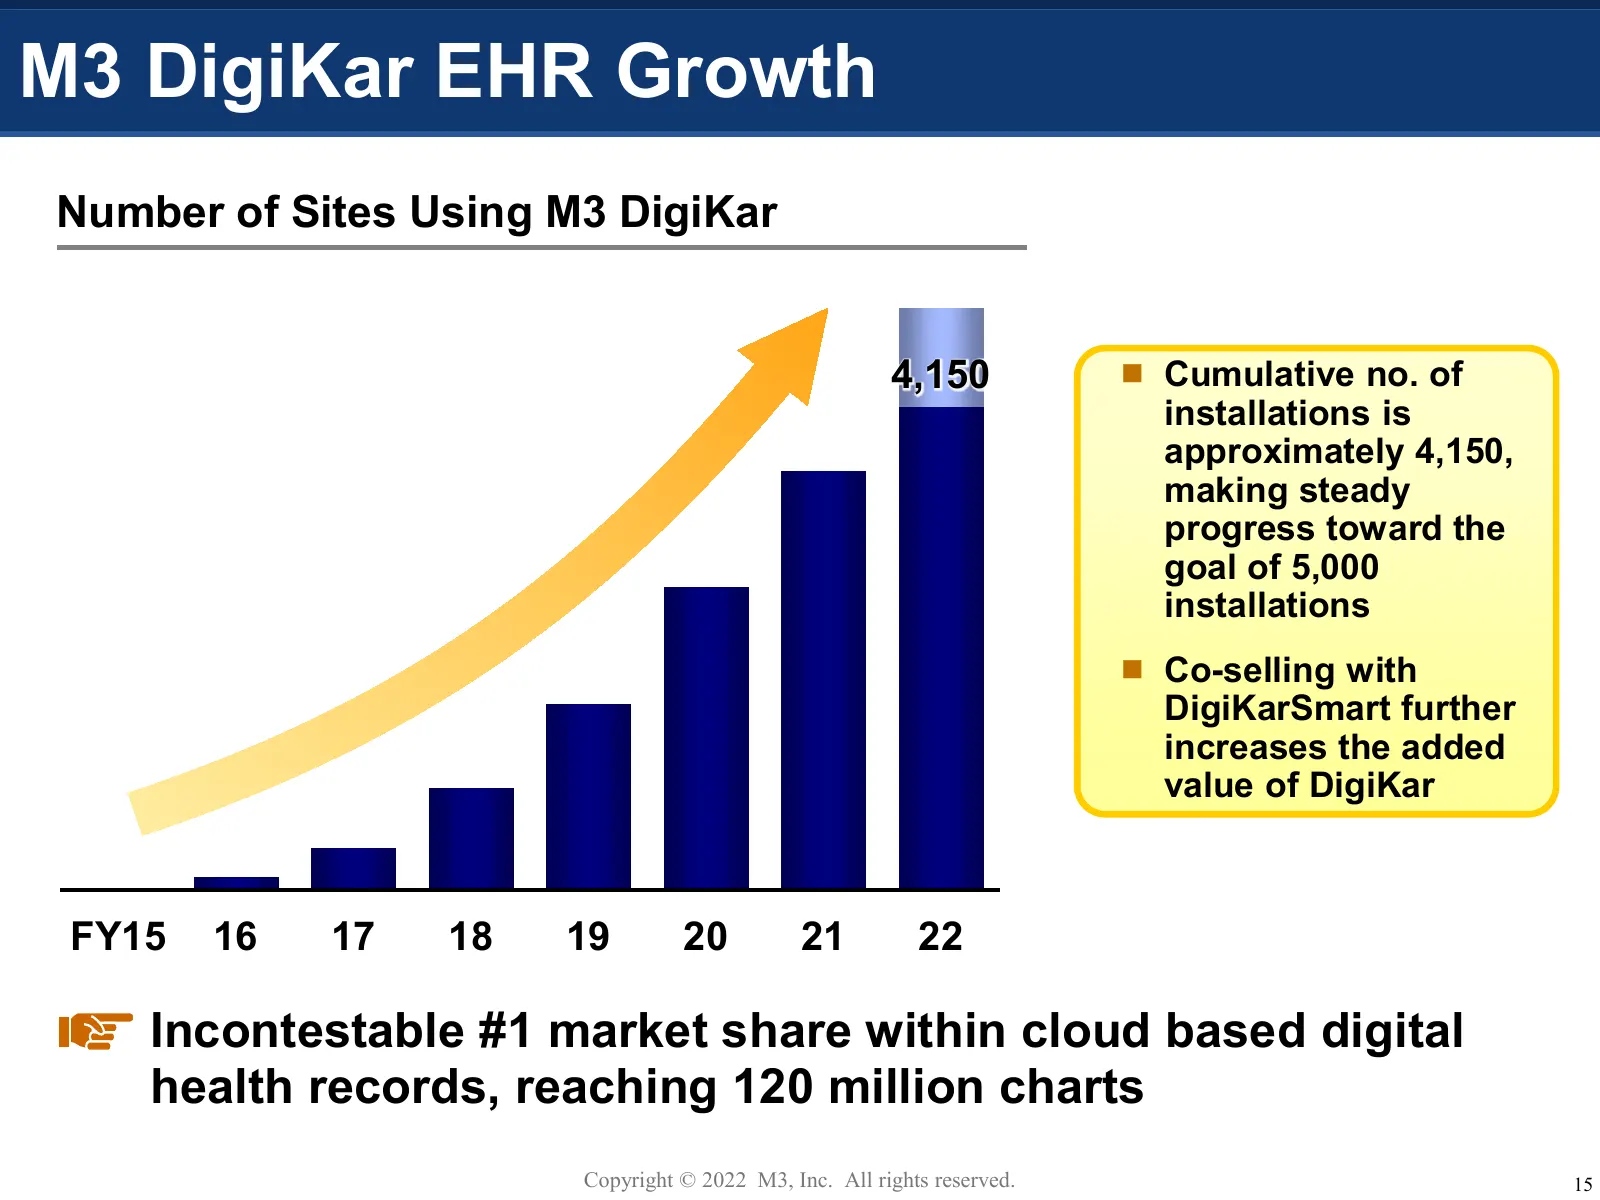
M3 DigiKar EHR Growth Number of Sites Using M3 DigiKar 4,150 Cumulative no. of installations is approximately 4,150, making steady progress toward the goal of 5,000 installations Co-selling with DigiKarSmart further increases the added value of DigiKar FY15 16 17 18 19 20 21 22 Incontestable #1
Slide 17: Development of DigiKar Smart
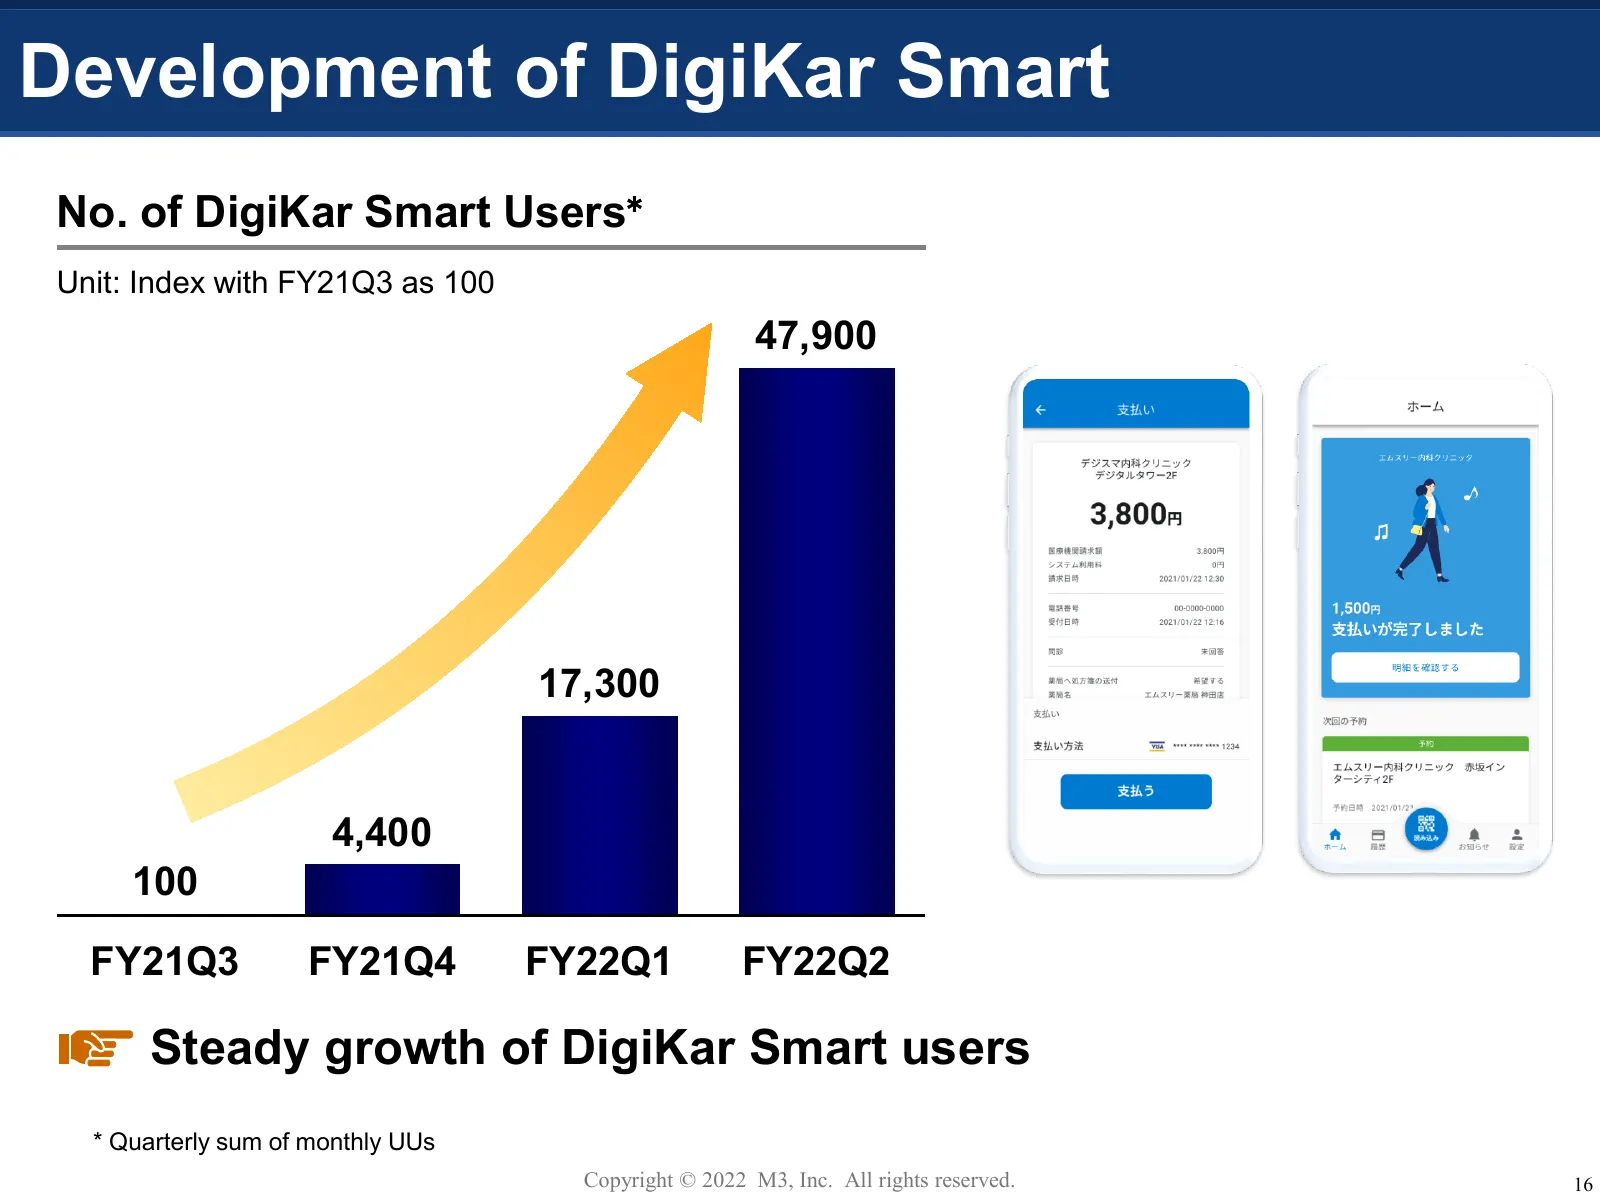
Development of DigiKar Smart No. of DigiKar Smart Users* Unit: Index with FY21Q3 as 100 47,900 17,300 4,400 100 FY21Q3 FY21Q4 FY22Q1 FY22Q2 Steady growth of DigiKar Smart users * Quarterly sum of monthly UUs Copyright © 2022 M3, Inc. All rights reserved. 16
Slide 18: Overseas
Overseas Copyright © 2022 M3, Inc. All rights reserved. 17
Slide 19: Number of Doctor Members and Panelists (Global)
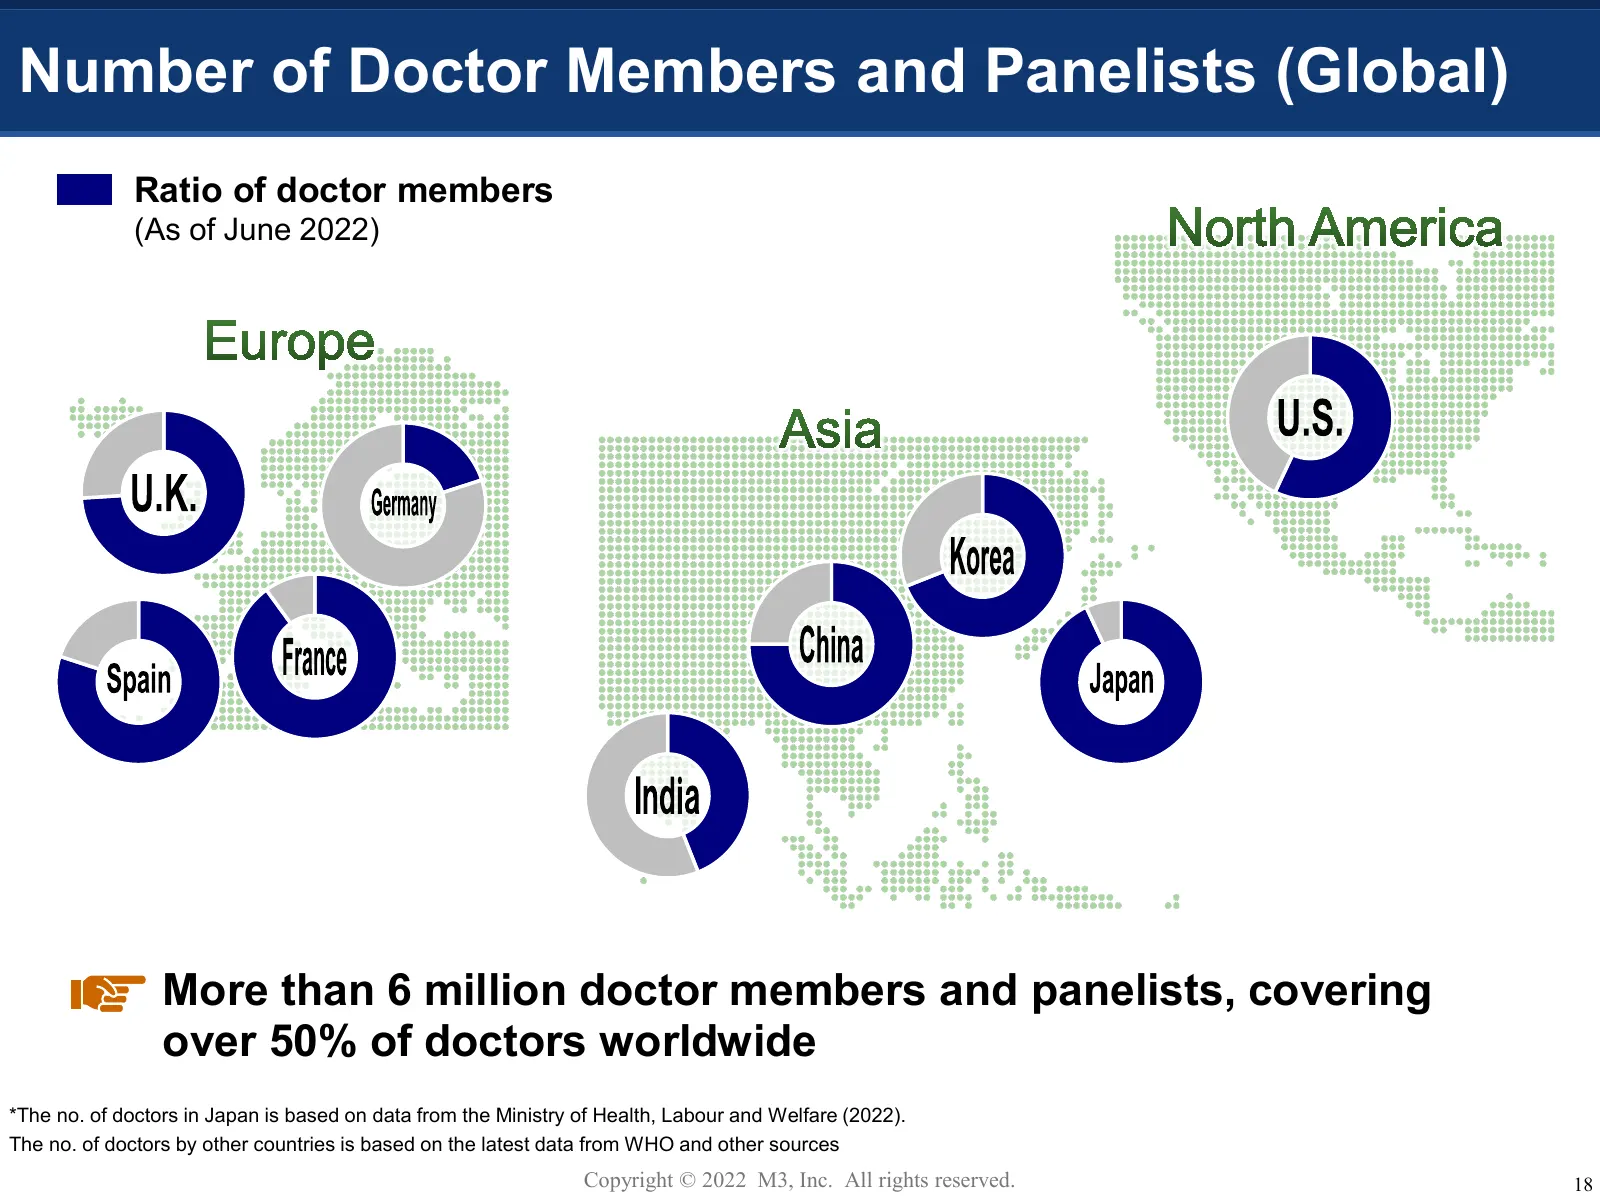
Number of Doctor Members and Panelists (Global) Ratio of doctor members (As of June 2022) More than 6 million doctor members and panelists, covering over 50% of doctors worldwide *The no. of doctors in Japan is based on data from the Ministry of Health, Labour and Welfare (2022). The no. of doctors
Slide 20: Overseas Segment: Sales by Region
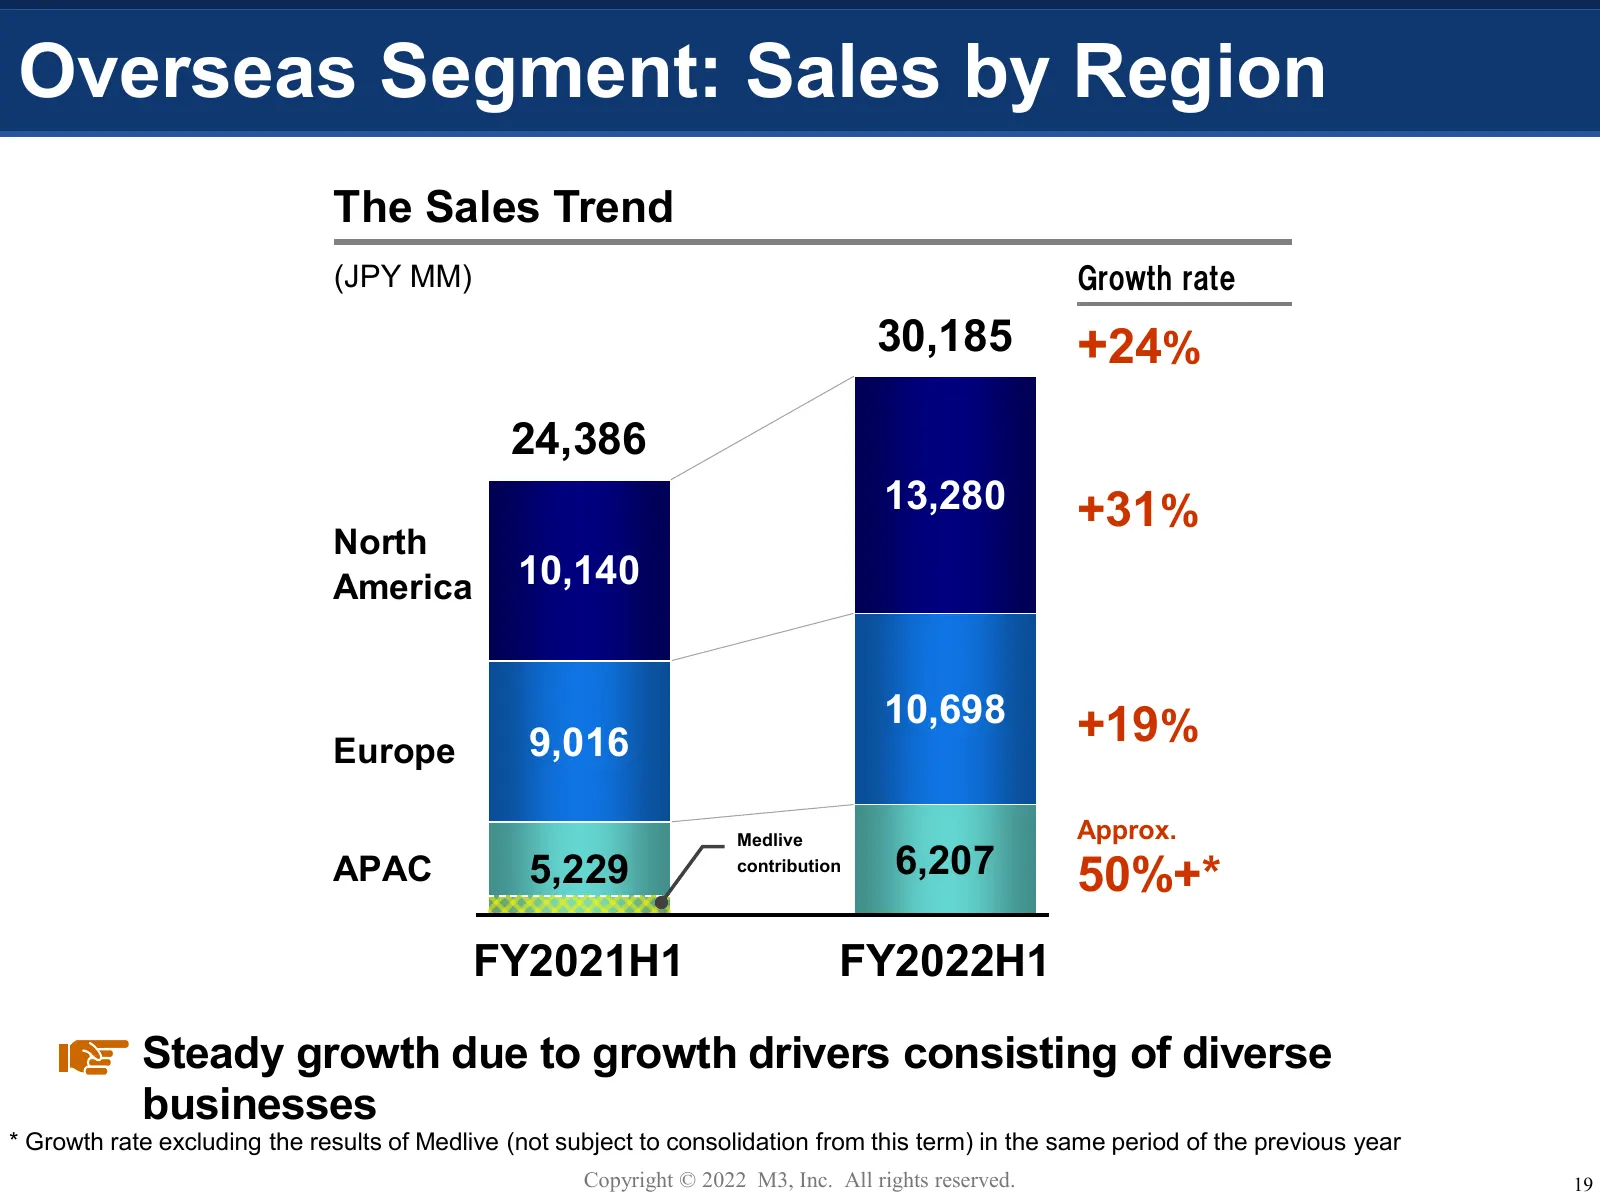
Overseas Segment: Sales by Region The Sales Trend (JPY MM) Growth rate 30,185 +24% 24,386 13,280 +31% North America 10,140 10,698 +19% Europe 9,016 Medlive Approx. APAC 5,229 contribution 6,207 50%+* FY2021H1 FY2022H1 Steady growth due to growth drivers consisting of diverse businesses * Growth rate
Slide 21: Growth Engine 2: Ecosystem Expansion (Sagrada Familia)
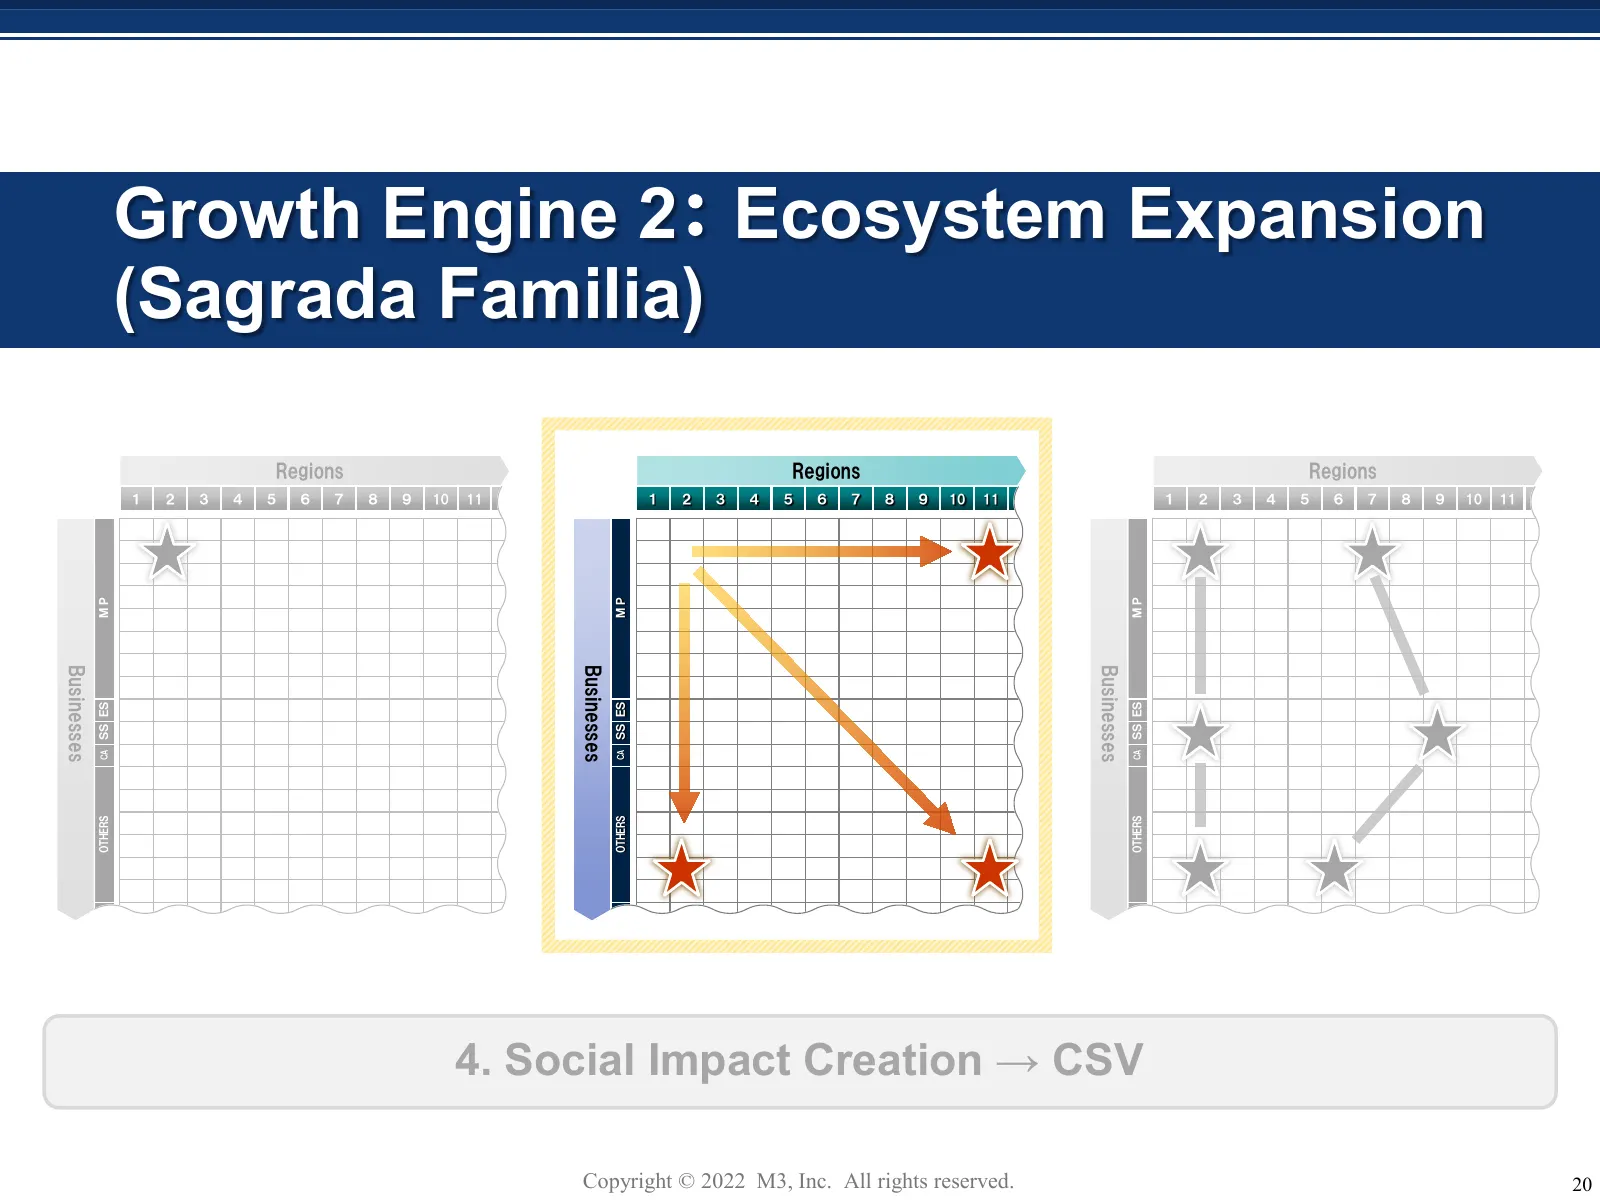
Growth Engine 2: Ecosystem Expansion (Sagrada Familia) Regions Regions Regions 1 2 3 4 5 6 7 8 9 10 11 1 2 3 4 5 6 7 8 9 10 11 1 2 3 4 5 6 7 8 9 10 11 MP MP MP Businesses Businesses Businesses SS ES SS ES SS ES CA CA CA OTHERS OTHERS OTHERS 4. Social Impact Creation → CSV Copyright © 2022 M3, Inc. A
Slide 22: Business Scope Expansion and Growth Potential
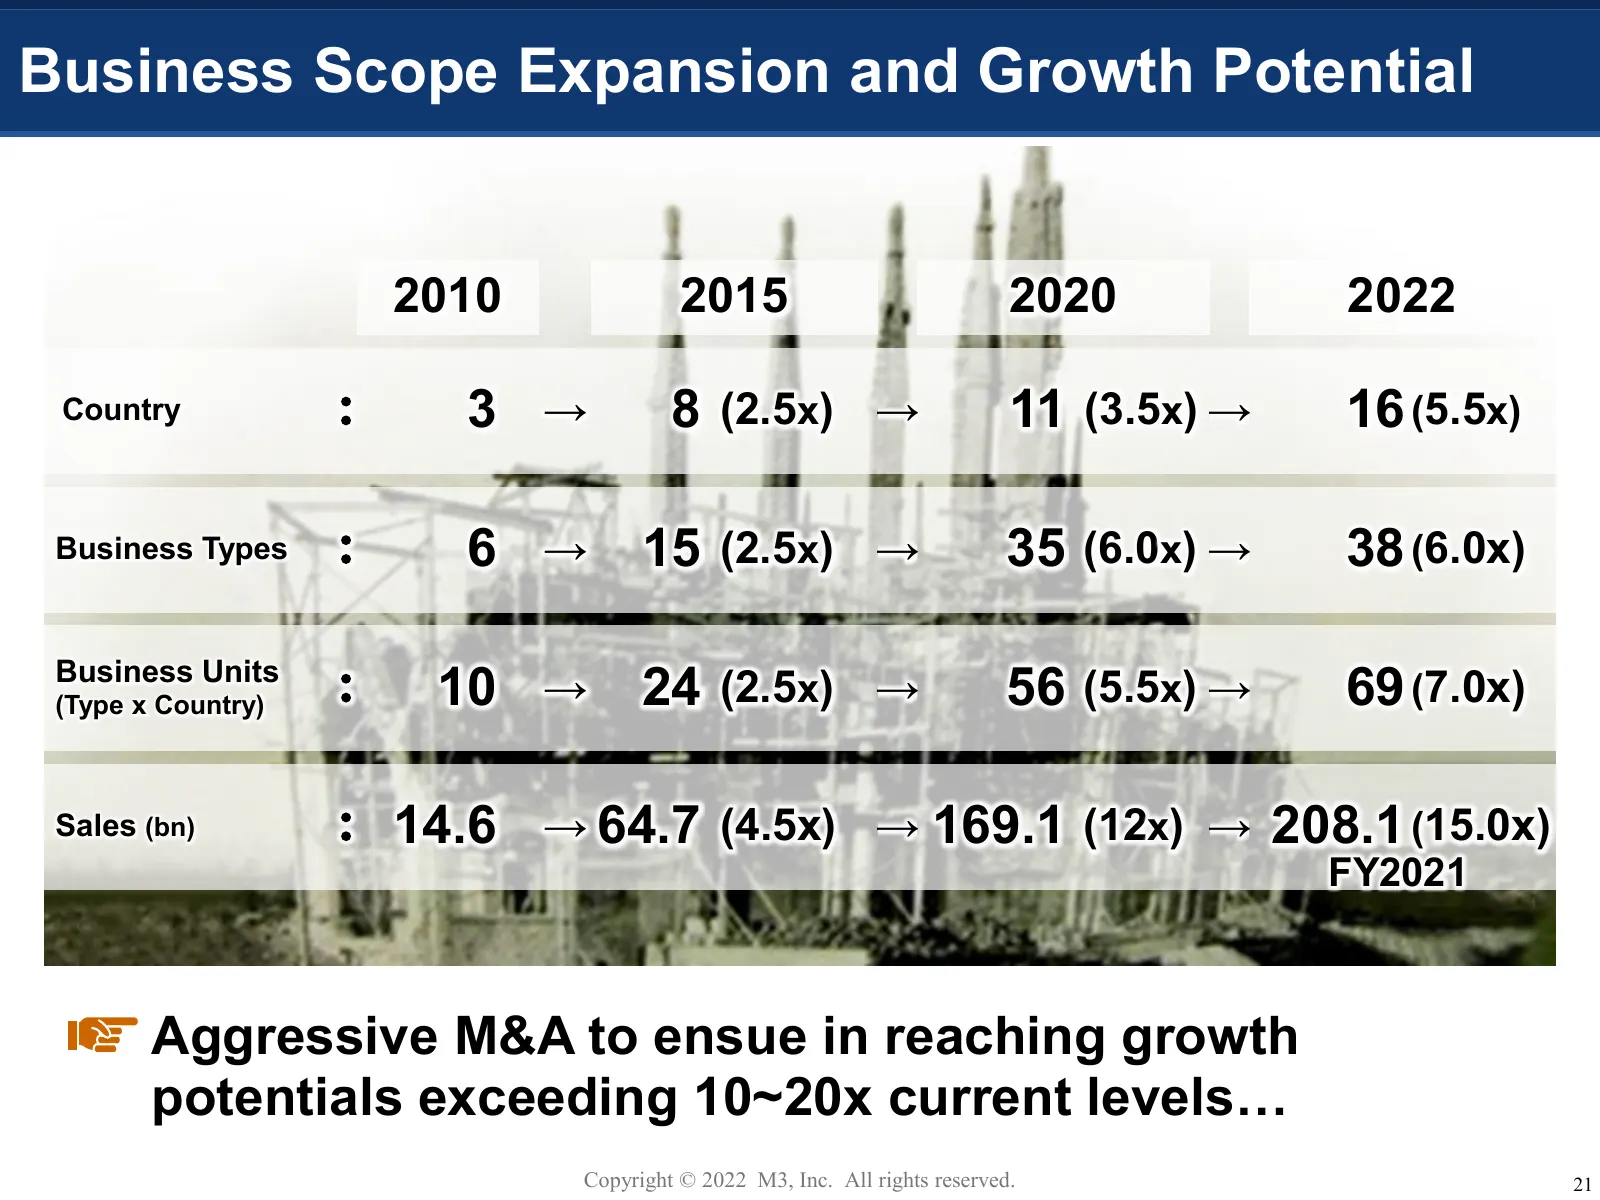
Business Scope Expansion and Growth Potential 2010 2015 2020 2022 Country : 3 → 8 (2.5x) → 11 (3.5x) → 16 (5.5x) Business Types : 6 → 15 (2.5x) → 35 (6.0x) → 38 (6.0x) Business Units (Type x Country) : 10 → 24 (2.5x) → 56 (5.5x) → 69 (7.0x) Sales (bn) : 14.6 → 64.7 (4.5x) → 169.1 (12x) → 208.1 (15.0
Slide 23: Growth Trend per Business Expansion Phases
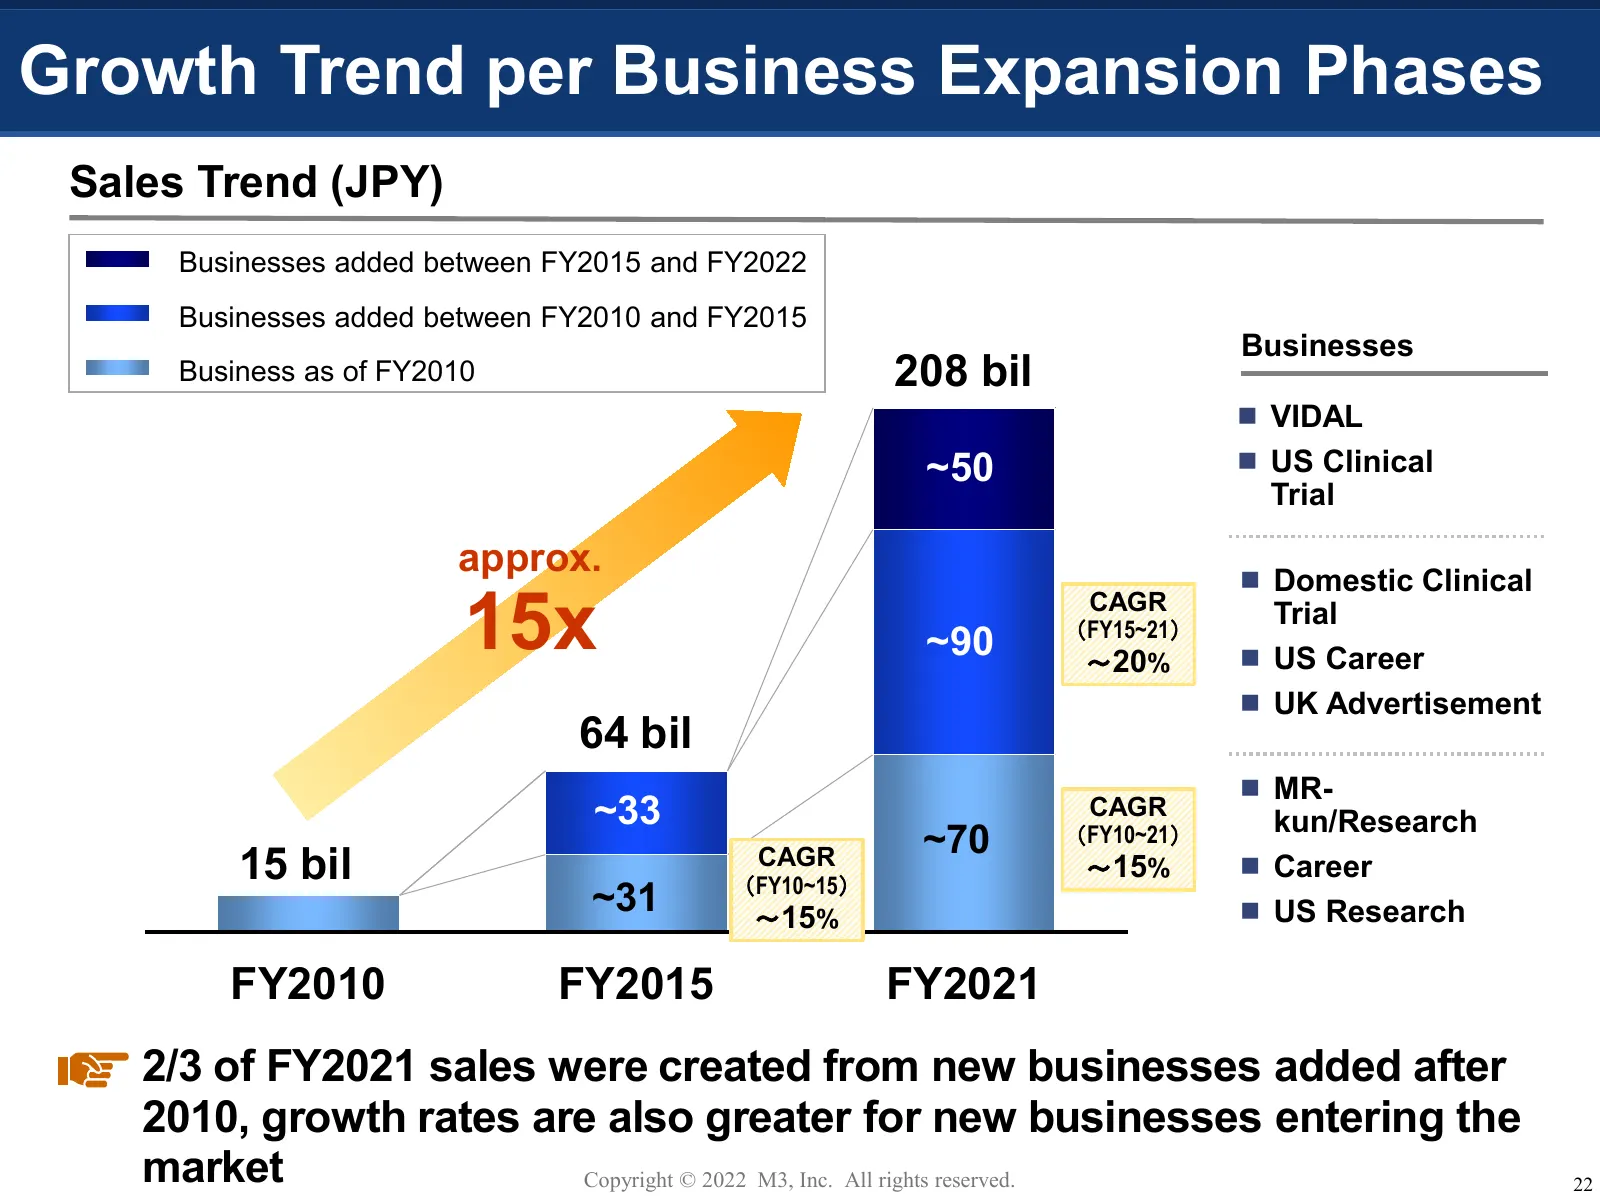
Growth Trend per Business Expansion Phases Sales Trend (JPY) Businesses added between FY2015 and FY2022 Businesses added between FY2010 and FY2015 Businesses Business as of FY2010 208 bil VIDAL ~50 US Clinical Trial approx. Domestic Clinical 15x ~90 CAGR (FY15~21) ~20% Trial US Career UK A
Slide 24: Increase in M&A
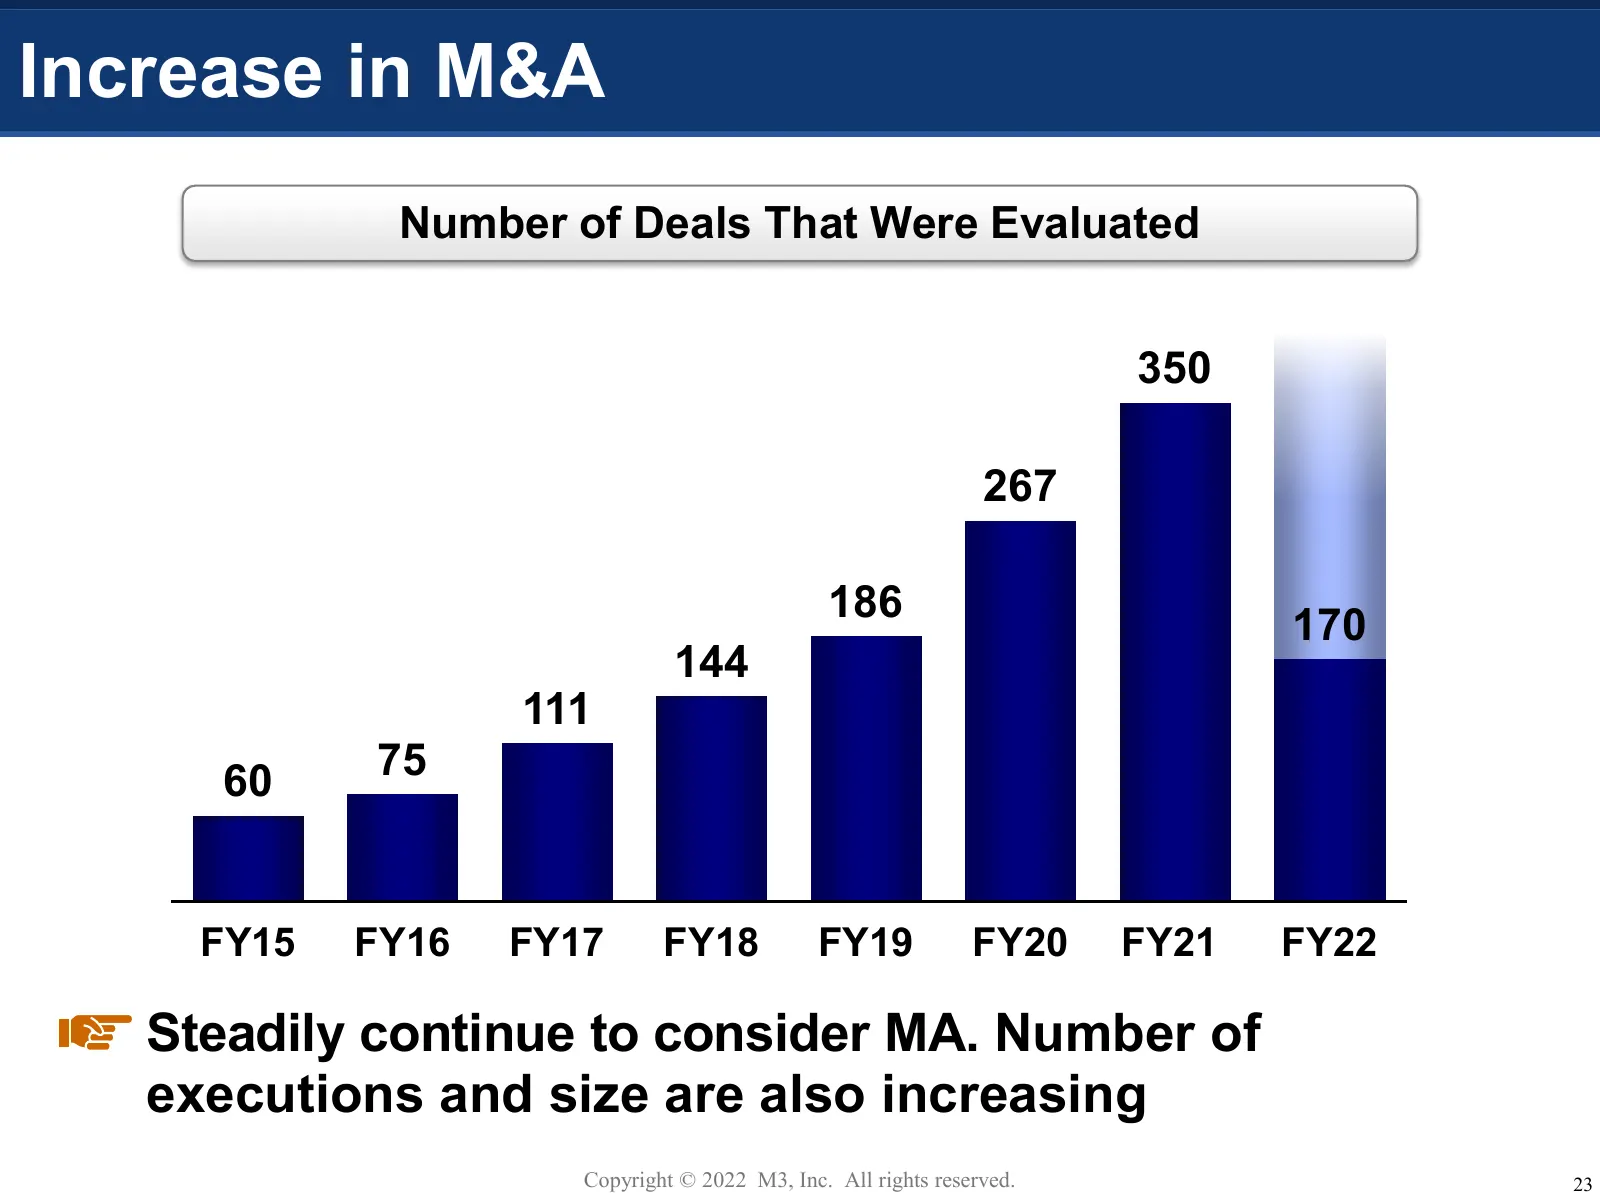
Increase in M&A Number of Deals That Were Evaluated 350 267 186 170 144 111 60 75 FY15 FY16 FY17 FY18 FY19 FY20 FY21 FY22 Steadily continue to consider MA. Number of executions and size are also increasing Copyright © 2022 M3, Inc. All rights reserved. 23
Slide 25: The White Jack Project
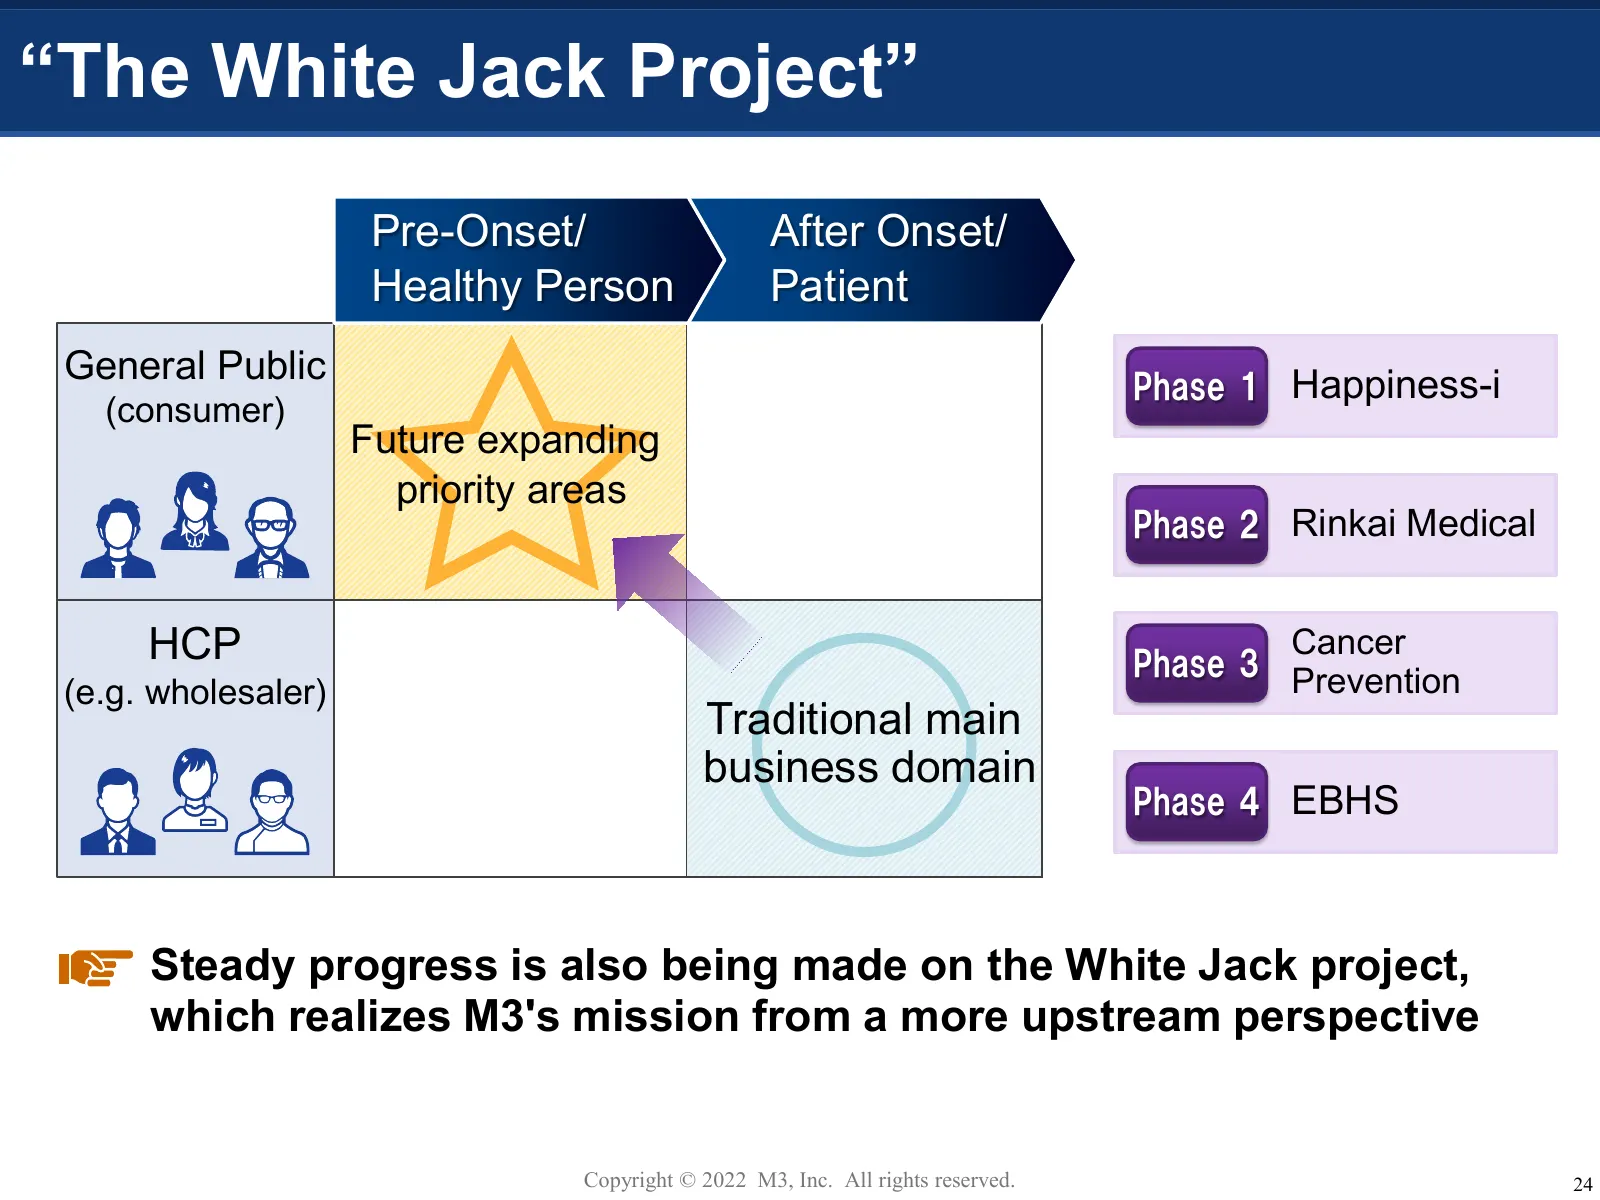
“The White Jack Project” Pre-Onset/ After Onset/ Healthy Person Patient General Public Phase 1 Happiness-i (consumer) Future expanding priority areas Phase 2 Rinkai Medical HCP Cancer Phase 3 Prevention (e.g. wholesaler) Traditional main business domain Phase 4 EBHS Steady progress is also being mad
Slide 26: Phase 3: M3 Cancer Prevention Program
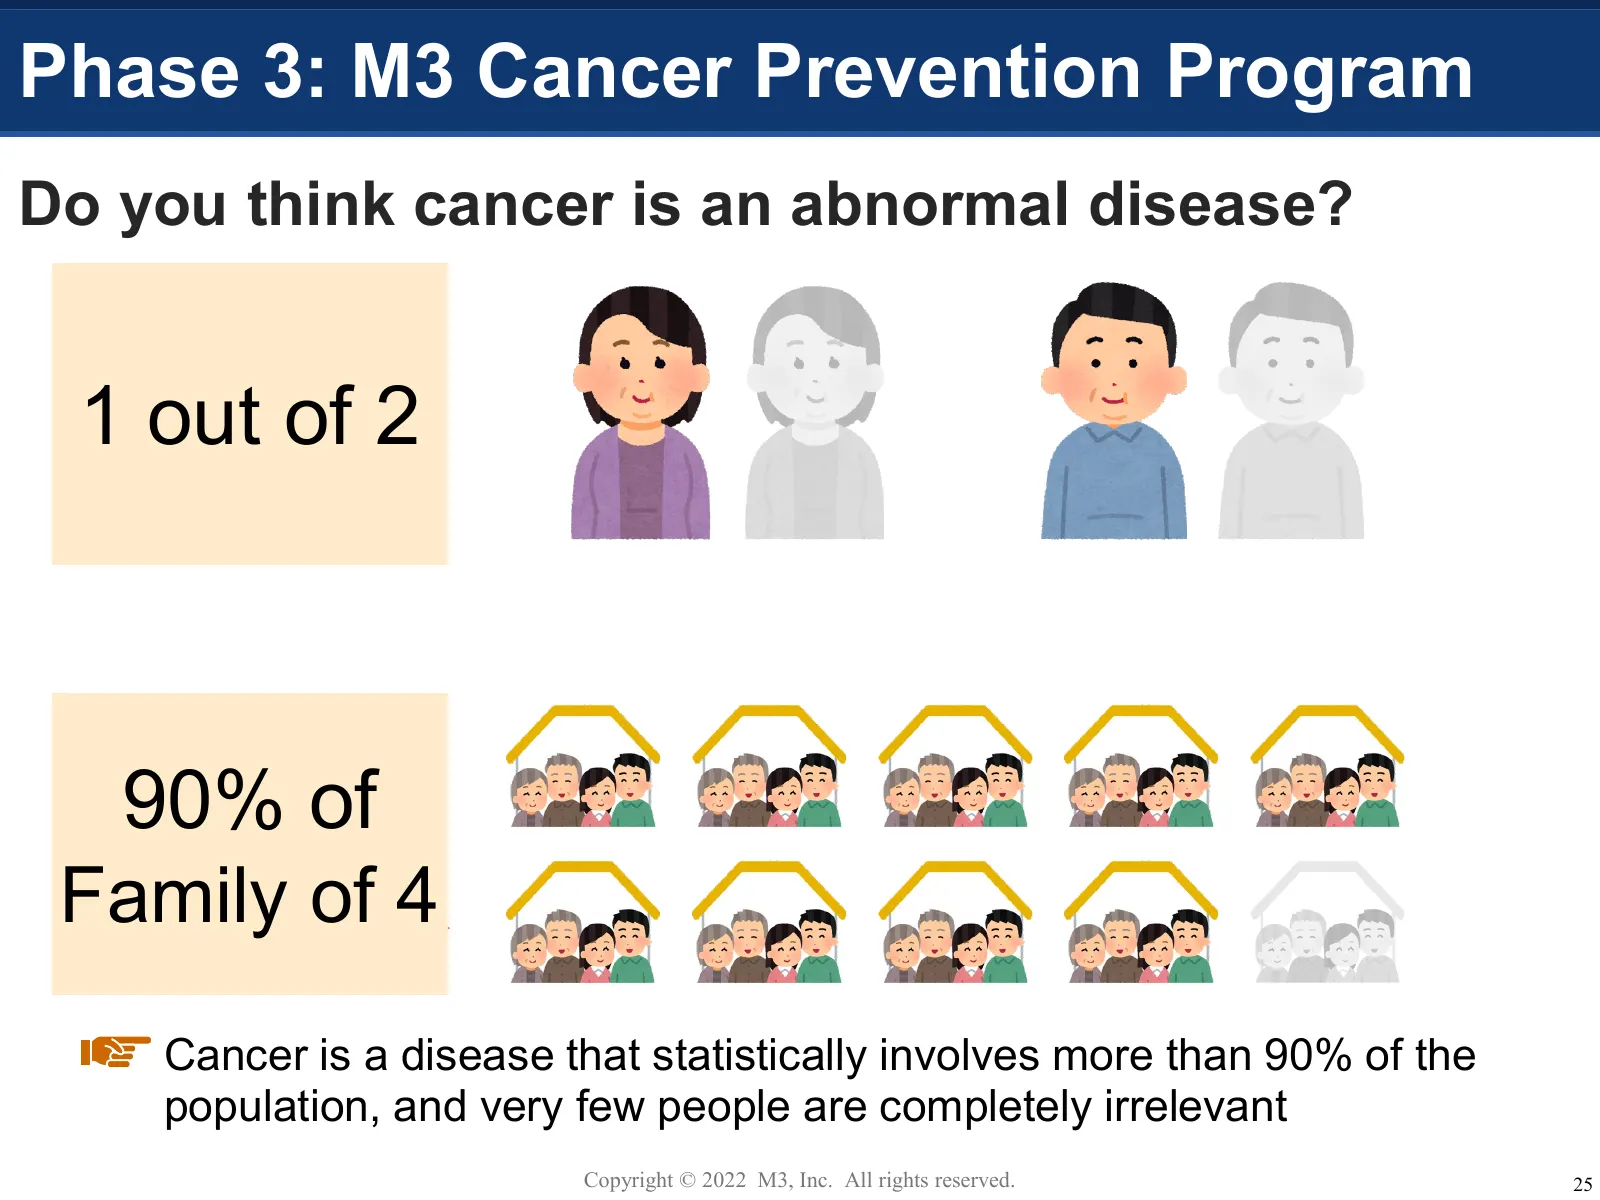
Phase 3: M3 Cancer Prevention Program Do you think cancer is an abnormal disease? 1 out of 2 90% of Family of 4 Probability that no one in a family of four will develop cancer 1/2*1/2*1/2*1/2*1/2=1/16=6.25 Cancer is a disease that statistically involves more than 90% of the population, and very few
Slide 27: The Concept of Cancer Prevention
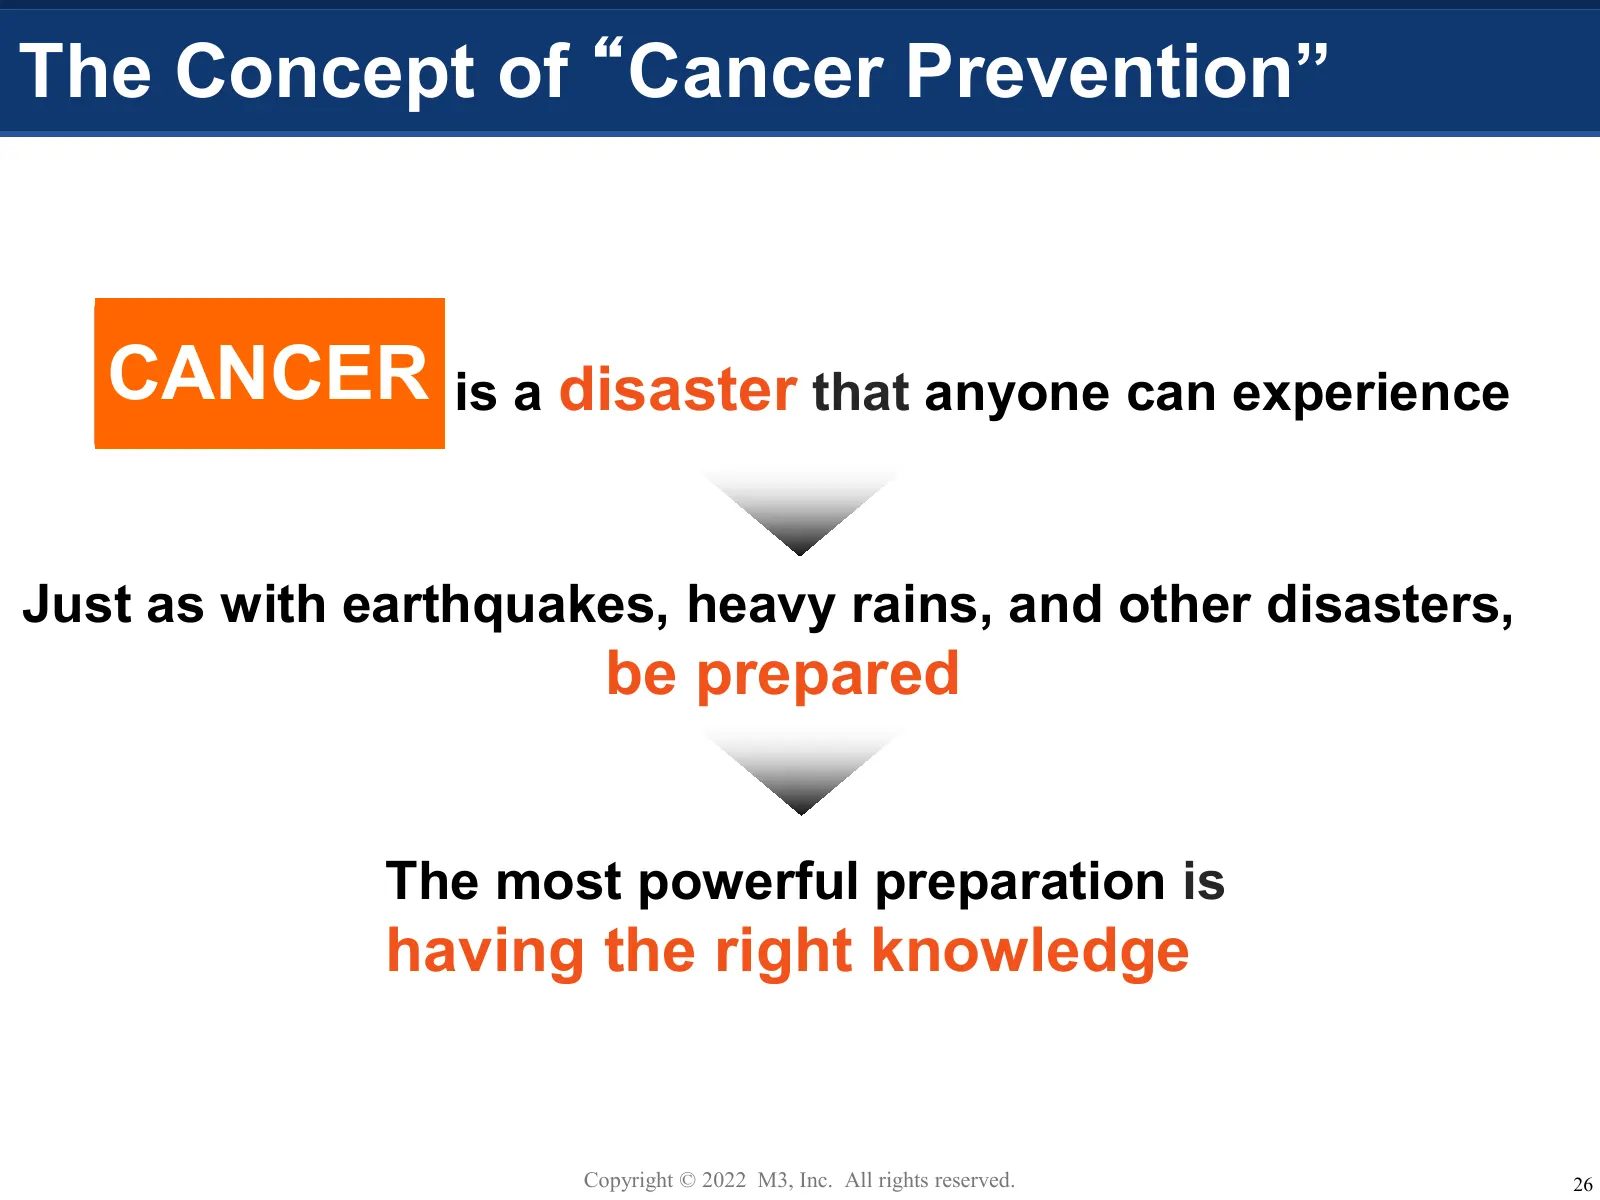
The Concept of “Cancer Prevention” CANCER is a disaster that anyone can experience Just as with earthquakes, heavy rains, and other disasters, be prepared The most powerful preparation is having the right knowledge Copyright © 2022 M3, Inc. All rights reserved. 26
Slide 28: M3 Cancer Prevention Program
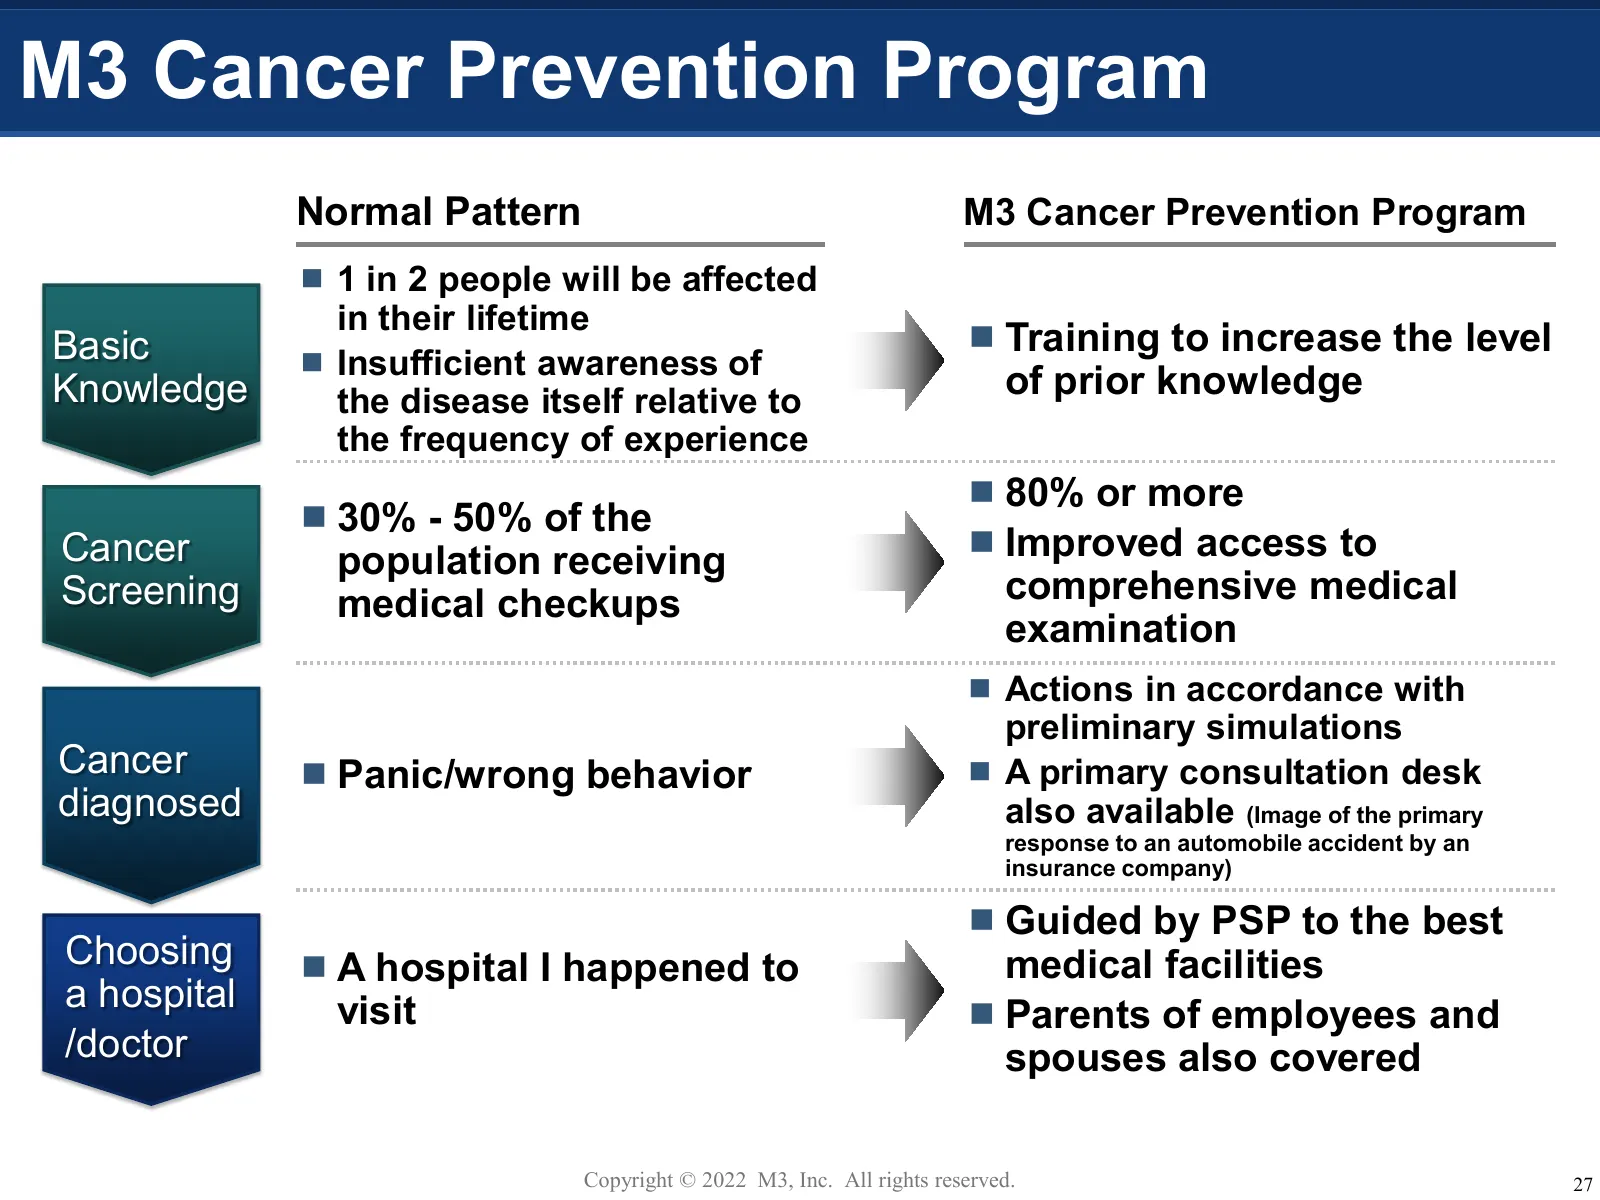
M3 Cancer Prevention Program Normal Pattern M3 Cancer Prevention Program 1 in 2 people will be affected in their lifetime Basic Training to increase the level Insufficient awareness of Knowledge the disease itself relative to of prior knowledge the frequency of experience 80% or more 30% -
Slide 29: Phase 4 EBHS: Calculation Image
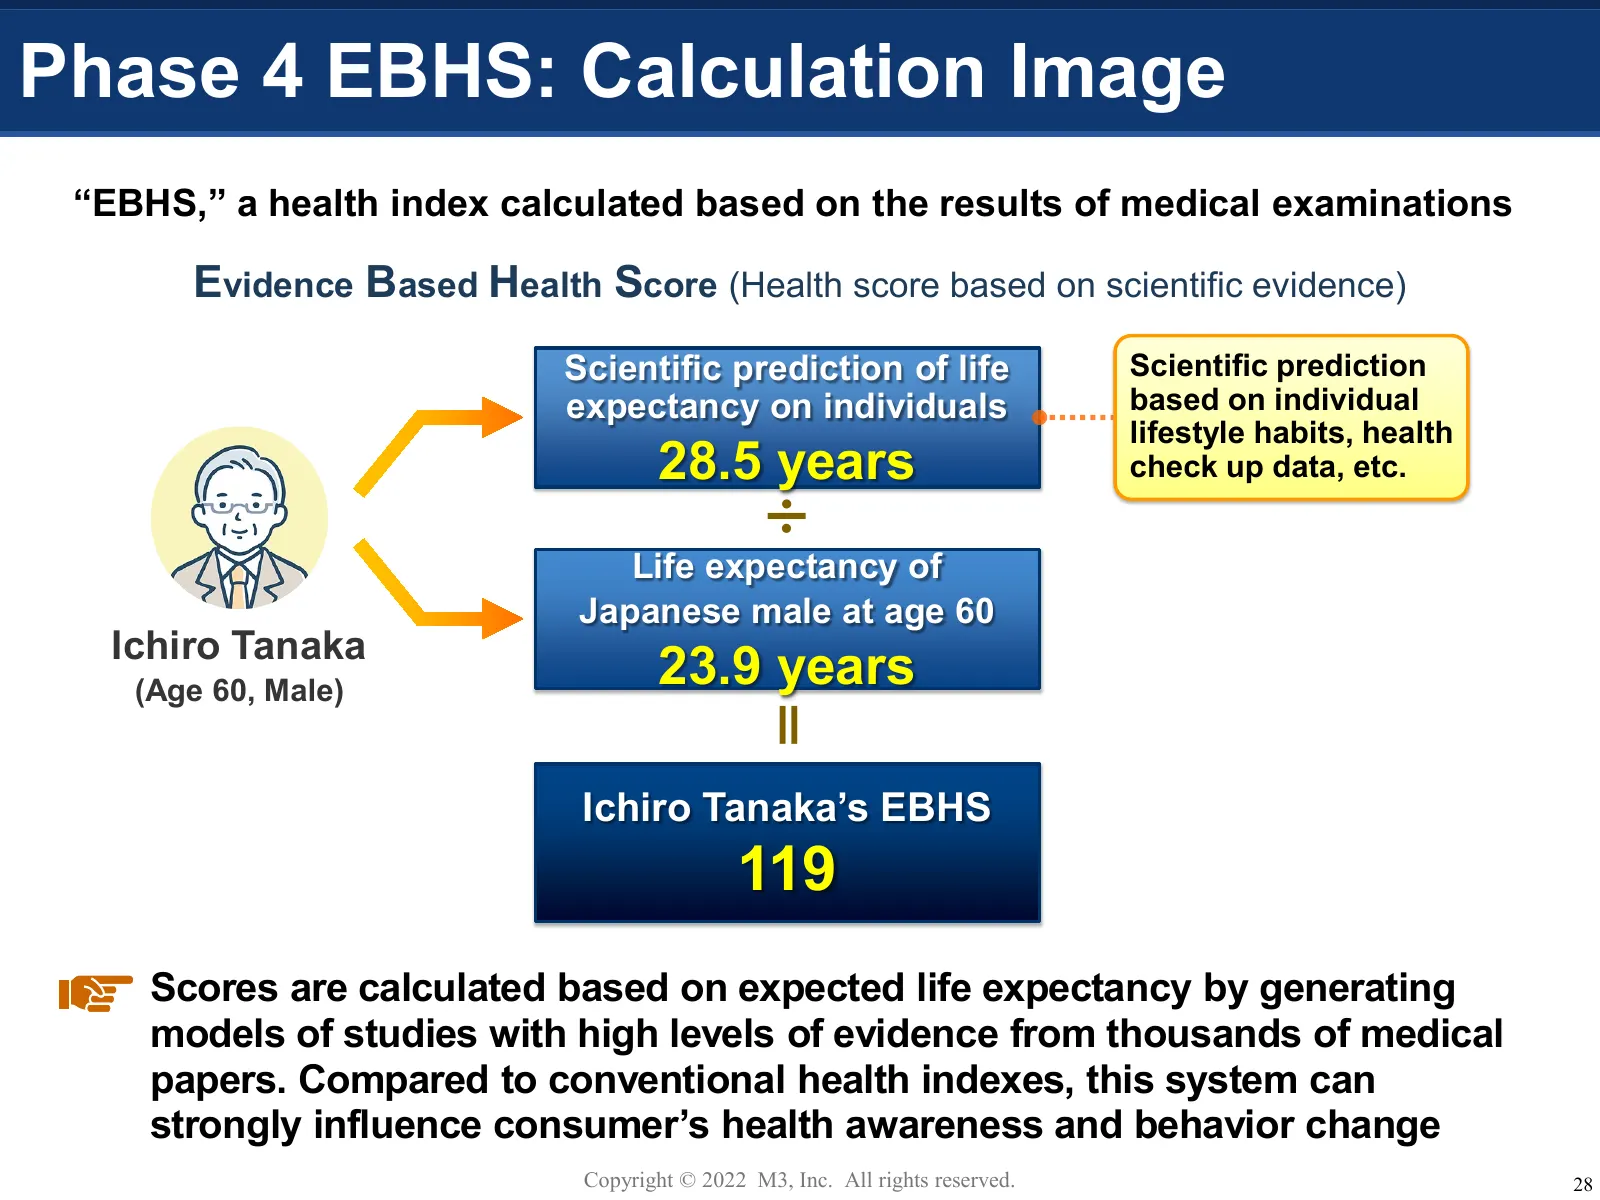
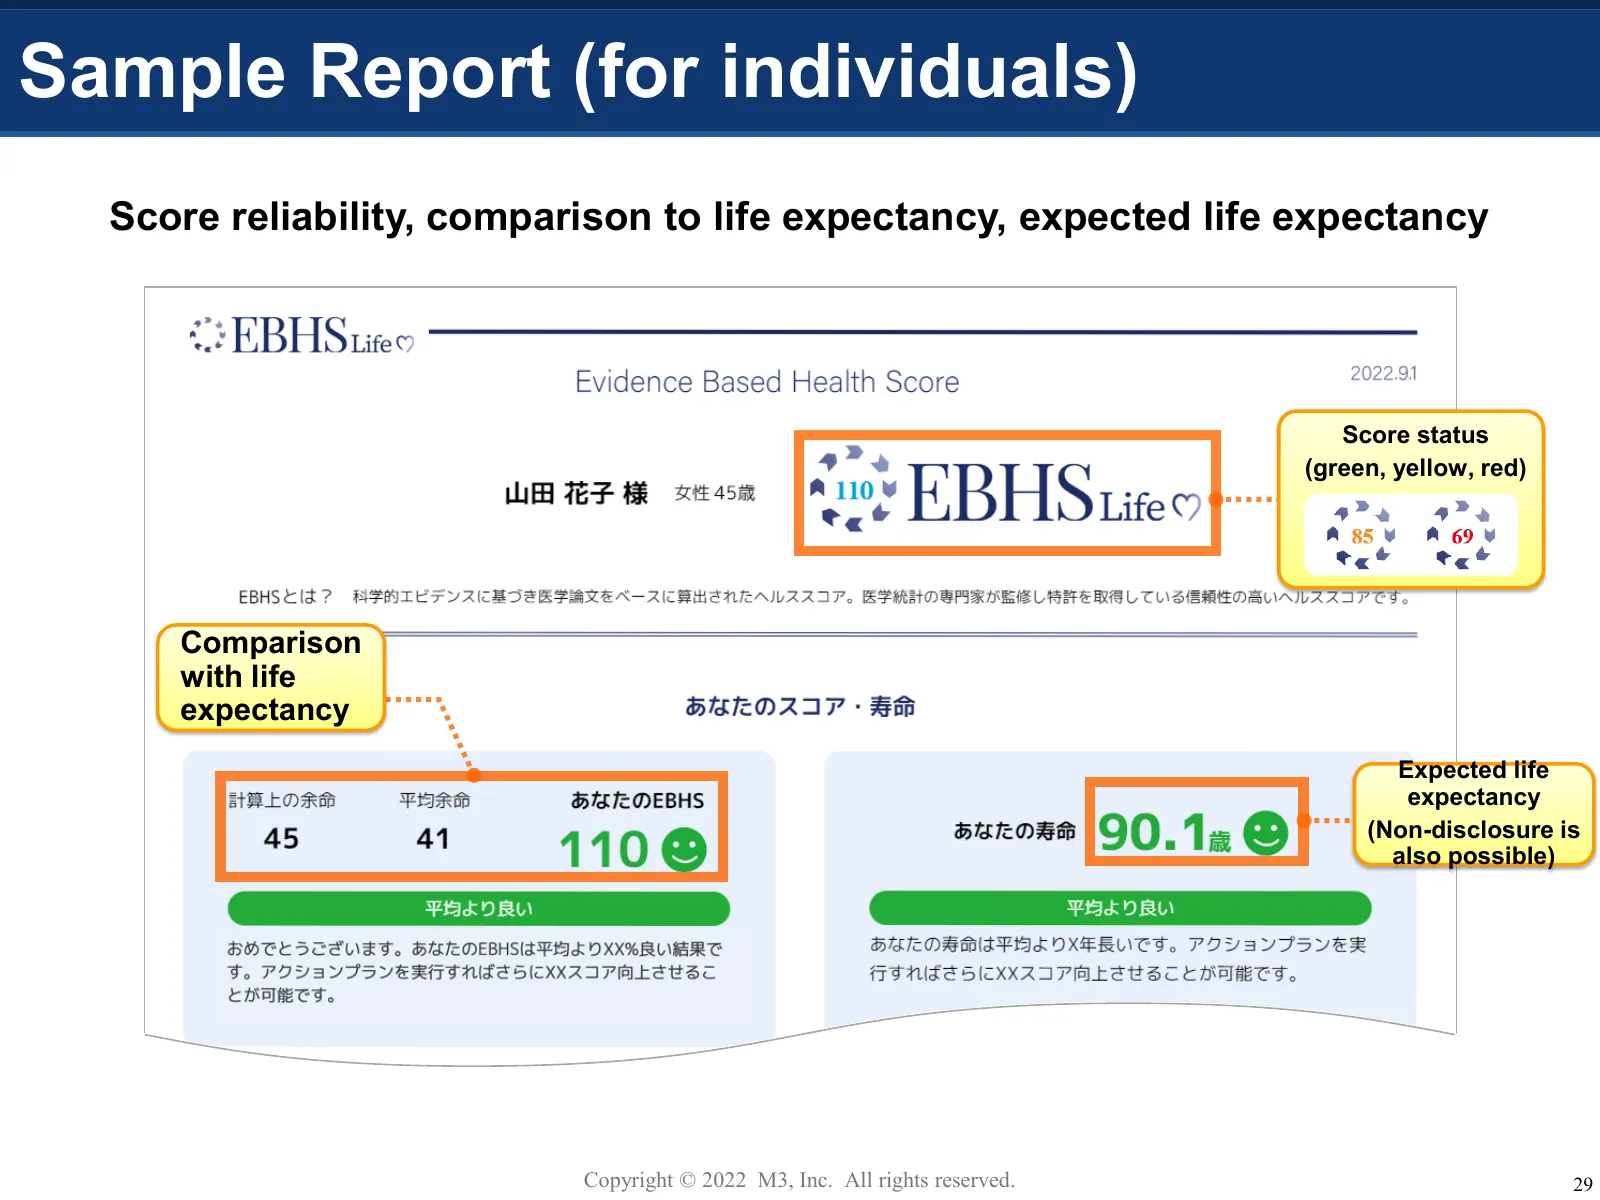
Phase 4 EBHS: Calculation Image “EBHS,” a health index calculated based on the results of medical examinations Evidence Based Health Score (Health score based on scientific evidence) Scientific prediction of life Scientific prediction expectancy on individuals based on individual lifestyle habits, h
Slide 30: Sample Report (for individuals)
Sample Report (for individuals) Score reliability, comparison to life expectancy, expected life expectancy Score status (green, yellow, red) Comparison with life expectancy Expected life expectancy (Non-disclosure is also possible) Copyright © 2022 M3, Inc. All rights reserved. 29
Slide 31: Start of Y'S Career Business (October 2022)
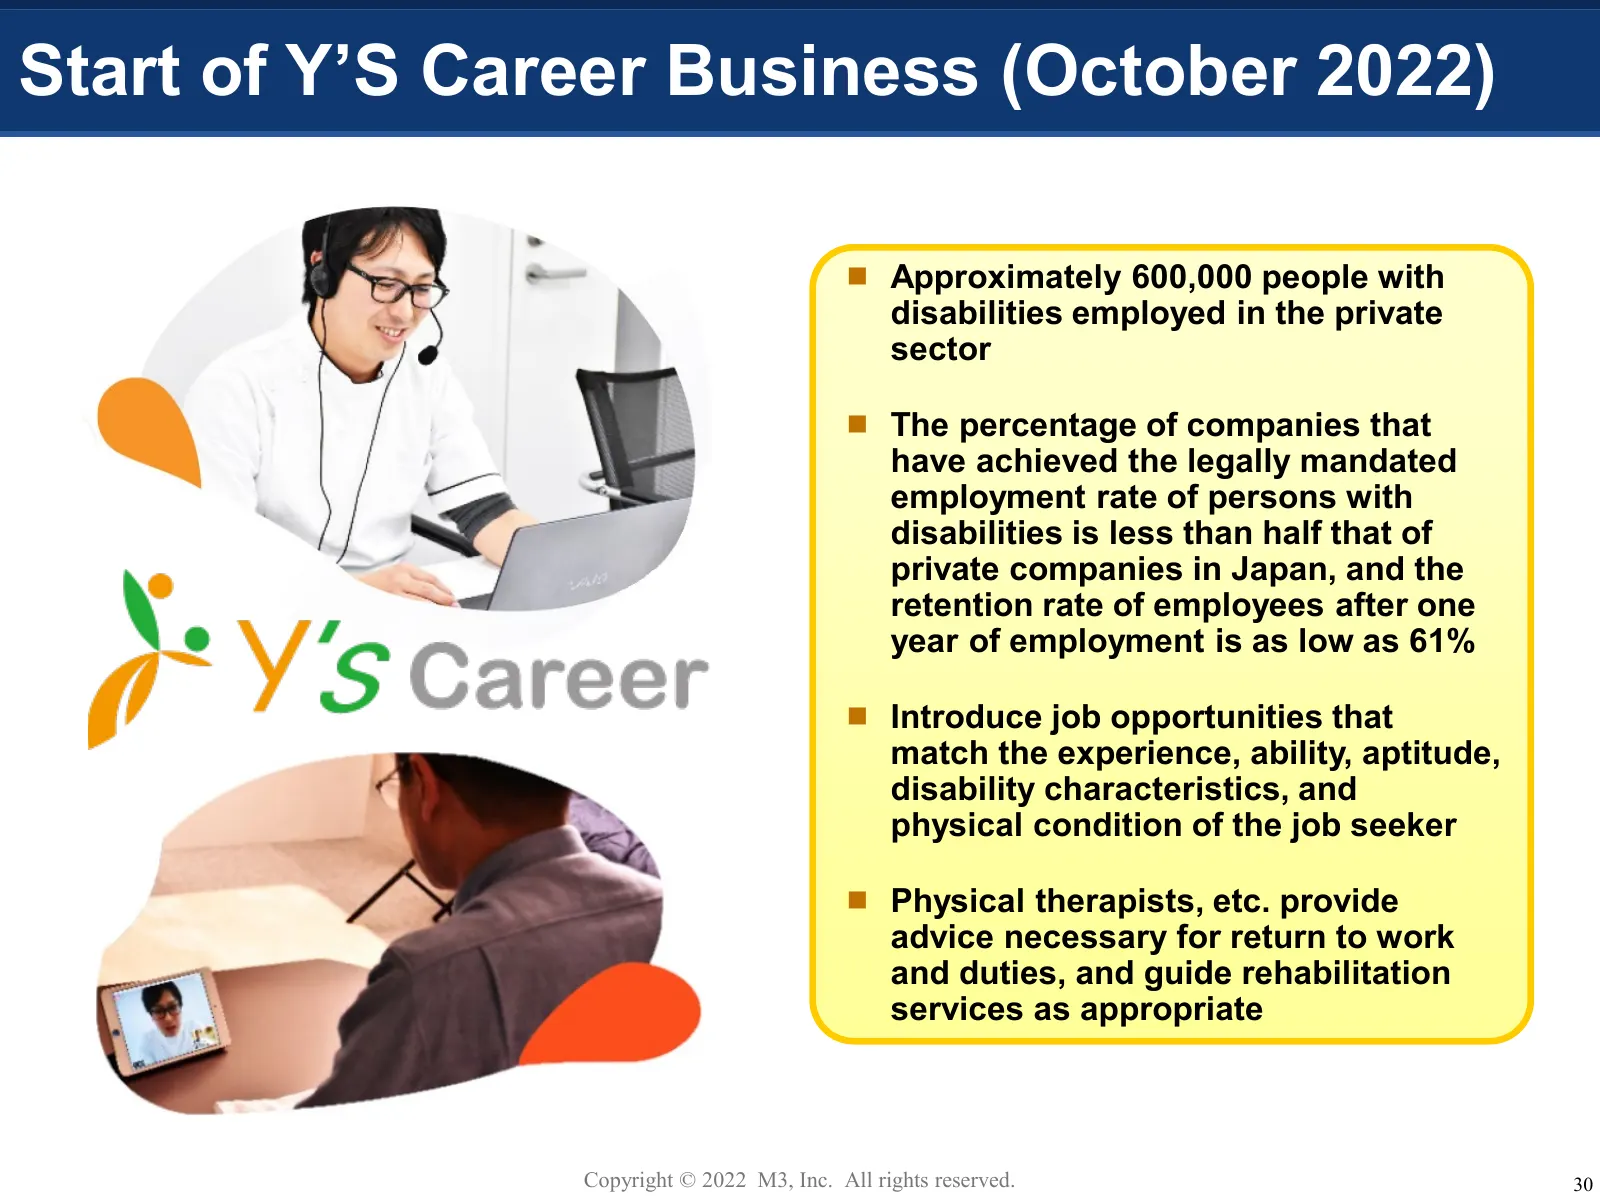
Start of Y’S Career Business (October 2022) Approximately 600,000 people with disabilities employed in the private sector The percentage of companies that have achieved the legally mandated employment rate of persons with disabilities is less than half that of private companies in Japan, and the
Slide 32: Growth Engine 3: Ecosystem Synergy Creation
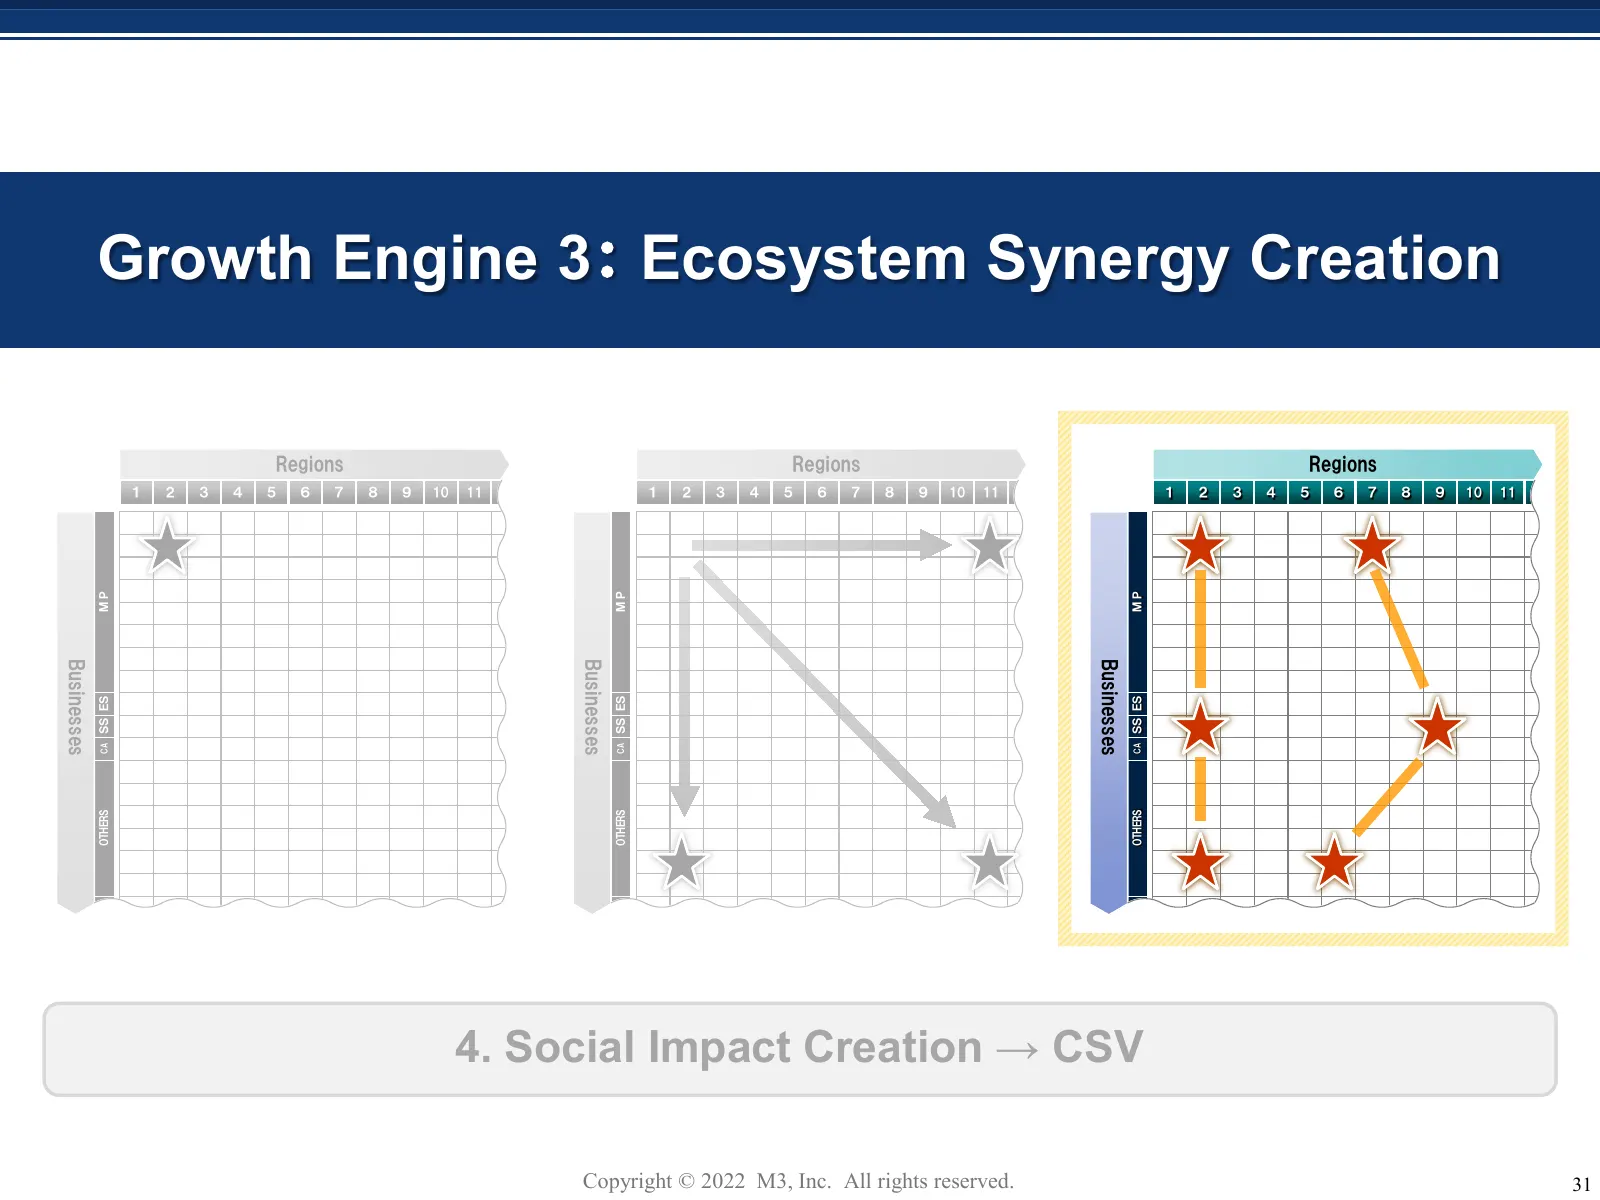
Growth Engine 3: Ecosystem Synergy Creation Regions Regions Regions 1 2 3 4 5 6 7 8 9 10 11 1 2 3 4 5 6 7 8 9 10 11 1 2 3 4 5 6 7 8 9 10 11 MP MP MP Businesses Businesses Businesses SS ES SS ES SS ES CA CA CA OTHERS OTHERS OTHERS 4. Social Impact Creation → CSV Copyright © 2022 M3, Inc. All rights r
Slide 33: M3's Paradigm Shift
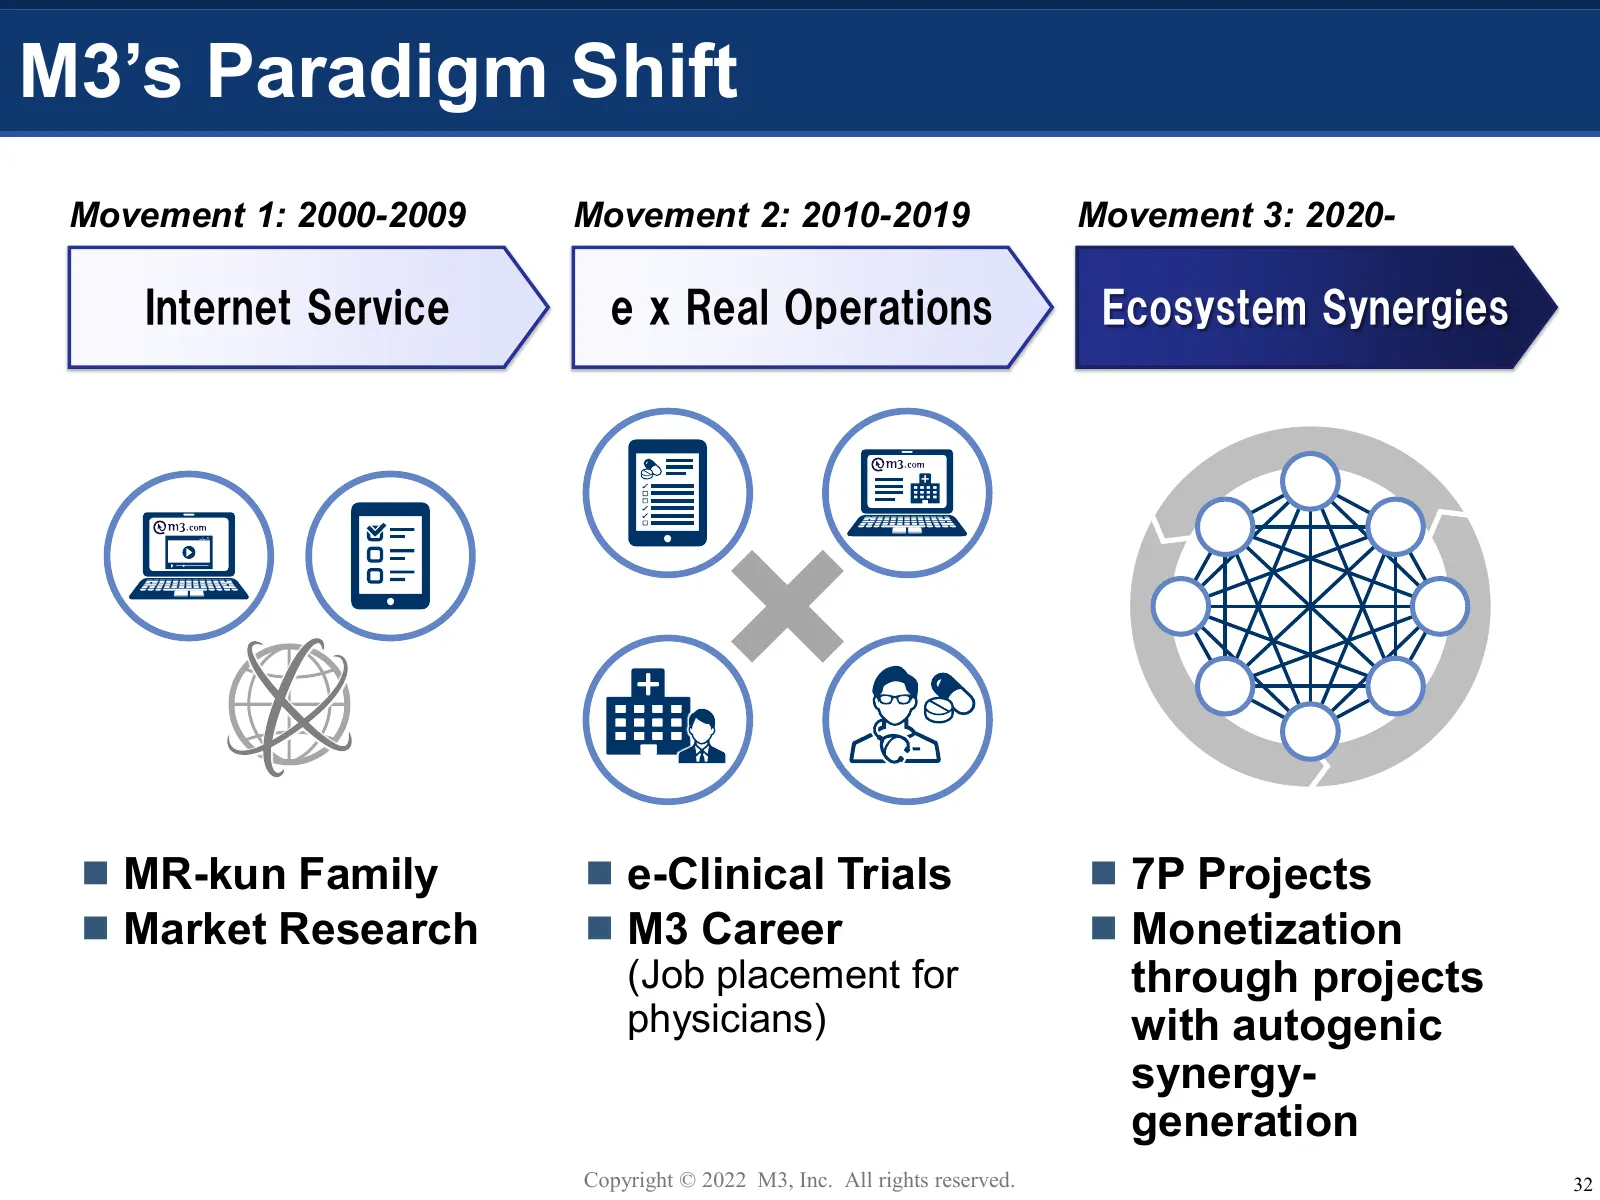
M3’s Paradigm Shift Movement 1: 2000-2009 Movement 2: 2010-2019 Movement 3: 2020- Internet Service e x Real Operations Ecosystem Synergies MR-kun Family e-Clinical Trials 7P Projects Market Research M3 Career Monetization (Job placement for through projects physicians) with autogenic syn
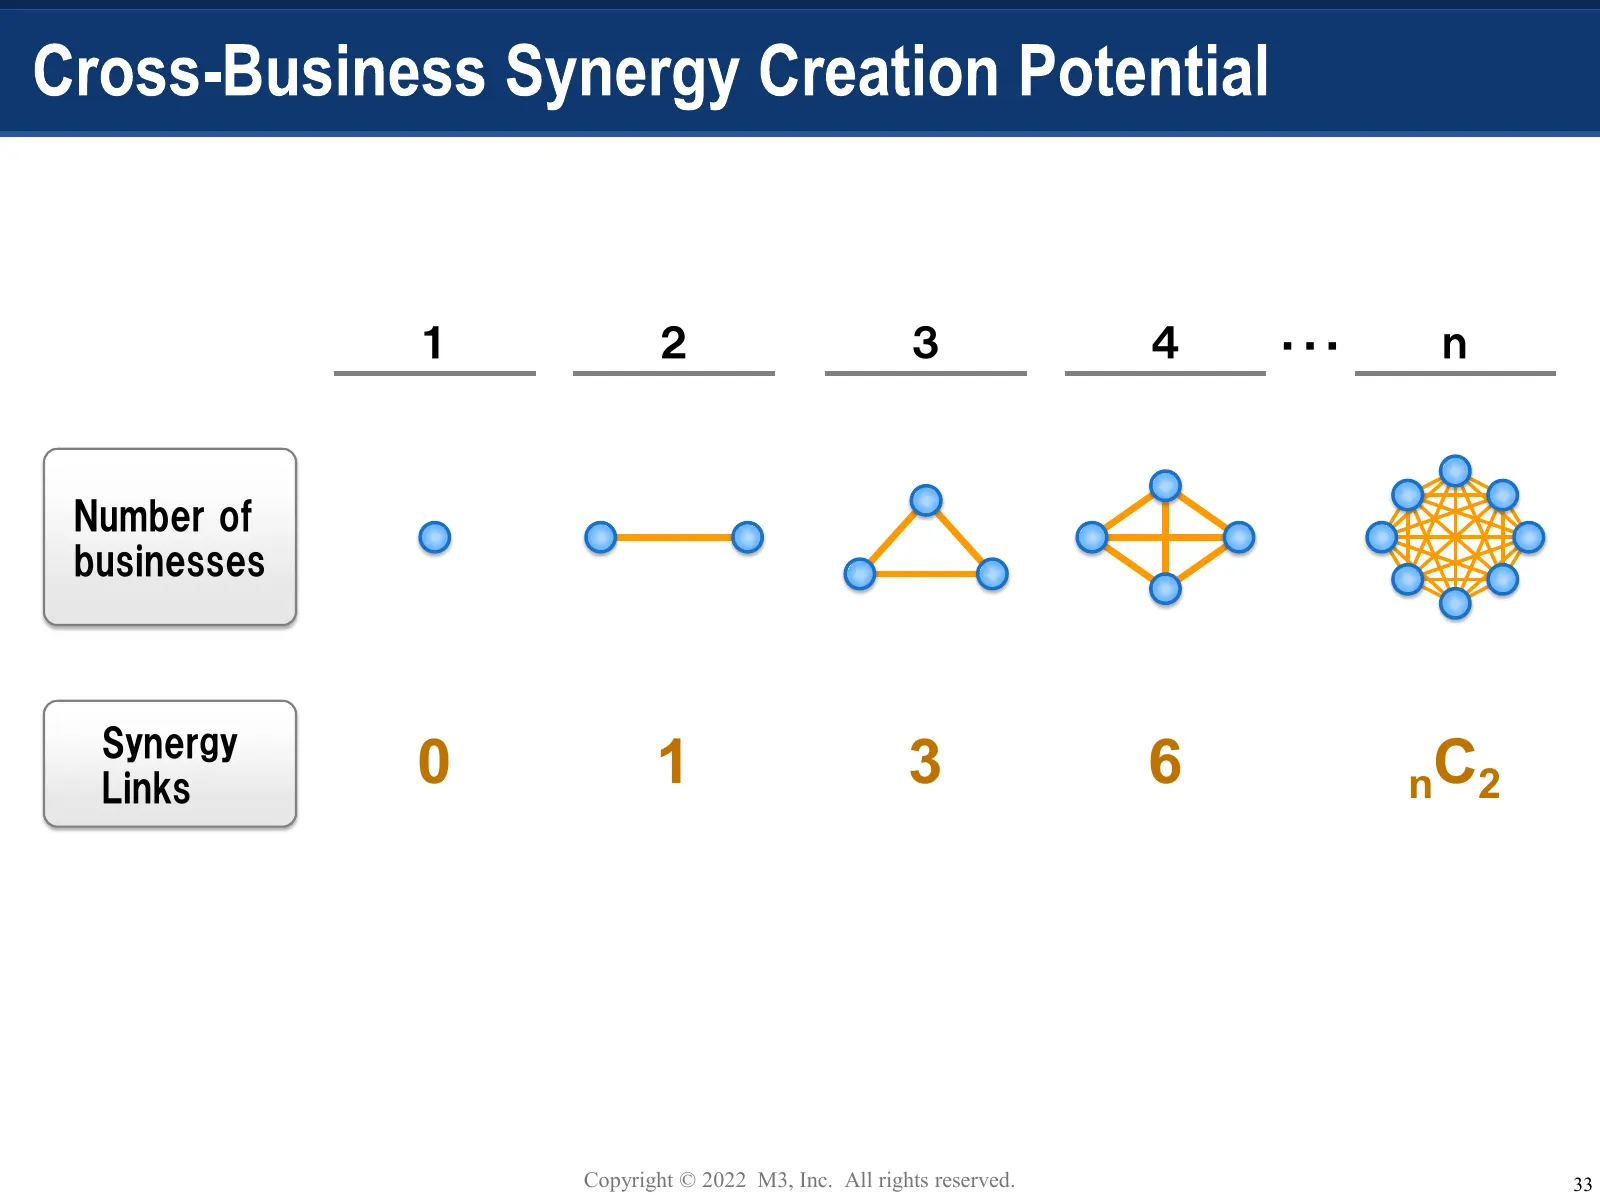
Slide 34: Number of businesses and synergy links
1 2 3 4 ・・・ n Number of businesses Synergy Links 0 1 3 6 nC2 Copyright © 2022 M3, Inc. All rights reserved. 33
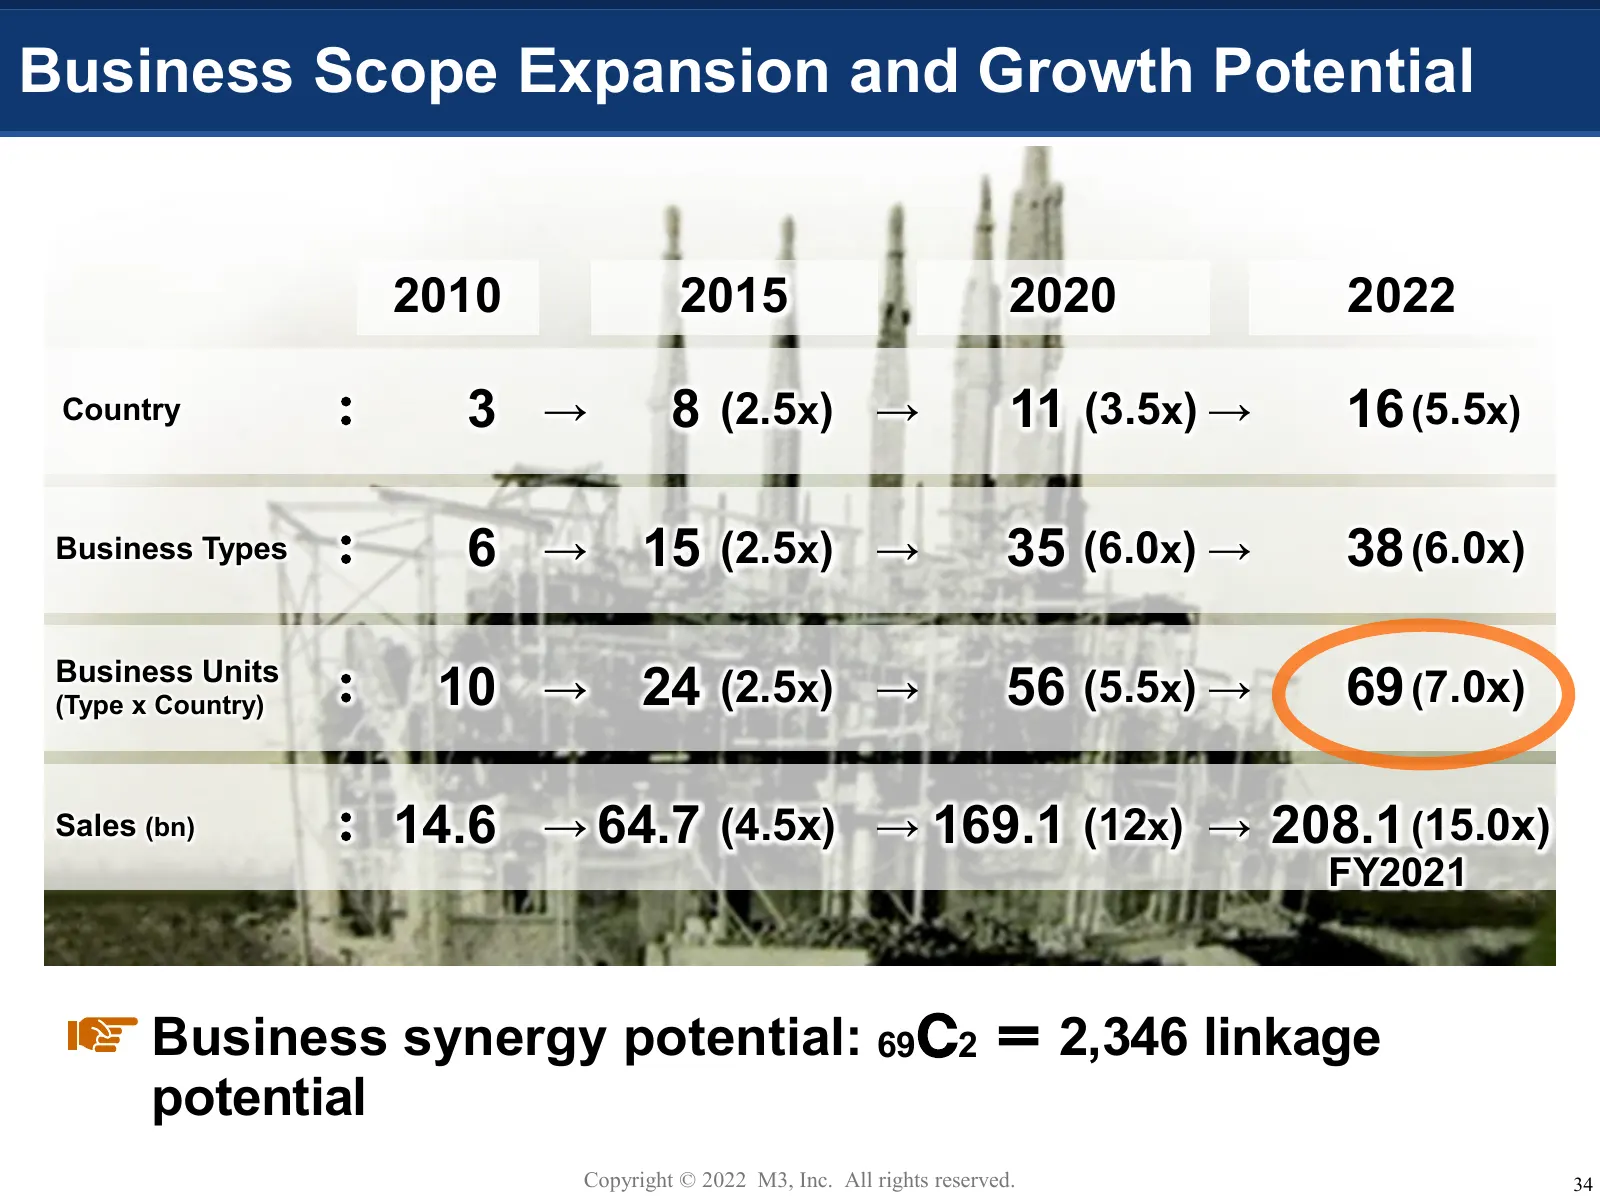
Slide 35: Business Scope Expansion and Growth Potential
Business Scope Expansion and Growth Potential 2010 2015 2020 2022 Country : 3 → 8 (2.5x) → 11 (3.5x) → 16 (5.5x) Business Types : 6 → 15 (2.5x) → 35 (6.0x) → 38 (6.0x) Business Units (Type x Country) : 10 → 24 (2.5x) → 56 (5.5x) → 69 (7.0x) Sales (bn) : 14.6 → 64.7 (4.5x) → 169.1 (12x) → 208.1 (15.0
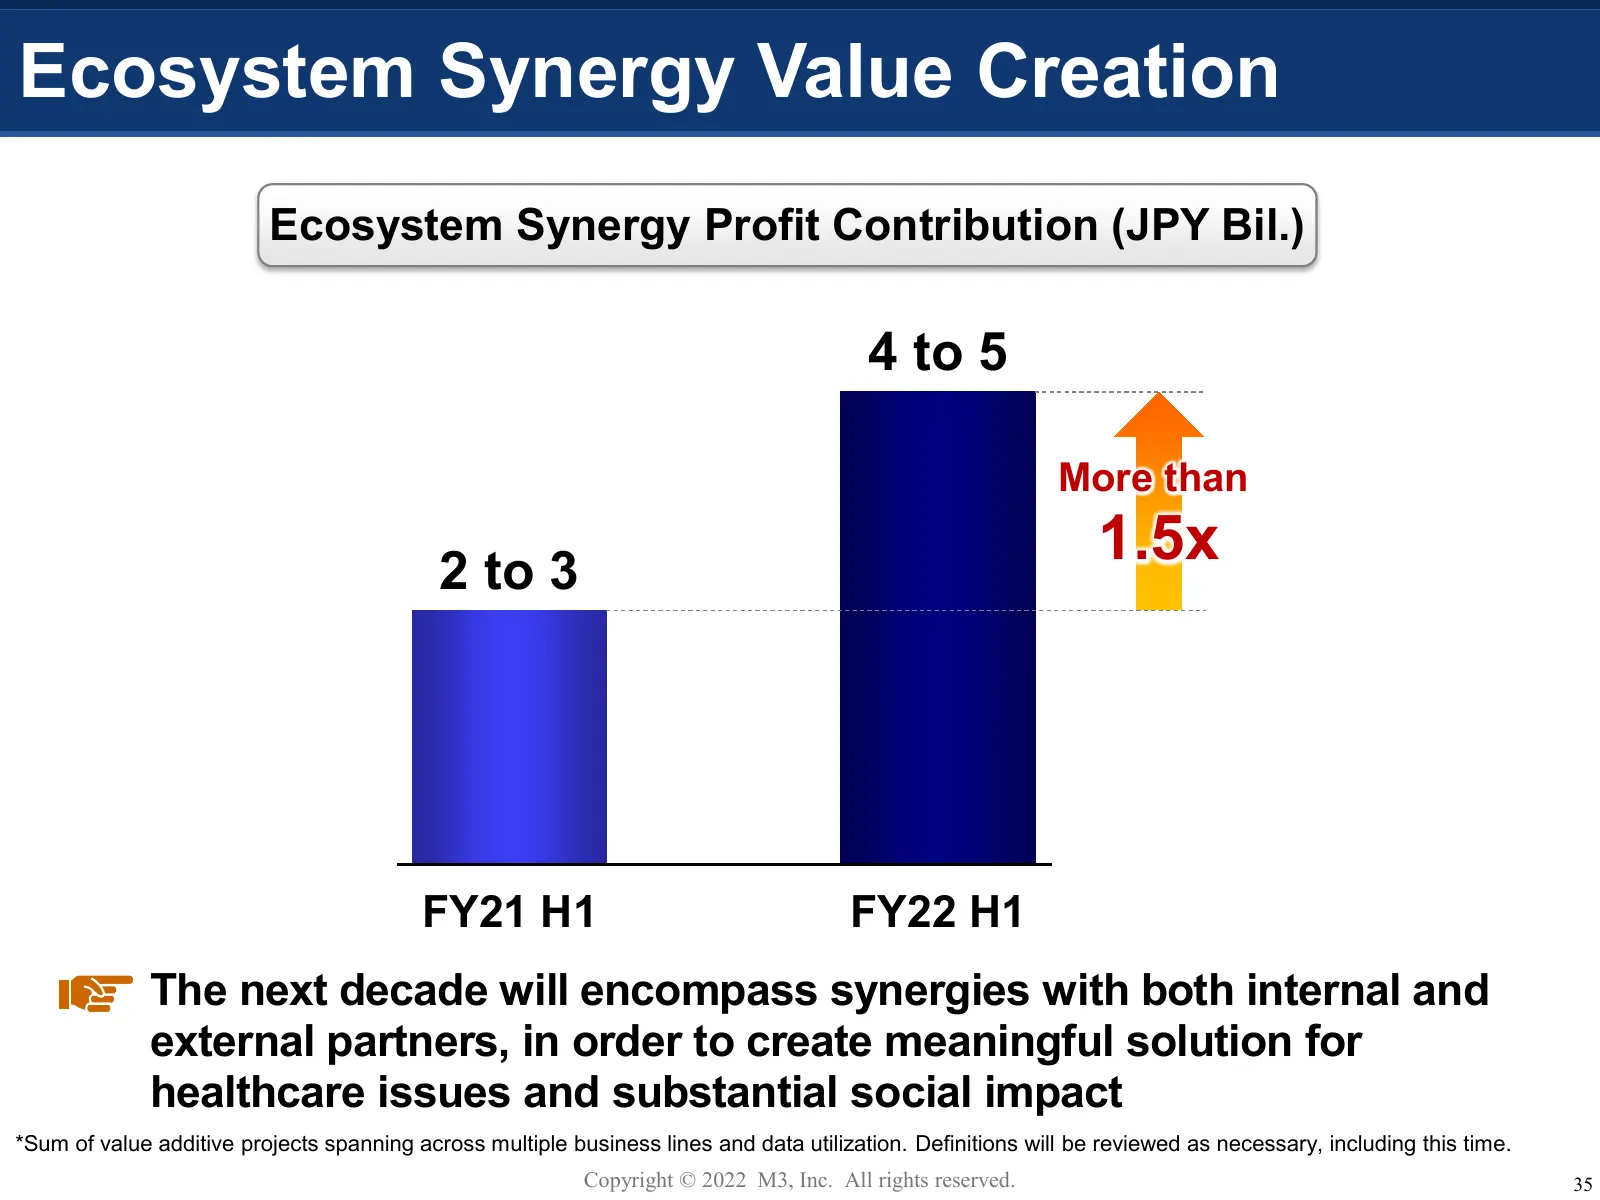
Slide 36: Ecosystem Synergy Value Creation
Ecosystem Synergy Value Creation Ecosystem Synergy Profit Contribution (JPY Bil.) 4 to 5 More than 2 to 3 1.5x FY21 H1 FY22 H1 The next decade will encompass synergies with both internal and external partners, in order to create meaningful solution for healthcare issues and substantial social impact
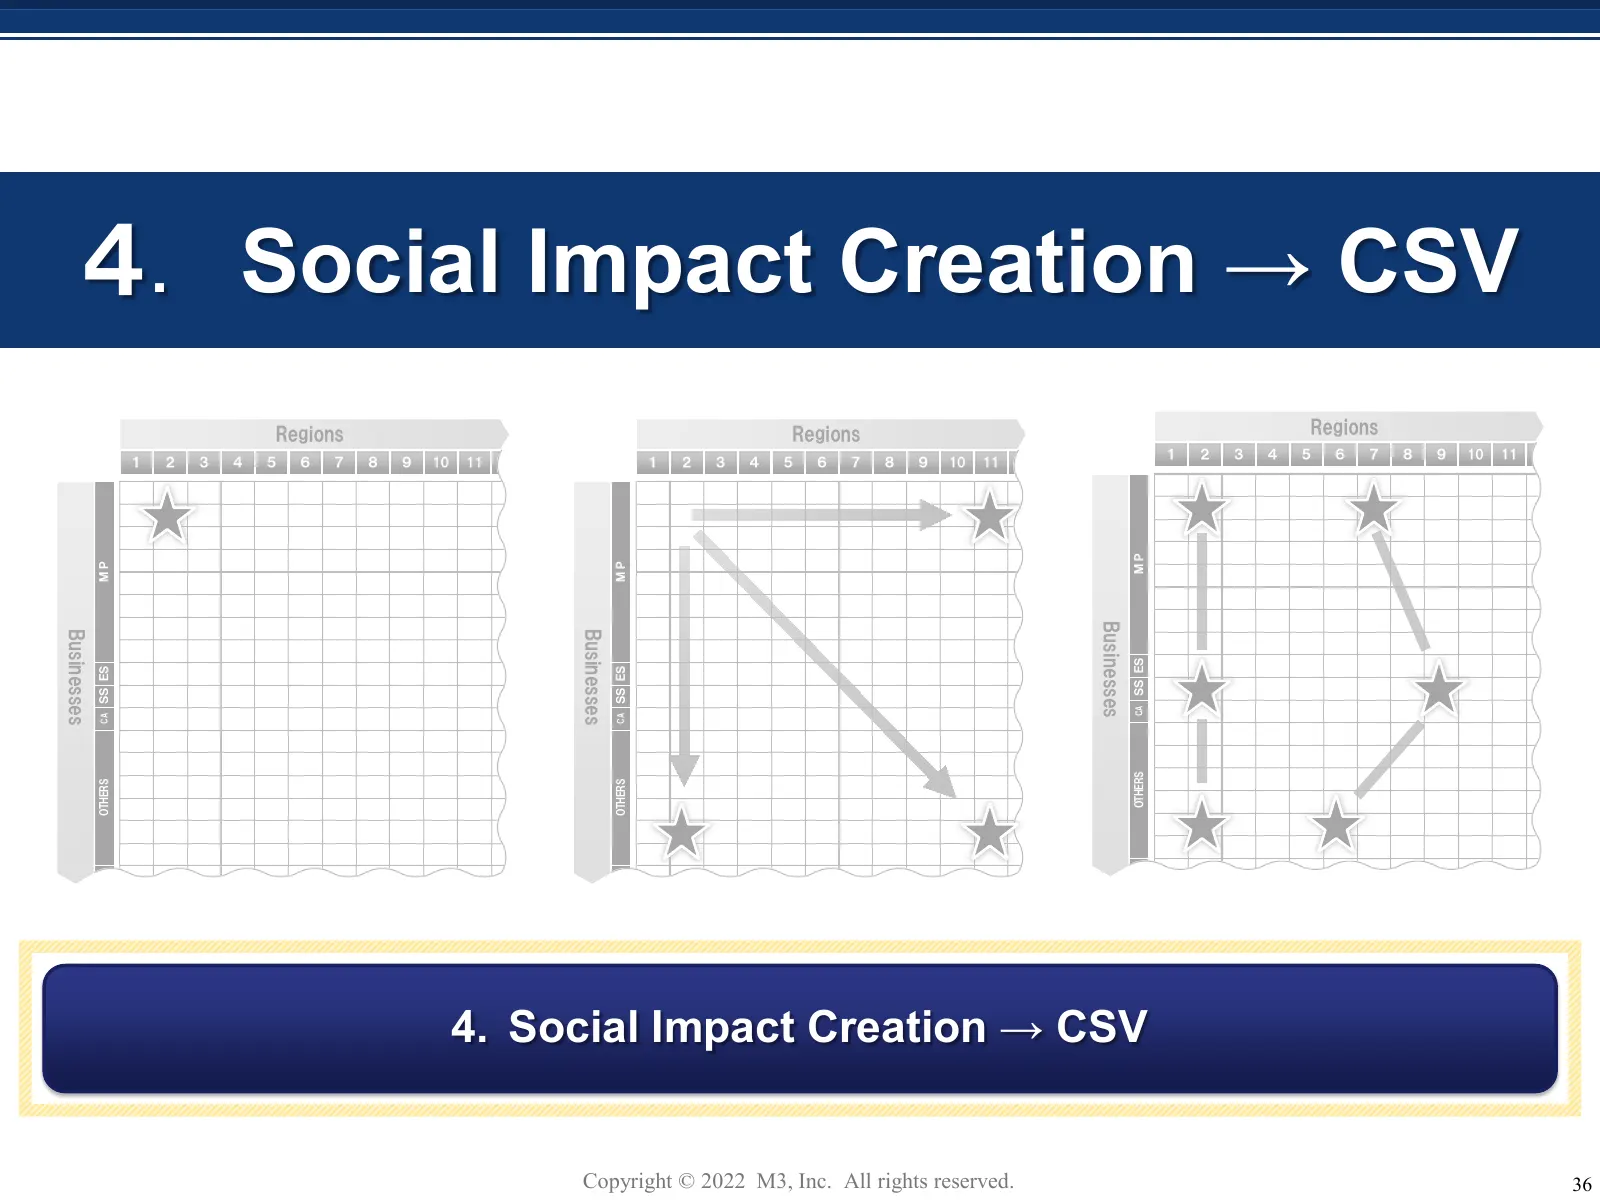
Slide 37: 4. Social Impact Creation → CSV
4. Social Impact Creation → CSV Regions Regions Regions 1 2 3 4 5 6 7 8 9 10 11 1 2 3 4 5 6 7 8 9 10 11 1 2 3 4 5 6 7 8 9 10 11 MP MP MP Businesses Businesses Businesses SS ES SS ES SS ES CA CA CA OTHERS OTHERS OTHERS 4. Social Impact Creation → CSV Copyright © 2022 M3, Inc. All rights reserved. 36
Slide 38: SDGs and CSV: M3's CSV positioning
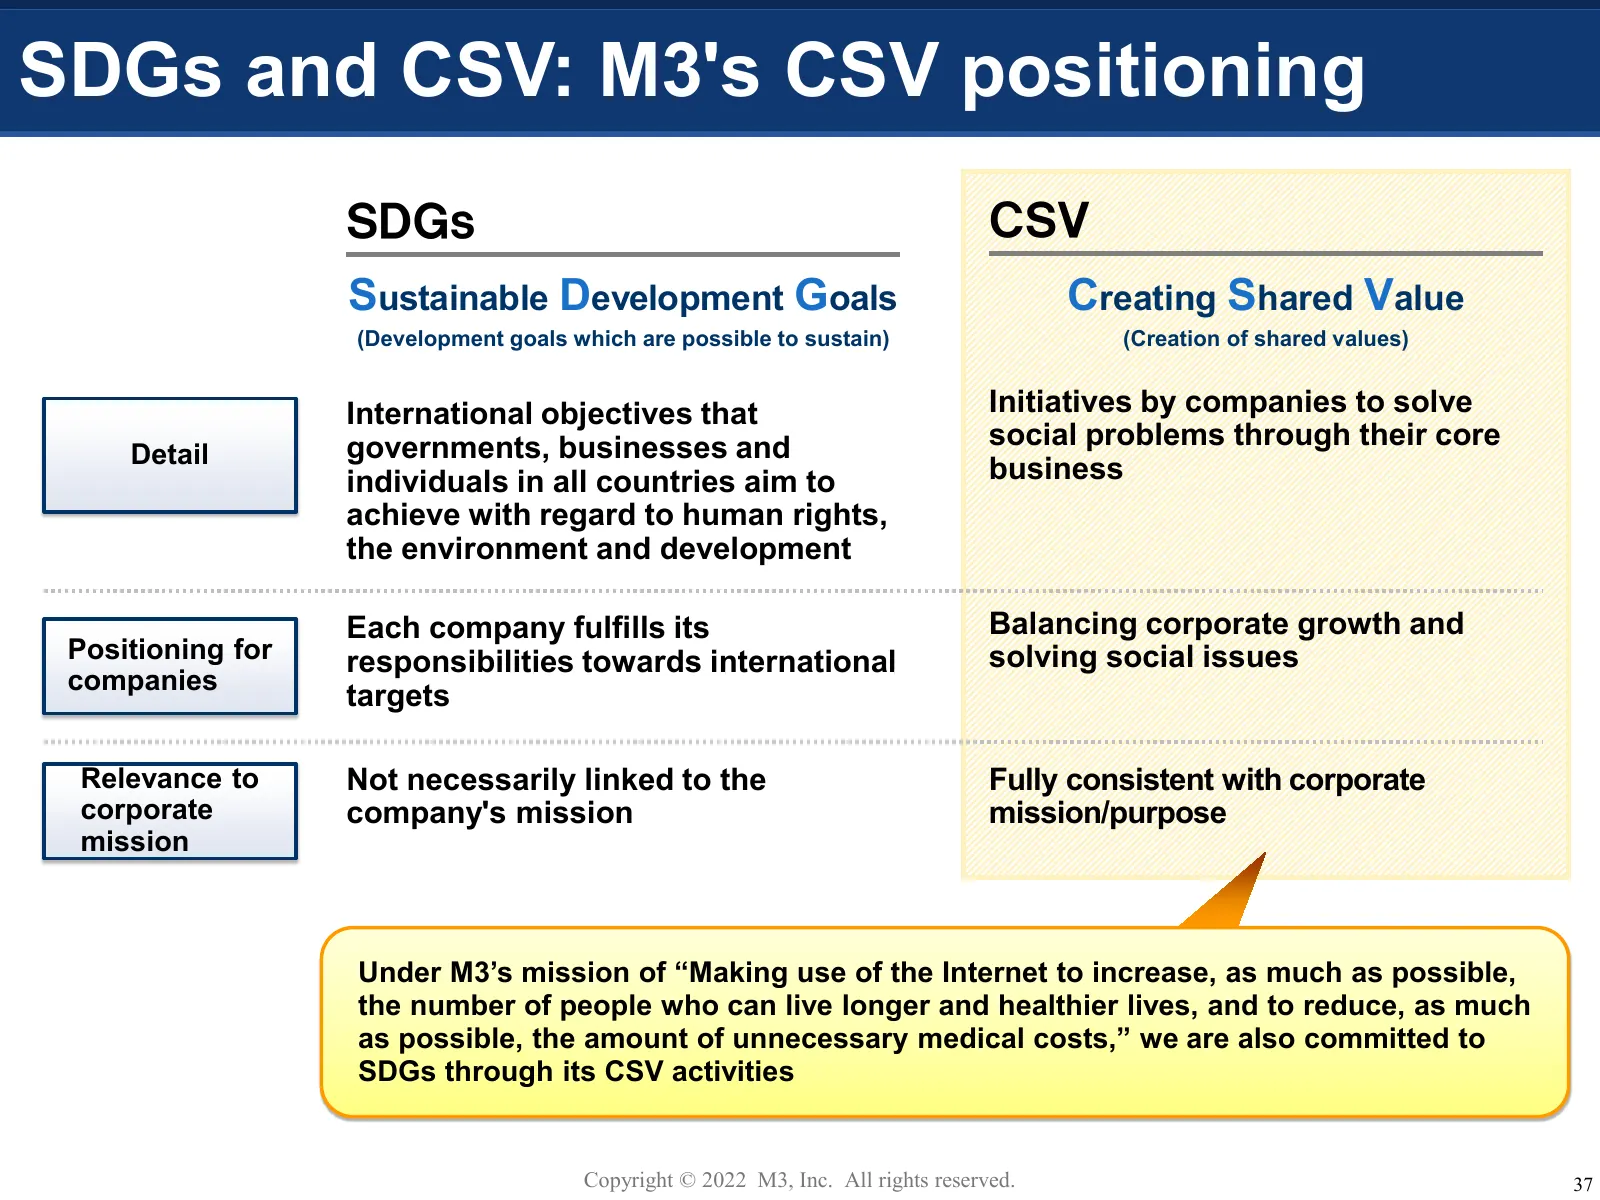
SDGs and CSV: M3's CSV positioning SDGs CSV Sustainable Development Goals Creating Shared Value (Development goals which are possible to sustain) (Creation of shared values) International objectives that Initiatives by companies to solve governments, businesses and social problems through their core
Slide 39: COVID Vaccine and Treatment Related Initiatives
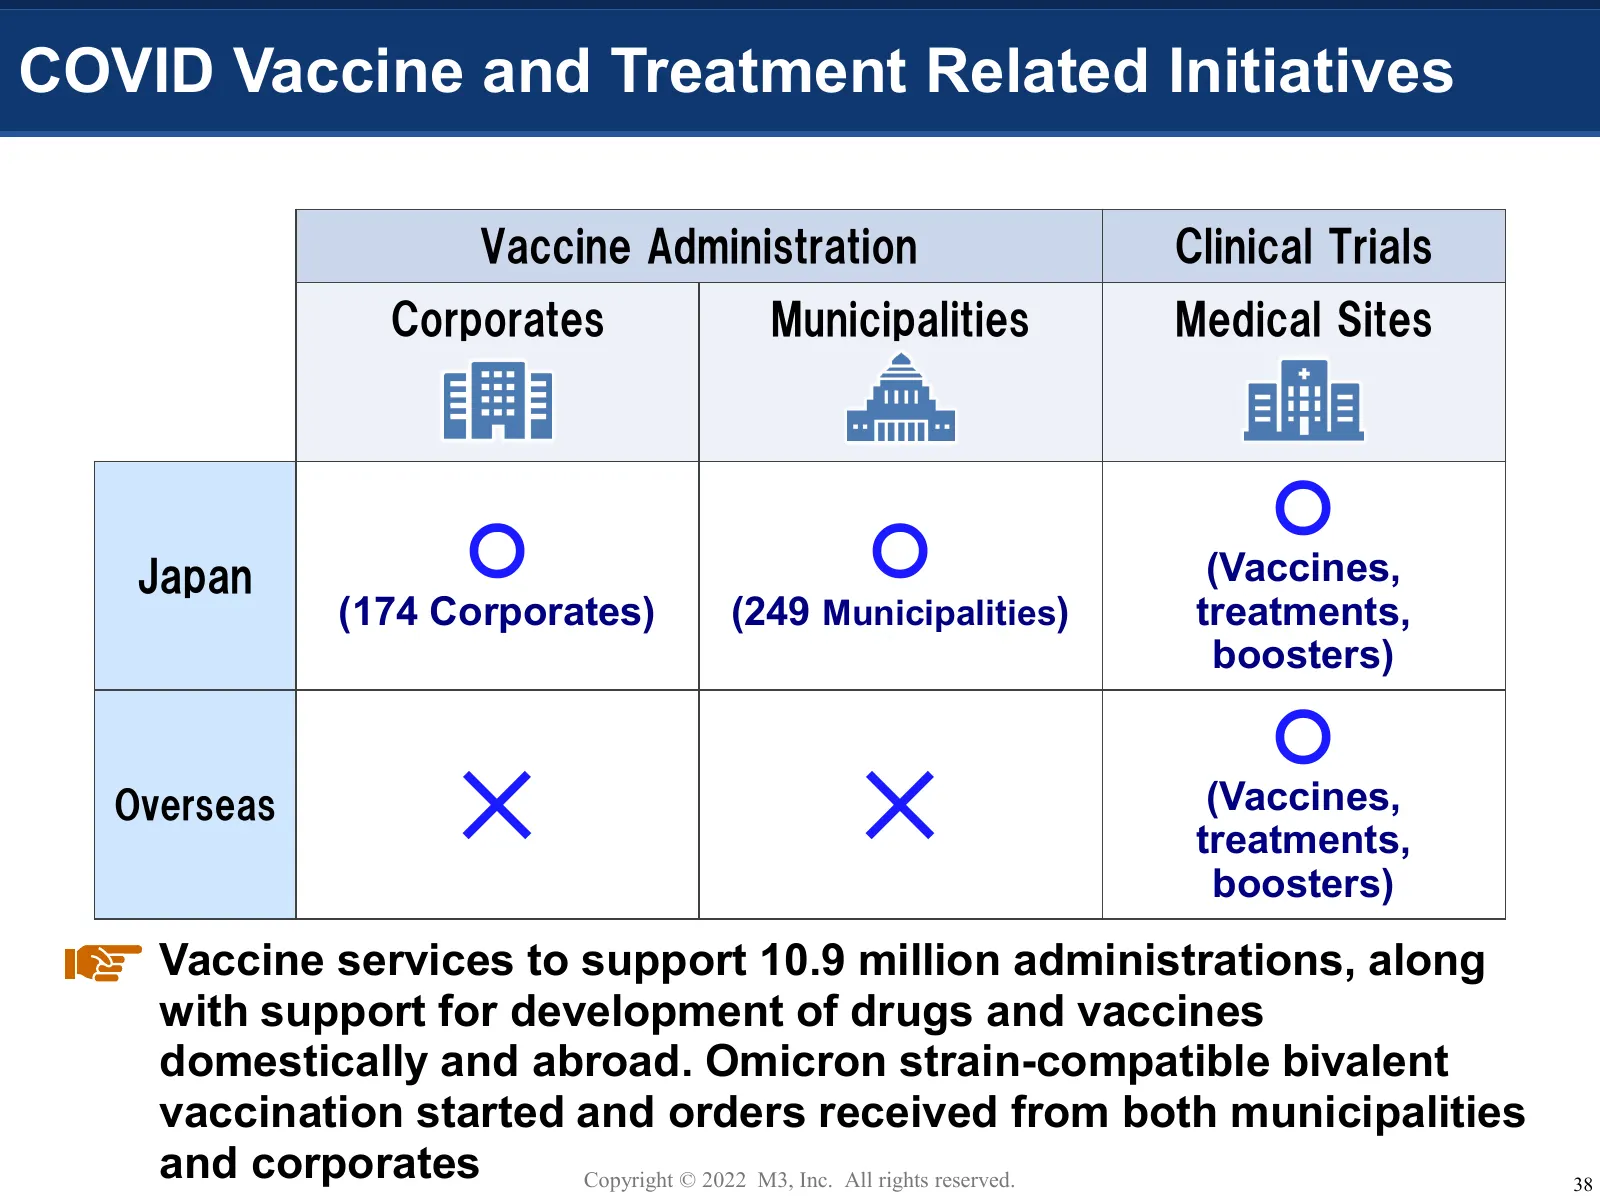
COVID Vaccine and Treatment Related Initiatives Vaccine Administration Clinical Trials Corporates Municipalities Medical Sites 〇 Japan 〇 〇 (Vaccines, (174 Corporates) (249 Municipalities) treatments, boosters) 〇 Overseas ✕ ✕ (Vaccines, treatments, boosters) Vaccine services to support 10.9 million a
Slide 40: M3's CSV Impact for Patients
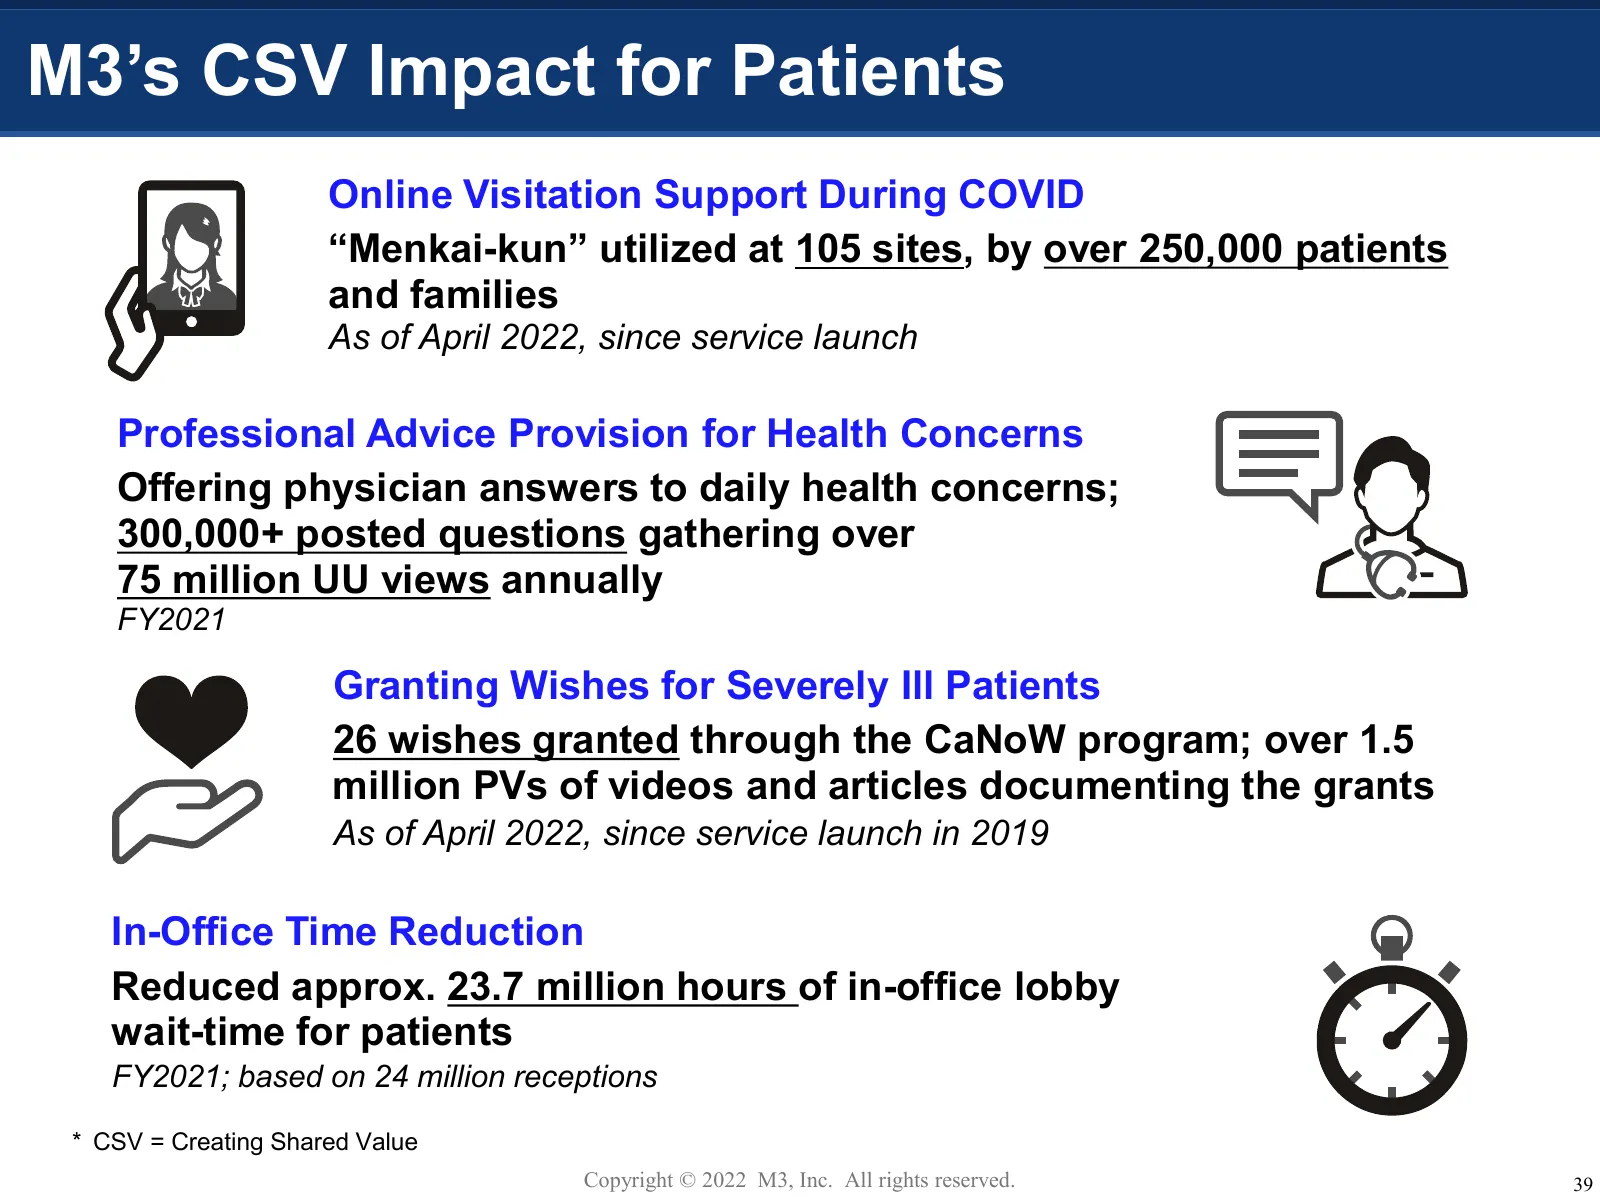
M3’s CSV Impact for Patients Online Visitation Support During COVID “Menkai-kun” utilized at 105 sites, by over 250,000 patients and families As of April 2022, since service launch Professional Advice Provision for Health Concerns Offering physician answers to daily health concerns; 300,000+ posted
Slide 41: M3's CSV Impact for Medical Professionals
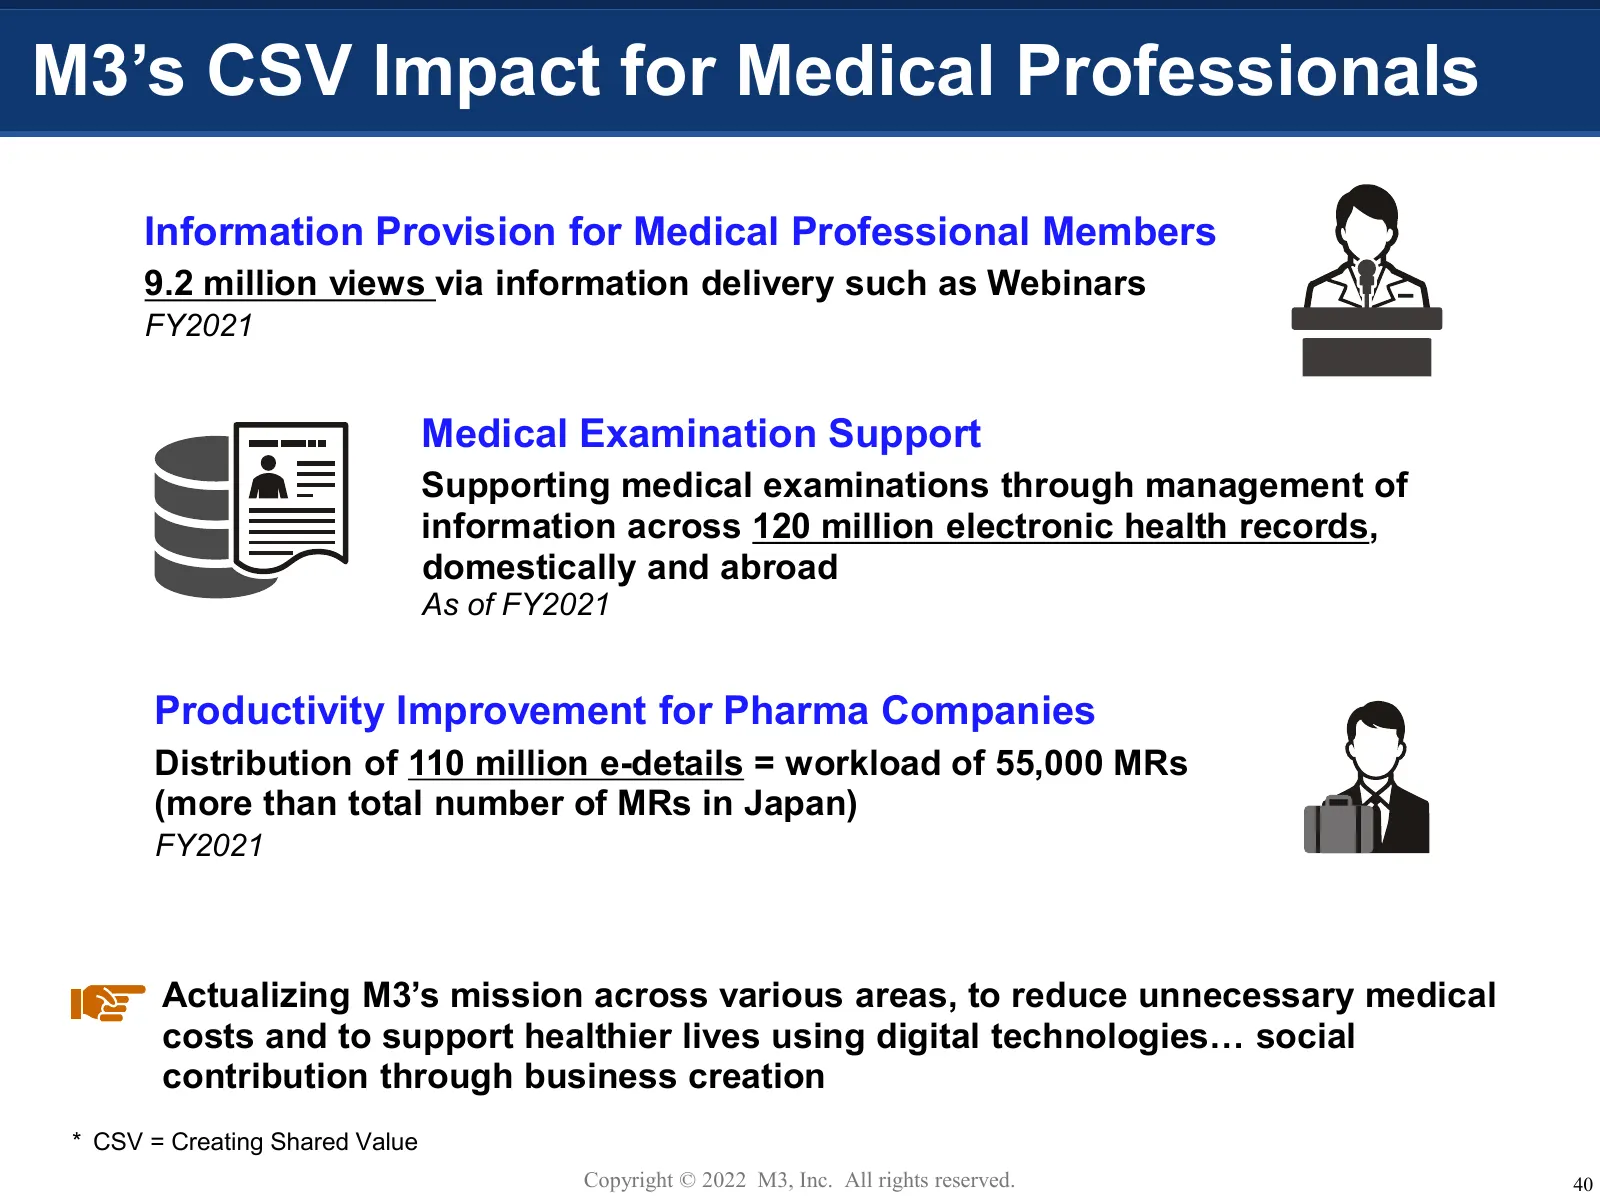
M3’s CSV Impact for Medical Professionals Information Provision for Medical Professional Members 9.2 million views via information delivery such as Webinars FY2021 Medical Examination Support Supporting medical examinations through management of information across 120 million electronic health recor
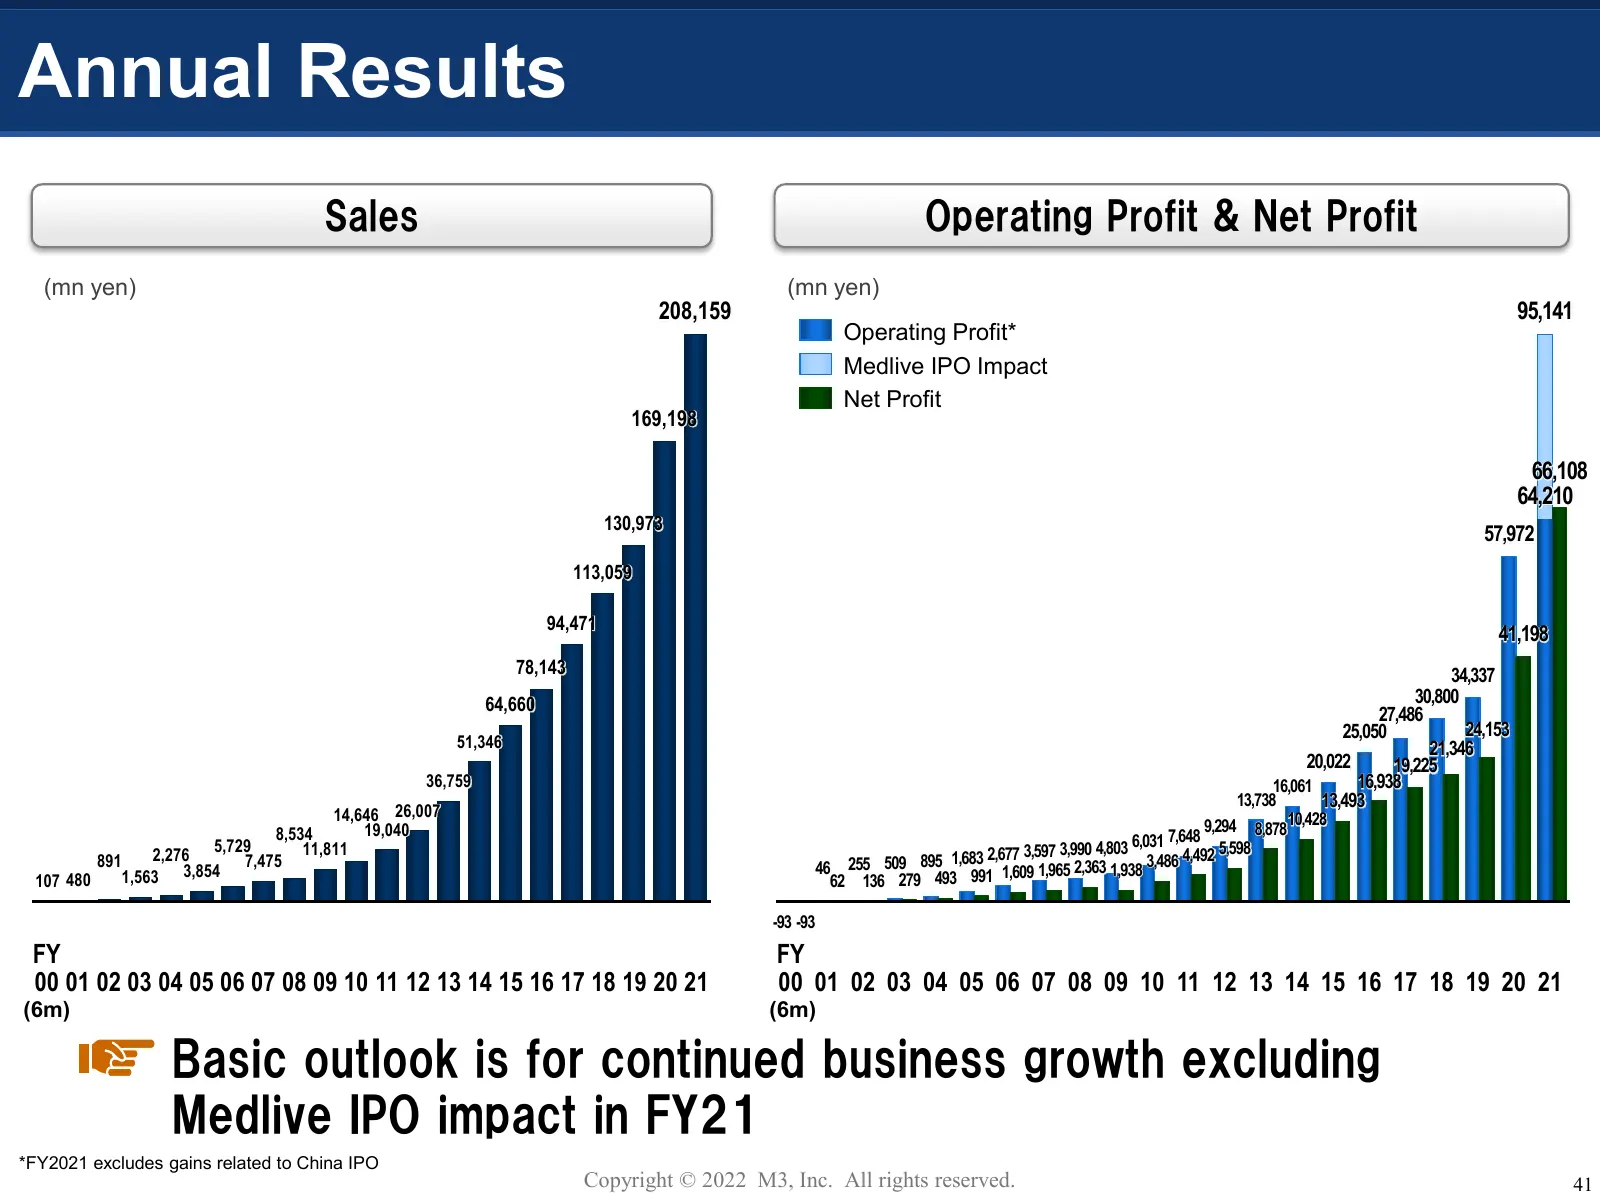
Slide 42: Annual Results
Annual Results Sales Operating Profit & Net Profit (mn yen) (mn yen) 208,159 95,141 Operating Profit* Medlive IPO Impact Net Profit 169,198 66,108 64,210 130,973 57,972 113,059 94,471 41,198 78,143 34,337 64,660 30,800 27,486 25,050 24,153 51,346 21,346 20,022 19,225 36,759 16,061 16,938 13,738 13,4
Source: Internet Archive copy of corporate.m3.com
More decks from M3, Inc.
 Investor Presentation (November 2026)8 slides · Nov 20, 2026
 H1 FY2026 Earnings Presentation44 slides · Nov 4, 2026
 Q2 FY2026 Earnings Presentation44 slides · Nov 4, 2026
 Q1 FY2026 Earnings Presentation42 slides · Aug 6, 2026
 Merger or Acquisition (June 2026)14 slides · Jun 5, 2026
 FY2025 Earnings Presentation54 slides · May 1, 2026