Superior Drilling Products Inc
Superior Drilling Products — FY2019 Earnings Presentation
15 slides from Superior Drilling Products's earnings presentation, Mar 12, 2020
Slide 1: Fourth Quarter and Full Year 2019 Financial Results Conference Call
Wy SUPERIOR DRILLING PRODUCTS FOURTH QUARTER AND FULL YEAR 2019 FINANCIAL RESULTS CONFERENCE CALL MARCH 12, 2020 NYSE American: SDPI www.sdpi.com
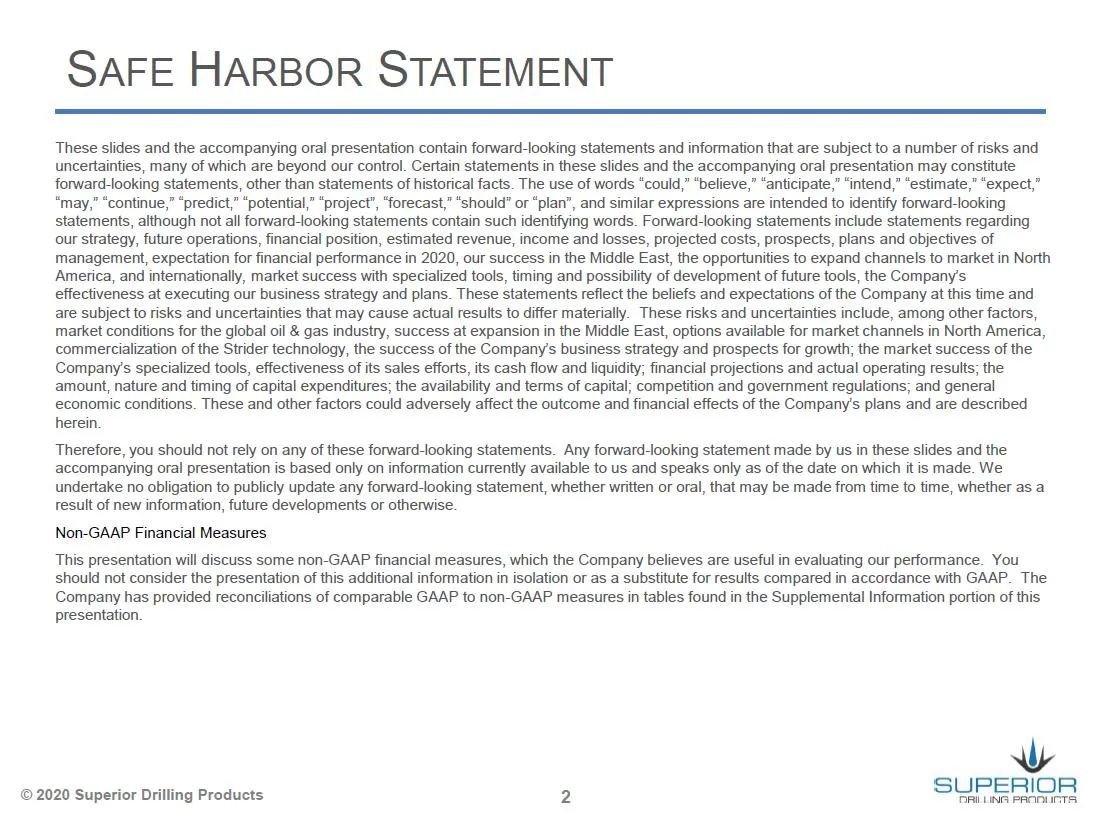
Slide 2: Safe Harbor Statement
SAFE HARBOR STATEMENT These slides and the accompanying oral presentation contain forward-looking statements and information that are subject to a number of risks and uncertainties, many of which are beyond our control. Certain statements in these slides and the accompanying oral presentation may co
Slide 3: Troy Meier, Chairman and Chief Executive Officer
Wy SUPERIOR DRILLING PRODUCTS TROY MEIER CHAIRMAN AND CHIEF EXECUTIVE OFFICER © 2020 Superior Drilling Products
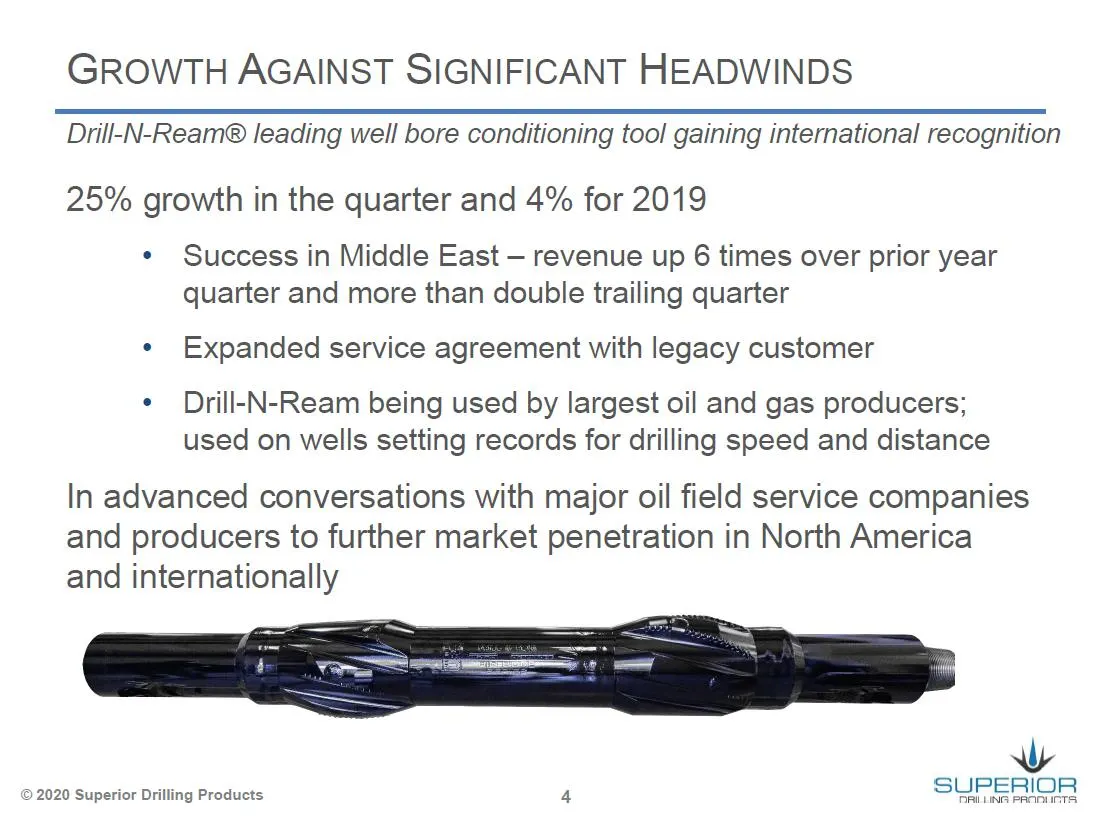
Slide 4: Growth Against Significant Headwinds
GROWTH AGAINST SIGNIFICANT HEADWINDS Drill-N-Ream® leading well bore conditioning tool gaining international recognition 25% growth in the quarter and 4% for 2019 « Success in Middle East — revenue up 6 times over prior year quarter and more than double trailing quarter « Expanded service agreement
Slide 5: Christopher Cashion, Chief Financial Officer
Wy SUPERIOR DRILLING PRODUCTS CHRISTOPHER CASHION CHIEF FINANCIAL OFFICER
Slide 6: Revenue
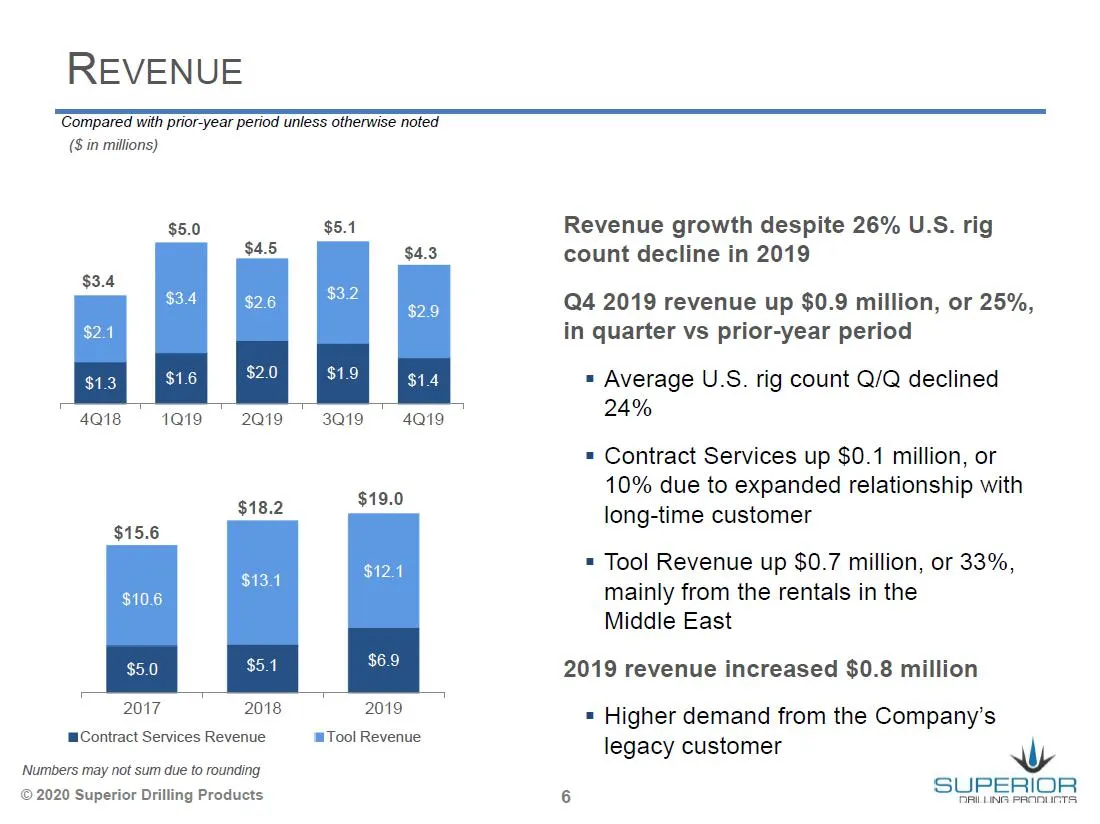
REVENUE ‘Compared with prior-year period unless otherwise noted (8 in millions) $5.0 $5.1 4018 1019 2Q19 3019 4019 $18.2 $19.0 $15.6 $13.1 $5.4 2017 2018 2019 Contract Services Revenue ®Tool Revenue Numbers may not sum due to rounding © 2020 Superior Drilling Products Revenue growth despite 26% U.S.
Slide 7: Tool Revenue
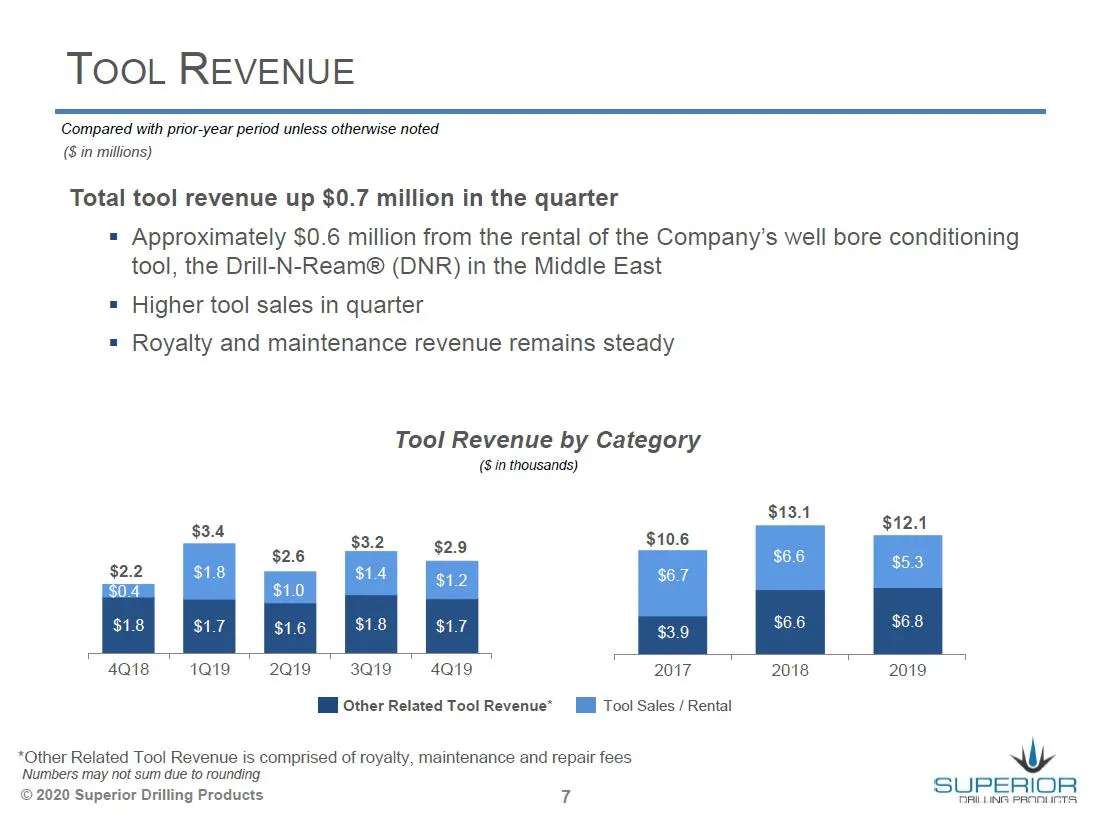
TOOL REVENUE Compared with prior-year period unless otherwise noted (8 in millions) Total tool revenue up $0.7 million in the quarter = Approximately $0.6 million from the rental of the Company’s well bore conditioning tool, the Drill-N-Ream® (DNR) in the Middle East = Higher tool sales in quarter =
Slide 8: Investments in Growth
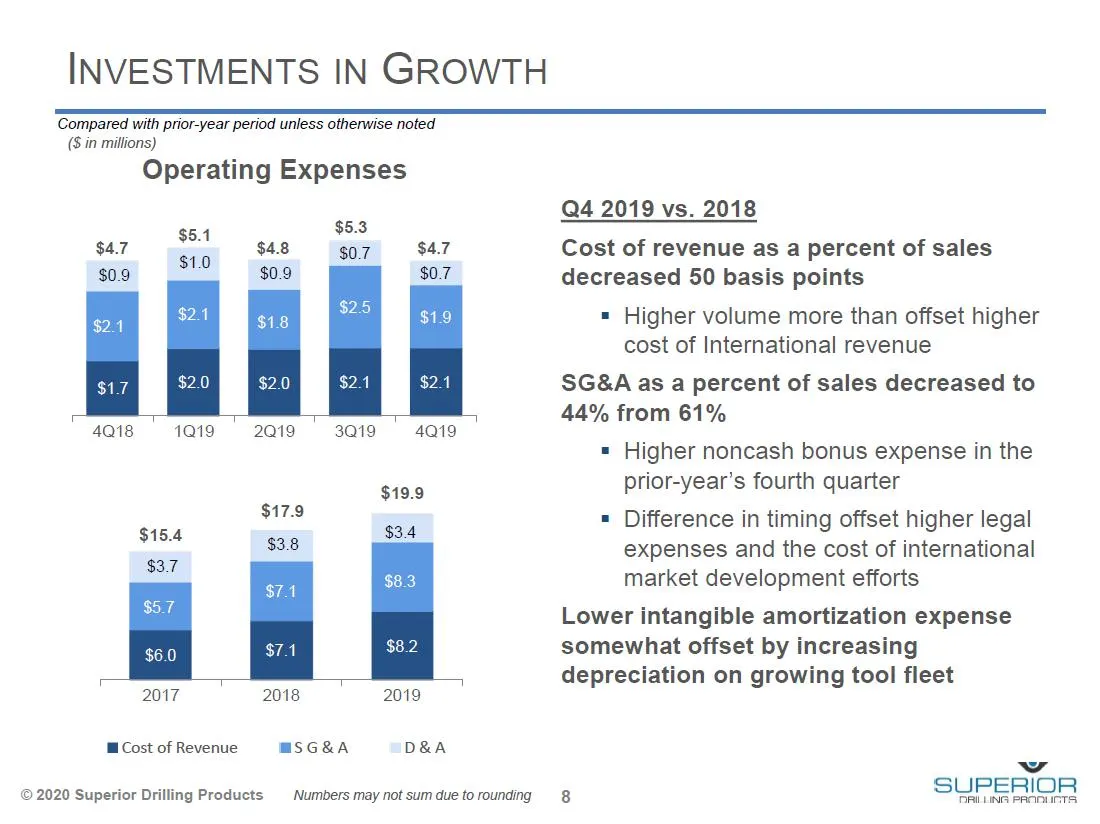
INVESTMENTS IN GROWTH ‘Compared with prior-year period unless otherwise noted (S in millions) Operating Expenses $5.3 $0.7 $5.1 $1.0 $4.7 $4.8 $0.9 4ais " 1a19 " 2Q19 ' 3ai9 " 4at9 $19.9 $17.9 oF $34 $71 $74 “2017-2018 ' Cost of Revenue MSG&A D&A © 2020 Superior Drilling Products Numbers may not sum
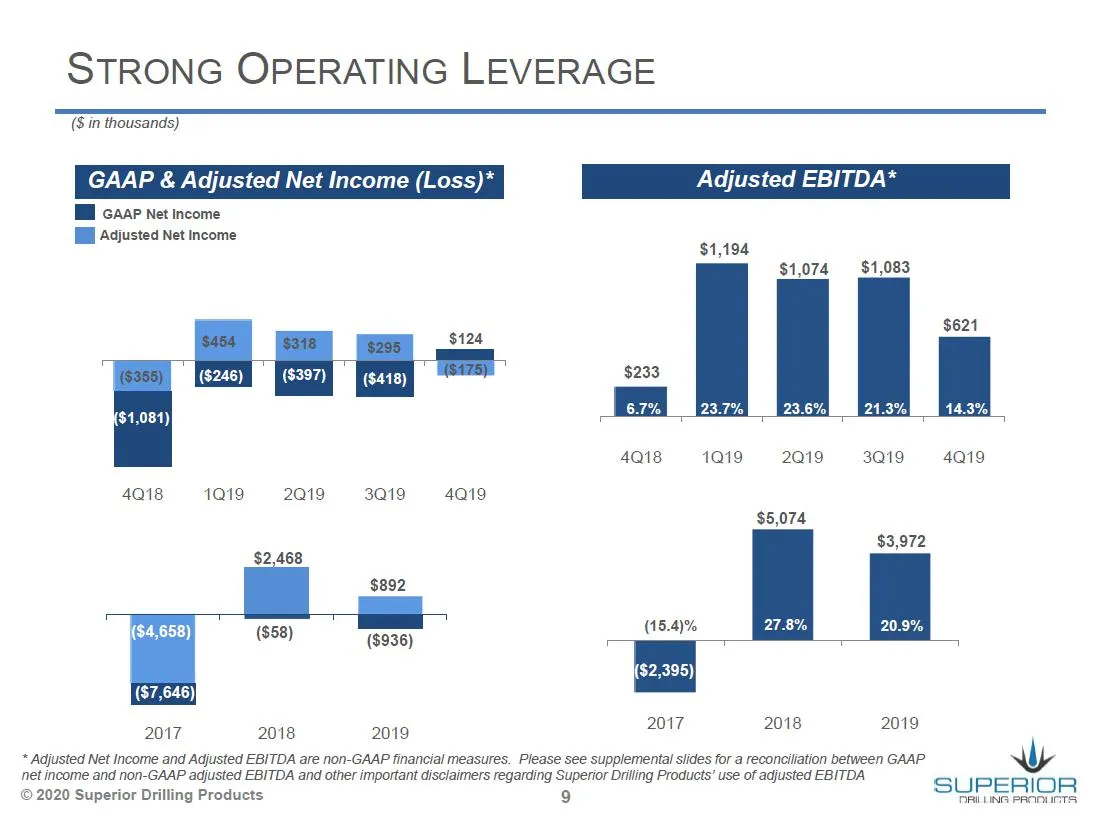
Slide 9: Strong Operating Leverage
STRONG OPERATING LEVERAGE (Sin thousands) GAAP & Adjusted Net Income (Loss)* Adjusted EBITDA* I caap Net Income [il Adjusted Net Income $1,194 $1,074 $1,083 ($248) [Mj ($397) ($418) 4Q18 1019 2Q19 3Q19 4Q19 4Q18 1Q19 2019 3019 4Q19 $5,074 $3,972 $2,468 _ ($58) ToT (15.4)% 27.8 20.9% Bote Sati cree]
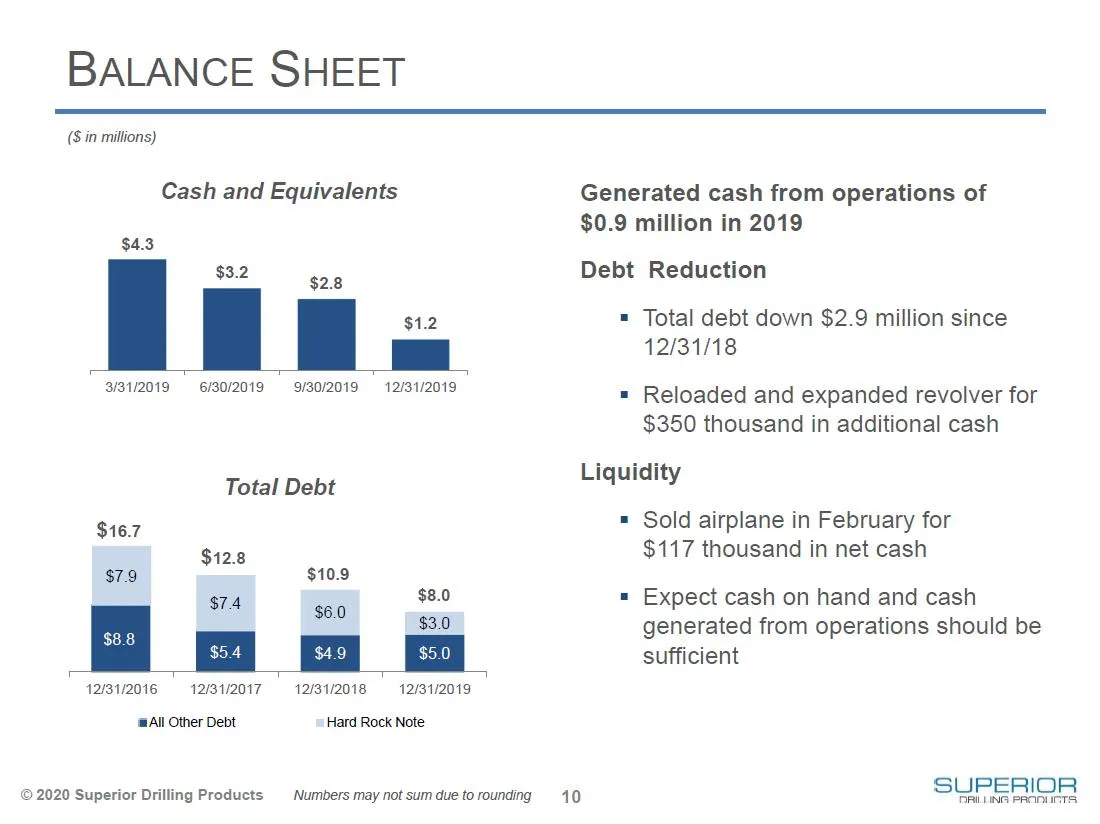
Slide 10: Balance Sheet
BALANCE SHEET (Sin millions) Cash and Equivalents $4.3 $3.2 3/31/2019 6/30/2019 $2.8 $1.2 9/30/2019 12/31/2019 Total Debt $16.7 $12.8 $79 $10.9 $74 eae 12/31/2016 12/31/2017 ‘All Other Debt © 2020 Superior Drilling Products 12/31/2018 12/31/2019 Hard Rock Note ‘Numbers may not sum due to rounding Ge
Slide 11: Supplemental Information
Wy SUPERIOR DRILLING PRODUCTS SUPPLEMENTAL INFORMATION
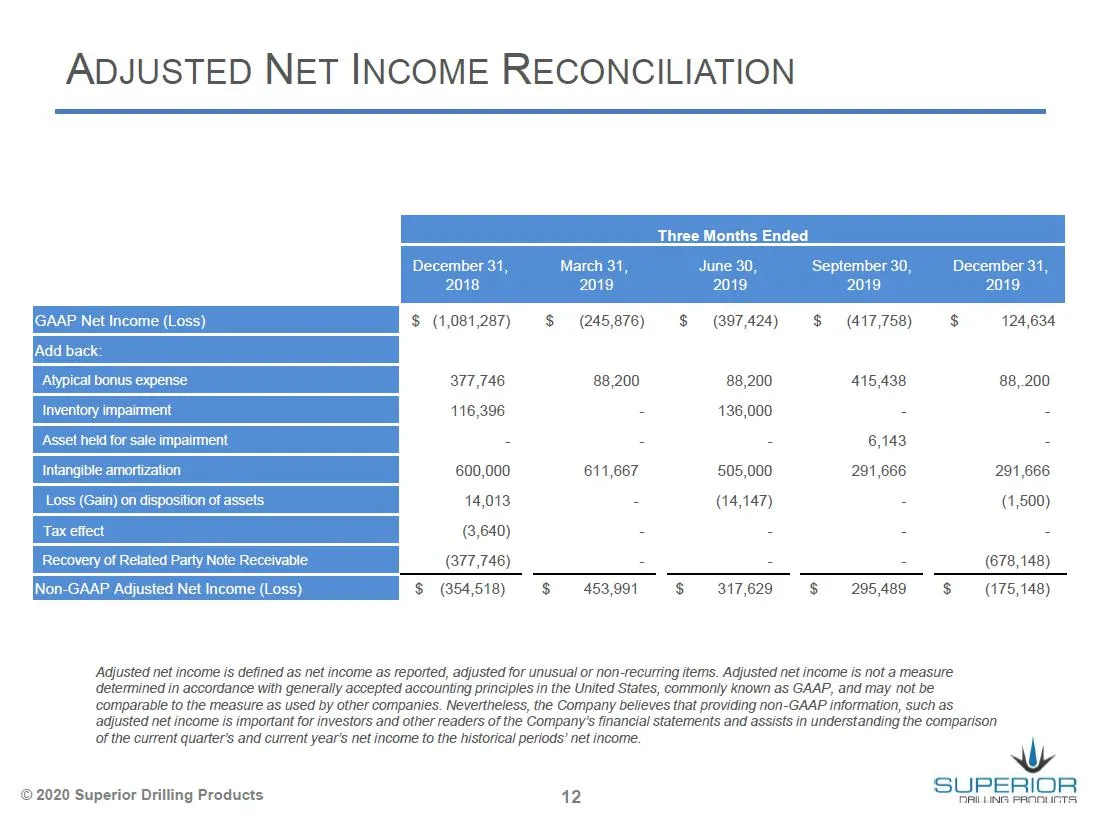
Slide 12: Adjusted Net Income Reconciliation
ADJUSTED NET INCOME RECONCILIATION December 31 20: $ (1,081,287) $ (245,876) $ (397,424) $ (417,758) $ 124,634 377,746 88,200 88,200 415,438 88,.200 600,000 611,667 505,000 291,666 291,666 14,013 ad (14,147) a (4,500) eH , ; ; err ; rae Non-GAAP Adjusted Net Income (Loss) $ (354,518) $ 453991 $ 3176
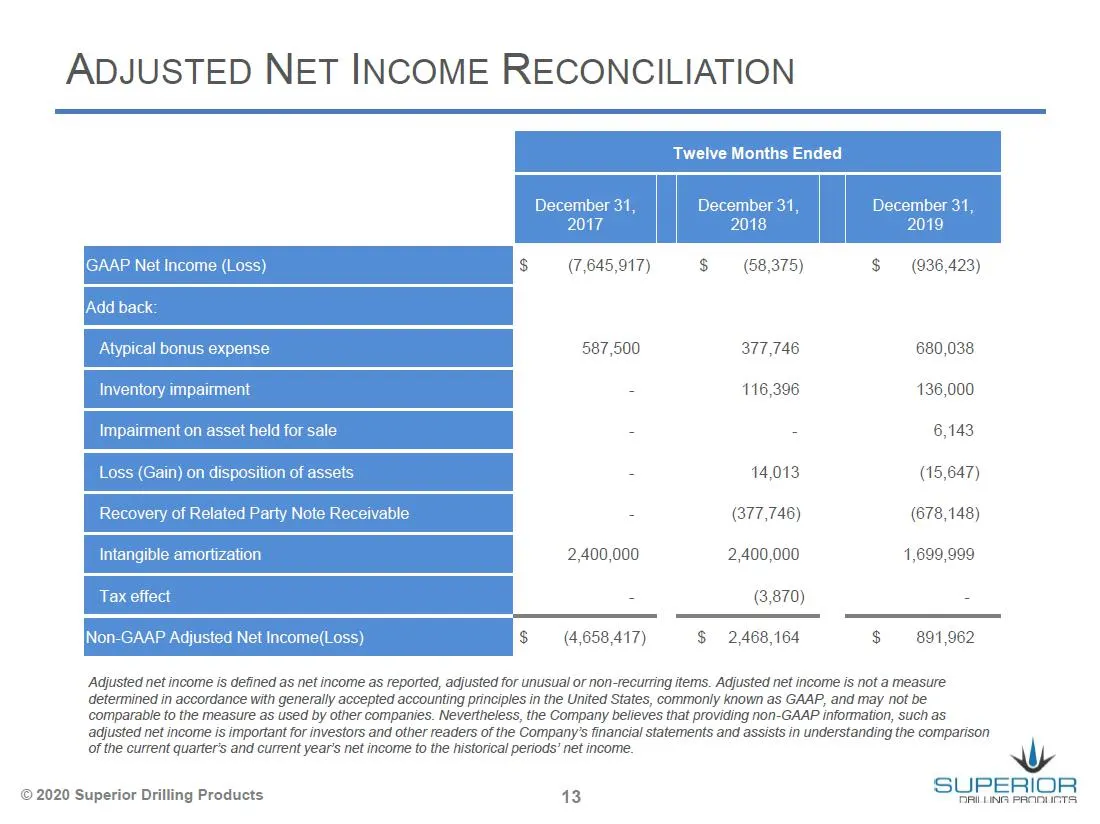
Slide 13: Adjusted Net Income Reconciliation
ADJUSTED NET INCOME RECONCILIATION December 31, December 31, December 2 2017 2018 2 (7,645,917) $ (68,375) $ (936,423) Add back: Atypical bonus expense 587,500 377,746 680,038 Inventory impairment : 116,396 136,000 Impairment on asset held for sale - - 6,143 . 14,013 (15,647) “ (377,746) (678,148) 2
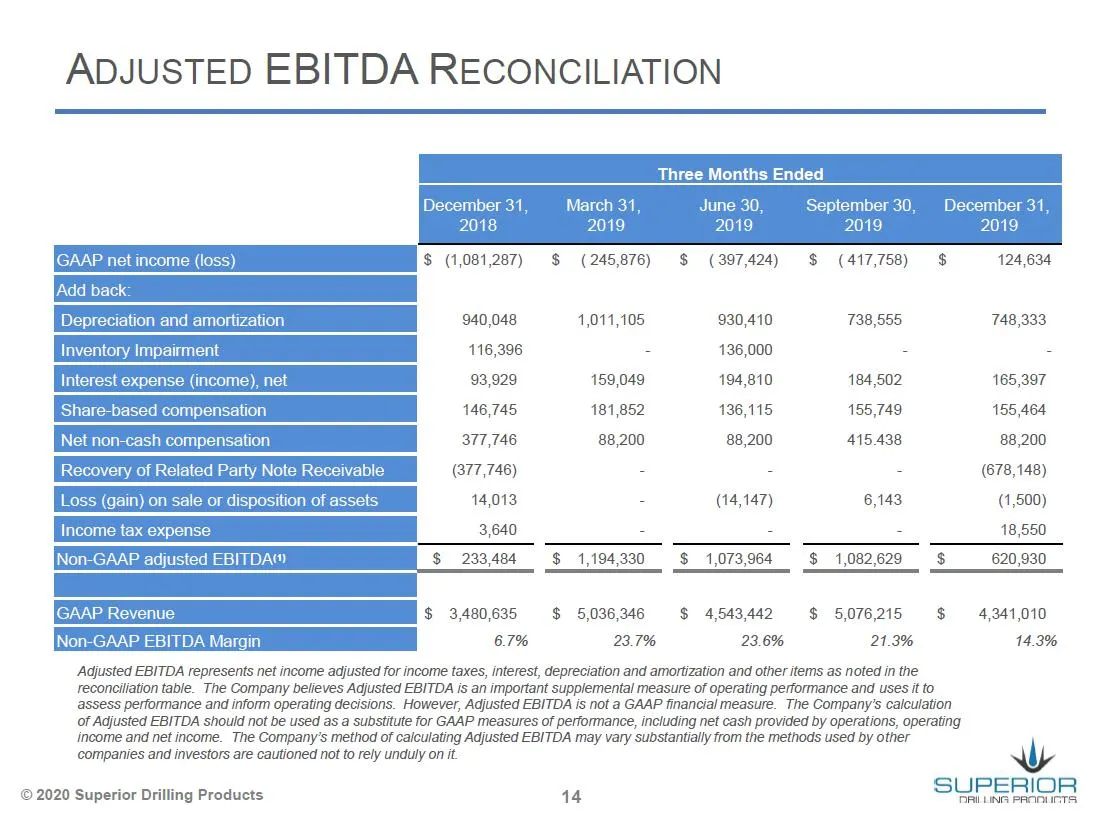
Slide 14: Adjusted EBITDA Reconciliation
© 2020 Superior Dri ADJUSTED EBITDA RECONCILIATION Three Months Ended December 31, March 31 June 30, 2018 2019 2019 |GAAP net income (loss) $ (1,081,287) $ (245,876) $ ition and amortizati 940,048 1,011,105 930,410 738,555 748,333 (397,424) $ (417,758) Impairment 116,396 = 136,000 = = Interest expen
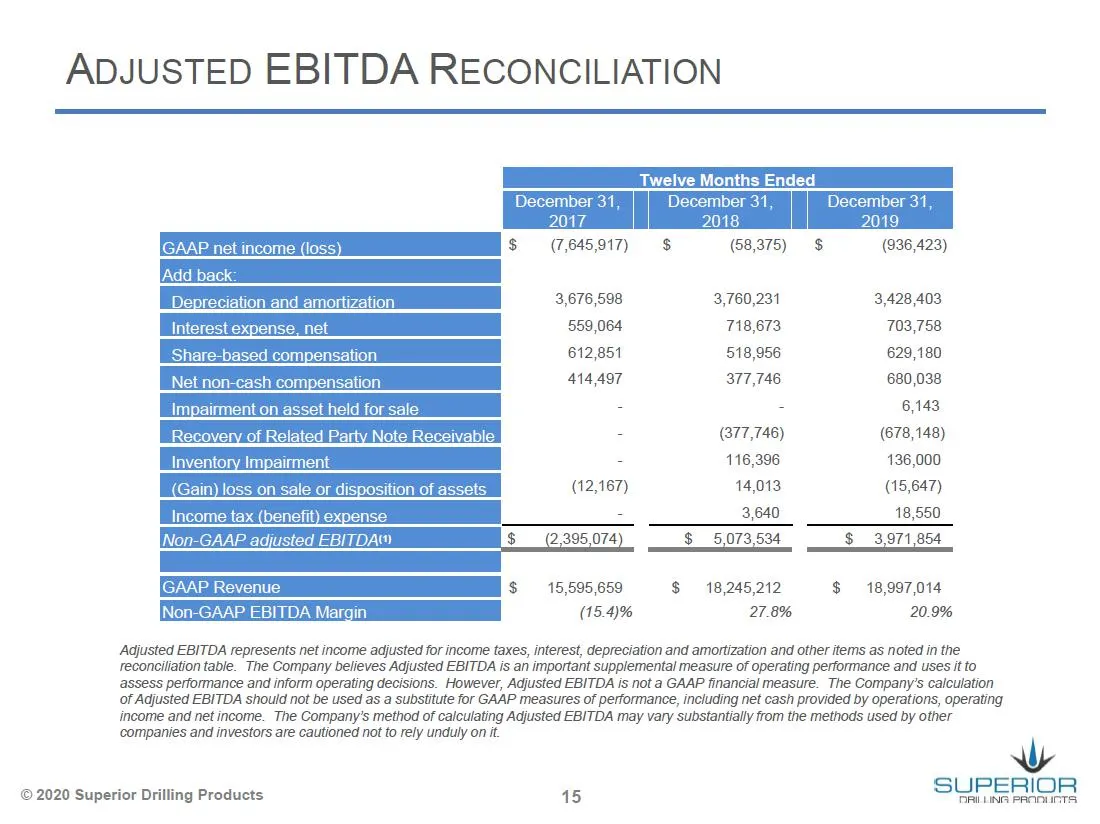
Slide 15: Adjusted EBITDA Reconciliation
ADJUSTED EBITDA RECONCILIATION (68,375) $ 3,676,598 3,760,231 3,428,403 559,064 718,673 703,758 612,851 518,956 629,180 414,497 377,746 680,038 Impairment on asset held for sale - - 6,143 eae # (377,746) (678,148) 2 116,396 136,000 : & (12,167) 14,013 (15,647) Income tax (benefit) expense. - 3,640 1
Source: SEC EDGAR · 8-K filed Mar 12, 2020
More decks from Superior Drilling Products Inc
 Q3 2023 Earnings Presentation12 slides · Nov 9, 2023
 Q2 2023 Earnings Presentation12 slides · Aug 14, 2023
 Q1 2023 Earnings Presentation12 slides · May 15, 2023
 FY2022 Earnings Presentation13 slides · Mar 10, 2023
 Q3 2022 Earnings Presentation12 slides · Nov 14, 2022
 MicroCap Rodeo Windy City Roundup 202220 slides · Oct 12, 2022