Dye & Durham Ltd. · TSX:DND
Dye & Durham — Q2 FY2023 Earnings Presentation
17 slides from Dye & Durham's earnings presentation, February 2023

Slide 1: 2023 Second Quarter Quarterly Results Presentation
2023 SECOND QUARTER QUARTERLY RESULTS PRESENTATION February 2023 When being certain is everything dyedurham.com
Slide 2: Disclaimer
DISCLAIMER This presentation has been prepared for informational purposes only. By accepting delivery of this presentation and/or attending the meeting where this presentation is made, you agree: (1) to keep strictly confidential the contents of this presentation and such other information and not t
Slide 3: Business Update
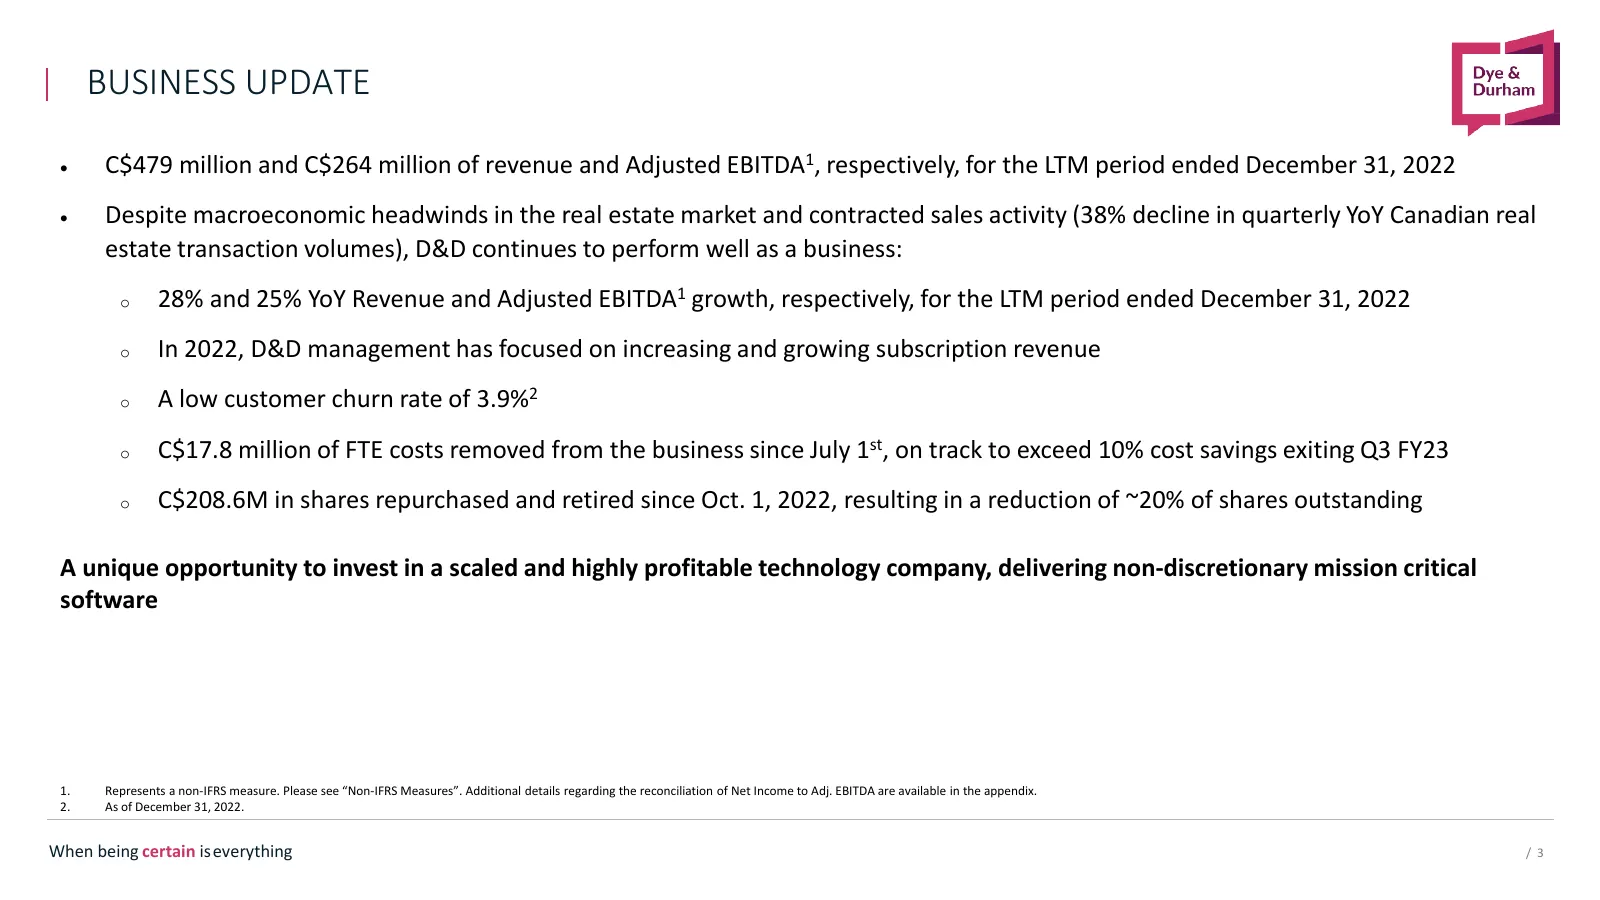
ibdroot\projects\IBD-NY\driveins2022\902367_1\Presentations\05. Lender Presentation\DND Private LP - November 2022_v26.pptx BUSINESS UPDATE • C$479 million and C$264 million of revenue and Adjusted EBITDA1, respectively, for the LTM period ended December 31, 2022 • Despite macroeconomic headwinds in
Slide 4: D&D at a Glance
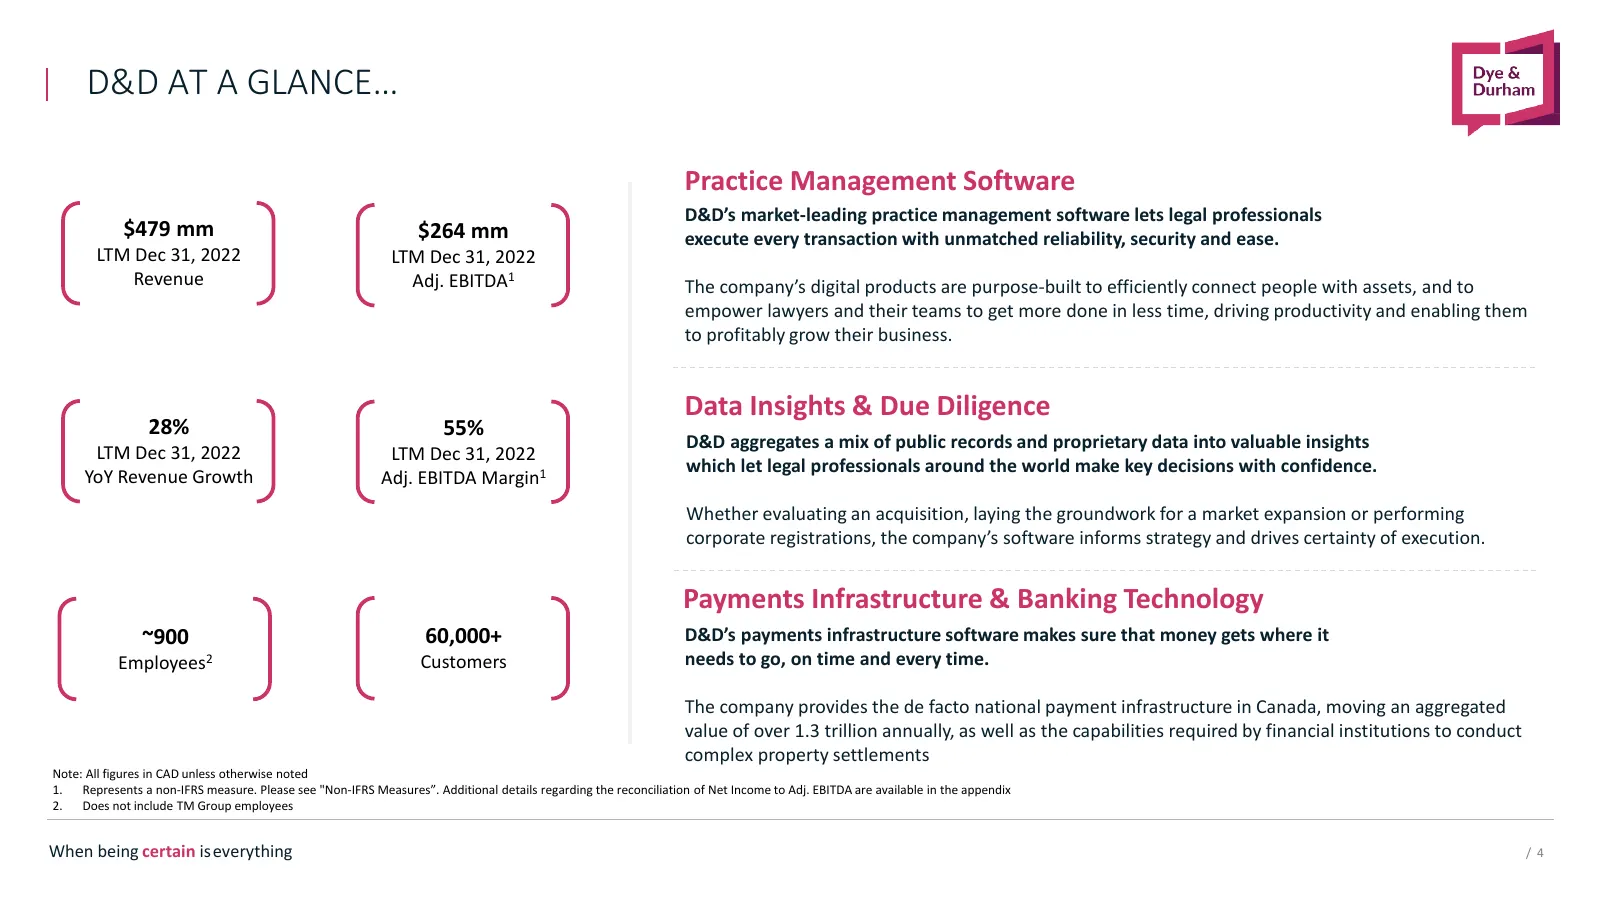
ibdroot\projects\IBD-NY\driveins2022\902367_1\Presentations\05. Lender Presentation\DND Private LP - November 2022_v26.pptx D&D AT A GLANCE… Practice Management Software D&D’s market-leading practice management software lets legal professionals $479 mm $264 mm execute every transaction with unmatche
Slide 5: Delivering on Our Commitments
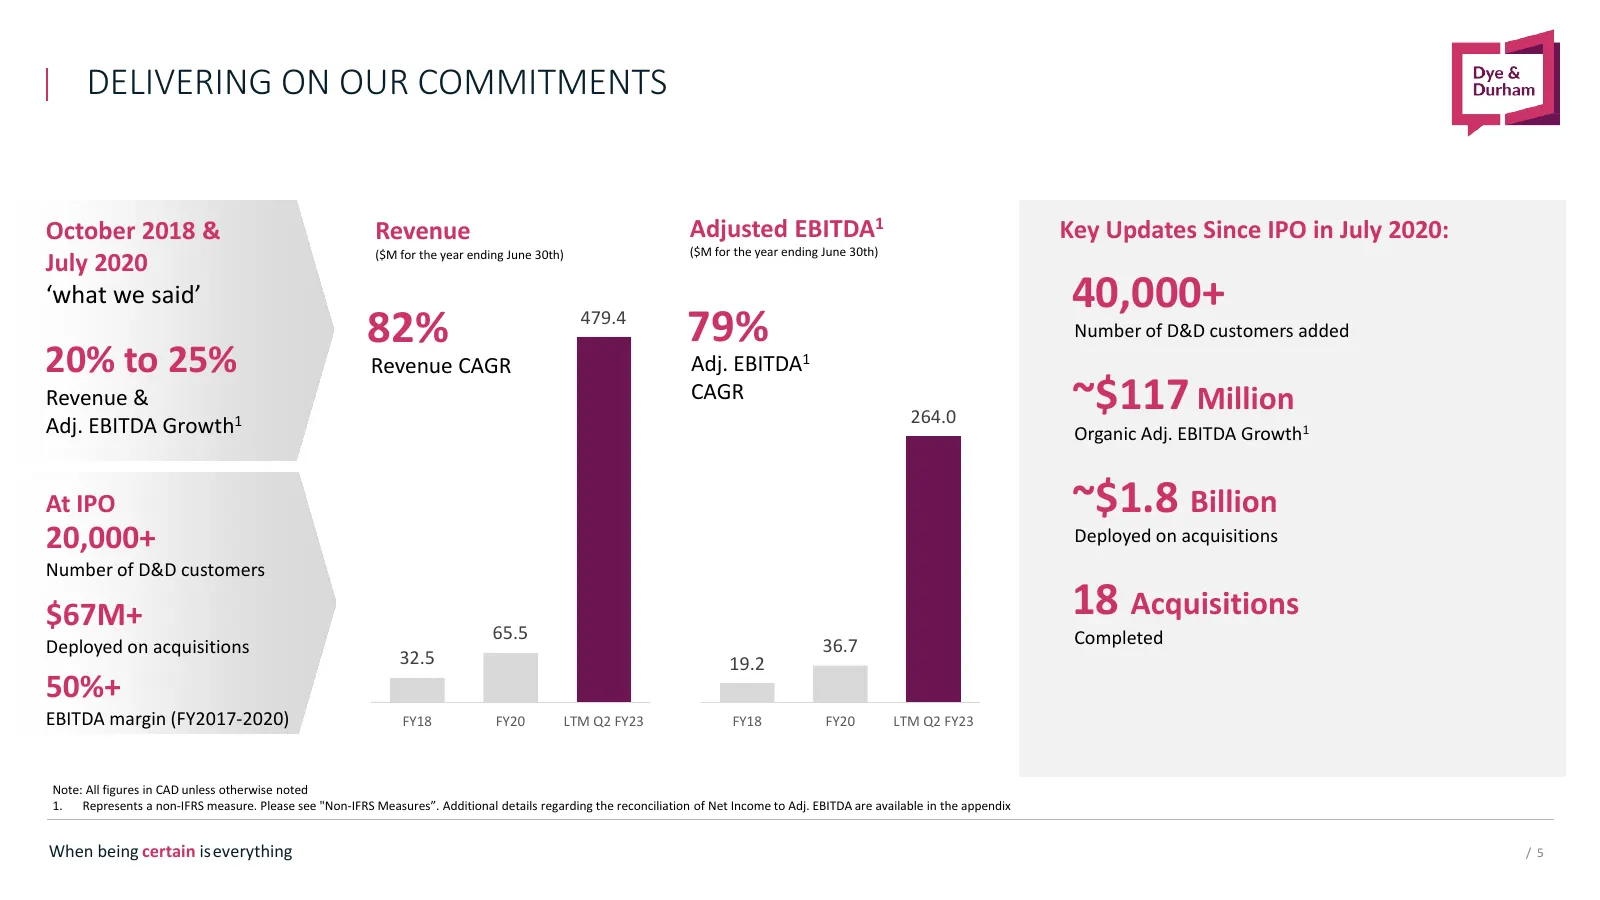
ibdroot\projects\IBD-NY\driveins2022\902367_1\Presentations\05. Lender Presentation\DND Private LP - November 2022_v26.pptx DELIVERING ON OUR COMMITMENTS October 2018 & Revenue Adjusted EBITDA1 Key Updates Since IPO in July 2020: ($M for the year ending June 30th) July 2020 ($M for the year ending J
Slide 6: Historical Real Estate Transactions
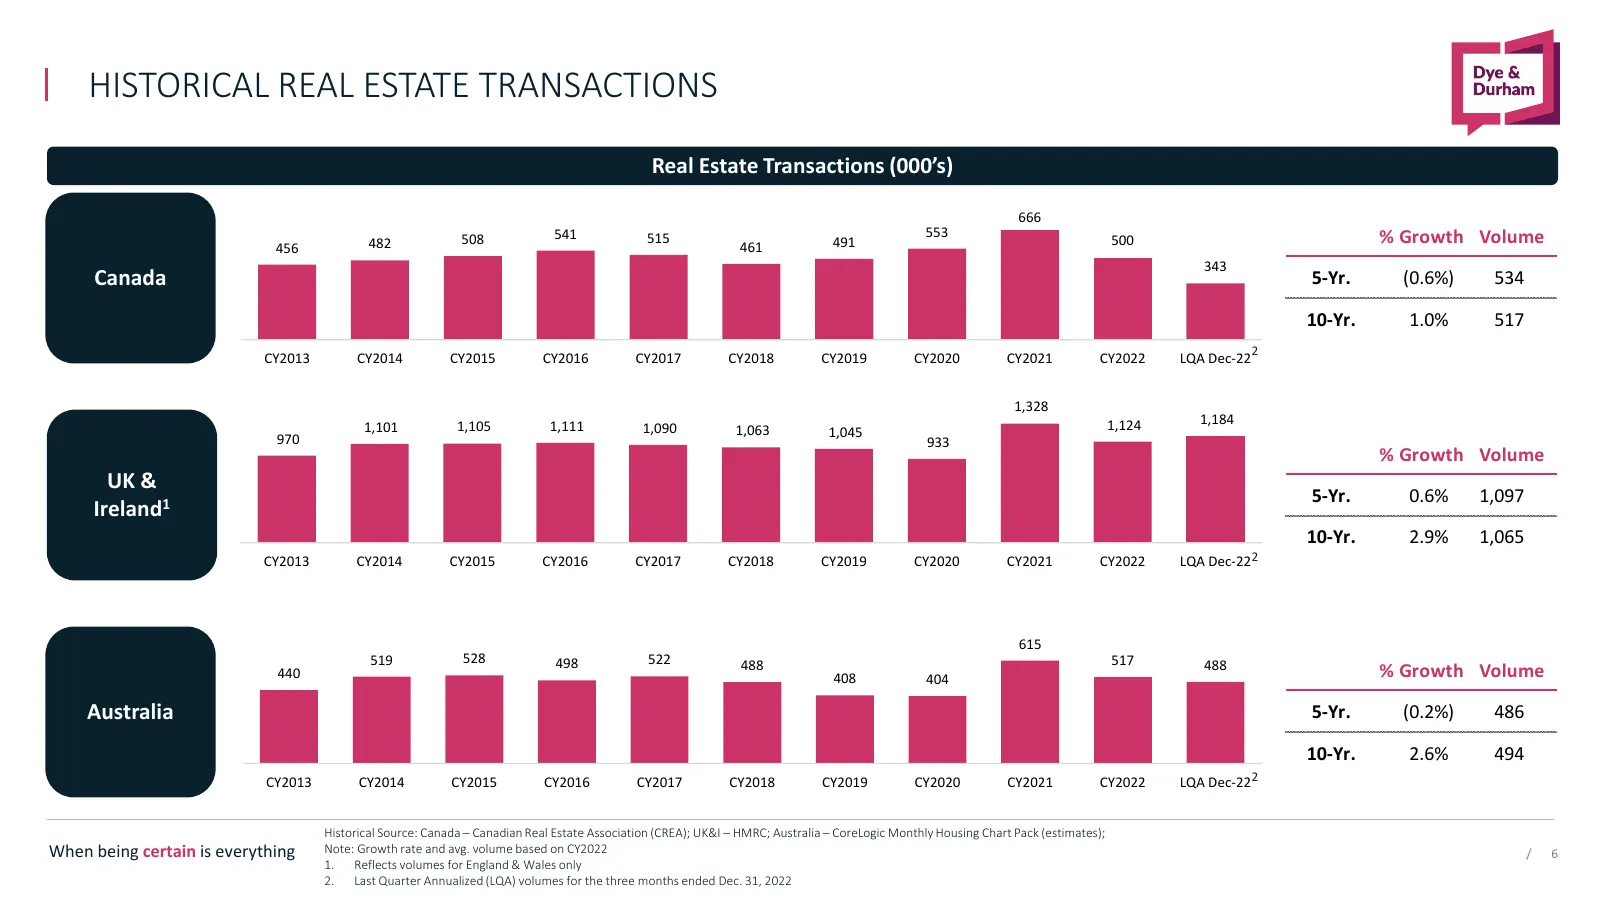
HISTORICAL REAL ESTATE TRANSACTIONS Real Estate Transactions (000’s) 666 508 541 515 553 % Growth Volume 456 482 461 491 500 343 Canada 71% 5-Yr. (0.6%) 534 Sep- YTD 10-Yr. 1.0% 517 2 CY2013 CY2014 CY2015 CY2016 CY2017 CY2018 CY2019 CY2020 CY2021 CY2022 LQA Dec-22 1,328 1,105 1,111 1,124 1,184 1,101
Slide 7: D&D Consistently Outperforms the Real Estate Market
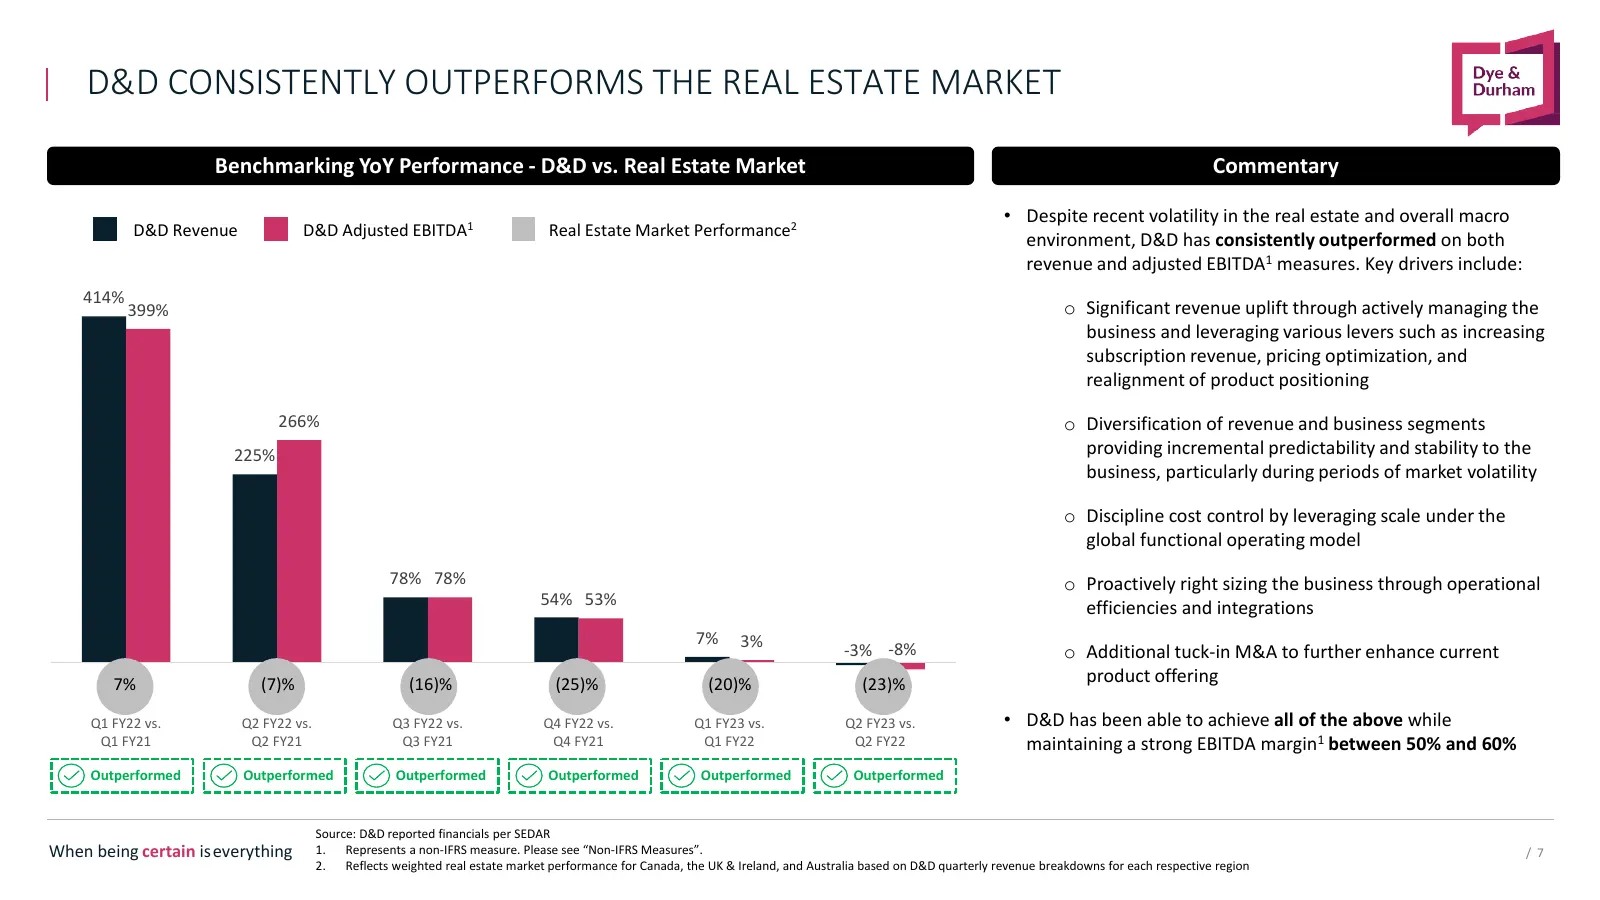
ibdroot\projects\IBD-NY\driveins2022\902367_1\Presentations\05. Lender Presentation\DND Private LP - November 2022_v26.pptx D&D CONSISTENTLY OUTPERFORMS THE REAL ESTATE MARKET Benchmarking YoY Performance - D&D vs. Real Estate Market Commentary • Despite recent volatility in the real estate and over
Slide 8: Illustrative Revenue Potential (Canada Only)
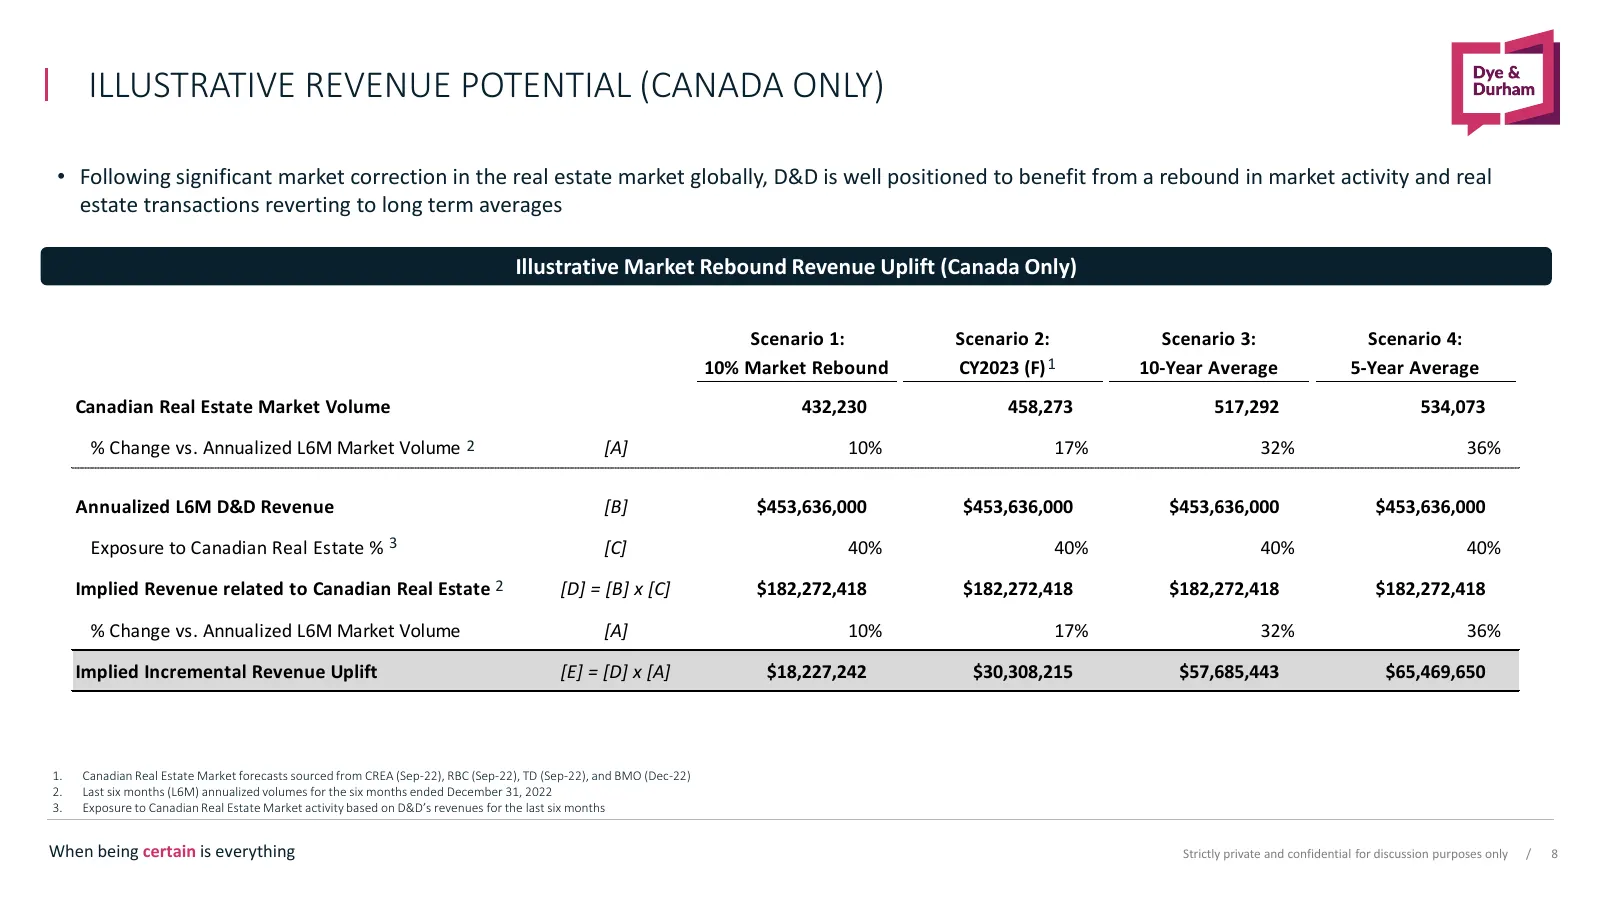
ILLUSTRATIVE REVENUE POTENTIAL (CANADA ONLY) • Following significant market correction in the real estate market globally, D&D is well positioned to benefit from a rebound in market activity and real estate transactions reverting to long term averages Illustrative Market Rebound Revenue Uplift (Cana
Slide 9: M&A Synergy Realization
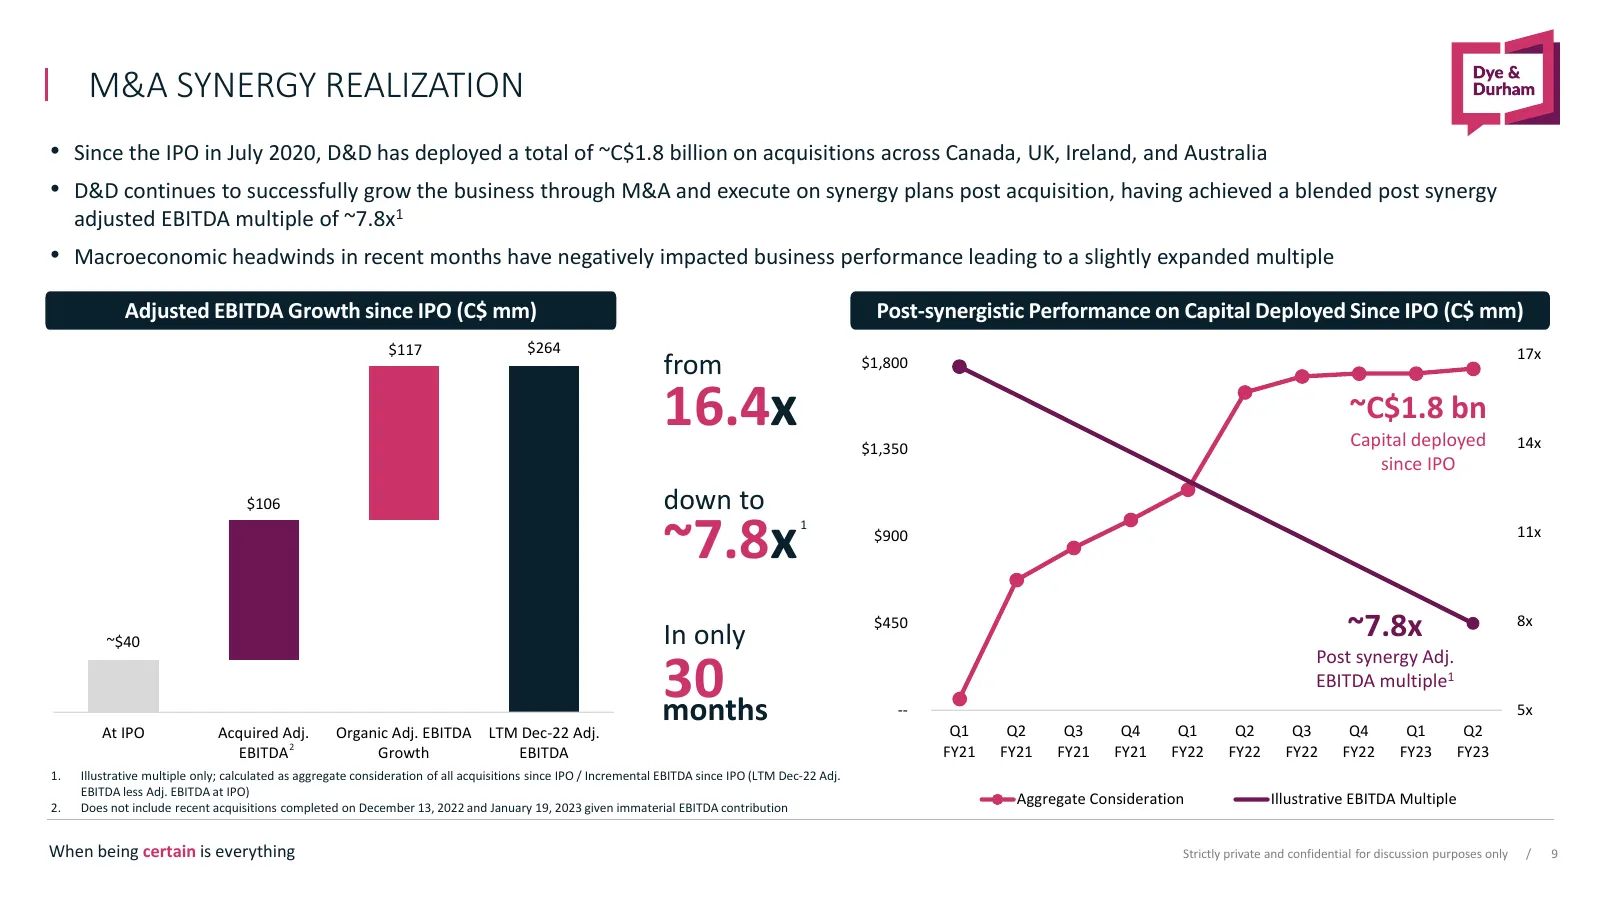
M&A SYNERGY REALIZATION • Since the IPO in July 2020, D&D has deployed a total of ~C$1.8 billion on acquisitions across Canada, UK, Ireland, and Australia • D&D continues to successfully grow the business through M&A and execute on synergy plans post acquisition, having achieved a blended post syner
Slide 10: Disciplined Cost Management and Executing on Synergies
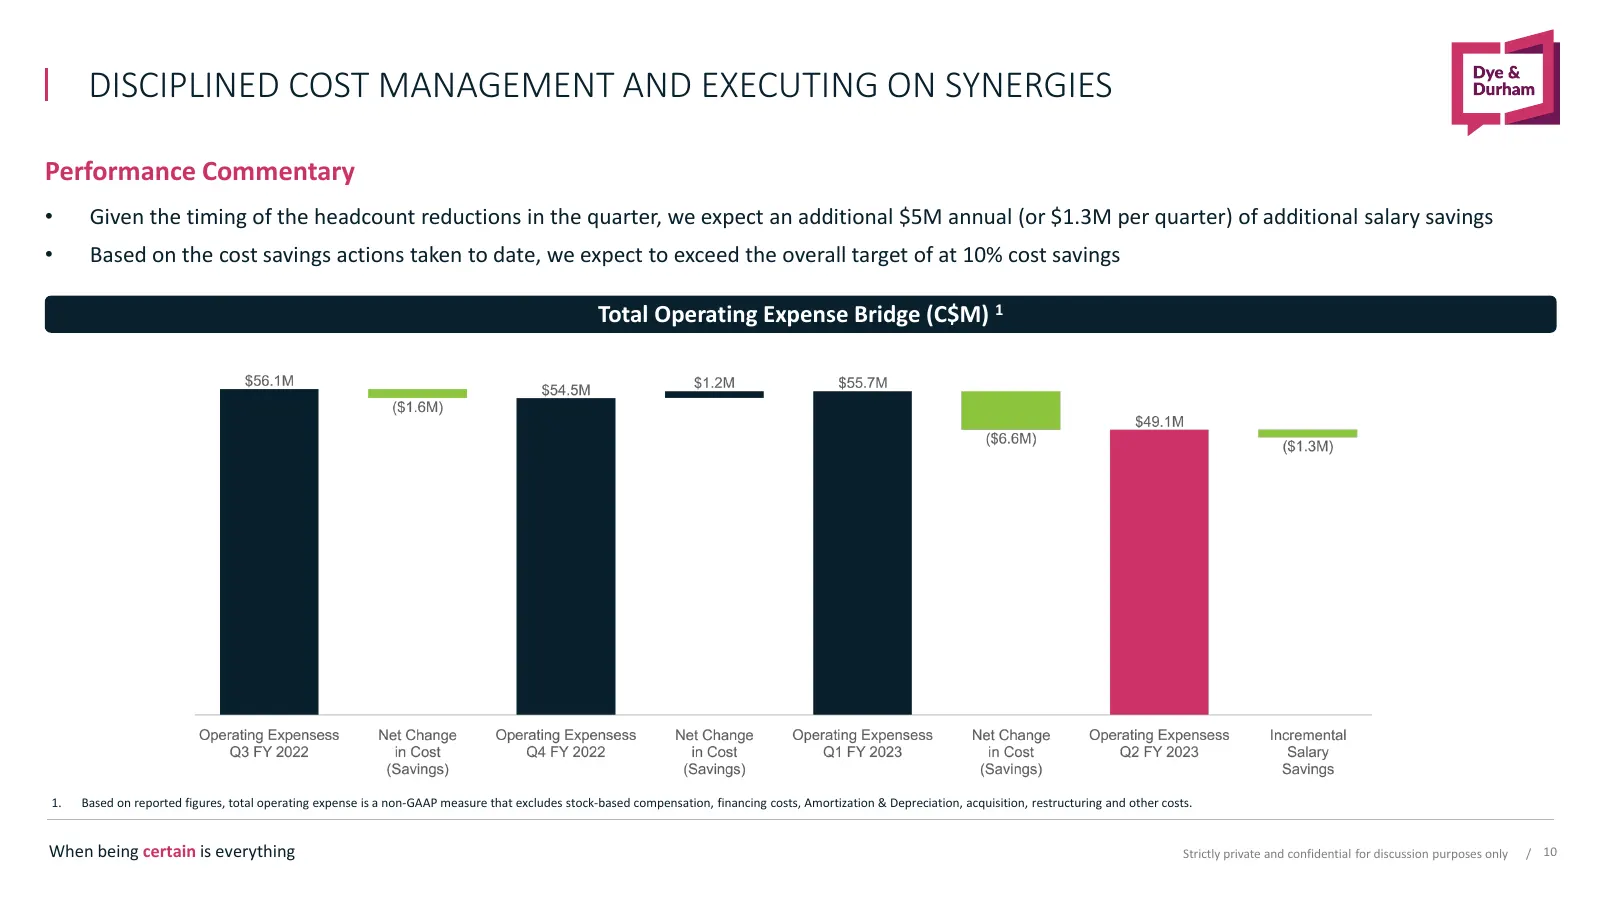
DISCIPLINED COST MANAGEMENT AND EXECUTING ON SYNERGIES Performance Commentary • Given the timing of the headcount reductions in the quarter, we expect an additional $5M annual (or $1.3M per quarter) of additional salary savings • Based on the cost savings actions taken to date, we expect to exceed t
Slide 11: D&D Growth Opportunities and Priorities
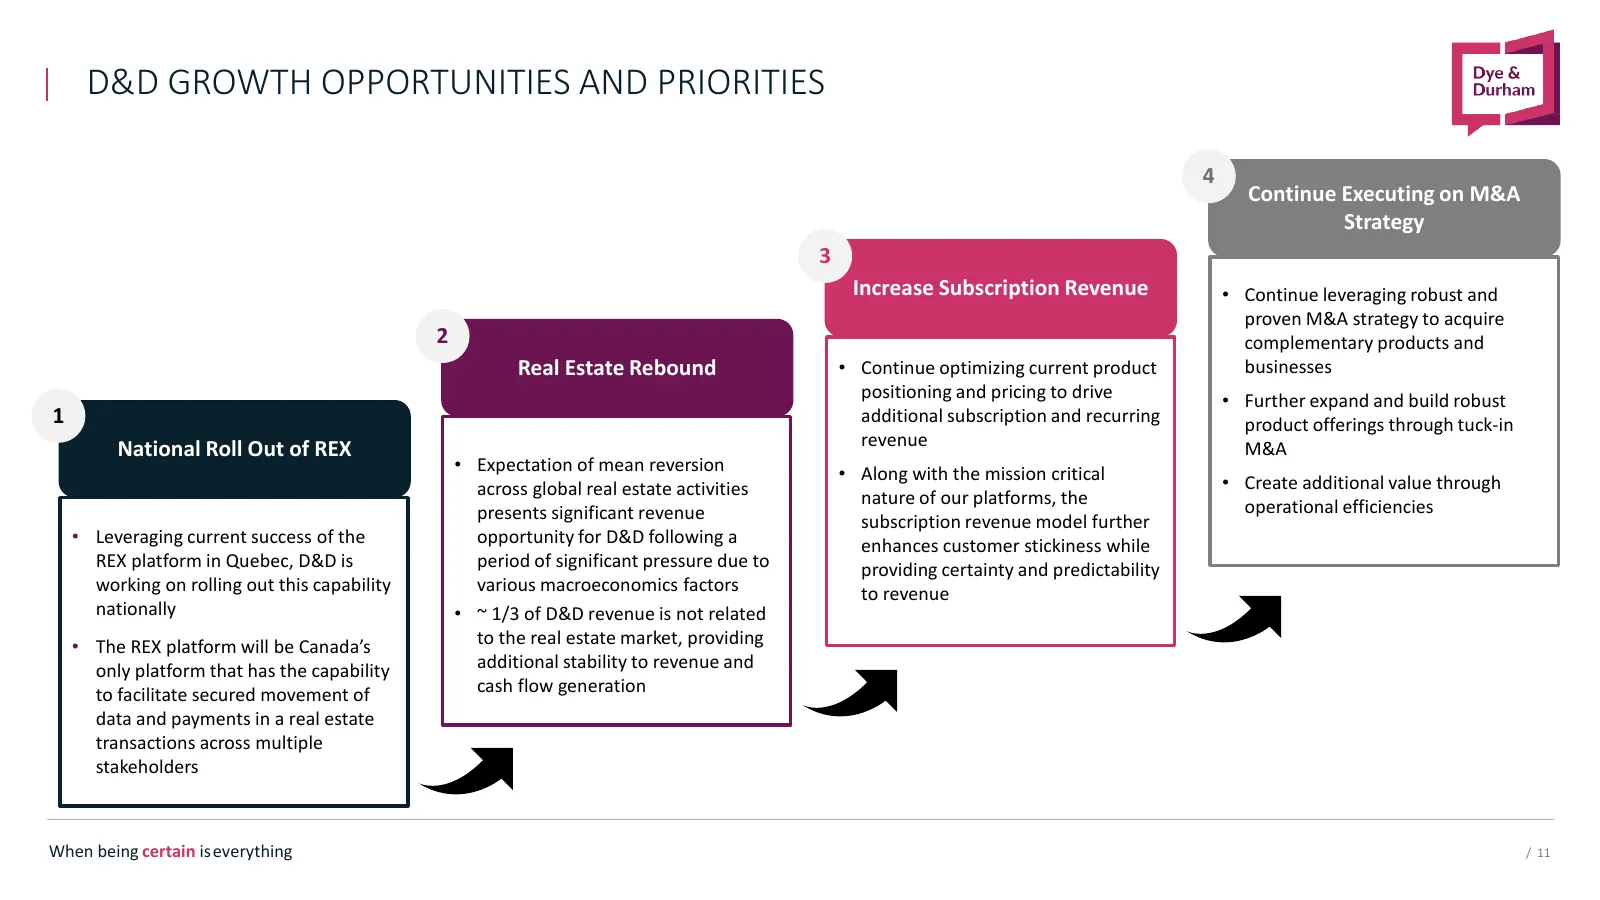
ibdroot\projects\IBD-NY\driveins2022\902367_1\Presentations\05. Lender Presentation\DND Private LP - November 2022_v26.pptx D&D GROWTH OPPORTUNITIES AND PRIORITIES 4 Continue Executing on M&A Strategy 3 Increase Subscription Revenue • Continue leveraging robust and proven M&A strategy to acquire 2 c
Slide 12: Historical Annual Performance
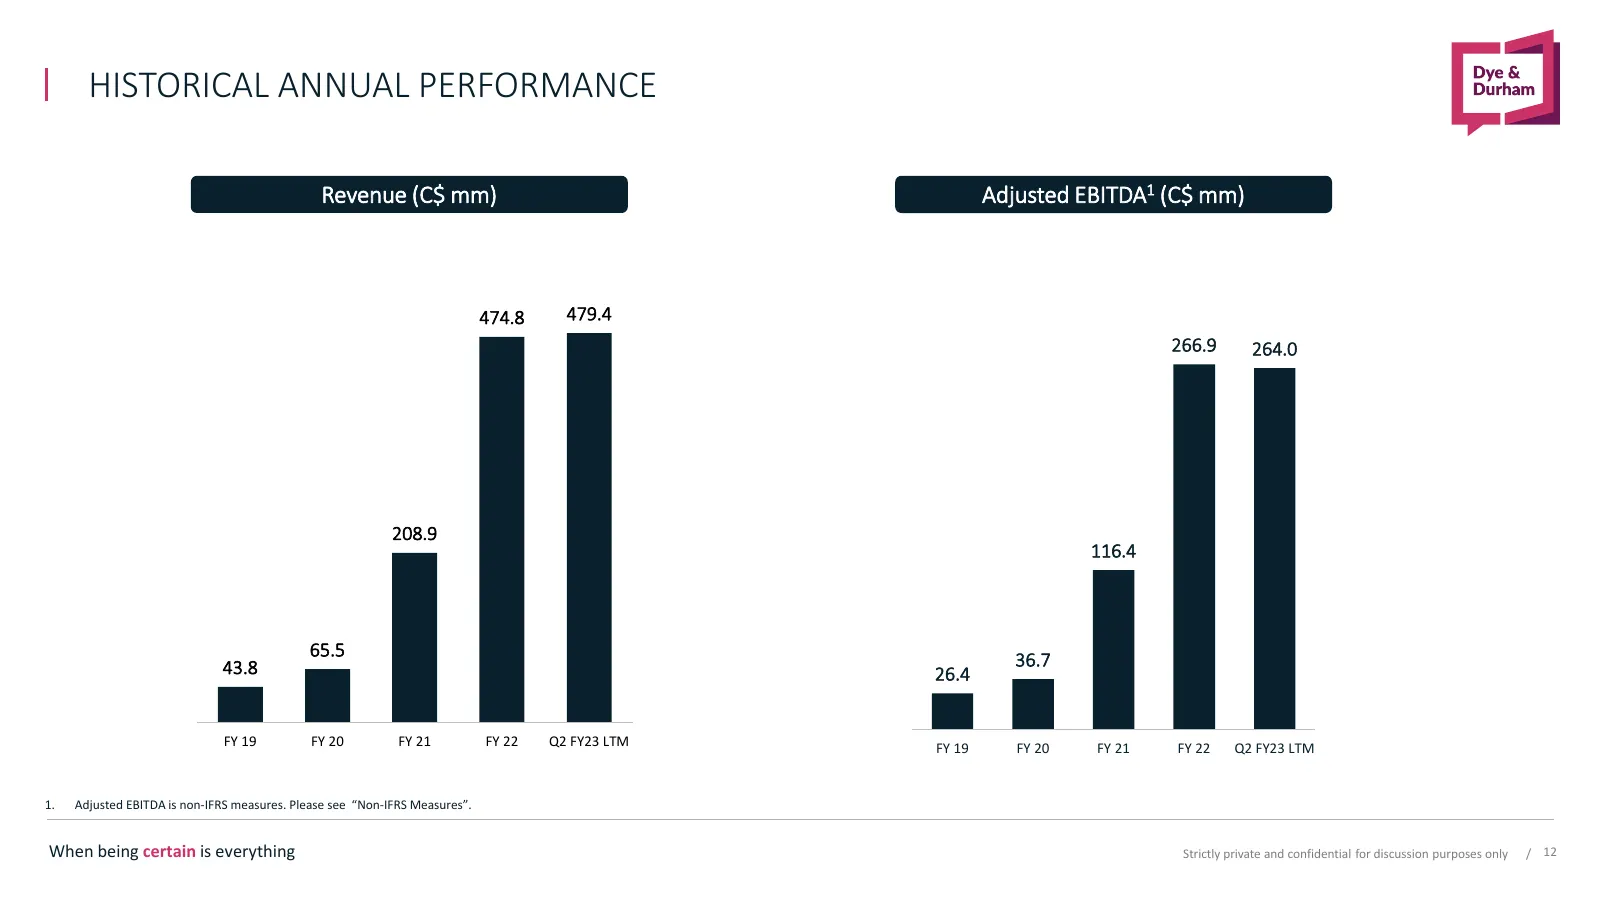
HISTORICAL ANNUAL PERFORMANCE Revenue (C$ mm) Adjusted EBITDA1 (C$ mm) 474.8 479.4 266.9 264.0 208.9 116.4 65.5 36.7 43.8 26.4 FY 19 FY 20 FY 21 FY 22 Q2 FY23 LTM FY 19 FY 20 FY 21 FY 22 Q2 FY23 LTM 1. Adjusted EBITDA is non-IFRS measures. Please see “Non-IFRS Measures”. When being certain is everyt
Slide 13: Quarterly Financials
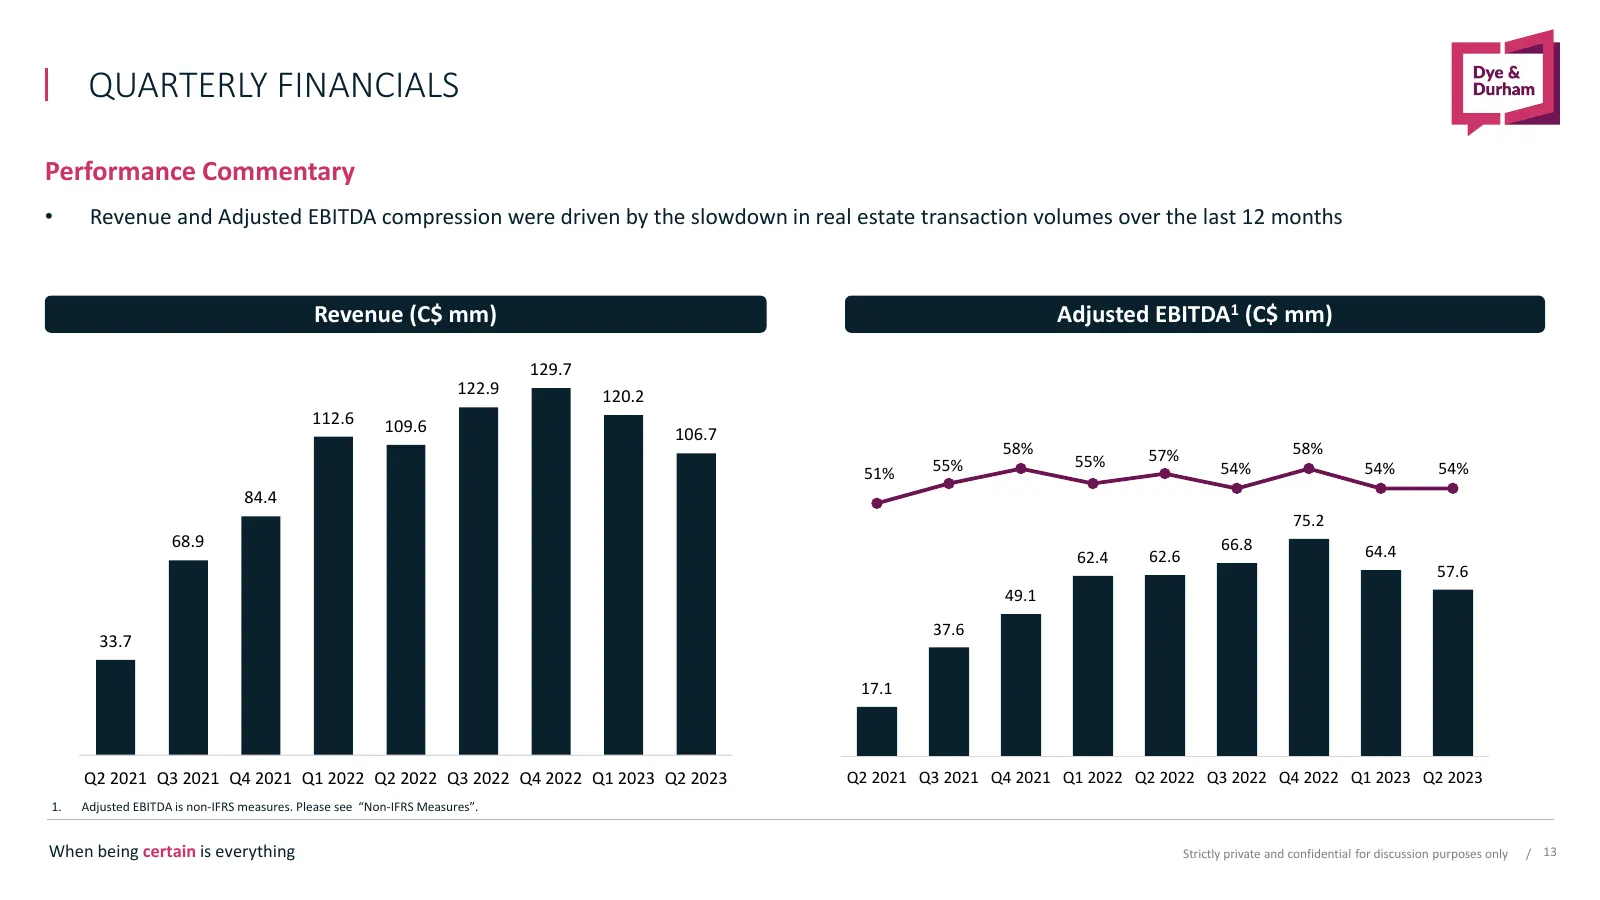
QUARTERLY FINANCIALS Performance Commentary • Revenue and Adjusted EBITDA compression were driven by the slowdown in real estate transaction volumes over the last 12 months Revenue (C$ mm) Adjusted EBITDA1 (C$ mm) 129.7 122.9 120.2 120 70% 112.6 109.6 106.7 58% 57% 58% 60% 100 55% 55% 54% 54% 54% 51
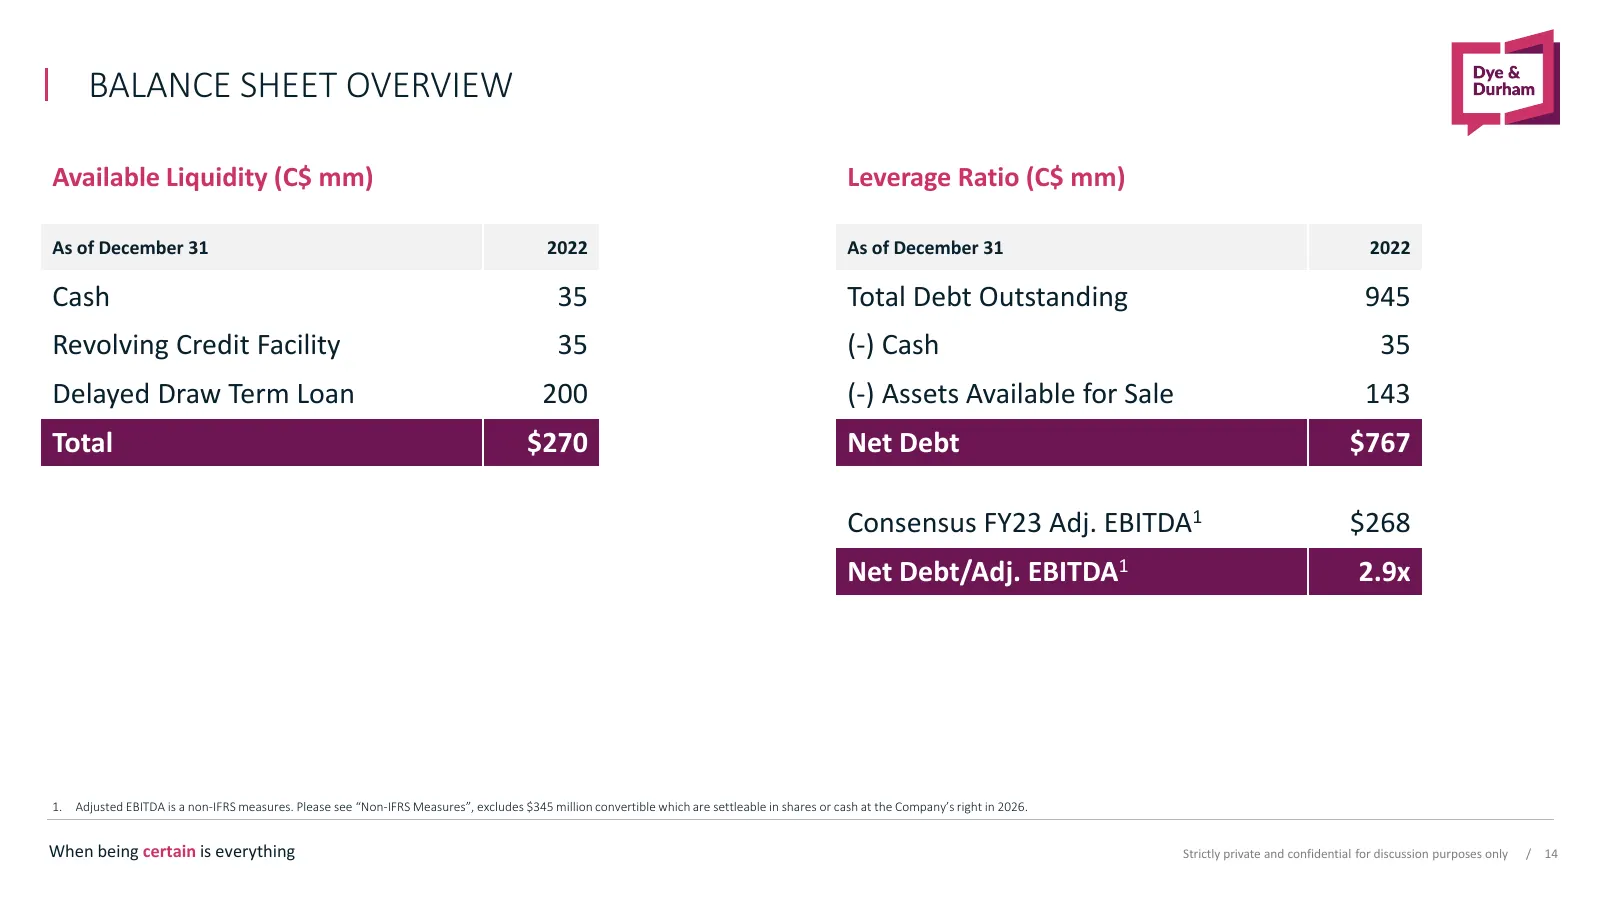
Slide 14: Balance Sheet Overview
BALANCE SHEET OVERVIEW Available Liquidity (C$ mm) Leverage Ratio (C$ mm) As of December 31 2022 As of December 31 2022 Cash 35 Total Debt Outstanding 945 Revolving Credit Facility 35 (-) Cash 35 Delayed Draw Term Loan 200 (-) Assets Available for Sale 143 Total $270 Net Debt $767 Consensus FY23 Adj

Slide 15: When being certain is everything
When being certain is everything 15
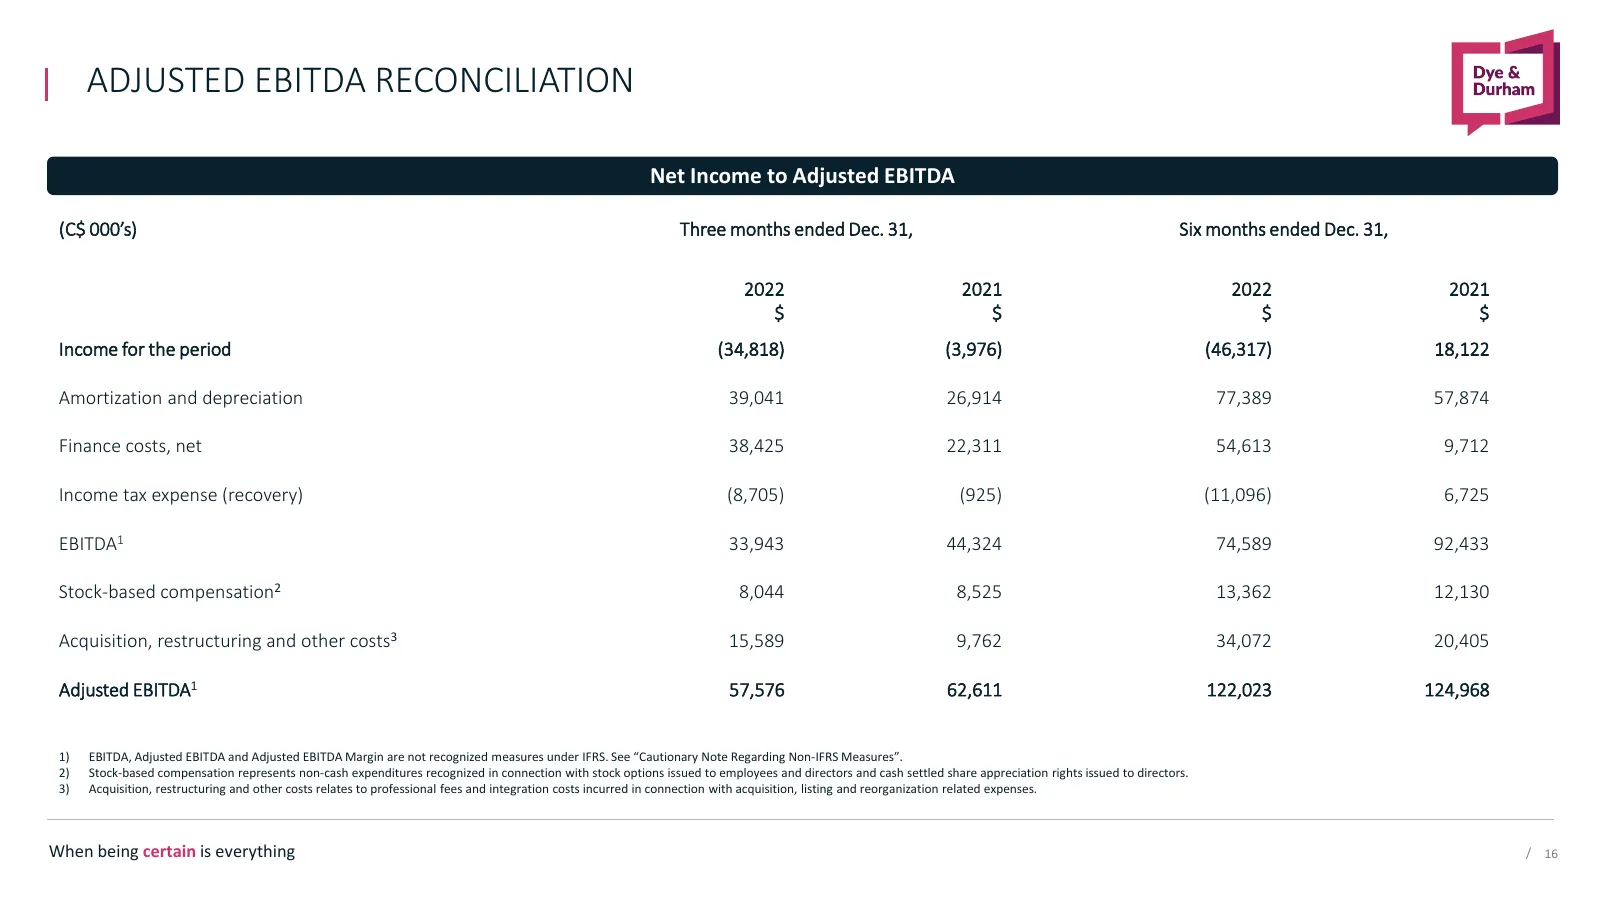
Slide 16: Adjusted EBITDA Reconciliation
ADJUSTED EBITDA RECONCILIATION Net Income to Adjusted EBITDA (C$ 000’s) Three months ended Dec. 31, Six months ended Dec. 31, 2022 2021 2022 2021 $ $ $ $ Income for the period (34,818) (3,976) (46,317) 18,122 Amortization and depreciation 39,041 26,914 77,389 57,874 Finance costs, net 38,425 22,311
Slide 17: When being certain is everything
When being certain is everything 17
Source: Internet Archive copy of dyedurham.com
More decks from Dye & Durham Ltd.
 Q4 2026 Earnings Presentation11 slides · Sep 30, 2026
 Q3 FY2026 Earnings Presentation12 slides · May 19, 2026
 Q2 2026 Earnings Presentation18 slides · Feb 17, 2026
 Q3 2025 Earnings Presentation17 slides · May 13, 2025
 Q2 FY2025 Earnings Presentation15 slides · Feb 13, 2025
 Proxy Contest (December 2024)85 slides · Dec 10, 2024