Hellenic Telecommunications Organization SA · ATHEX:HTO
Hellenic Telecommunications Organization SA — Q3 2021 Earnings Presentation
29 slides from Hellenic Telecommunications Organization SA's earnings presentation, November 2021

Slide 1: Q3 2021 Results
OTE Hellenic Telecommunications Organization Q3 2021 Results November 2021
Slide 2: Disclaimer
Disclaimer This presentation is provided to persons who are entitled to receive it in accordance with the laws and regulations of appropriate jurisdictions. This presentation is provided for information purposes only and does not constitute an offer or an invitation to buy or sell or subscribe to an
Slide 3: Key Developments
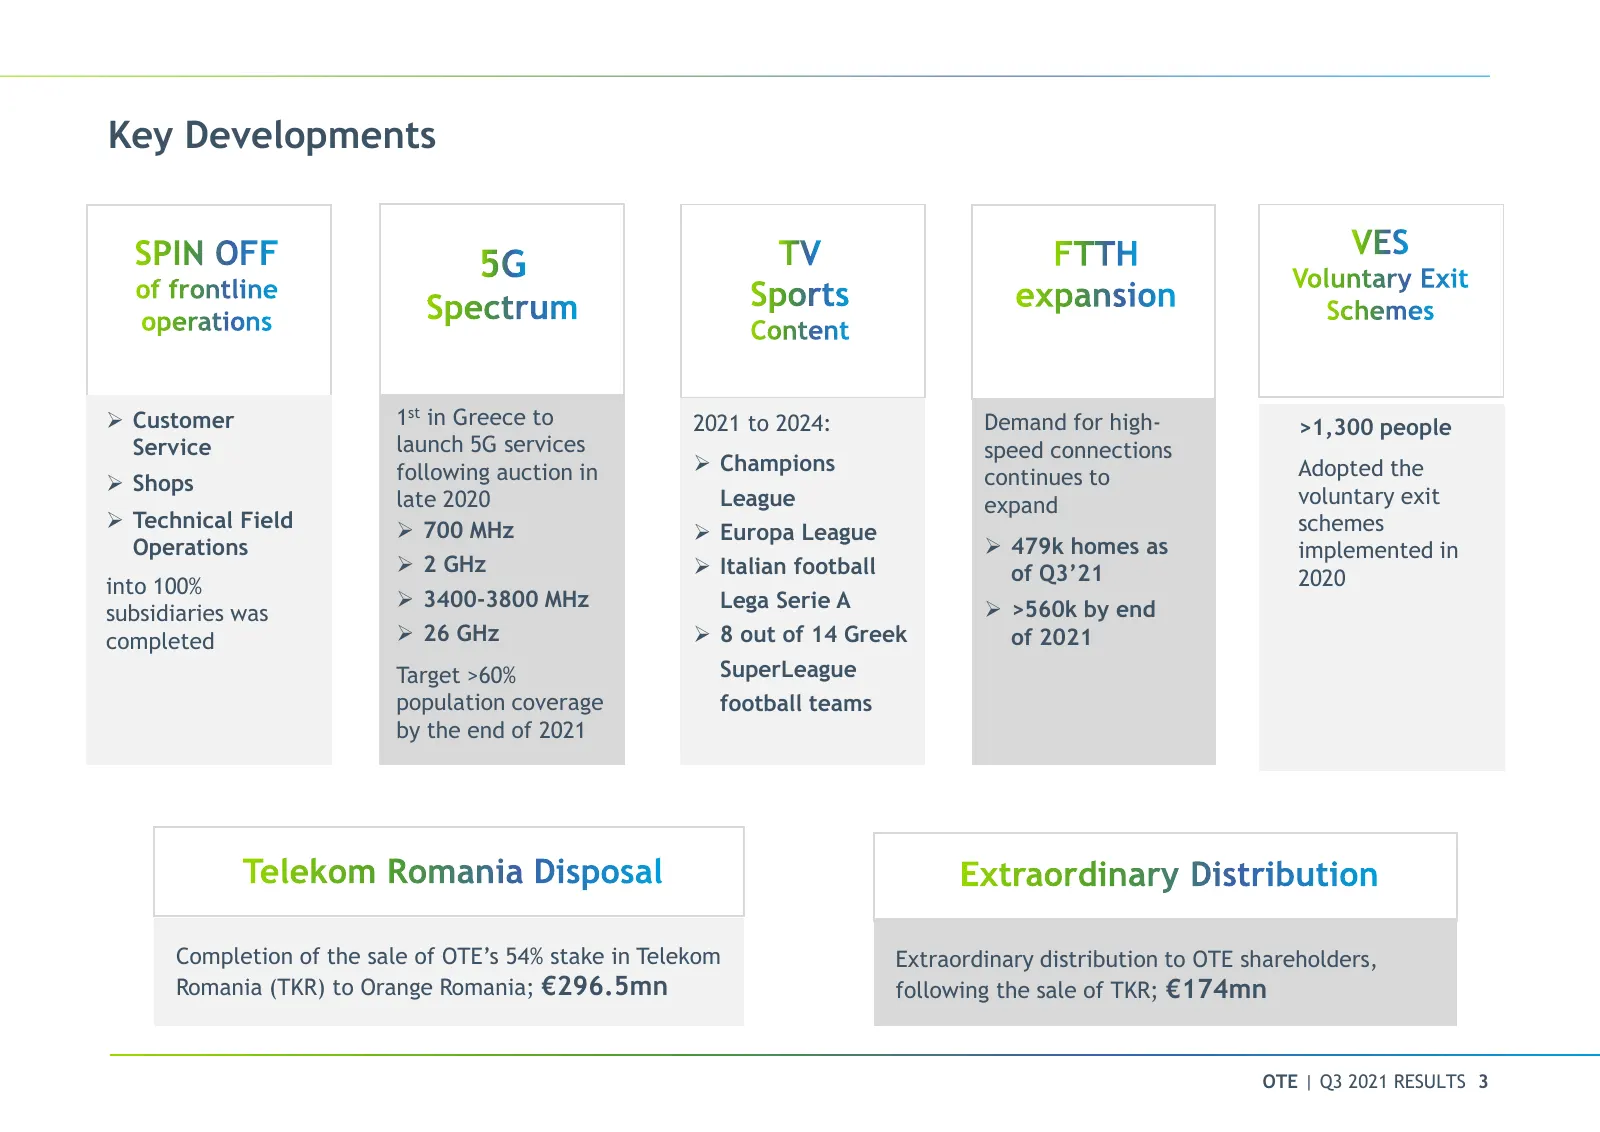
Key Developments Customer 1st in Greece to 2021 to 2024: Demand for high- >1,300 people Service launch 5G services speed connections following auction in Champions Adopted the Shops continues to late 2020 League expand voluntary exit Technical Field 700 MHz schemes Europa League Operatio
Slide 4: Q3 Highlights
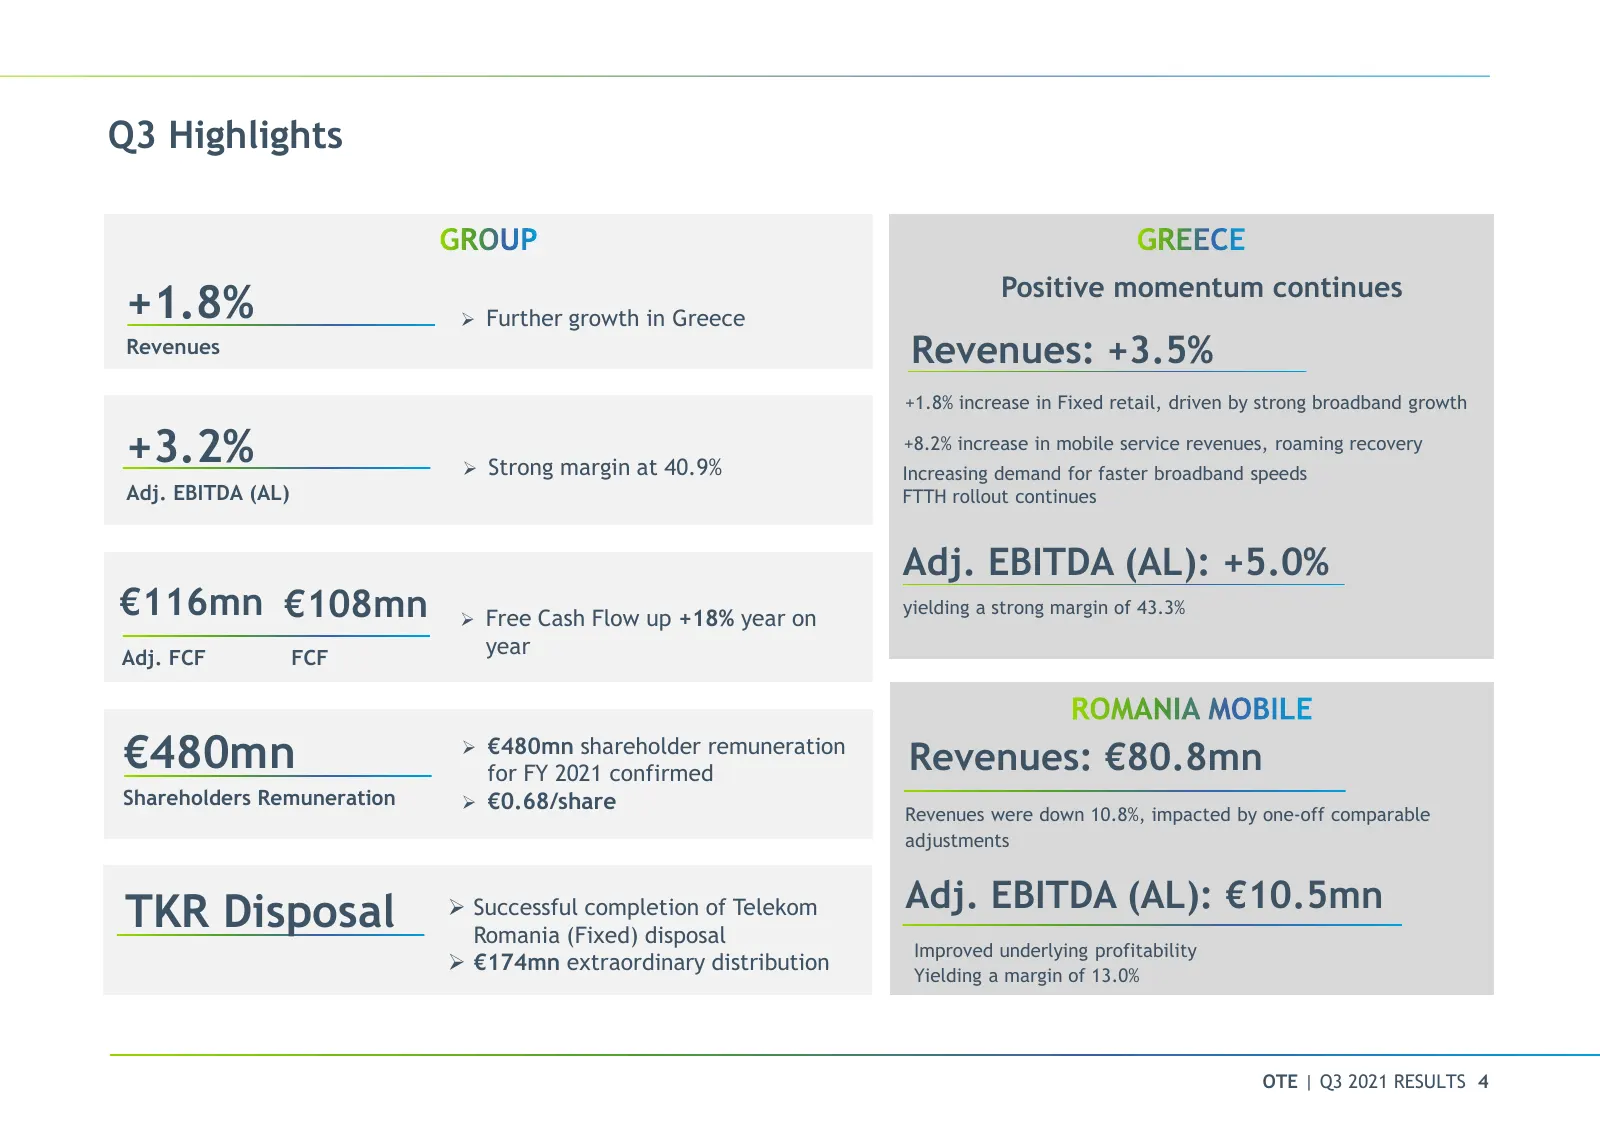
Q3 Highlights Positive momentum continues +1.8% Further growth in Greece Revenues Revenues: +3.5% +1.8% increase in Fixed retail, driven by strong broadband growth +3.2% Strong margin at 40.9% +8.2% increase in mobile service revenues, roaming recovery Increasing demand for faster broadband spee

Slide 5: Financial Review
Financial Review OTE | Q2 2020 RESULTS 5
Slide 6: Group Overview
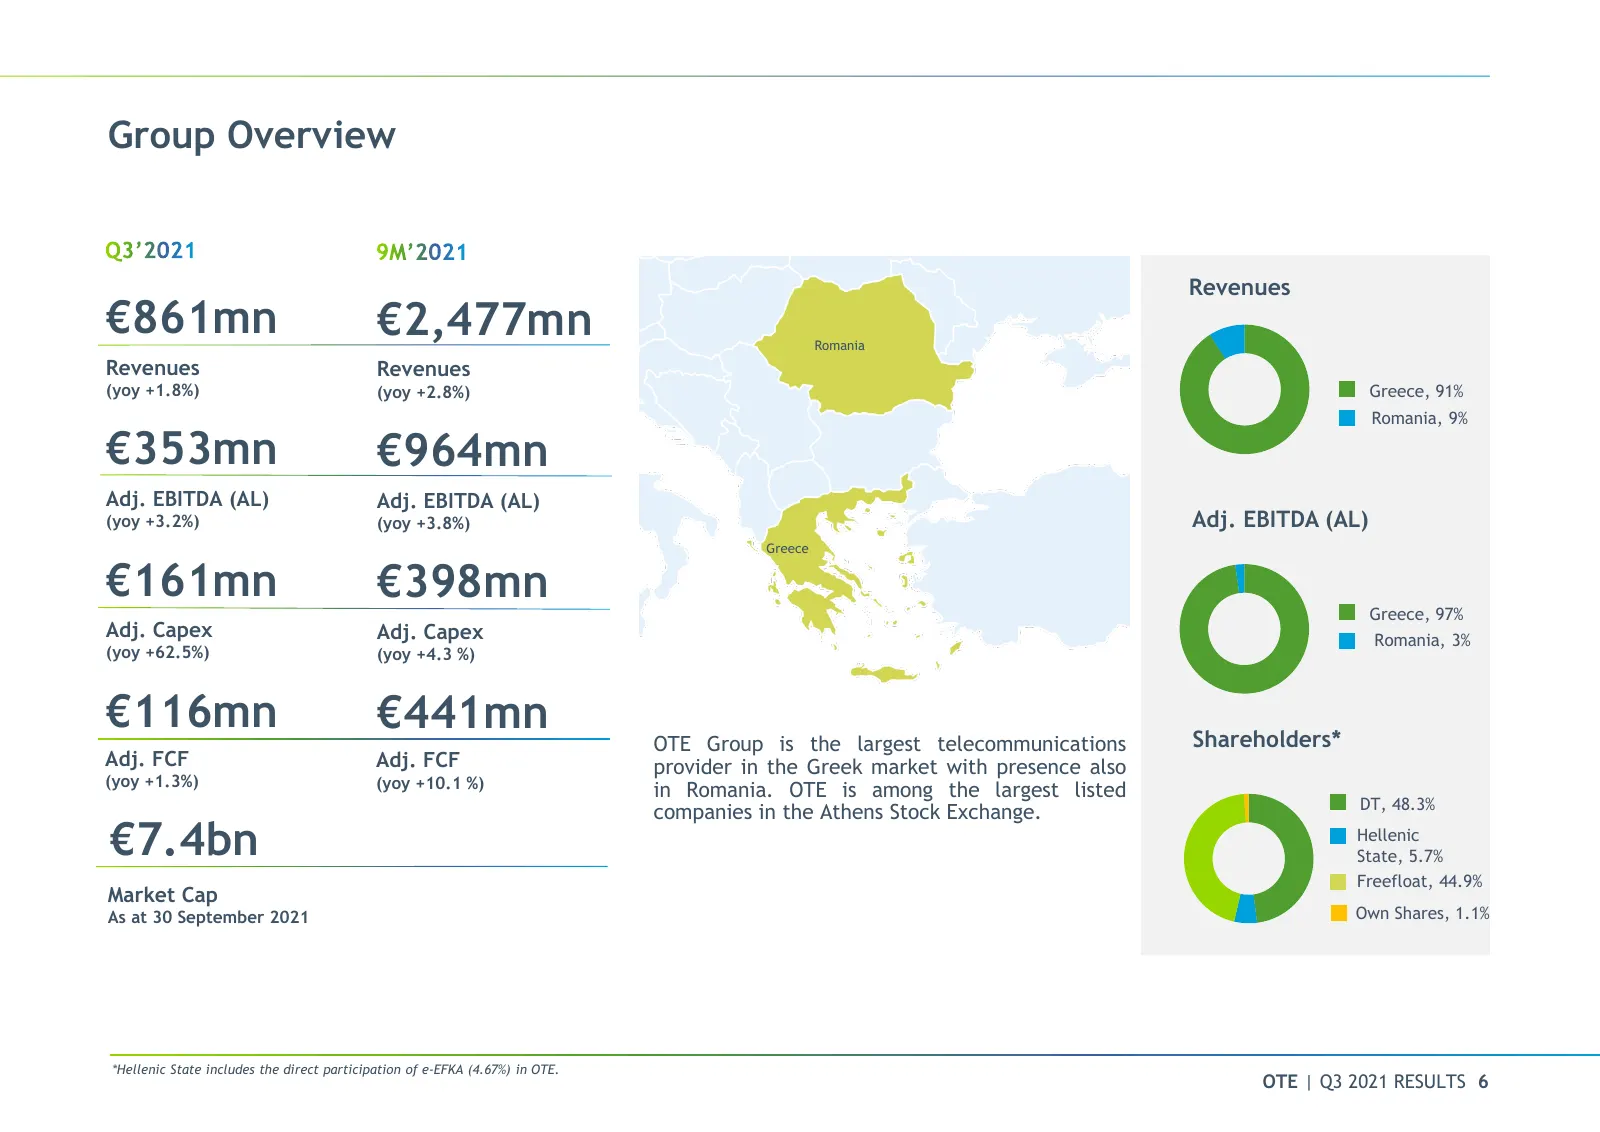
Group Overview Revenues €861mn €2,477mn Romania Revenues Revenues (yoy +1.8%) (yoy +2.8%) Greece, 91% Romania, 9% €353mn €964mn Adj. EBITDA (AL) Adj. EBITDA (AL) (yoy +3.2%) (yoy +3.8%) Adj. EBITDA (AL) Greece €161mn €398mn Greece, 97% Adj. Capex Adj. Capex Romania, 3% (yoy +62.5%) (yoy +4.3 %) €116
Slide 7: Capex
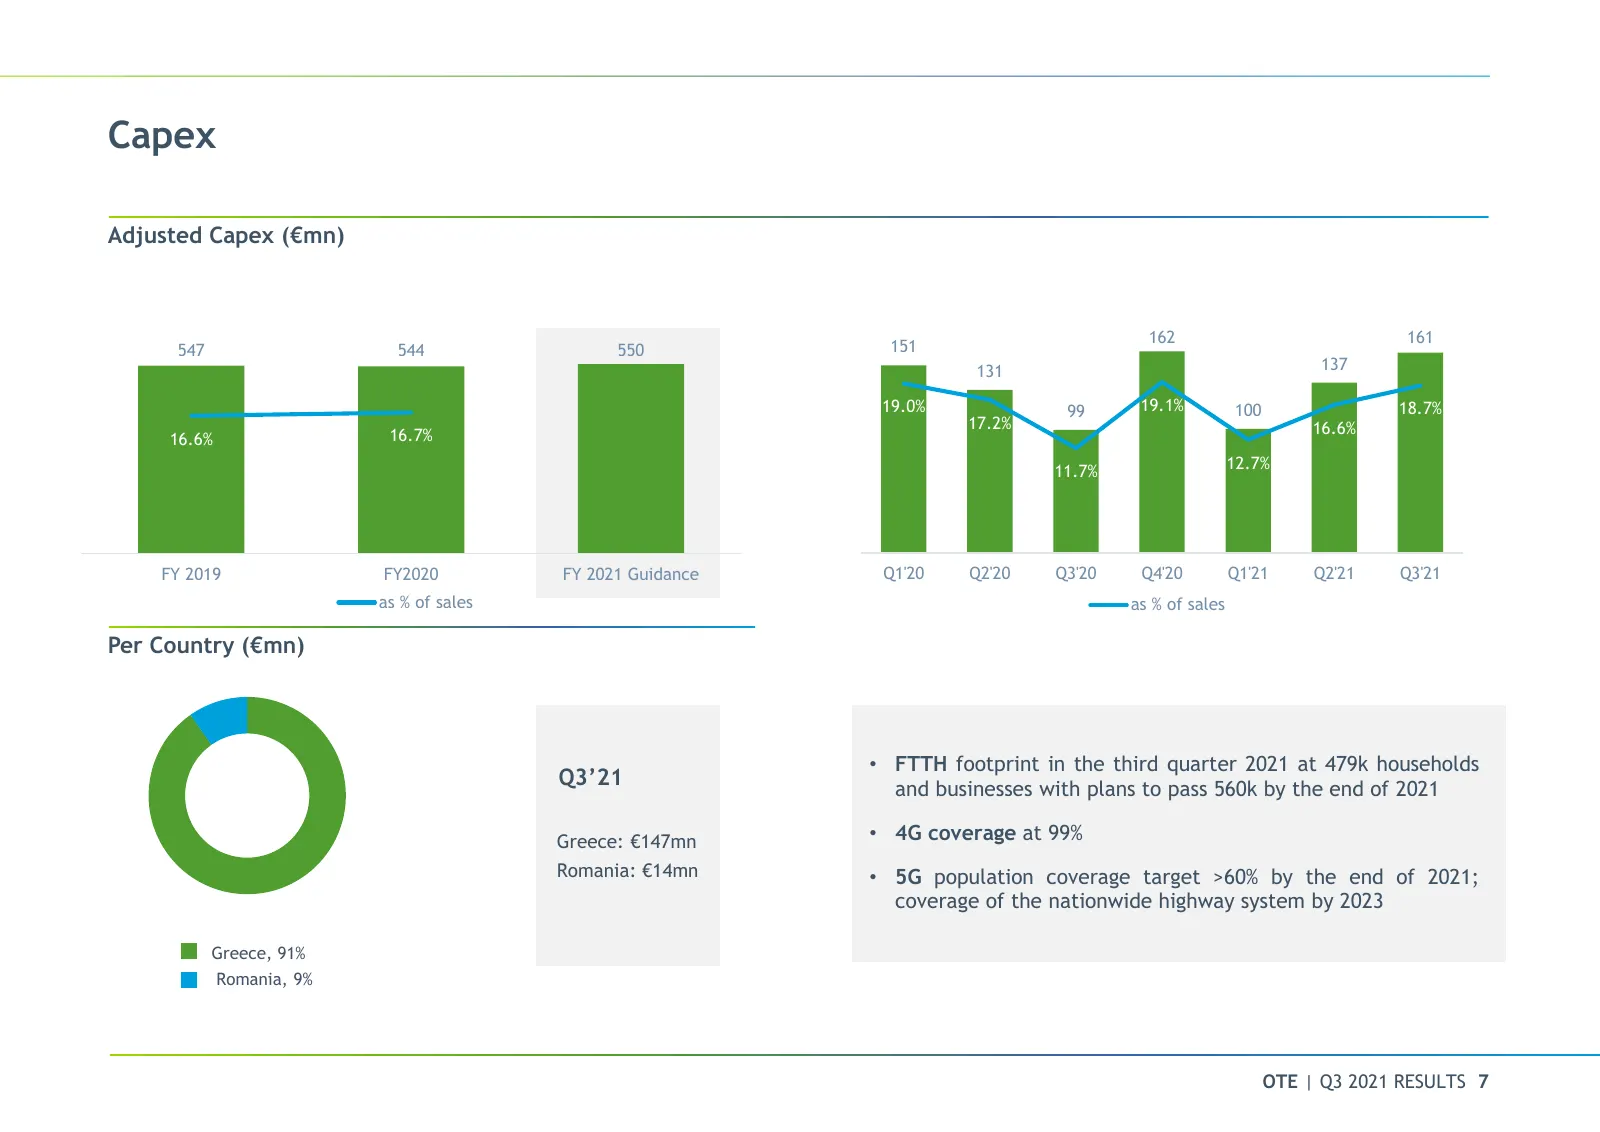
Capex Adjusted Capex (€mn) 162 161 180 25.0% 151 600 20.0% 547 544 550 160 550 19.0% 131 137 20.0% 140 500 18.0% 450 17.0% 120 19.0% 99 19.1% 100 18.7% 17.2% 15.0% 400 16.7% 16.0% 100 16.6% 350 16.6% 15.0% 80 300 14.0% 11.7% 12.7% 10.0% 60 250 13.0% 40 5.0% 200 12.0% 20 150 11.0% 100 10.0% 0 0.0% FY
Slide 8: Cashflow
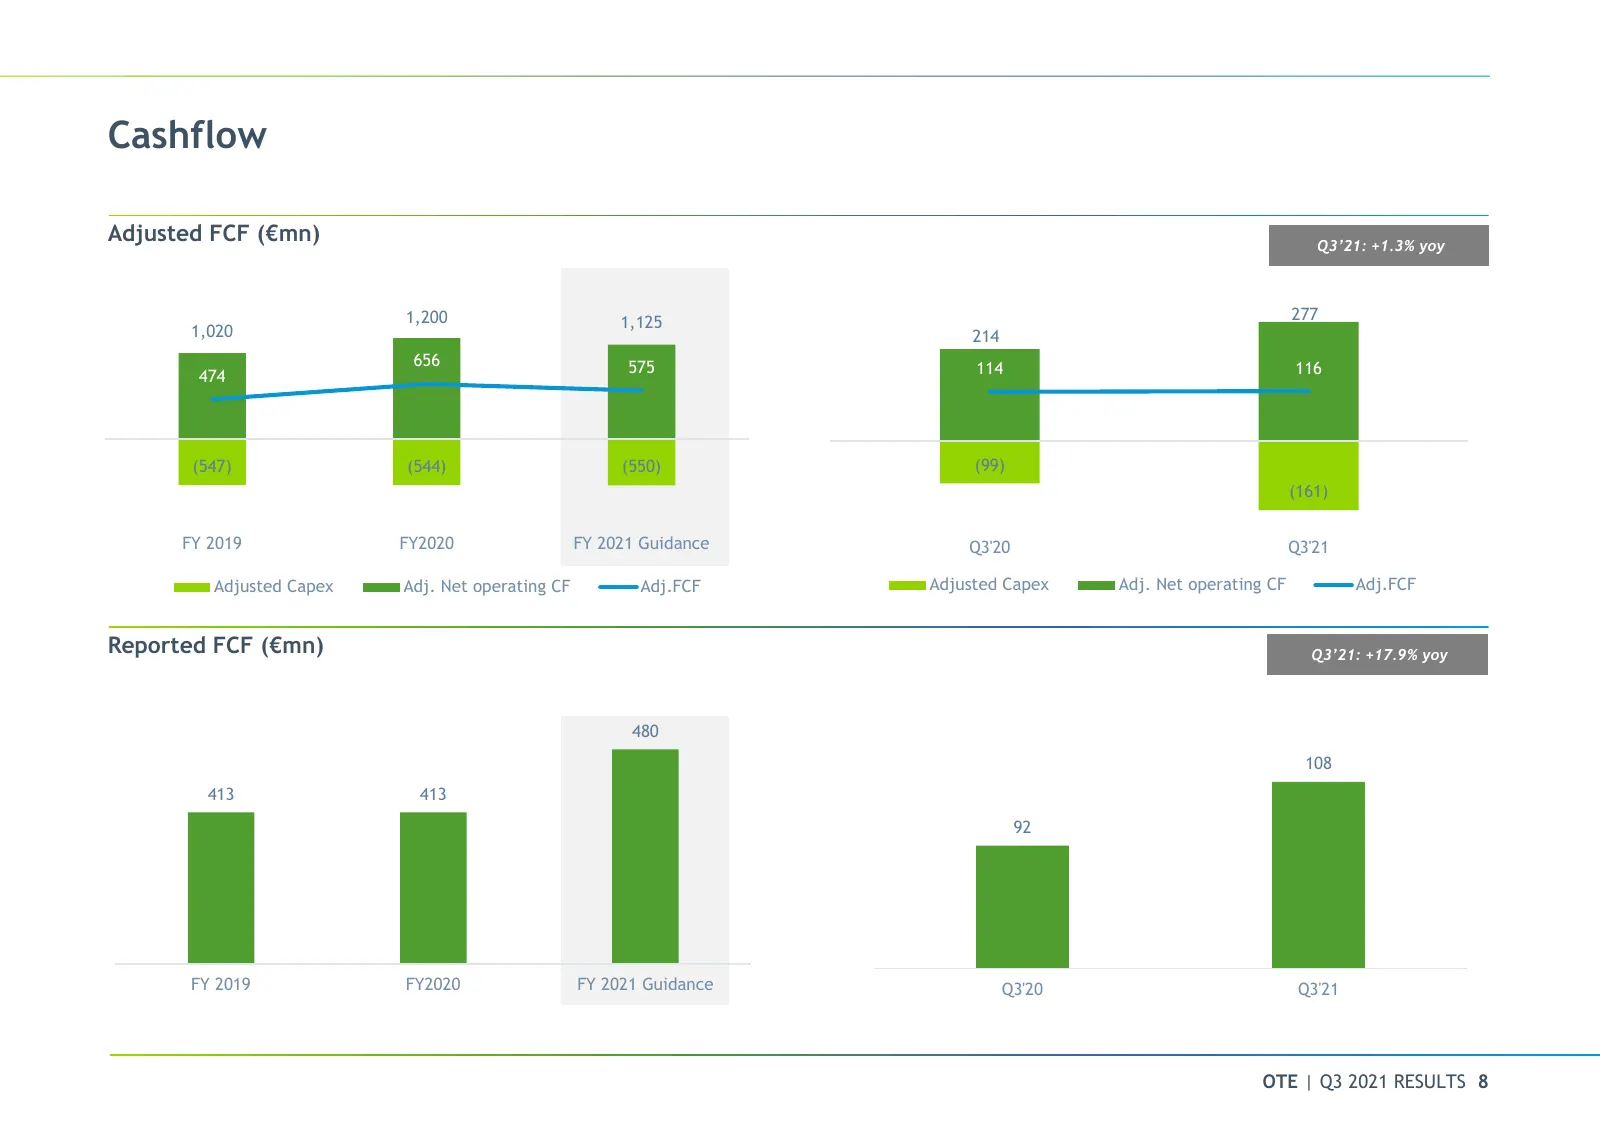
Cashflow Adjusted FCF (€mn) Q4’20: Q3’21:+64.2% +1.3% yoy 1,200 1,125 277 1,020 214 656 575 114 116 474 (547) (544) (550) (99) (161) FY 2019 FY2020 FY 2021 Guidance Q3'20 Q3'21 Adjusted Capex Adj. Net operating CF Adj.FCF Adjusted Capex Adj. Net operating CF Adj.FCF Reported FCF (€mn) Q3’21: +17.9%
Slide 9: Shareholder Remuneration Policy
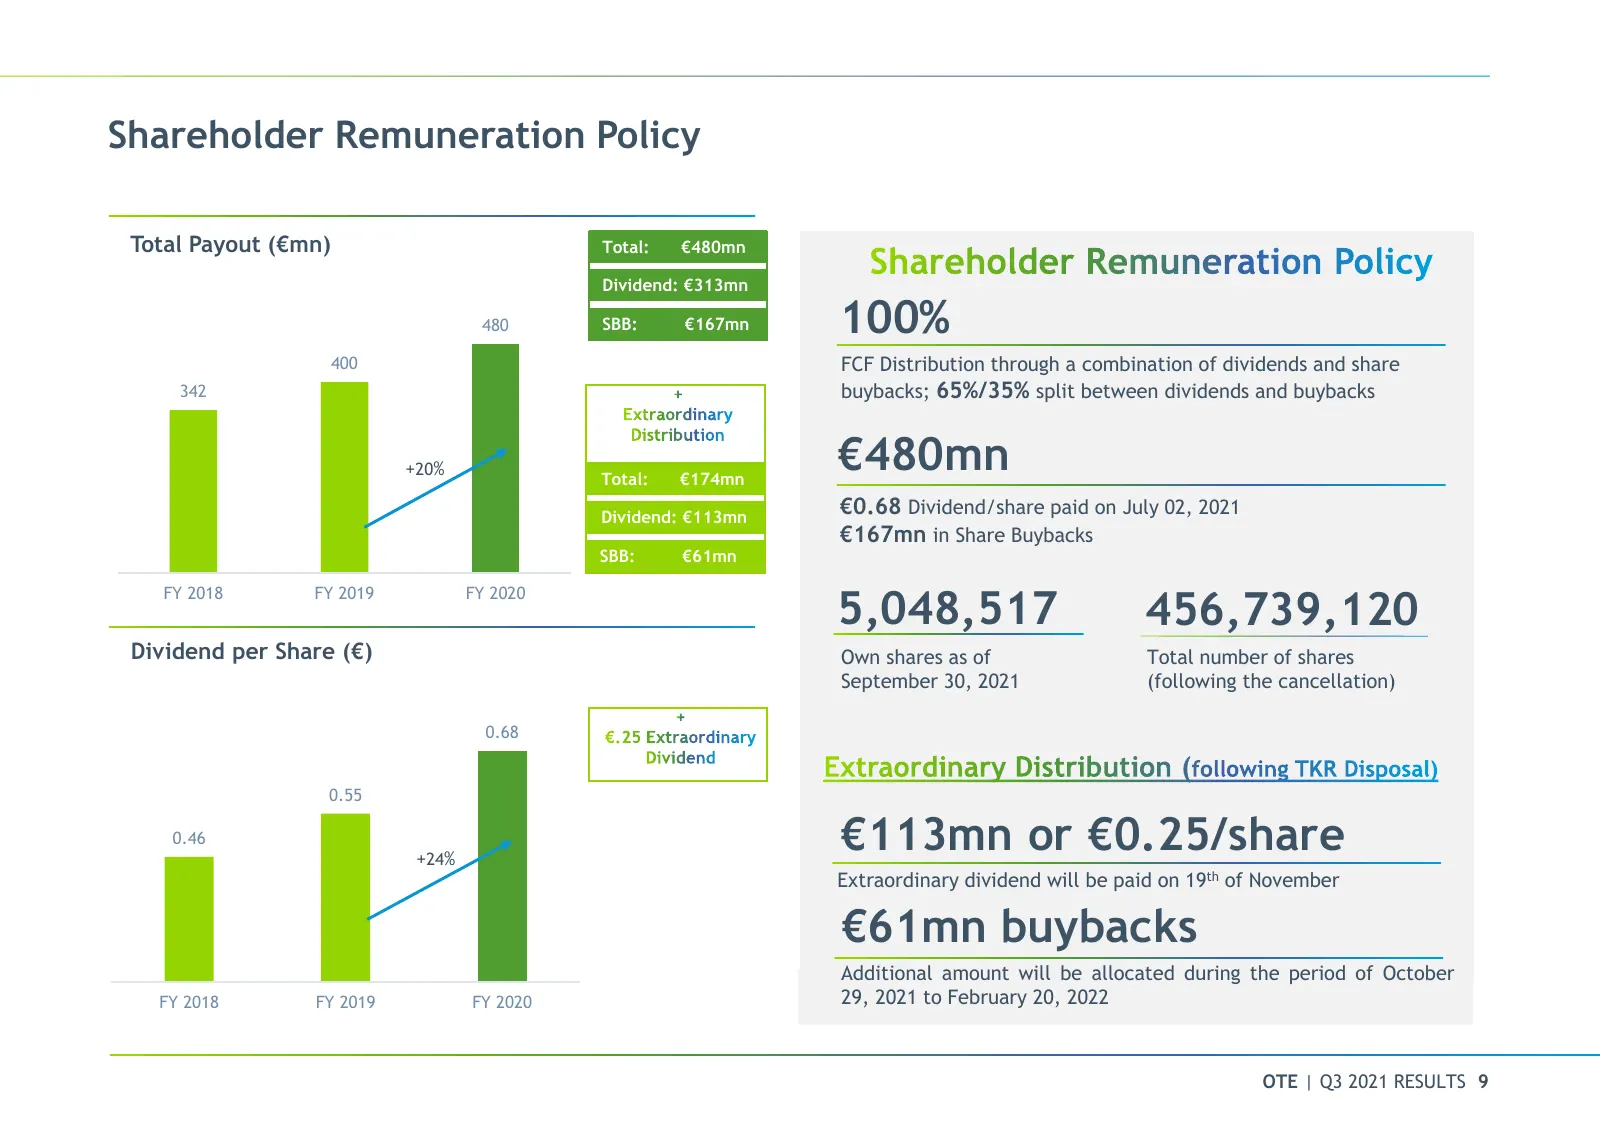
Shareholder Remuneration Policy Total Payout (€mn) Total: €480mn Dividend: €313mn 480 SBB: €167mn 100% 400 FCF Distribution through a combination of dividends and share 342 buybacks; 65%/35% split between dividends and buybacks +20% Total: €174mn €480mn Dividend: €113mn €0.68 Dividend/share paid on
Slide 10: Debt and Liquidity Profile
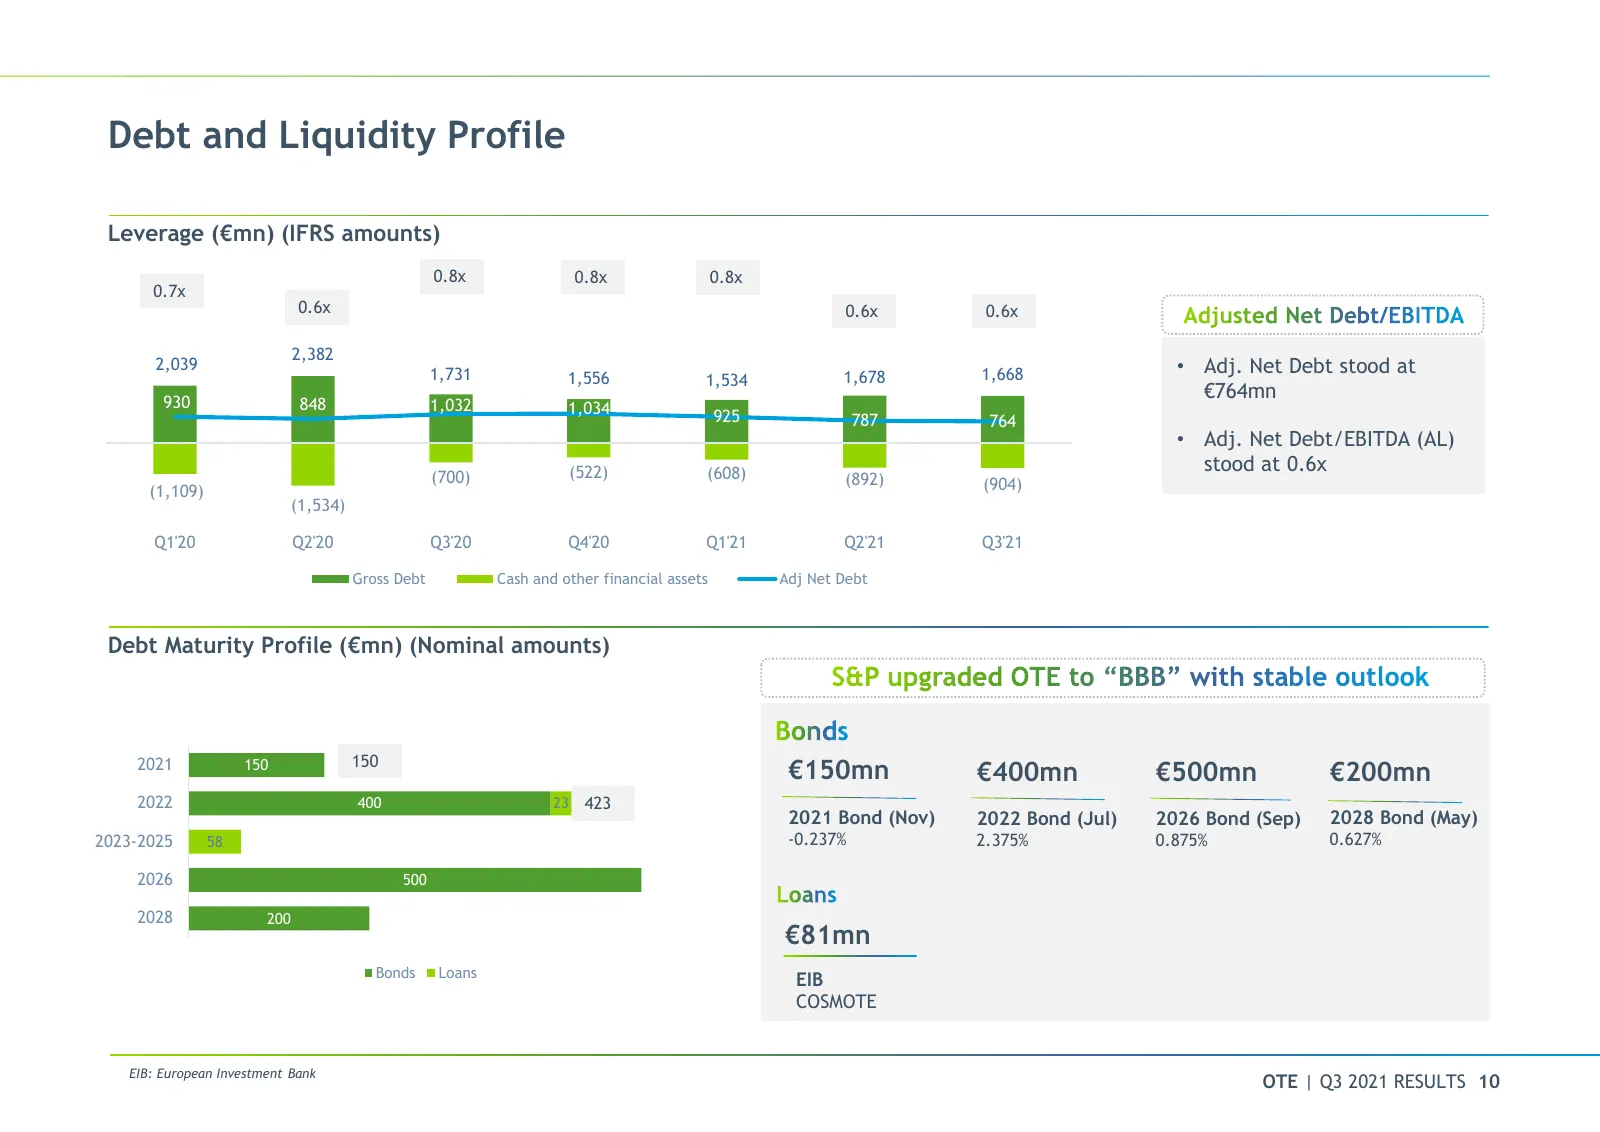
Debt and Liquidity Profile Leverage (€mn) (IFRS amounts) 0.8x 0.8x 0.8x 0.7x 0.6x 0.6x 0.6x 2,382 2,039 1,731 1,678 1,668 • Adj. Net Debt stood at 1,556 1,534 930 €764mn 848 1,032 1,034 925 787 764 • Adj. Net Debt/EBITDA (AL) (522) (608) stood at 0.6x (700) (892) (904) (1,109) (1,534) Q1'20 Q2'20 Q3

Slide 11: Greece
Greece OTE | Q2 2020 RESULTS 11
Slide 12: Greece – Financial Overview
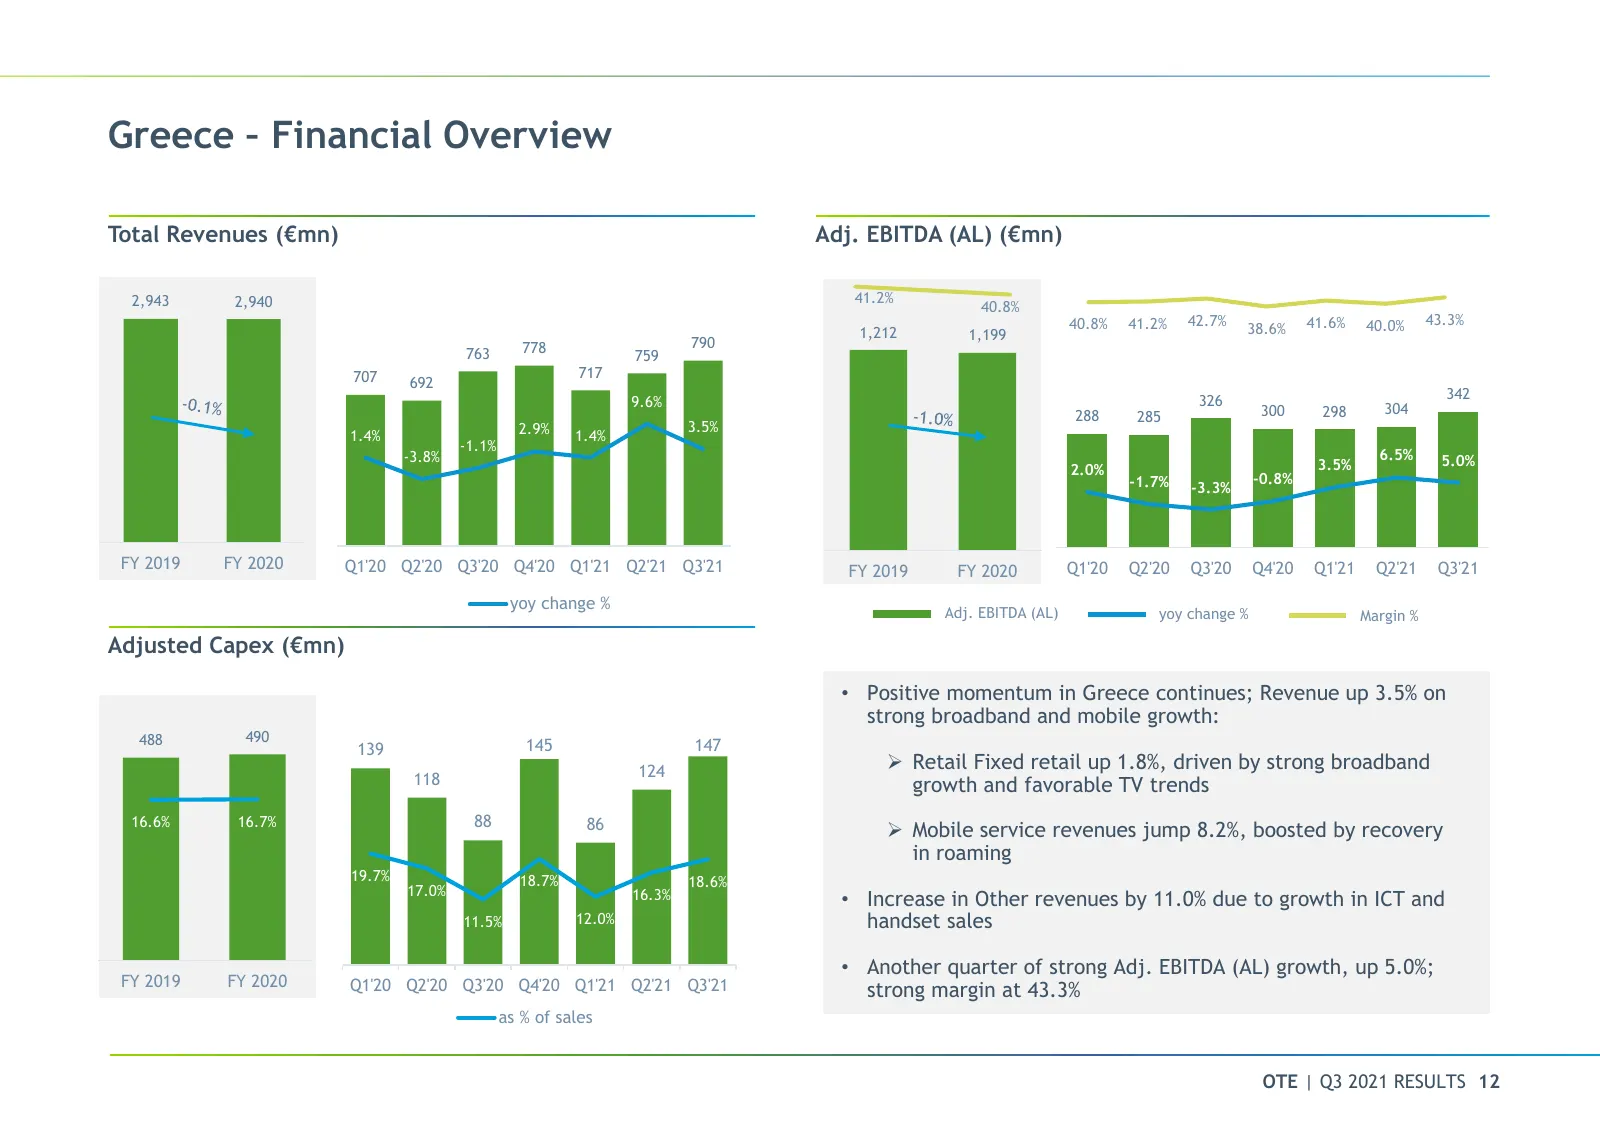
Greece – Financial Overview Total Revenues (€mn) Adj. EBITDA (AL) (€mn) 2,943 2,940 41.2% 69000.0% 40.8% 40.8% 41.2% 42.7% 41.6% 40.0% 43.3% 1,212 1,199 38.6% 840 778 790 30.0% 763 64000.0% 790 759 25.0% 717 450 740 707 692 20.0% 35.0% 342 400 59000.0% 690 9.6% 15.0% 326 350 288 285 300 298 304 25.0
Slide 13: Greece – Financial Overview
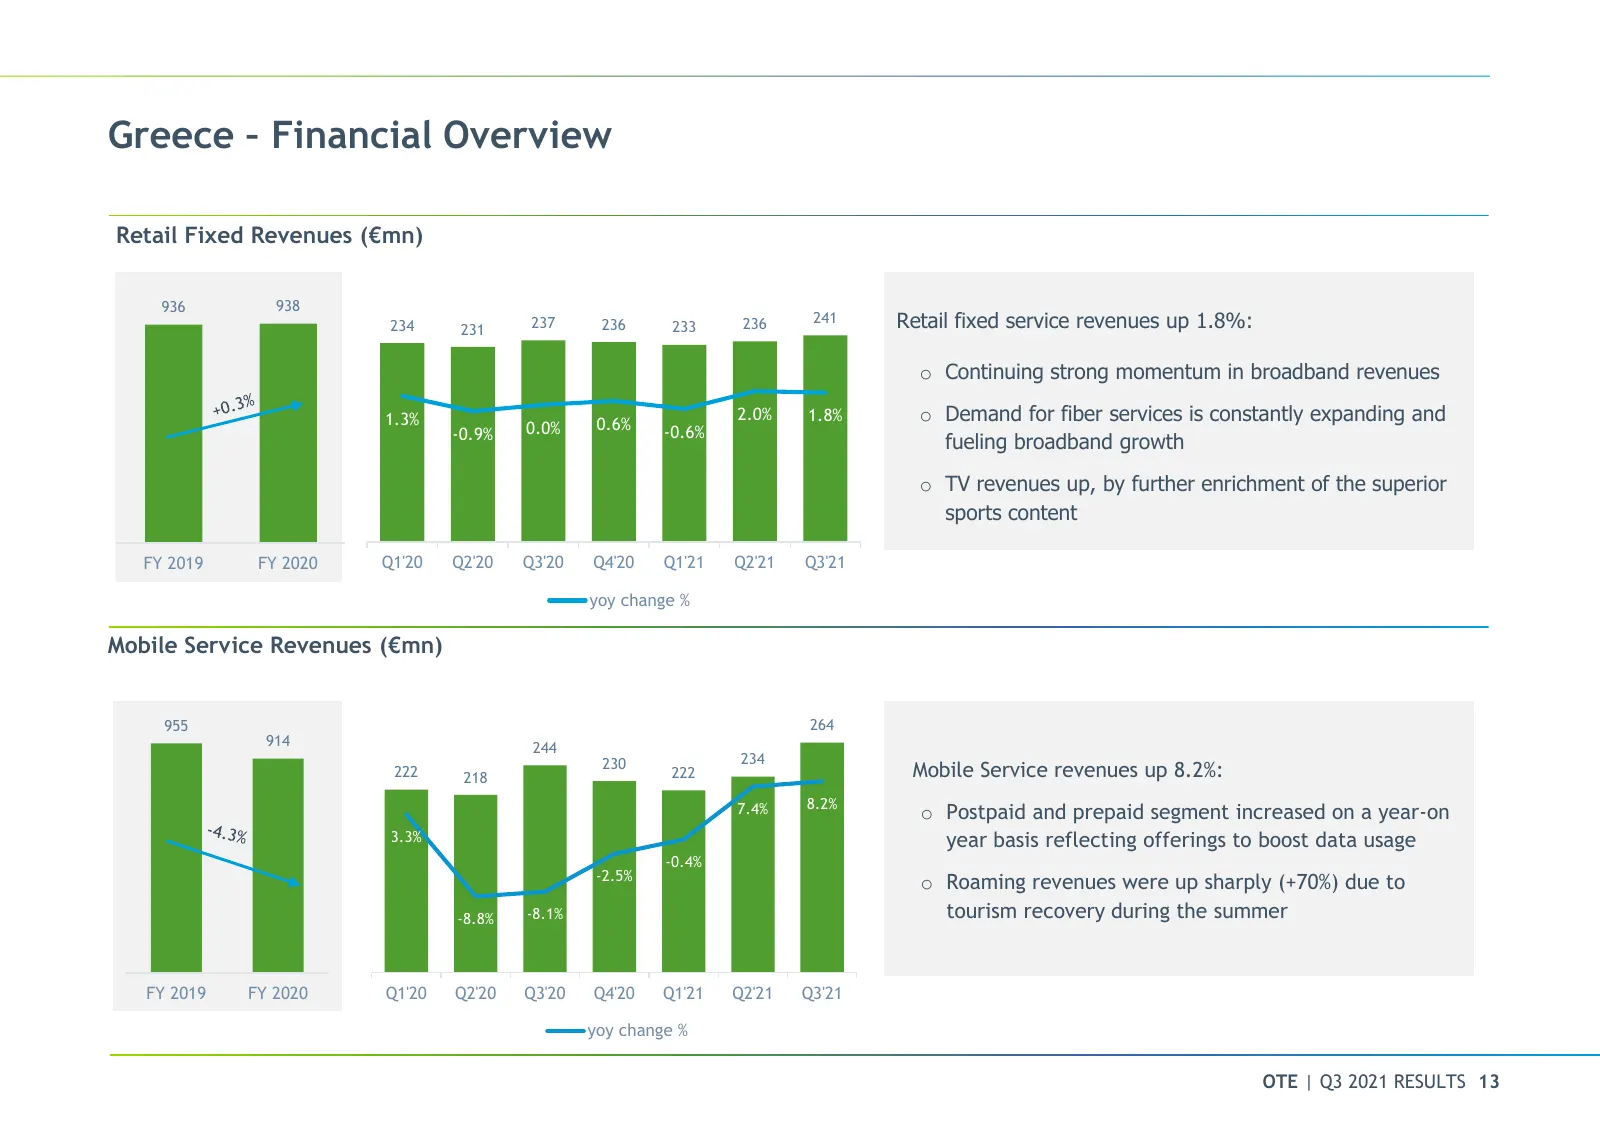
Greece – Financial Overview Retail Fixed Revenues (€mn) 20.0% 936 938 15.0% 241 Retail fixed service revenues up 1.8%: 261 234 231 237 236 233 236 10.0% 211 5.0% o Continuing strong momentum in broadband revenues o Demand for fiber services is constantly expanding and 0.0% 1.3% 2.0% 1.8% 0.0% 0.6% -
Slide 14: Greece – Fixed KPIs
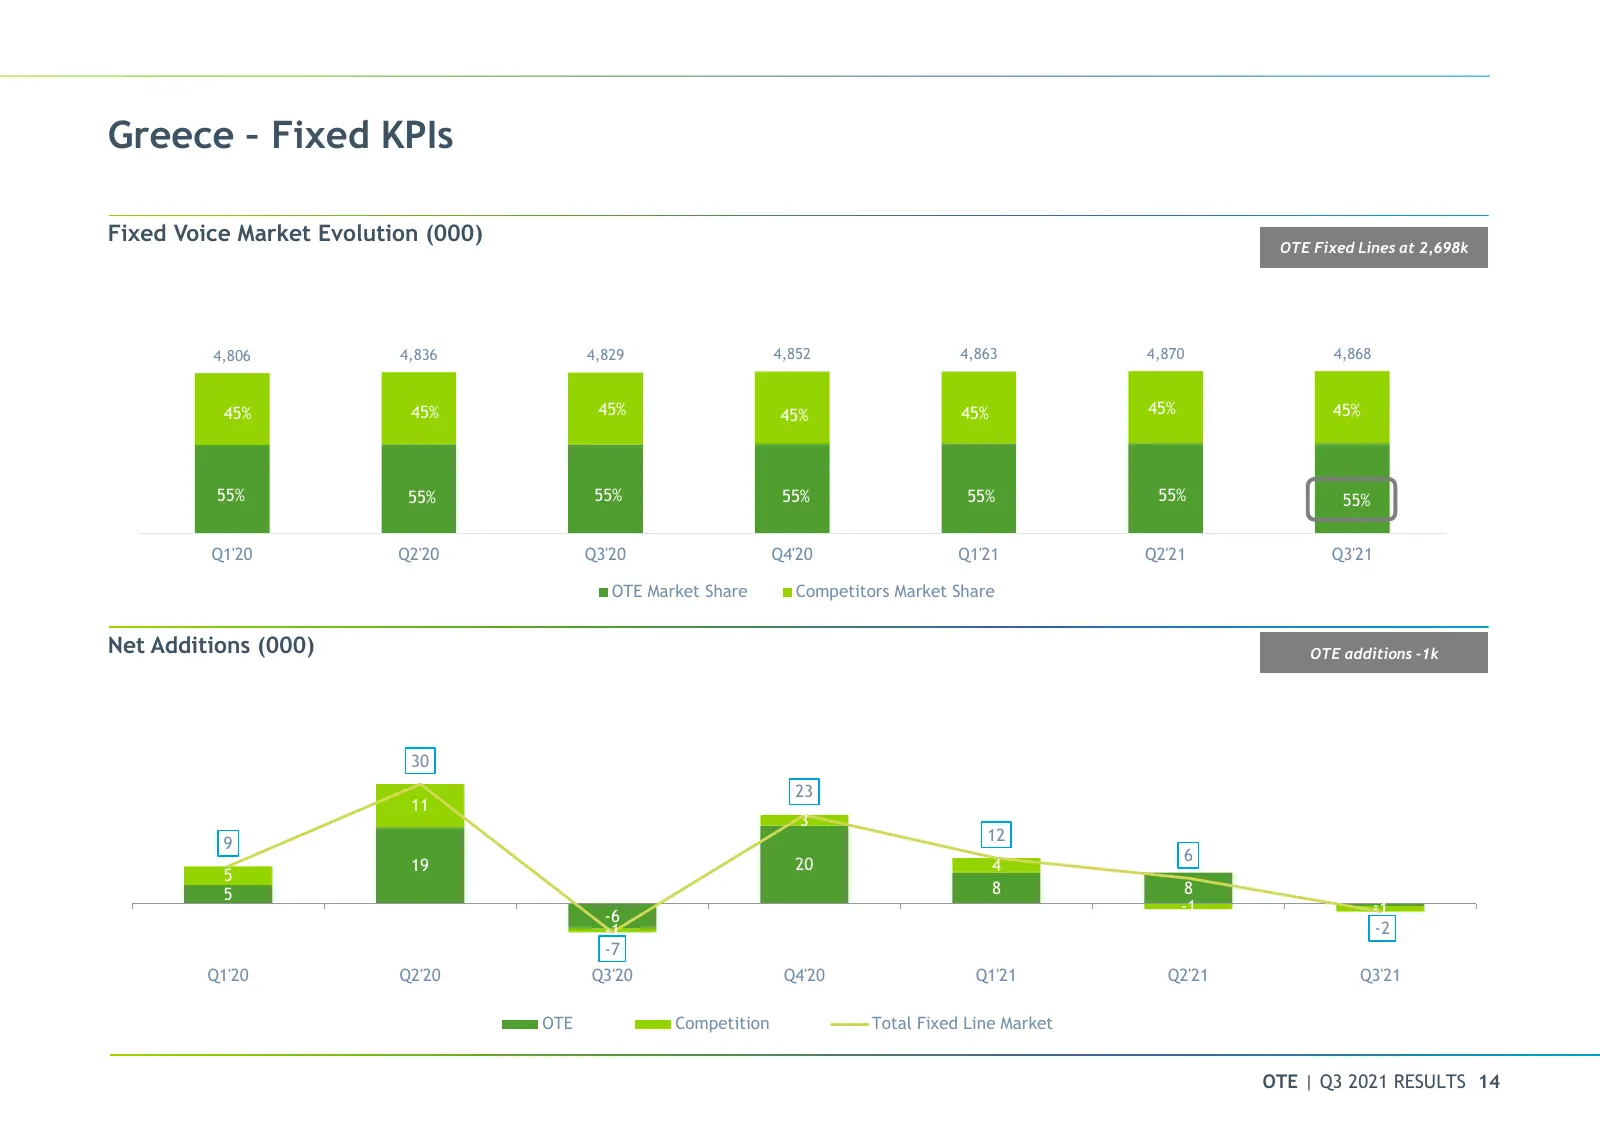
Greece – Fixed KPIs Fixed Voice Market Evolution (000) OTE Fixed Lines at 2,698k 4,806 4,836 4,829 4,852 4,863 4,870 4,868 45% 44% 44% 45% 45% 45% 45% 45% 45% 45% 45% 44% 44% 45% 45% 45% 45% 45% 45% 45% 45% 45% 45% 45% 45% 45% 45% 45% 55% 56% 56% 55% 55% 55% 55% 55% 55% 55% 55% 56% 56% 55% 55% 55% 5
Slide 15: Greece – Broadband KPIs
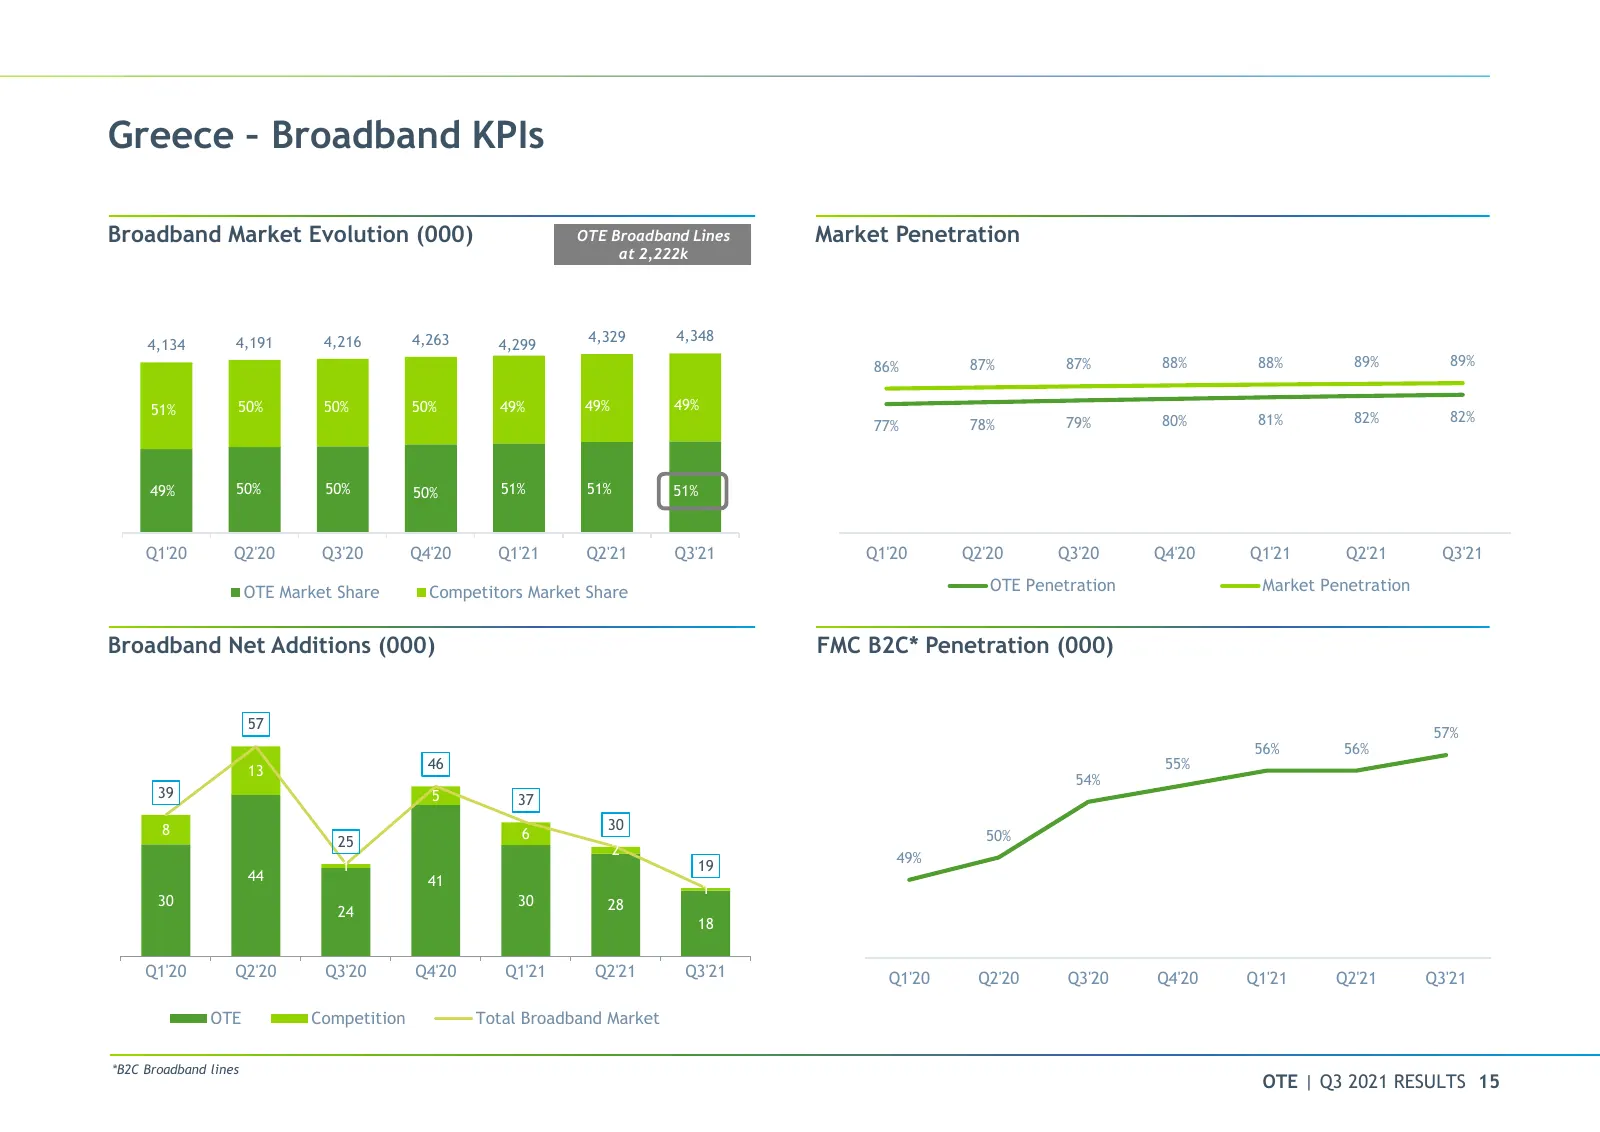
Greece – Broadband KPIs Broadband Market Evolution (000) OTE Broadband Lines Market Penetration at 2,222k 4,263 4,329 4,348 120% 4,134 4,191 4,216 4,299 100% 86% 87% 87% 88% 88% 89% 89% 50% 50% 50% 49% 49% 80% 51% 49% 78% 79% 80% 81% 82% 82% 60% 77% 40% 49% 50% 50% 50% 51% 51% 51% 20% 0% Q1'20 Q2'20
Slide 16: Greece – Fiber KPIs
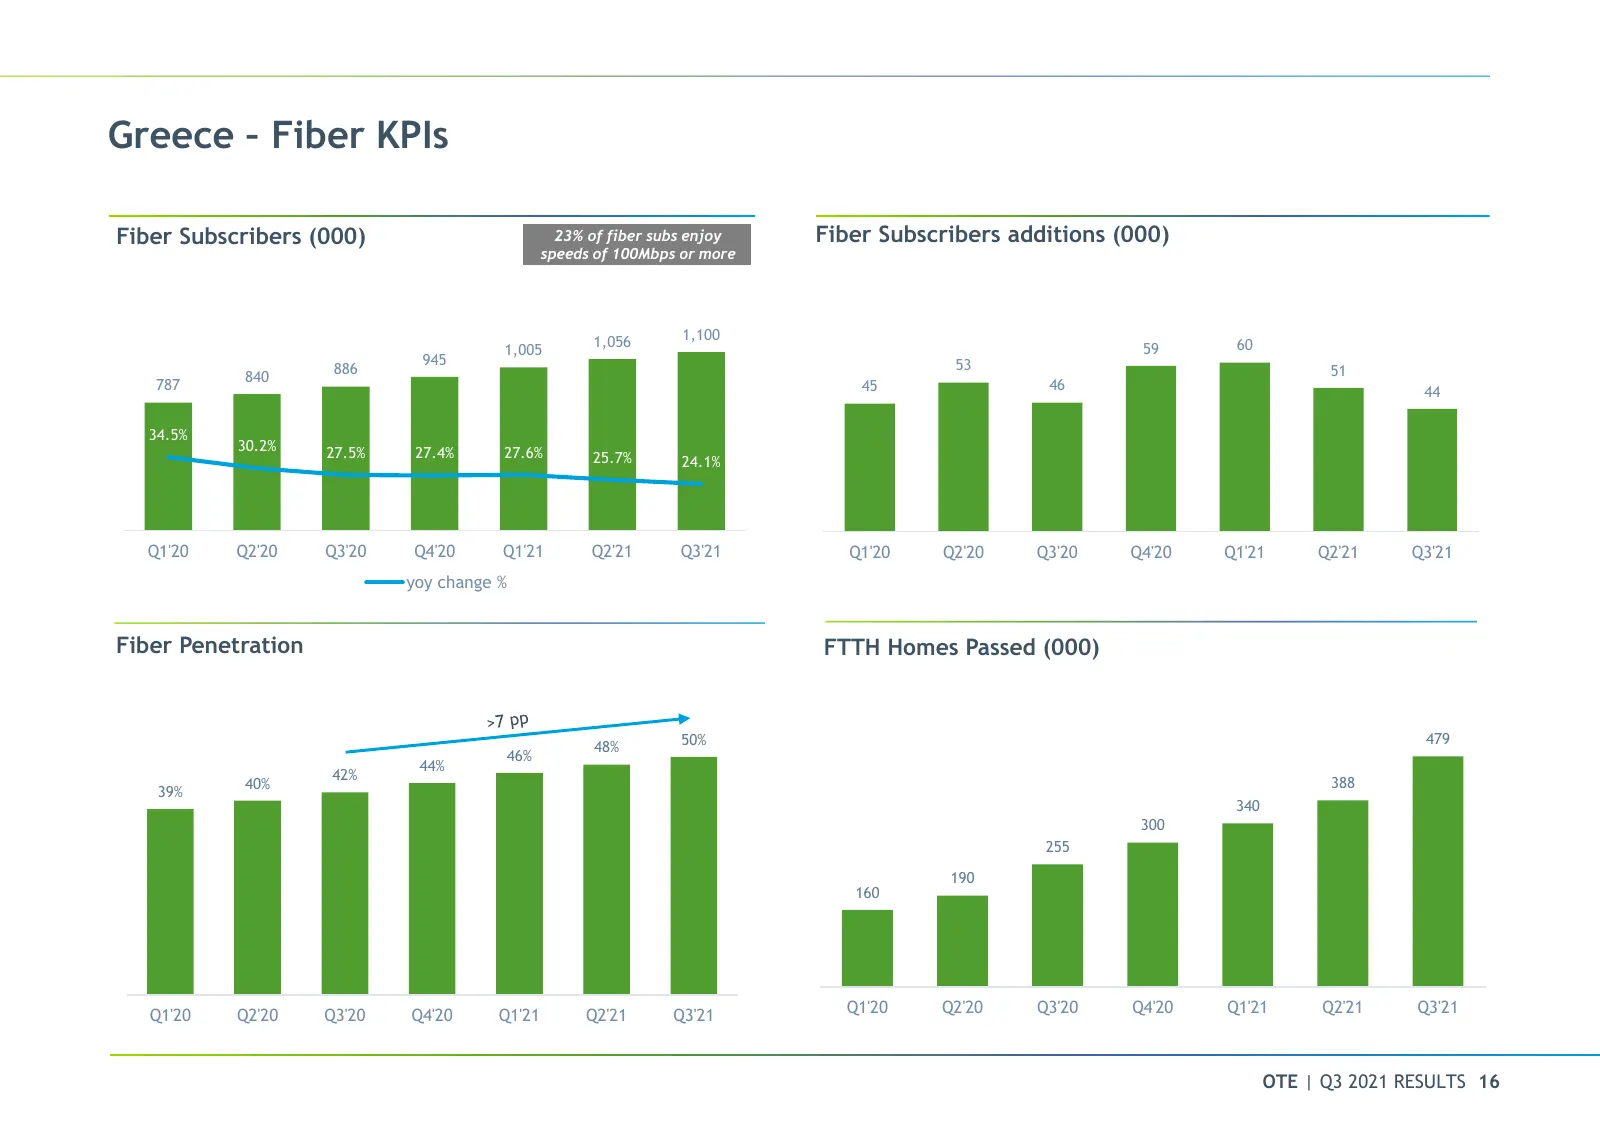
Greece – Fiber KPIs Fiber Subscribers (000) 23% of fiber subs enjoy Fiber Subscribers additions (000) speeds of 100Mbps or more 1,500 100.0% 80 90.0% 1,300 1,056 1,100 70 60 80.0% 1,100 1,005 59 945 53 886 60 51 70.0% 840 900 787 60.0% 50 45 46 44 700 50.0% 40 34.5% 30.2% 40.0% 27.5% 27.4% 27.6% 30
Slide 17: Greece – COSMOTE TV
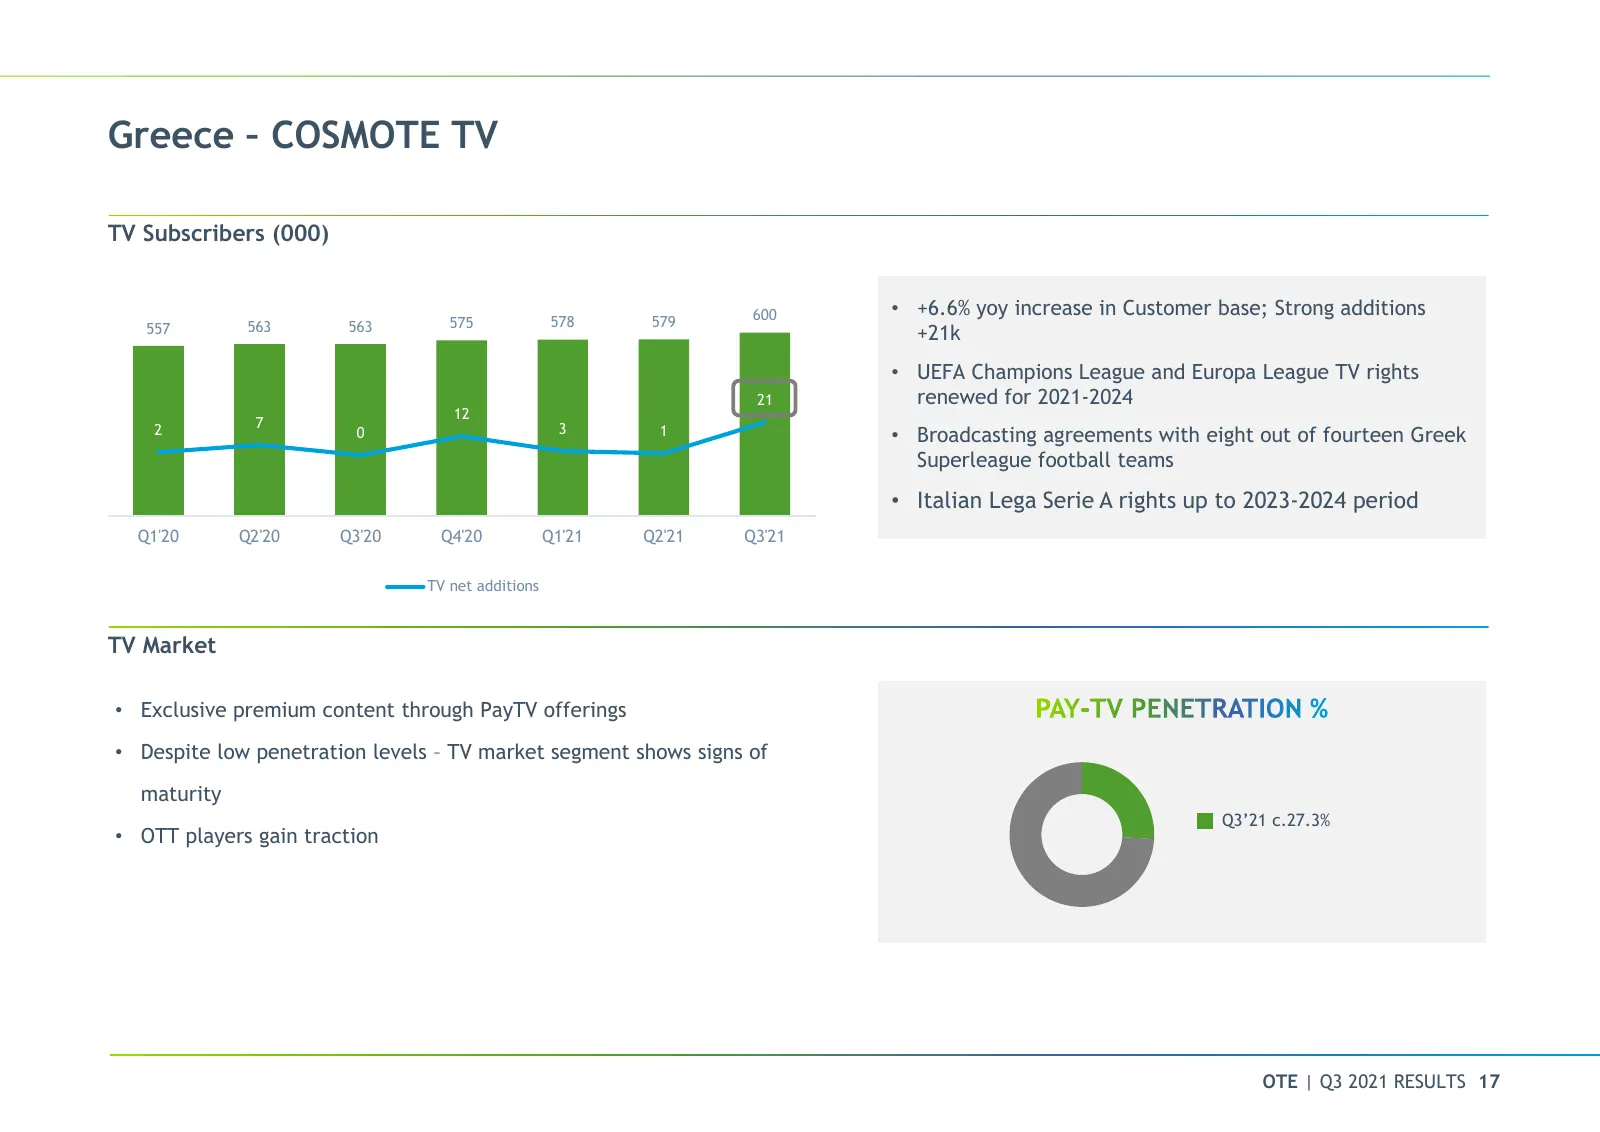
Greece – COSMOTE TV TV Subscribers (000) • +6.6% yoy increase in Customer base; Strong additions 700 100 575 578 579 600 557 563 563 600 80 +21k • UEFA Champions League and Europa League TV rights 500 60 400 21 40 renewed for 2021-2024 12 2 7 3 20 1 300 0 • Broadcasting agreements with eight out of
Slide 18: Greece – Mobile KPIs
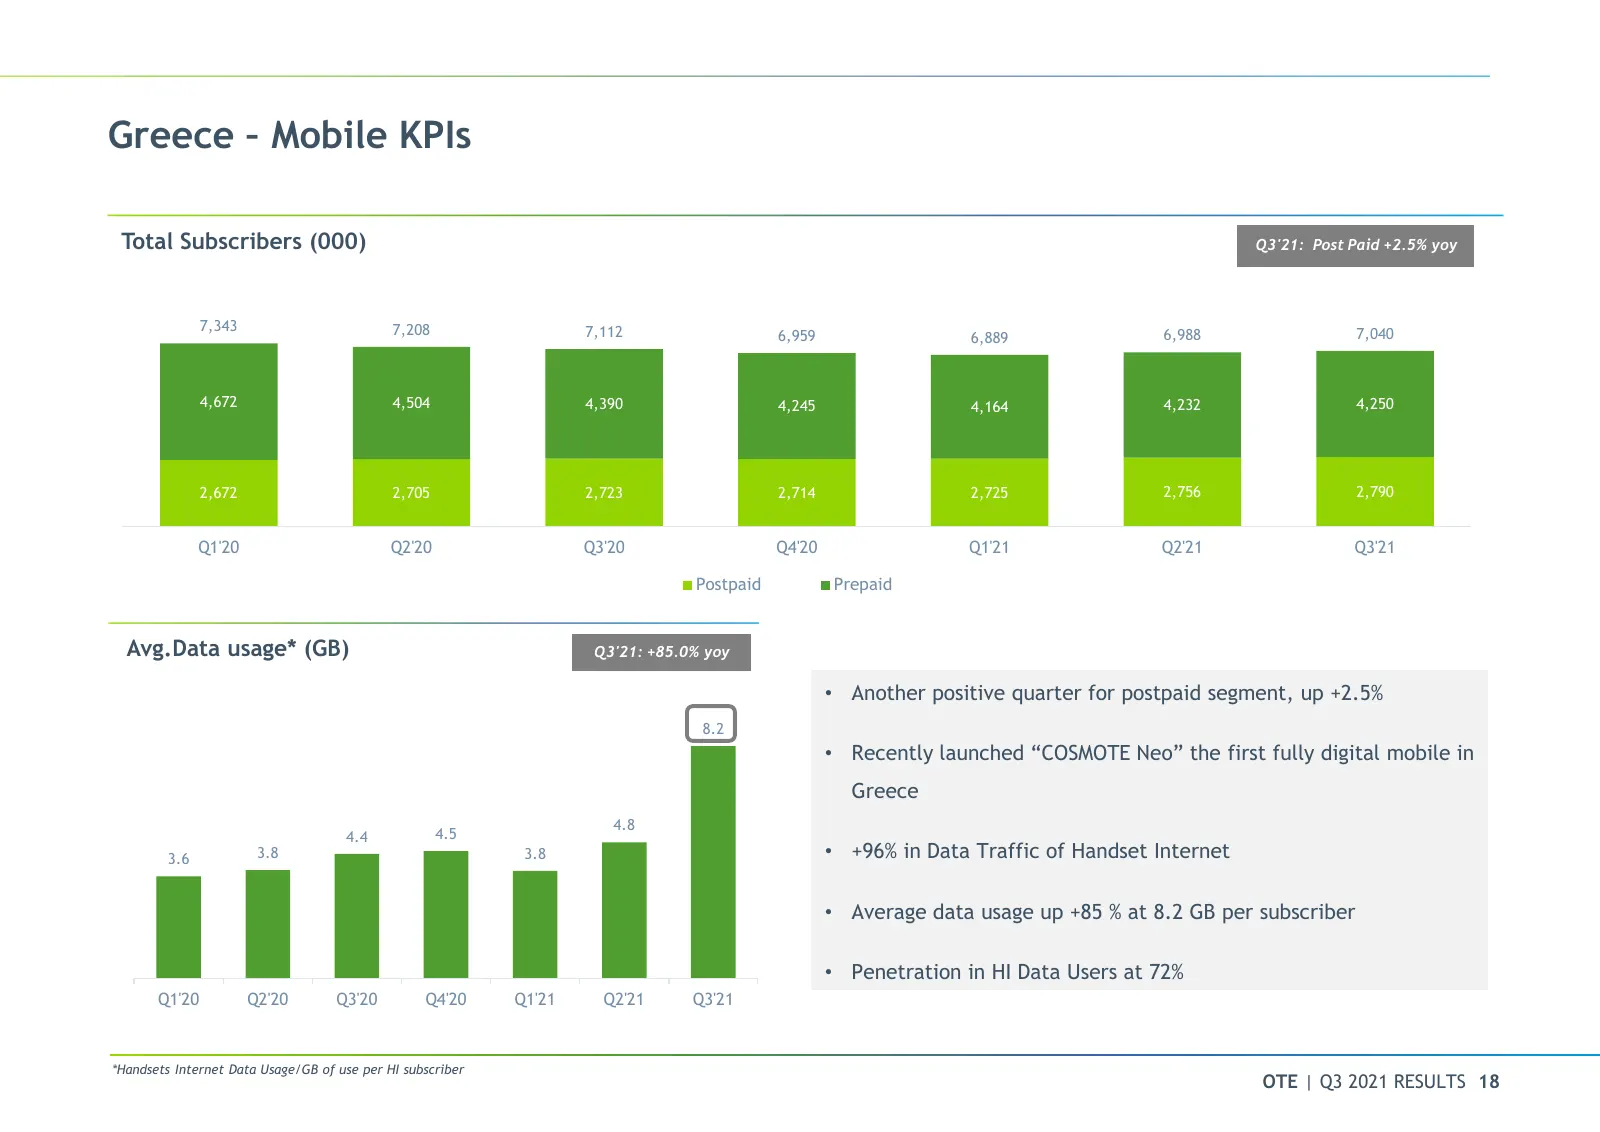
Greece – Mobile KPIs Total Subscribers (000) Q3'21: Post Paid +2.5% yoy 7,343 7,208 7,112 7,040 6,959 6,889 6,988 4,672 4,504 4,390 4,245 4,164 4,232 4,250 2,672 2,705 2,723 2,714 2,725 2,756 2,790 Q1'20 Q2'20 Q3'20 Q4'20 Q1'21 Q2'21 Q3'21 Postpaid Prepaid Avg.Data usage* (GB) Q3'21: +85.0% yoy • An
Slide 19: Greece – Digitalization
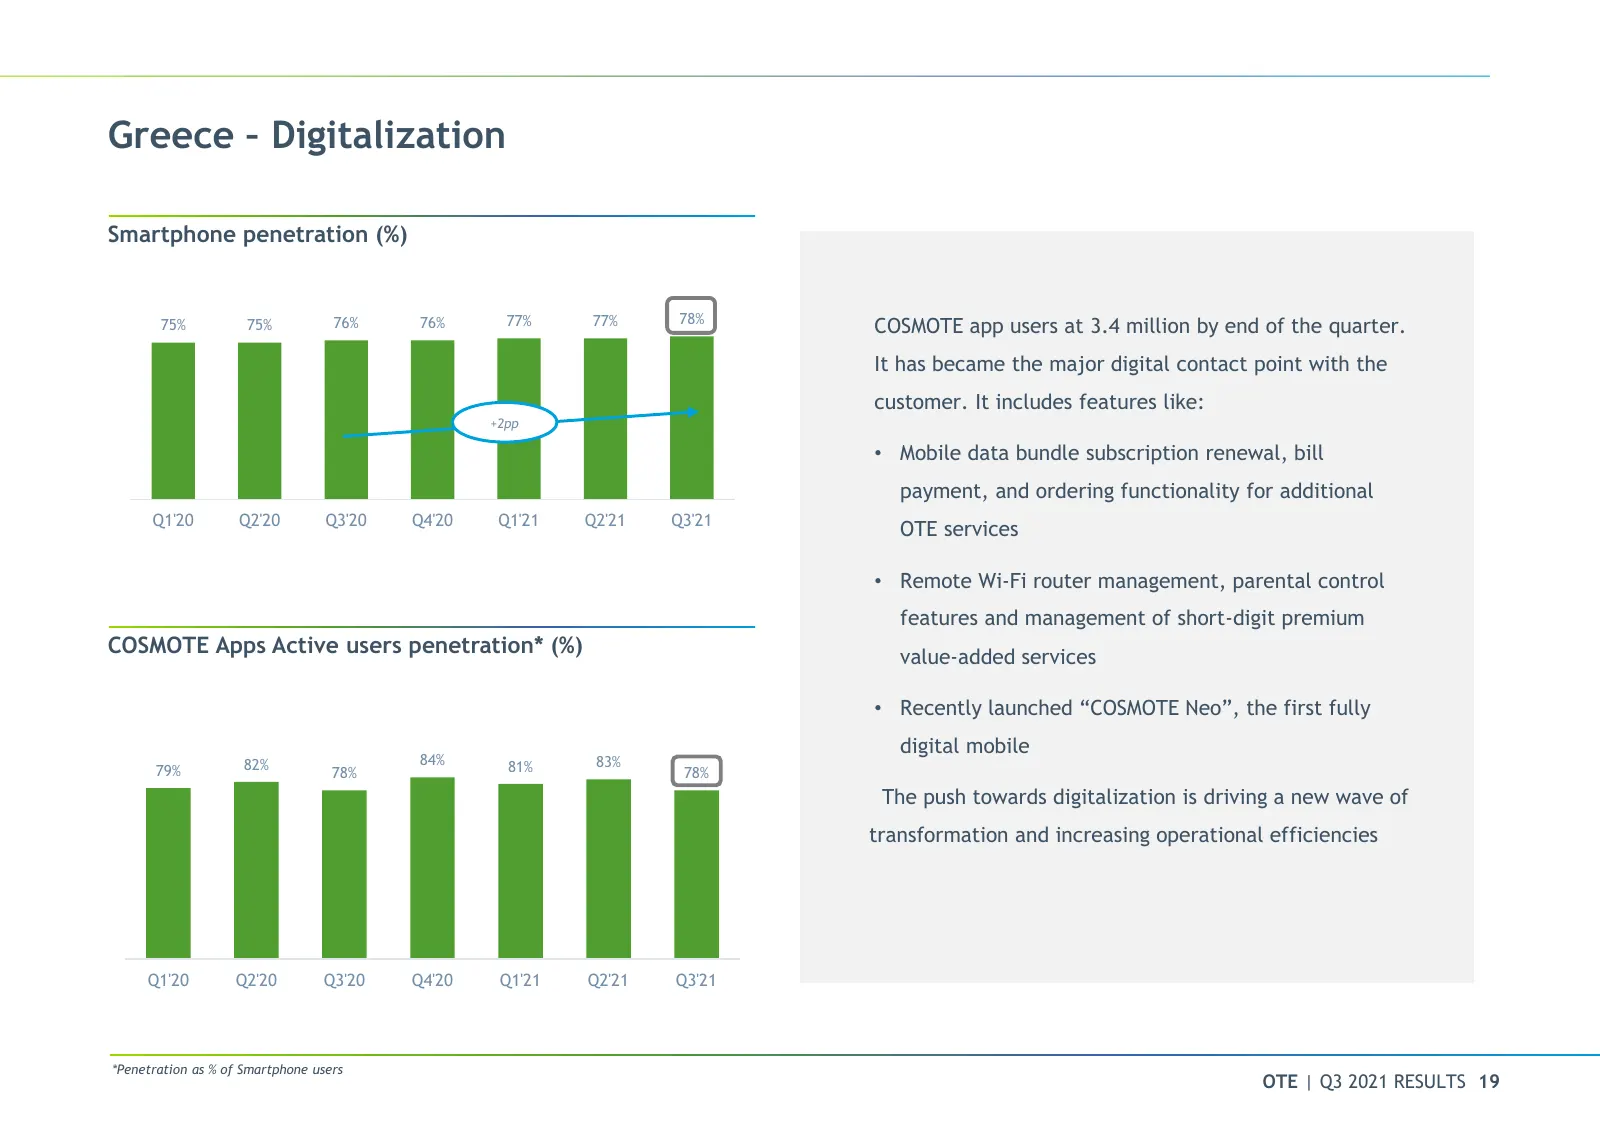
Greece – Digitalization Smartphone penetration (%) 90% 77% 77% 78% 80% 75% 75% 76% 76% COSMOTE app users at 3.4 million by end of the quarter. 70% 60% It has became the major digital contact point with the customer. It includes features like: 50% 40% +2pp 30% 20% • Mobile data bundle subscription re
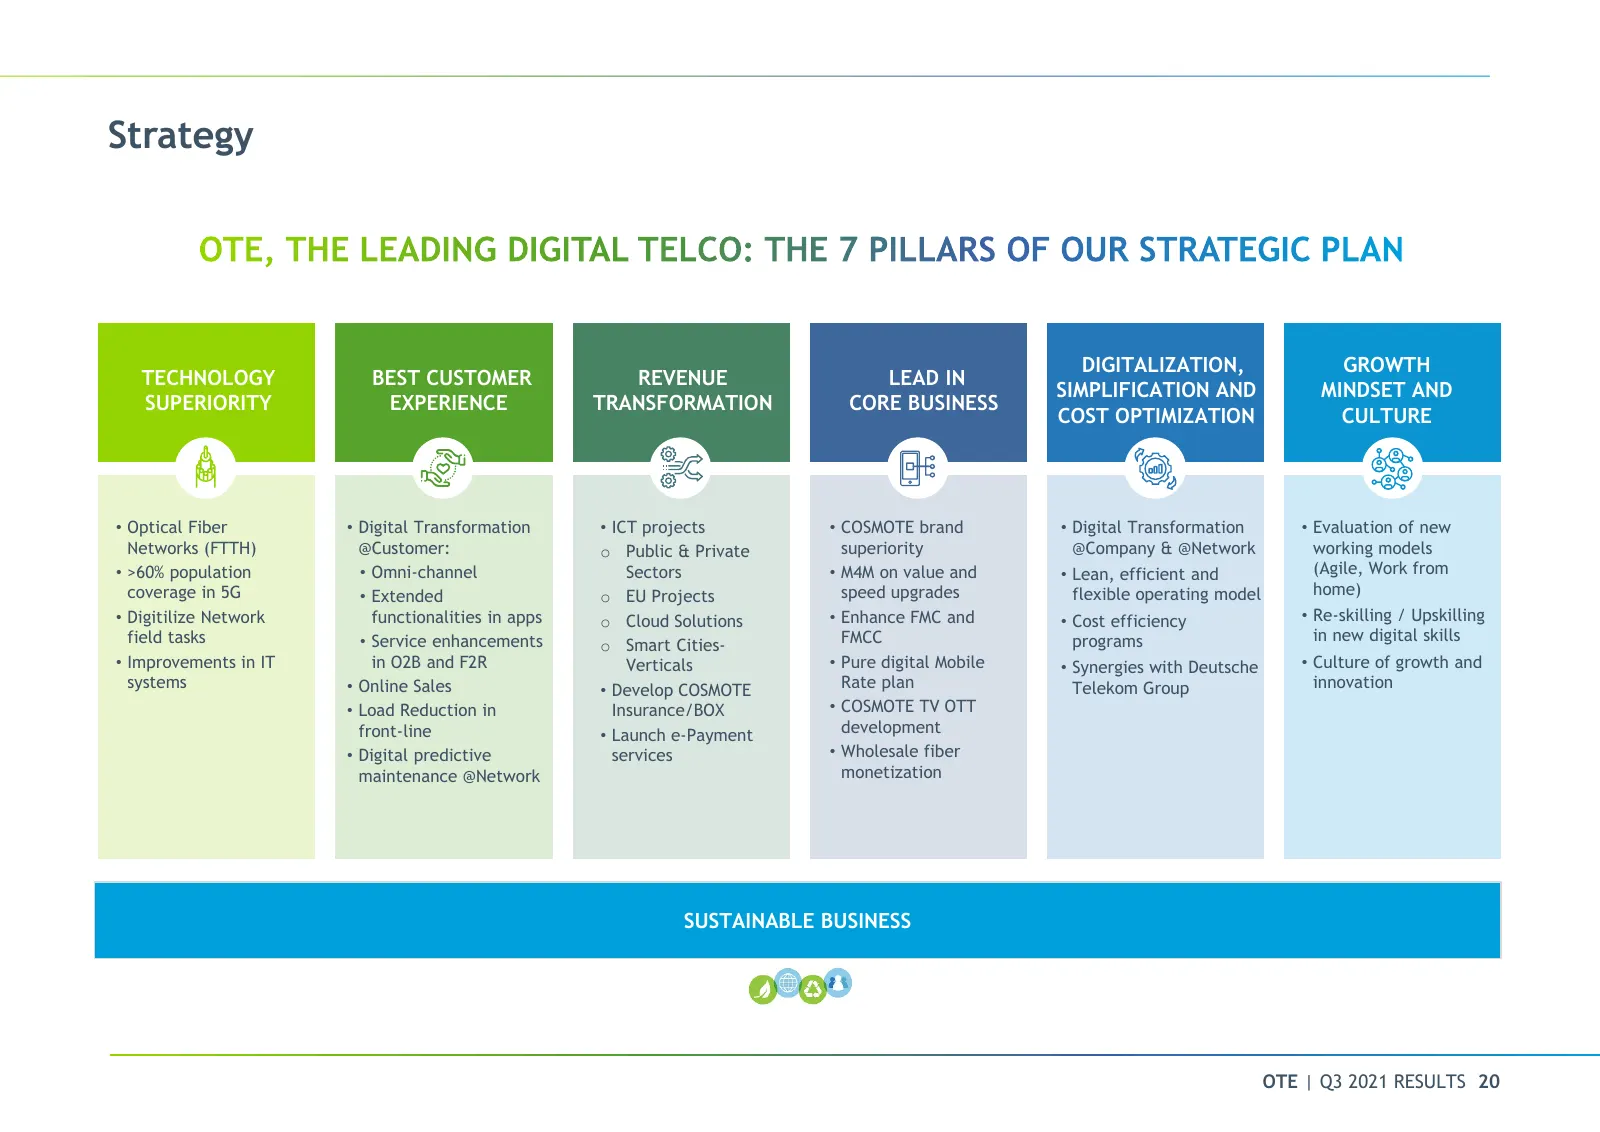
Slide 20: Strategy
Strategy DIGITALIZATION, GROWTH TECHNOLOGY BEST CUSTOMER REVENUE LEAD IN SIMPLIFICATION AND MINDSET AND SUPERIORITY EXPERIENCE TRANSFORMATION CORE BUSINESS COST OPTIMIZATION CULTURE • Optical Fiber • Digital Transformation • ICT projects • COSMOTE brand • Digital Transformation • Evaluation of new N
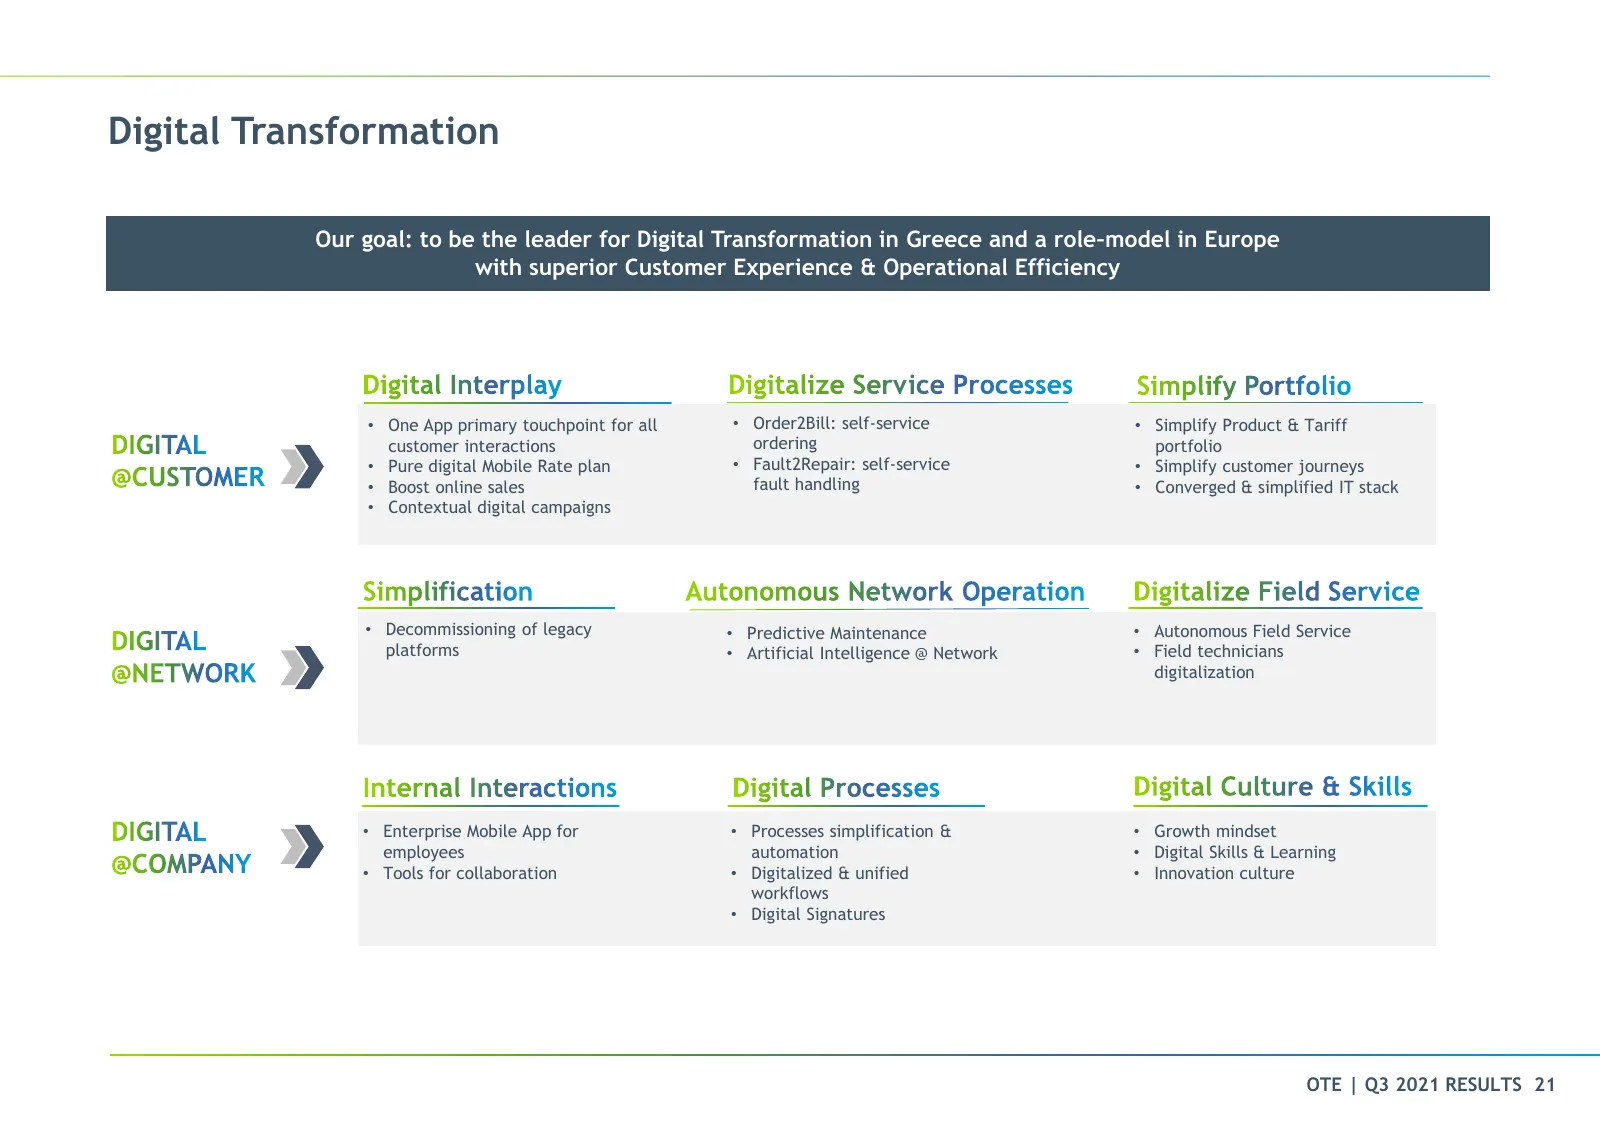
Slide 21: Digital Transformation
Digital Transformation Our goal: to be the leader for Digital Transformation in Greece and a role–model in Europe with superior Customer Experience & Operational Efficiency • One App primary touchpoint for all • Order2Bill: self-service • Simplify Product & Tariff customer interactions ordering port
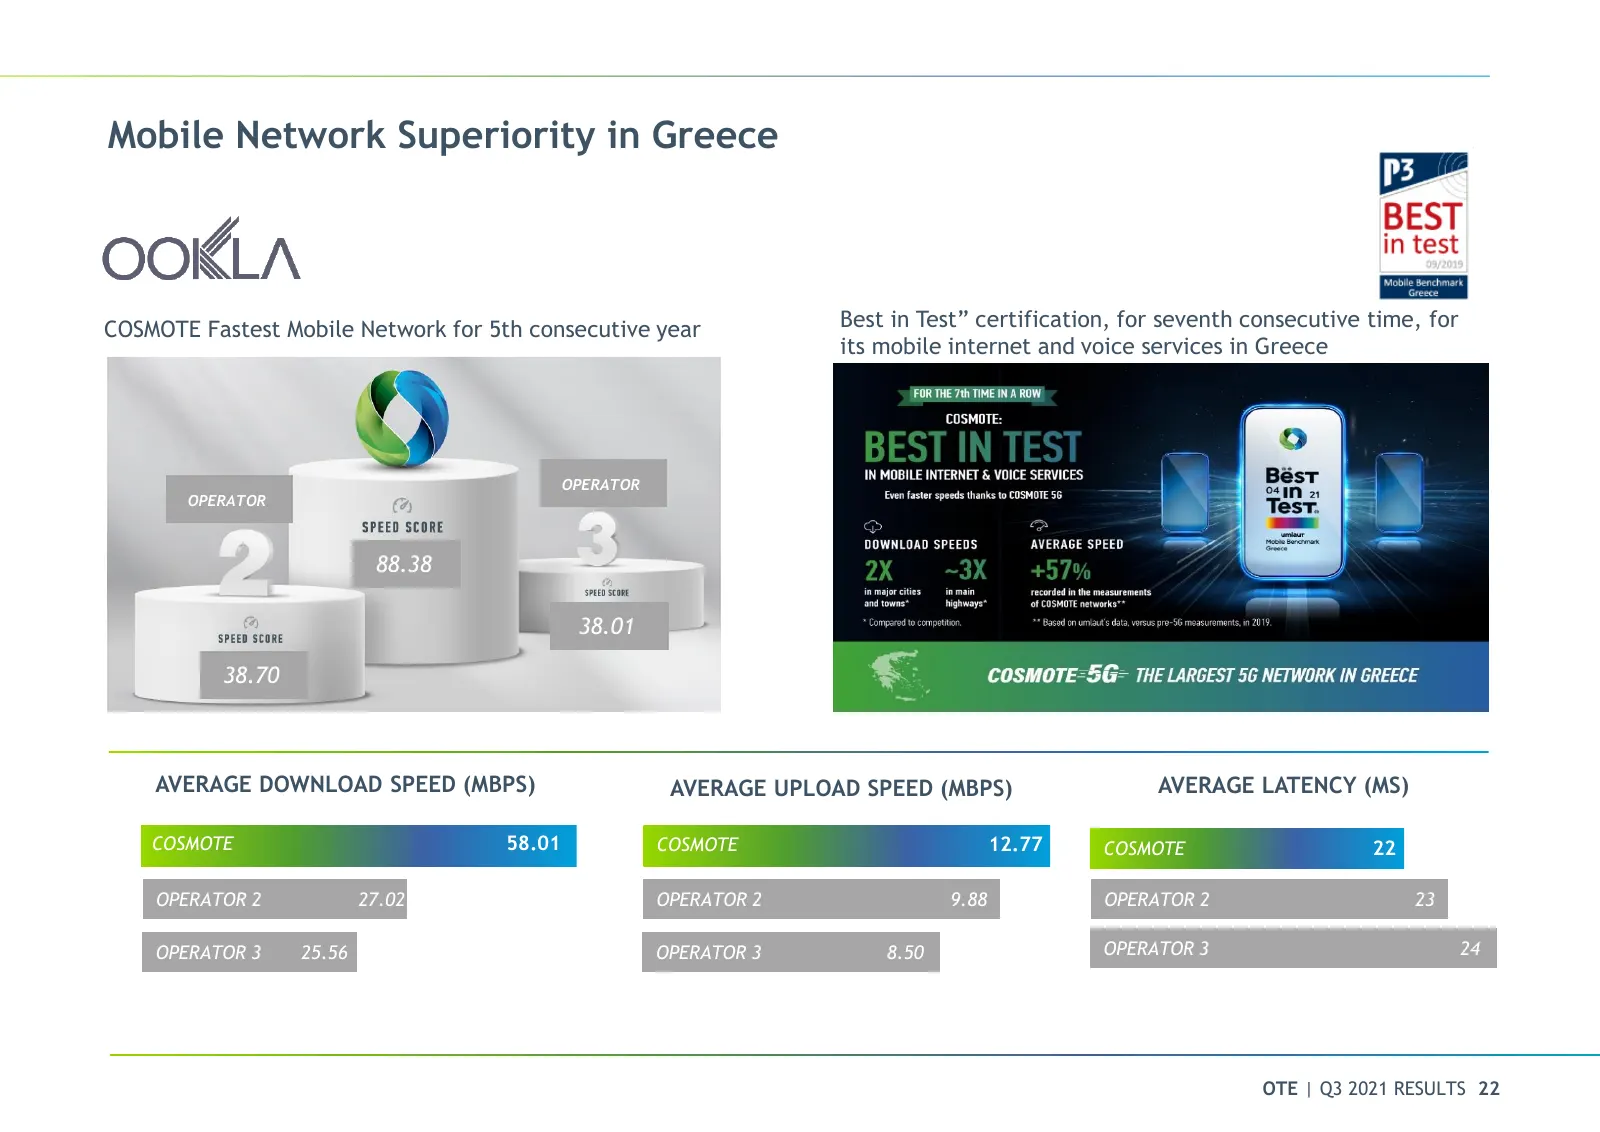
Slide 22: Mobile Network Superiority in Greece
Mobile Network Superiority in Greece COSMOTE Fastest Mobile Network for 5th consecutive year Best in Test” certification, for seventh consecutive time, for its mobile internet and voice services in Greece OPERATOR OPERATOR 88.38 38.01 38.70 AVERAGE DOWNLOAD SPEED (MBPS) AVERAGE UPLOAD SPEED (MBPS) A
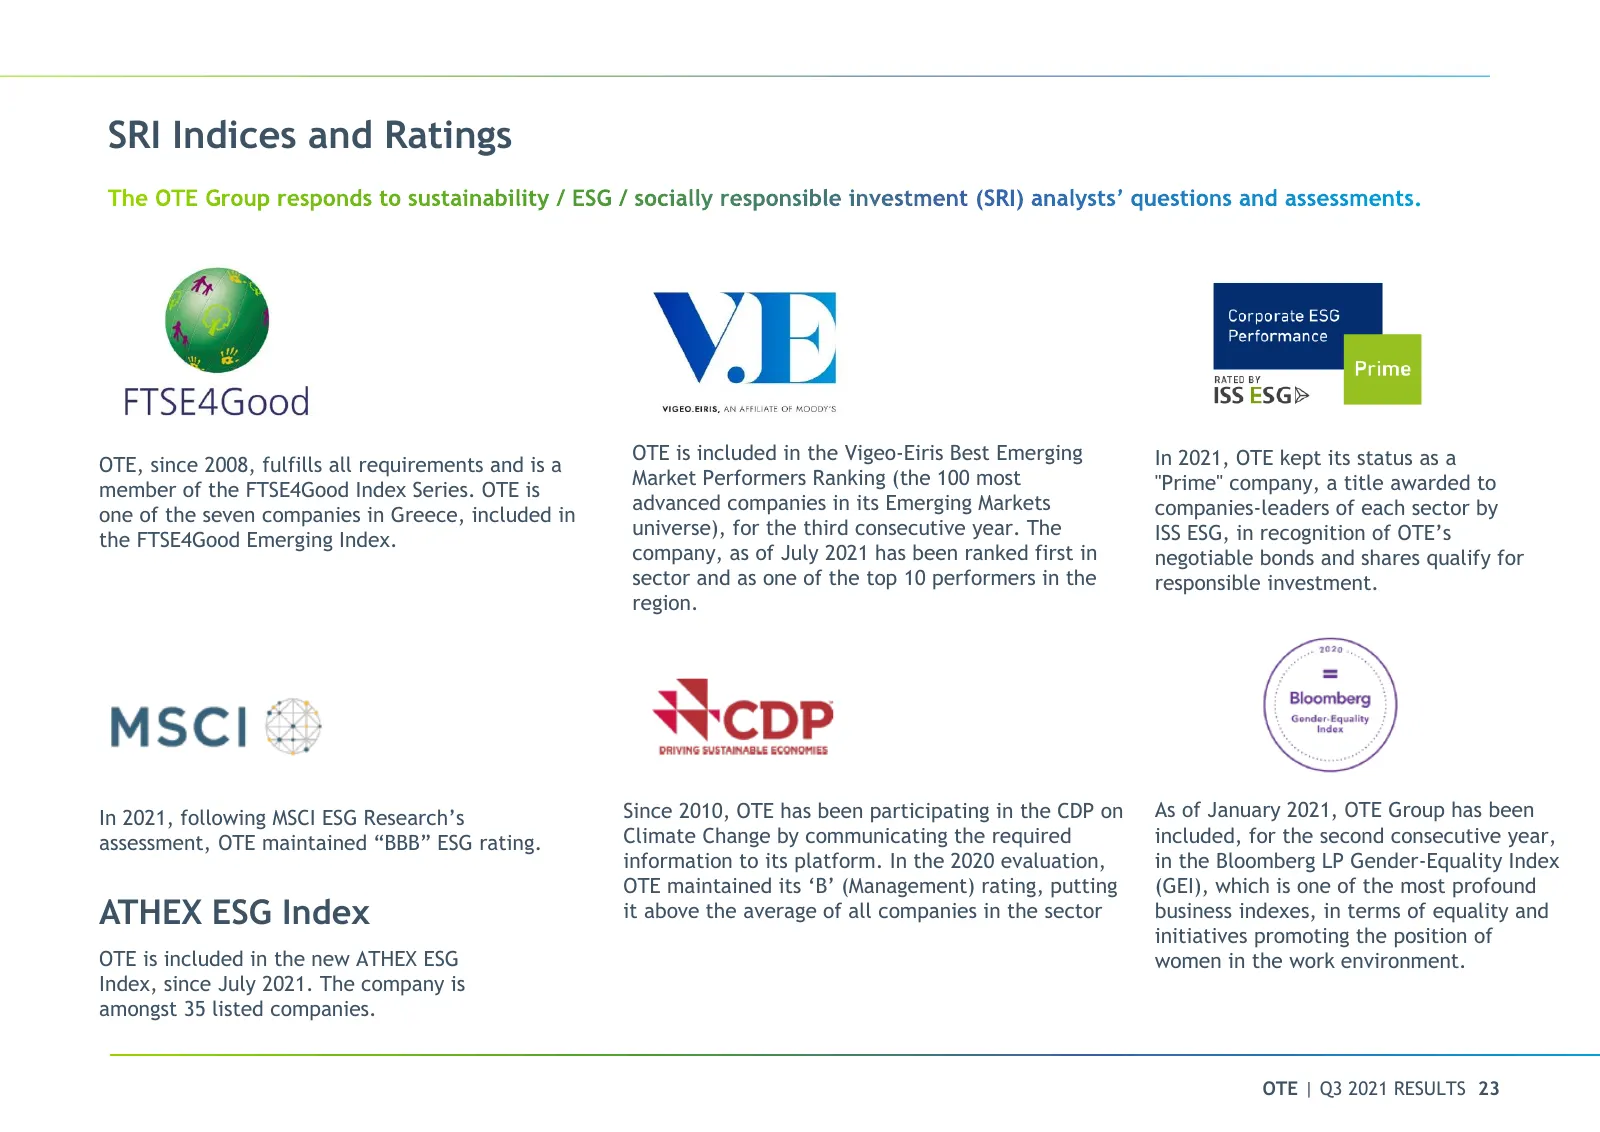
Slide 23: SRI Indices and Ratings
SRI Indices and Ratings OTE is included in the Vigeo-Eiris Best Emerging In 2021, OTE kept its status as a OTE, since 2008, fulfills all requirements and is a Market Performers Ranking (the 100 most "Prime" company, a title awarded to member of the FTSE4Good Index Series. OTE is advanced companies i
Slide 24: Environmental Targets
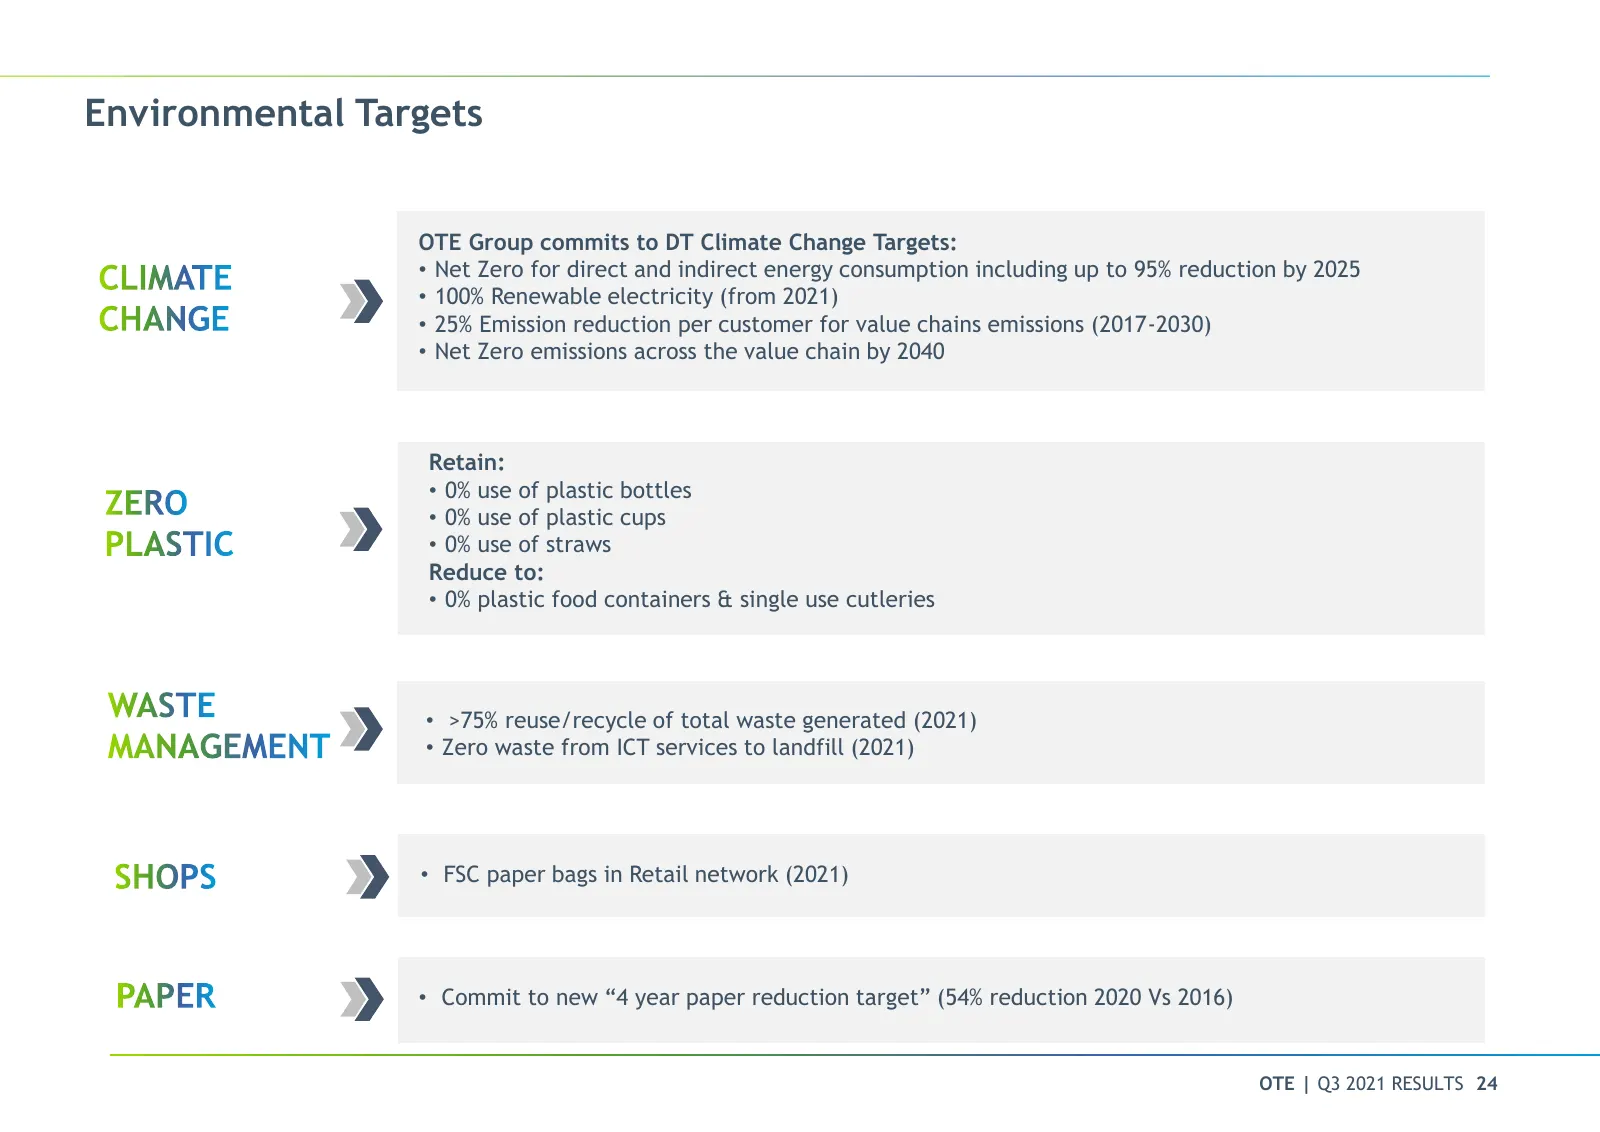
Environmental Targets OTE Group commits to DT Climate Change Targets: • Net Zero for direct and indirect energy consumption including up to 95% reduction by 2025 • 100% Renewable electricity (from 2021) • 25% Emission reduction per customer for value chains emissions (2017-2030) • Net Zero emissions

Slide 25: Romania Mobile
Romania Mobile OTE | Q2 2020 RESULTS 25
Slide 26: Romania – Financial Overview
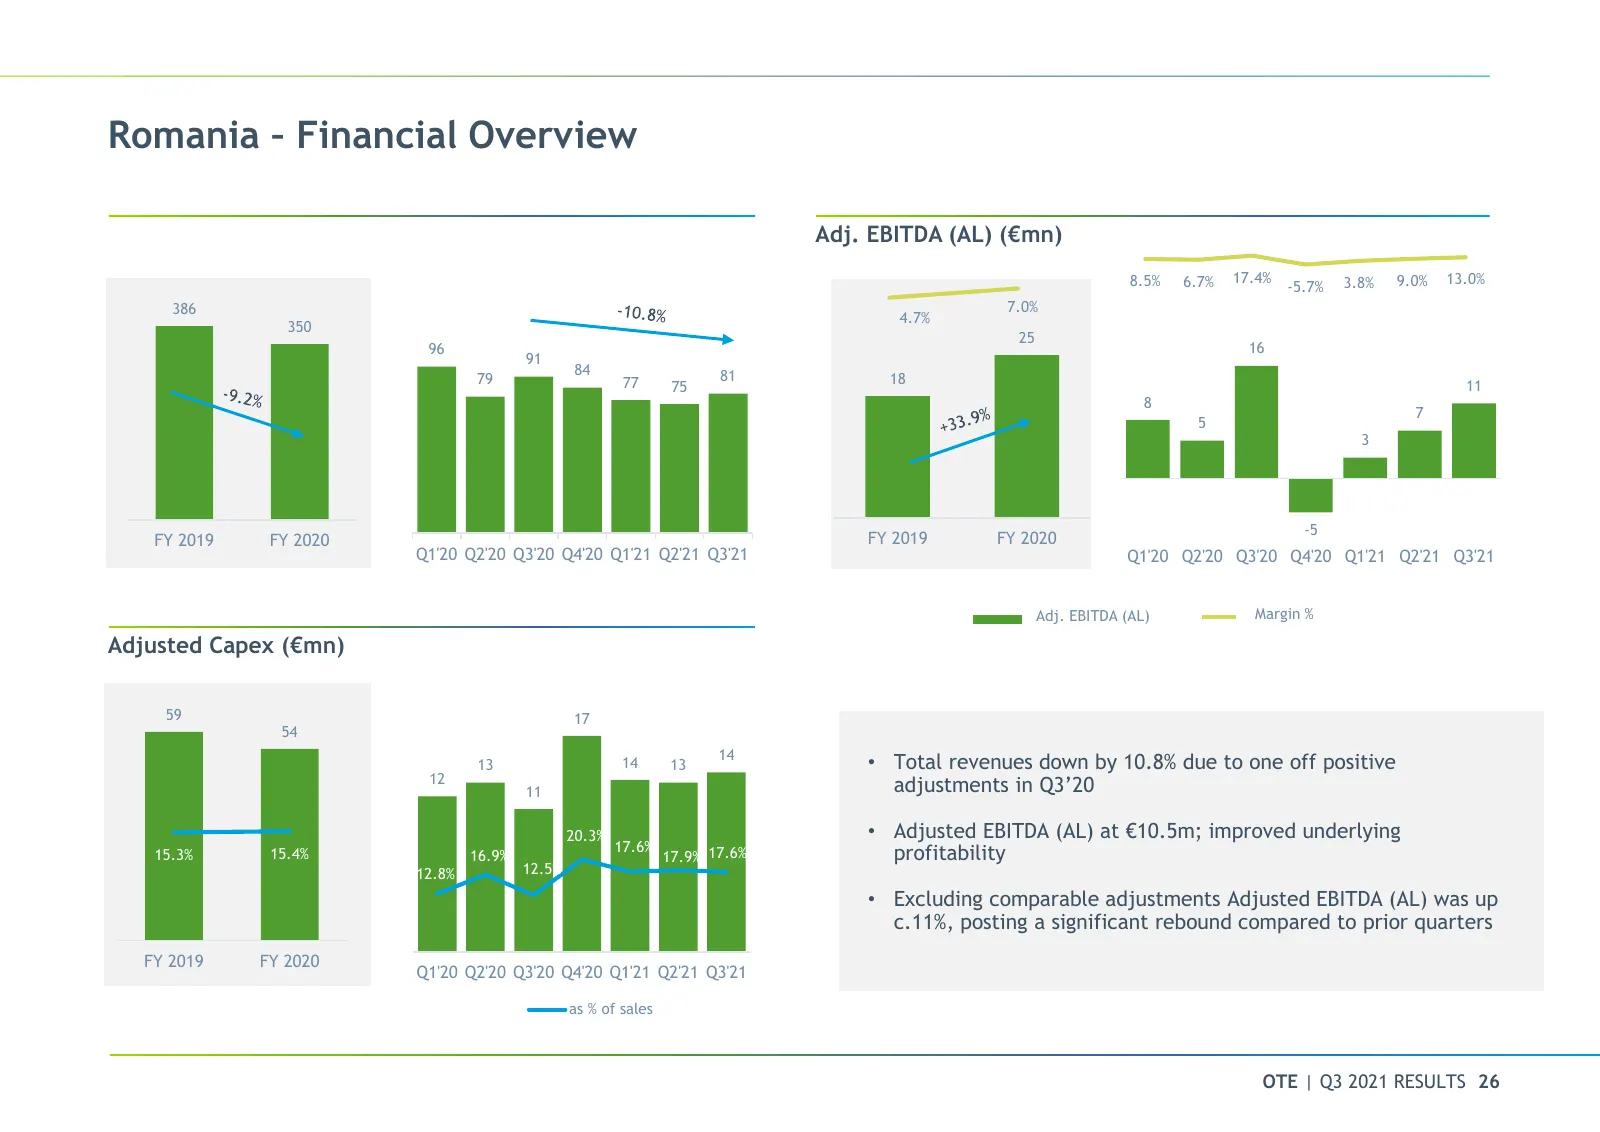
Romania – Financial Overview Adj. EBITDA (AL) (€mn) 8.5% 6.7% 17.4% 3.8% 9.0% 13.0% -5.7% 386 7.0% 30 4.7% 350 120 25 96 25 16 100 91 17 1.6 84 81 79 77 18 11 80 75 20 12 8 1.1 7 5 15 60 7 0.6 10 3 40 2 0.1 5 20 -3 -0.4 0 -5 FY 2019 FY 2020 FY 2019 FY 2020 0 -8 -0.9 Q1'20 Q2'20 Q3'20 Q4'20 Q1'21 Q2'
Slide 27: Romania – Financial Overview
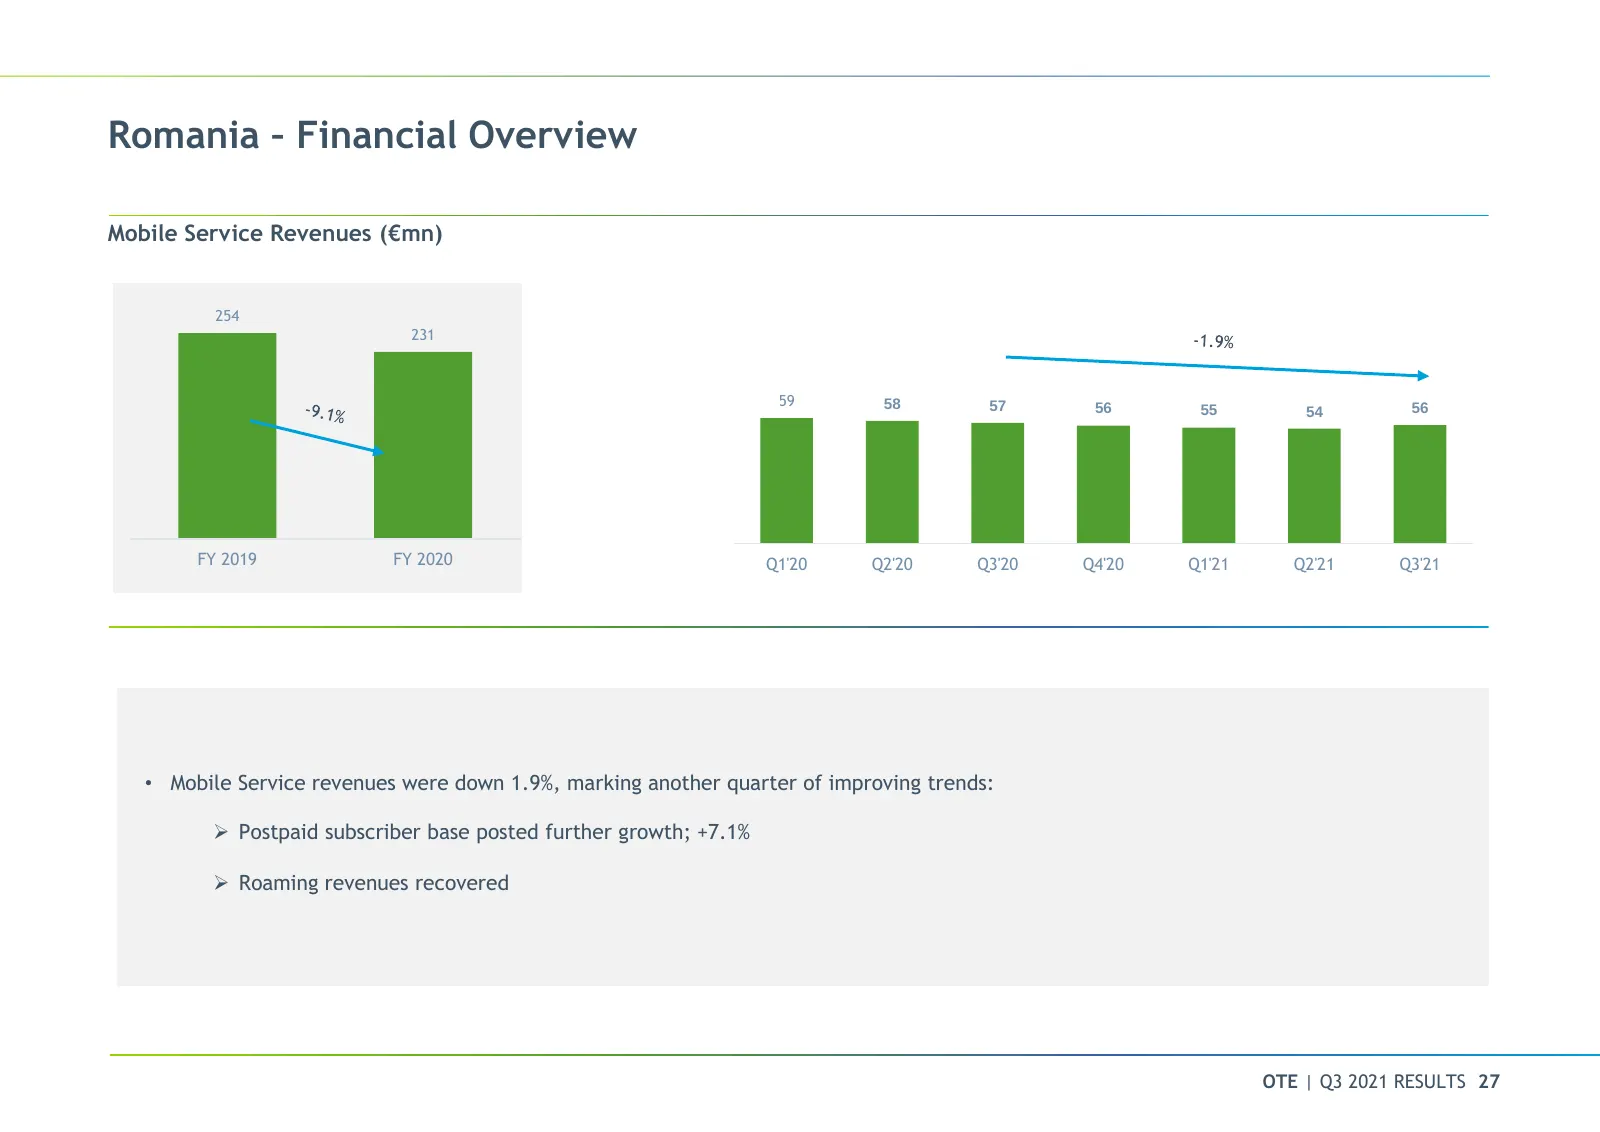
Romania – Financial Overview Mobile Service Revenues (€mn) 254 231 90 80 59 70 58 57 56 55 56 60 54 50 40 30 20 10 0 FY 2019 FY 2020 Q1'20 Q2'20 Q3'20 Q4'20 Q1'21 Q2'21 Q3'21 • Mobile Service revenues were down 1.9%, marking another quarter of improving trends: Postpaid subscriber base posted furt
Slide 28: Romania – Mobile KPIs
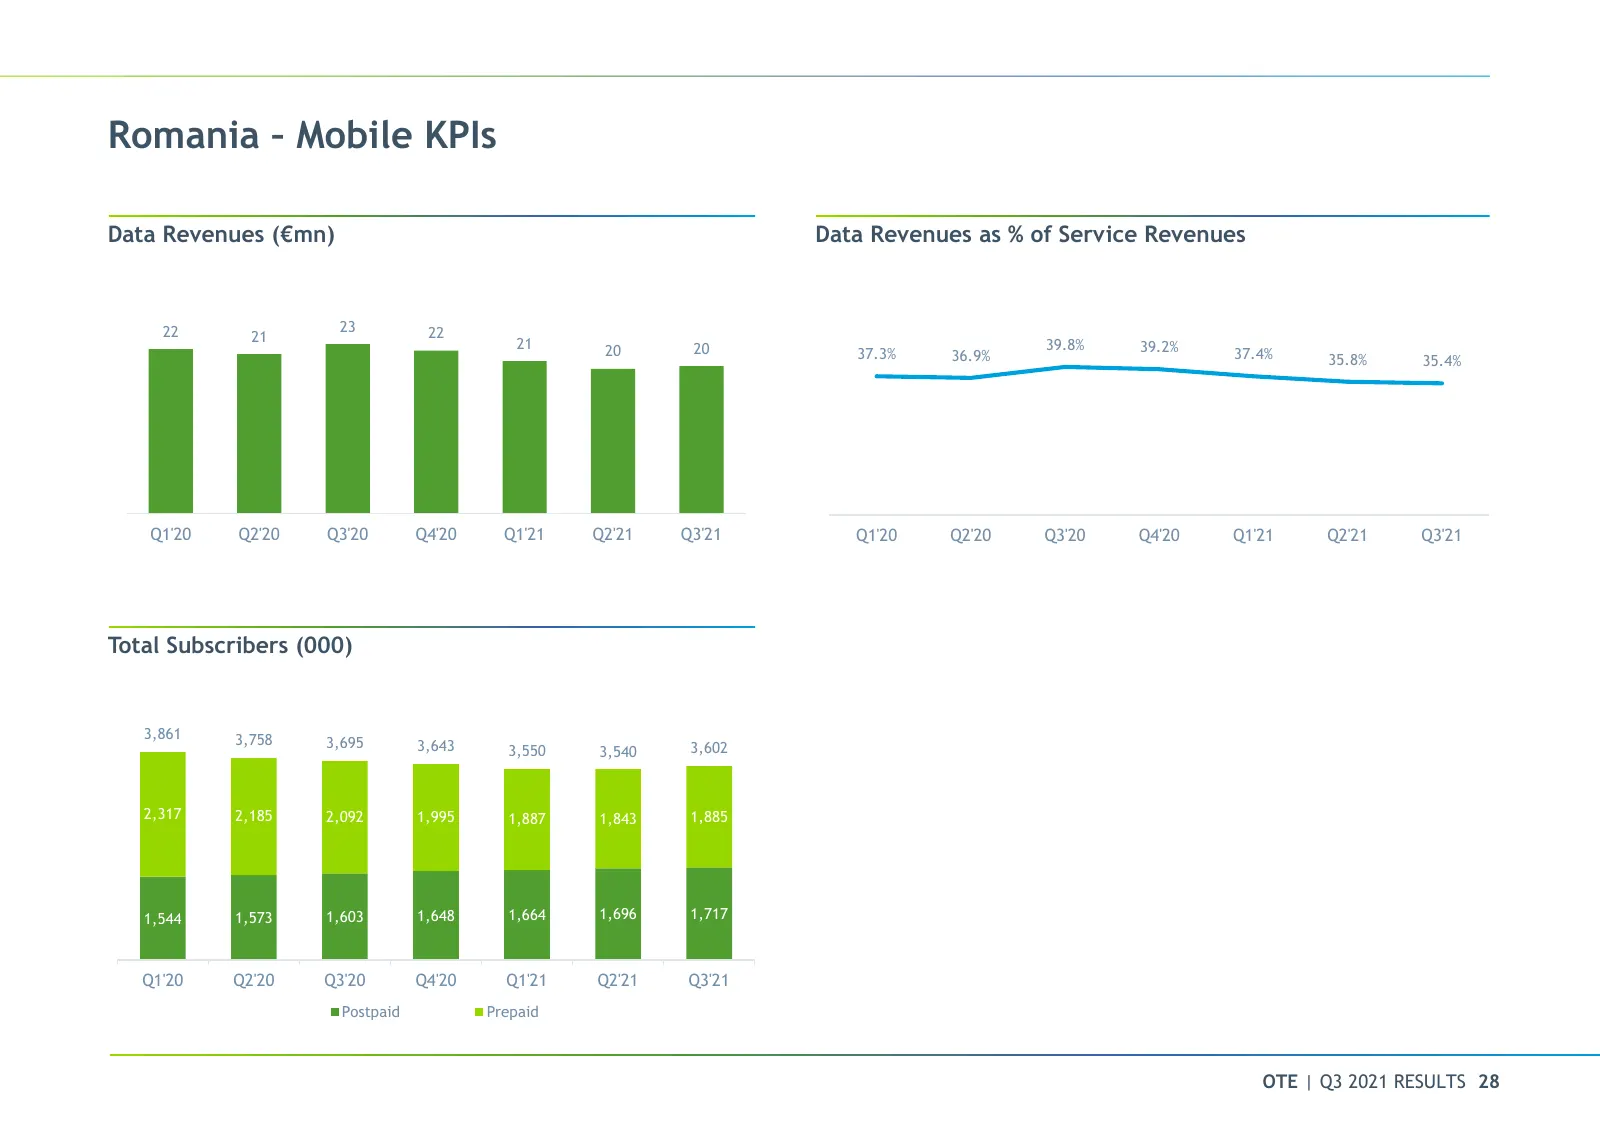
Romania – Mobile KPIs Data Revenues (€mn) Data Revenues as % of Service Revenues 30 25 22 23 22 21 21 20 20 39.8% 39.2% 20 37.3% 36.9% 37.4% 35.8% 35.4% 15 10 5 0 Q1'20 Q2'20 Q3'20 Q4'20 Q1'21 Q2'21 Q3'21 Q1'20 Q2'20 Q3'20 Q4'20 Q1'21 Q2'21 Q3'21 Total Subscribers (000) 3,861 3,758 3,695 3,643 3,602

Slide 29: Thank you
Thank you OTE | Q2 2020 RESULTS 29
Source: Internet Archive copy of cosmote.gr
More decks from Hellenic Telecommunications Organization SA
 OTE Group — Q2 2026 Earnings Presentation25 slides · July 2026
 OTE Group — Q1 2026 Earnings Presentation25 slides · May 2026
 Q4 2025 Earnings Presentation23 slides · Feb 26, 2026
 Q3 2025 Earnings Presentation23 slides · Nov 14, 2025
 Q2 2025 Earnings Presentation31 slides · Aug 6, 2025
 OTE Group — Q1 2025 Earnings Presentation31 slides · May 2025