PetroQuest Energy — Investor Presentation (December 2010)
33 slides from PetroQuest Energy's investor presentation, Dec 6, 2010
Slide 1: December 2010
December 2010
Slide 2: Company Information
Company Information 1 Corporate Contact: Matt Quantz - mquantz@petroquest.com This presentation contains "forward-looking statements" within the meaning of Section 27A of the Securities Act of 1933, as amended, and Section 21E of the Securities Exchange Act of 1934, as amended. These forward-looking
Slide 3: Corporate Characteristics
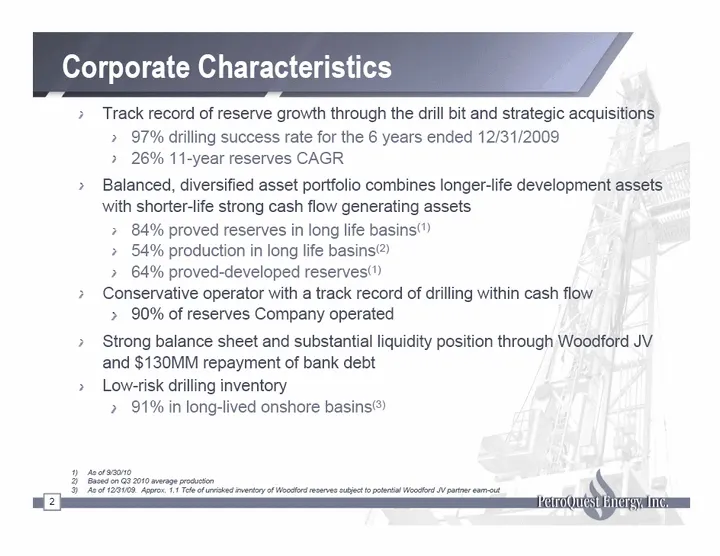
Corporate Characteristics Track record of reserve growth through the drill bit and strategic acquisitions 97% drilling success rate for the 6 years ended 12/31/2009 26% 11-year reserves CAGR Balanced, diversified asset portfolio combines longer-life development assets with shorter-life strong cash f
Slide 4: A History of Consistent Growth
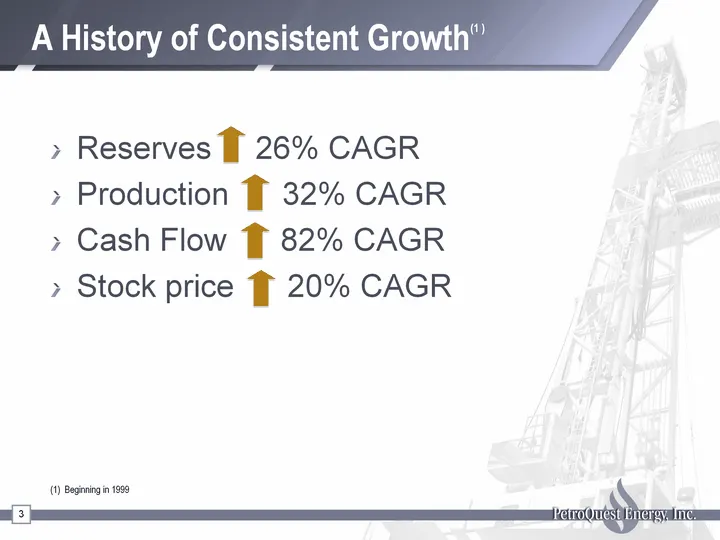
A History of Consistent Growth(1 ) Reserves 26% CAGR Production 32% CAGR Cash Flow 82% CAGR Stock price 20% CAGR 3 (1) Beginning in 1999
Slide 5: Operations Overview
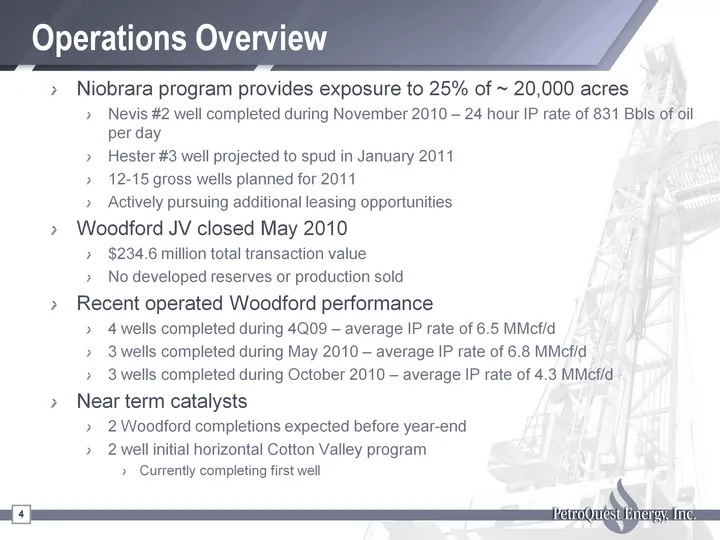
Operations Overview 4 Niobrara program provides exposure to 25% of ~ 20,000 acres Nevis #2 well completed during November 2010 - 24 hour IP rate of 831 Bbls of oil per day Hester #3 well projected to spud in January 2011 12-15 gross wells planned for 2011 Actively pursuing additional leasing opportu
Slide 6: Our Properties
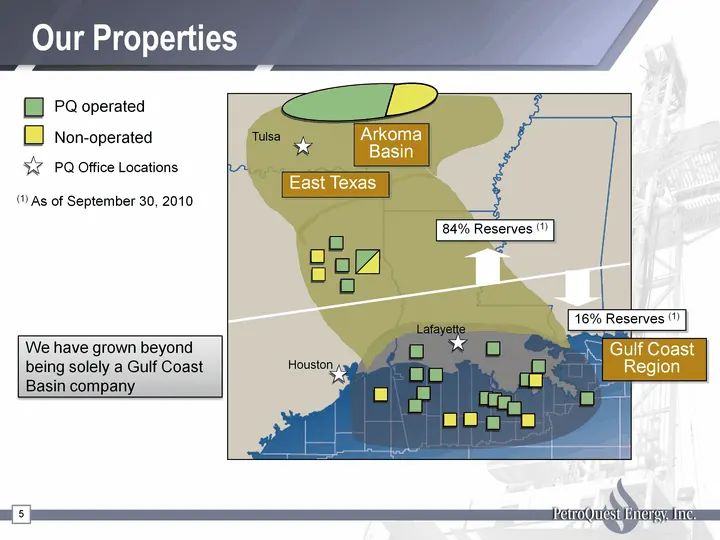
Our Properties 5 Gulf Coast Region Arkoma Basin Tulsa East Texas Lafayette Houston 84% Reserves (1) We have grown beyond being solely a Gulf Coast Basin company 16% Reserves (1) (1) As of September 30, 2010
Slide 7: Our Portfolio: Three separate basins
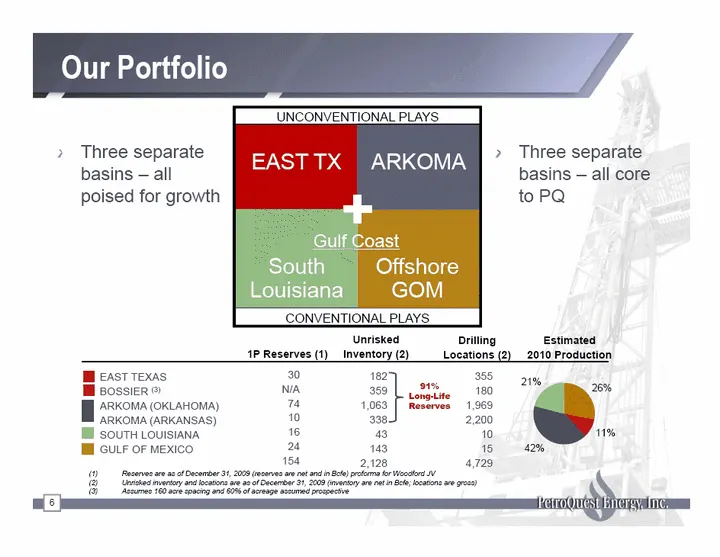
1P Reserves (1) Drilling Locations (2) EAST TEXAS BOSSIER (3) ARKOMA (OKLAHOMA) ARKOMA (ARKANSAS) SOUTH LOUISIANA GULF OF MEXICO Our Portfolio Three separate basins - all poised for growth 6 Three separate basins - all core to PQ Unrisked Inventory (2) Reserves are as of December 31, 2009 (reserves
Slide 8: Arkoma Basin
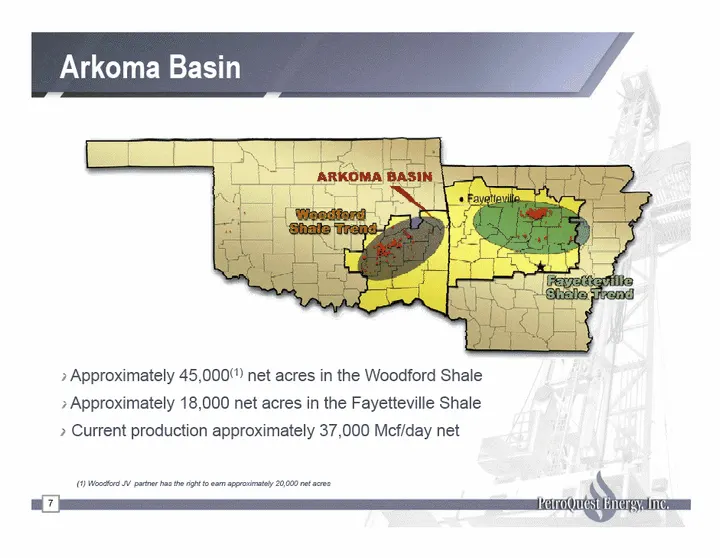
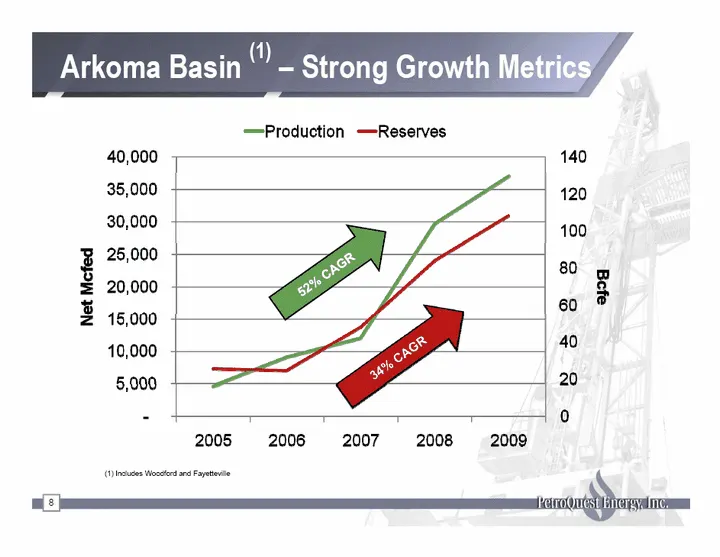
Arkoma Basin 7 Approximately 45,000(1) net acres in the Woodford Shale Approximately 18,000 net acres in the Fayetteville Shale Current production approximately 37,000 Mcf/day net (1) Woodford JV partner has the right to earn approximately 20,000 net acres
Slide 9: Arkoma Basin - Strong Growth Metrics
Arkoma Basin (1) - Strong Growth Metrics 8 (1) Includes Woodford and Fayetteville 52% CAGR
Slide 10: Woodford Shale Activity
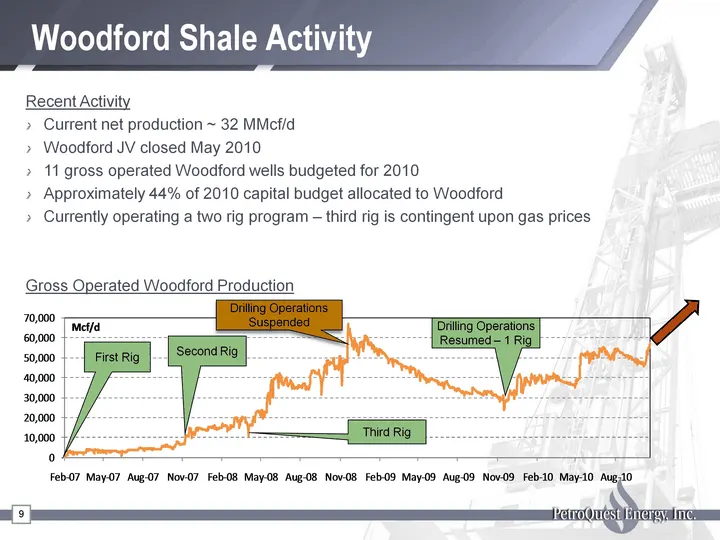
Woodford Shale Activity 9 Recent Activity Current net production ~ 32 MMcf/d Woodford JV closed May 2010 11 gross operated Woodford wells budgeted for 2010 Approximately 44% of 2010 capital budget allocated to Woodford Currently operating a two rig program - third rig is contingent upon gas prices G
Slide 11: 3D Seismic Based Drilling
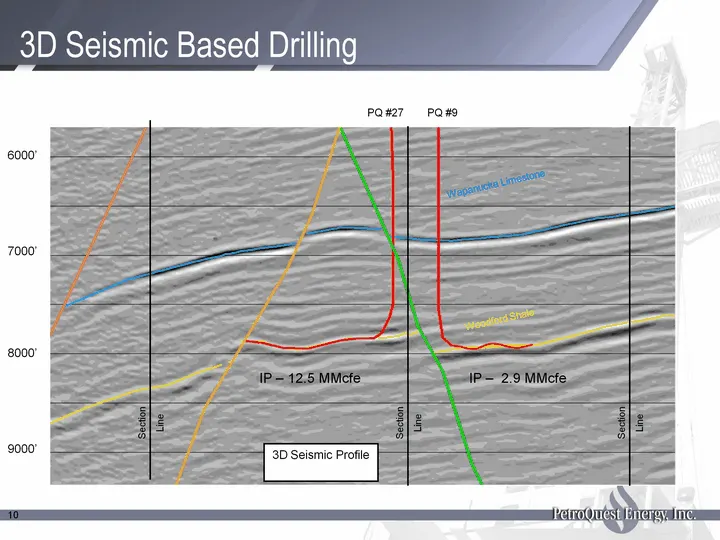
10 Wapanucka Limestone Woodford Shale 3D Seismic Based Drilling 8000' 7000' 6000' 9000' Section Line Section Line Section Line 3D Seismic Profile PQ #27 PQ #9 IP - 12.5 MMcfe IP - 2.9 MMcfe
Slide 12: Woodford Shale: PQ Delivers Top Max Monthly Rate
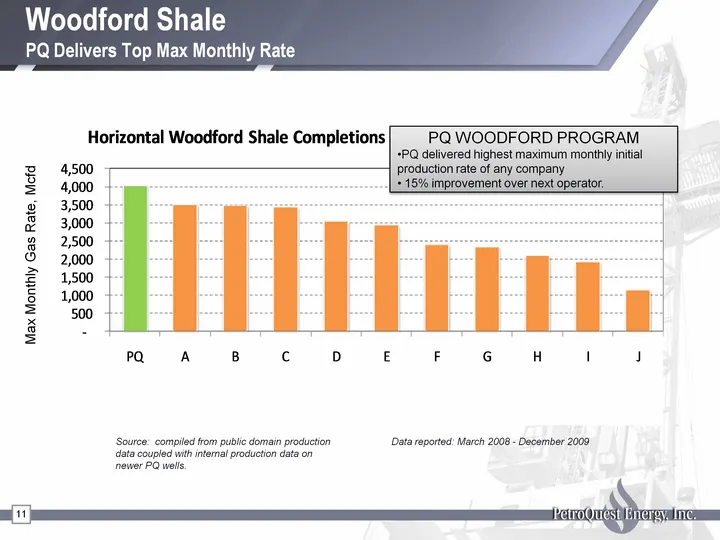
Woodford Shale PQ Delivers Top Max Monthly Rate 11 Source: compiled from public domain production data coupled with internal production data on newer PQ wells. Data reported: March 2008 - December 2009 PQ WOODFORD PROGRAM PQ delivered highest maximum monthly initial production rate of any company 15
Slide 13: Woodford JV Transaction Summary
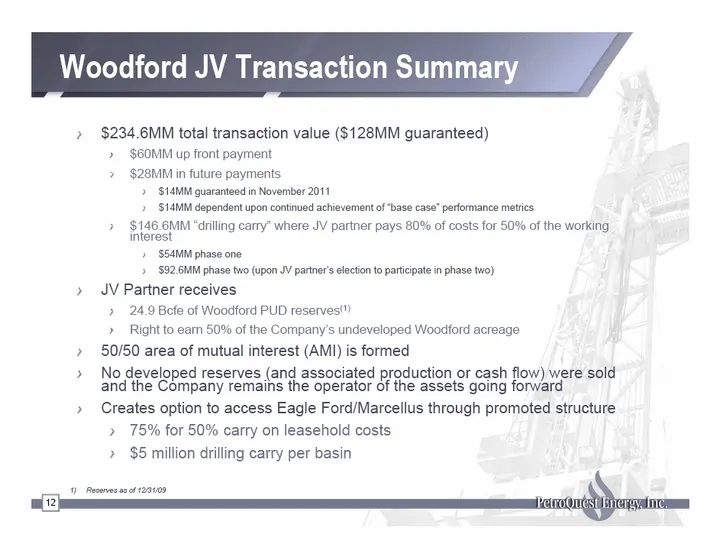
Woodford JV Transaction Summary $234.6MM total transaction value ($128MM guaranteed) $60MM up front payment $28MM in future payments $14MM guaranteed in November 2011 $14MM dependent upon continued achievement of "base case" performance metrics $146.6MM "drilling carry" where JV partner pays 80% of
Slide 14: Woodford Decline Curves
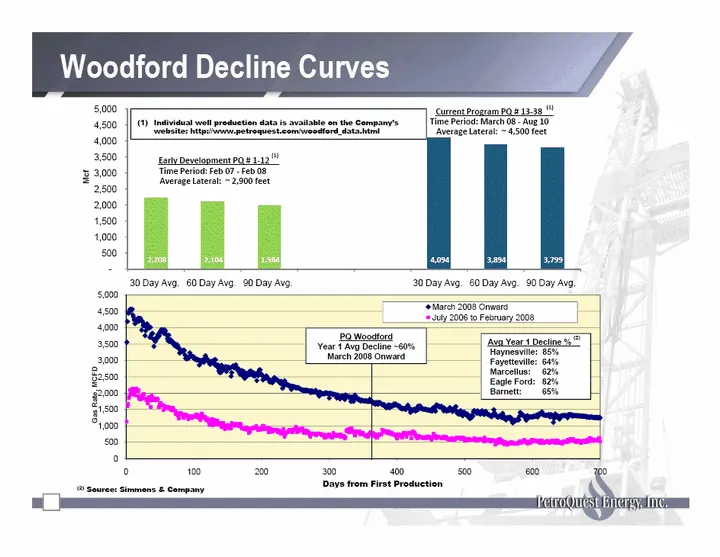
Woodford Decline Curves (2) Source: Simmons & Company (CHART) Avg Year 1 Decline % (2) Haynesville: 85% Fayetteville: 64% Marcellus: 62% Eagle Ford: 82% Barnett: 65% PQ Woodford Year 1 Avg Decline ~60% March 2008 Onward Days from First Production (CHART) Current Program PQ # 13-38 (1) Time Period: M
Slide 15: Woodford Horizontal Well Economics (Pre JV)
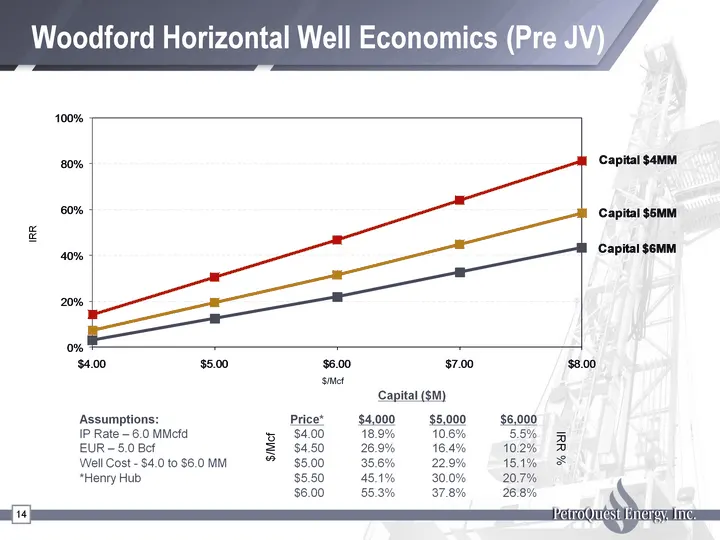
Woodford Horizontal Well Economics (Pre JV) 14 IRR $/Mcf $/Mcf $/Mcf
Slide 16: Fayetteville Shale
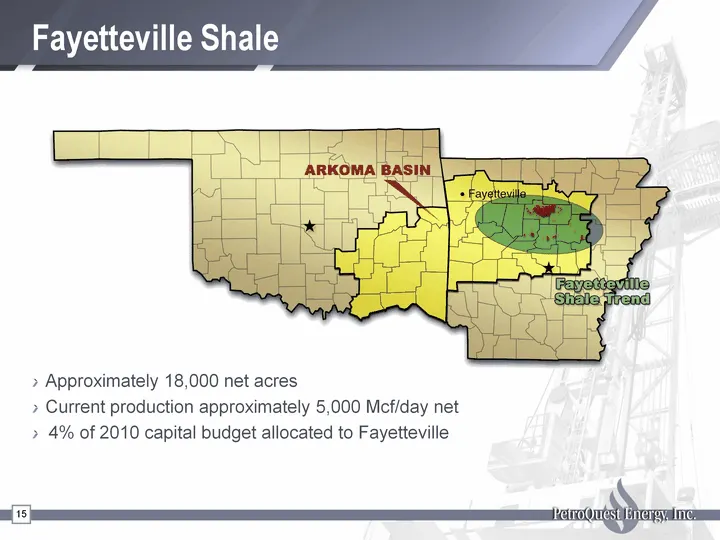
Fayetteville Shale 15 Approximately 18,000 net acres Current production approximately 5,000 Mcf/day net 4% of 2010 capital budget allocated to Fayetteville
Slide 17: East Texas
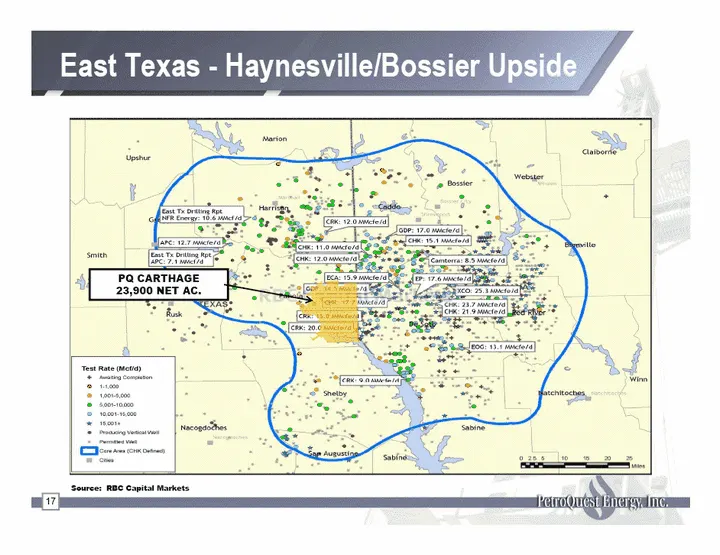
East Texas Anchored by SE Carthage field: 23,900 net acres and avg daily production of ~9 MMcf/d Horizontal Cotton Valley program: Currently completing first well and expect results during December; Additional drilling expected in 2011 7% of the 2010 capital budget to East Texas Highly prospective f
Slide 18: East Texas - Haynesville/Bossier Upside
East Texas - Haynesville/Bossier Upside 17 Source: RBC Capital Markets PQ CARTHAGE 23,900 NET AC.
Slide 19: Gulf Coast: Shallower Declines & Liquids Exposure
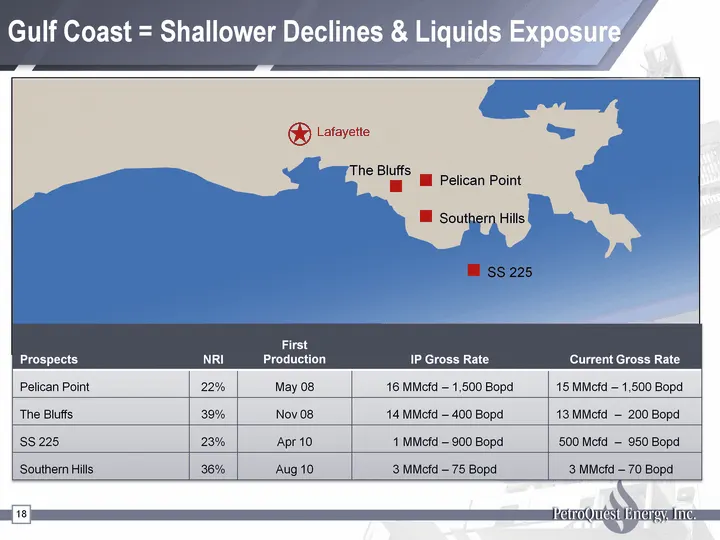
Gulf Coast = Shallower Declines & Liquids Exposure 18 Lafayette Pelican Point The Bluffs SS 225 Prospects NRI First Production IP Gross Rate Current Gross Rate Pelican Point 22% May 08 16 MMcfd - 1,500 Bopd 15 MMcfd - 1,500 Bopd The Bluffs 39% Nov 08 14 MMcfd - 400 Bopd 13 MMcfd - 200 Bopd SS 225 23
Slide 20: Growth in Liquids Exposure
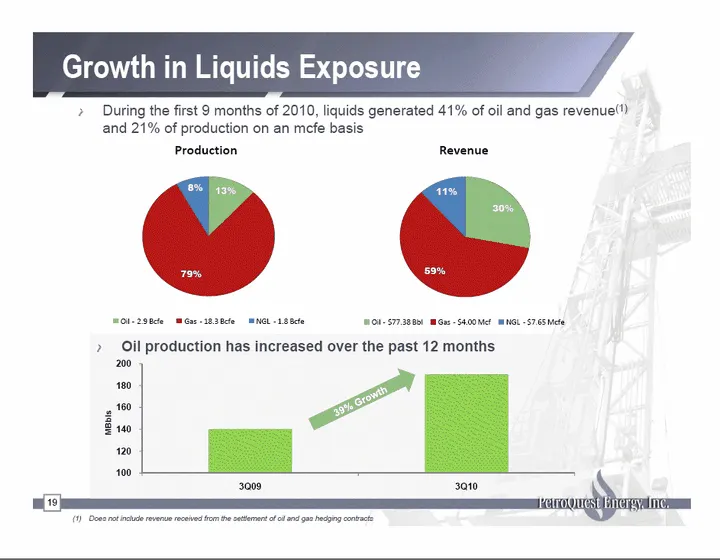
Growth in Liquids Exposure 19 During the first 9 months of 2010, liquids generated 41% of oil and gas revenue(1) and 21% of production on an mcfe basis Does not include revenue received from the settlement of oil and gas hedging contracts Oil production has increased over the past 12 months (CHART)
Slide 21: Near-Term Gulf Coast Drilling Inventory
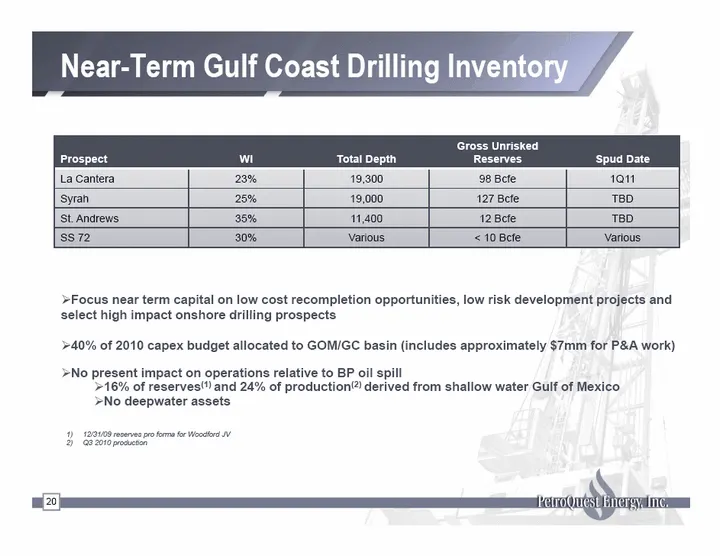
Near-Term Gulf Coast Drilling Inventory Near-Term Gulf Coast Drilling Inventory 20 Focus near term capital on low cost recompletion opportunities, low risk development projects and select high impact onshore drilling prospects 40% of 2010 capex budget allocated to GOM/GC basin (includes approximatel
Slide 22: Strong Balance Sheet and Liquidity
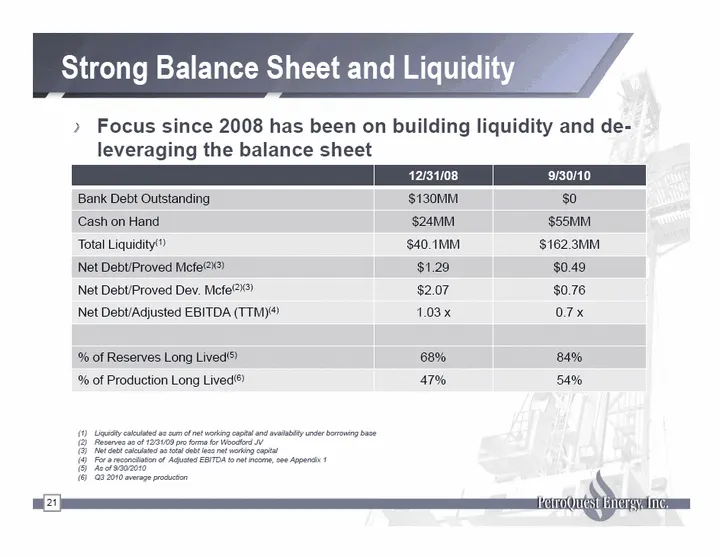
Strong Balance Sheet and Liquidity Strong Balance Sheet and Liquidity 21 Focus since 2008 has been on building liquidity and de- leveraging the balance sheet Liquidity calculated as sum of net working capital and availability under borrowing base Reserves as of 12/31/09 pro forma for Woodford JV Net
Slide 23: Refinancing of Senior Notes
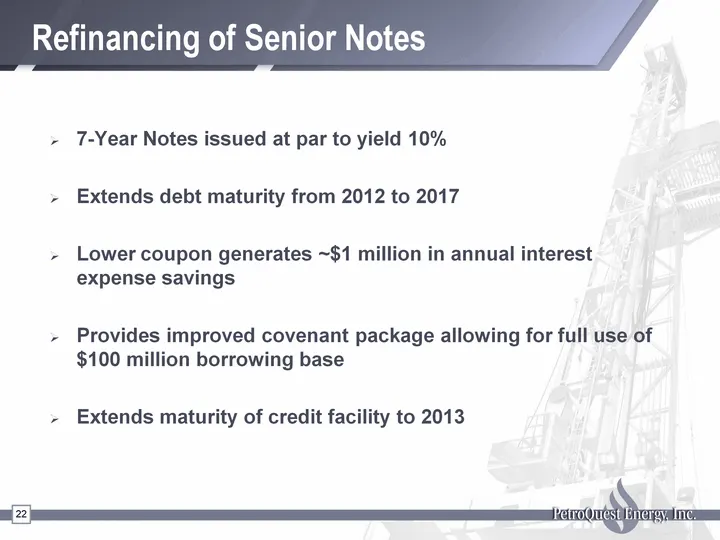
22 Refinancing of Senior Notes 7-Year Notes issued at par to yield 10% Extends debt maturity from 2012 to 2017 Lower coupon generates ~$1 million in annual interest expense savings Provides improved covenant package allowing for full use of $100 million borrowing base Extends maturity of credit faci
Slide 24: Focused Effort to Fund Drilling with Cash Flow
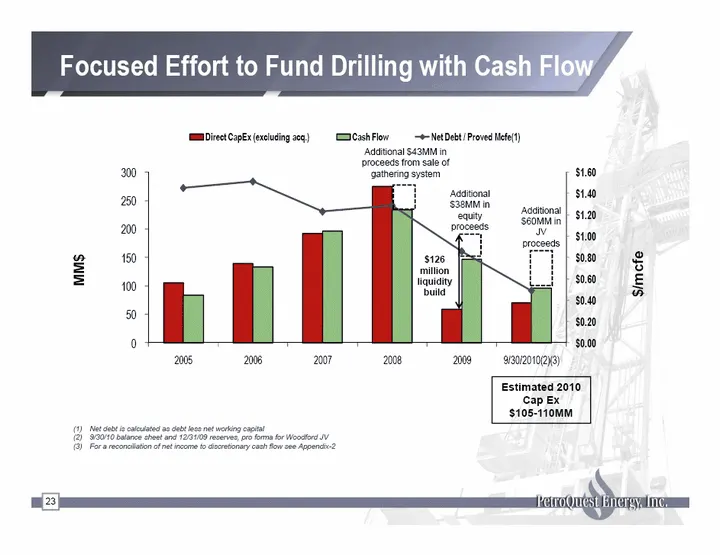
Focused Effort to Fund Drilling with Cash Flow 23 MM$ $126 million liquidity build $/mcfe Net debt is calculated as debt less net working capital 9/30/10 balance sheet and 12/31/09 reserves, pro forma for Woodford JV For a reconciliation of net income to discretionary cash flow see Appendix-2 Estima
Slide 25: Capital Investment Program - Diversification Reduces Risk
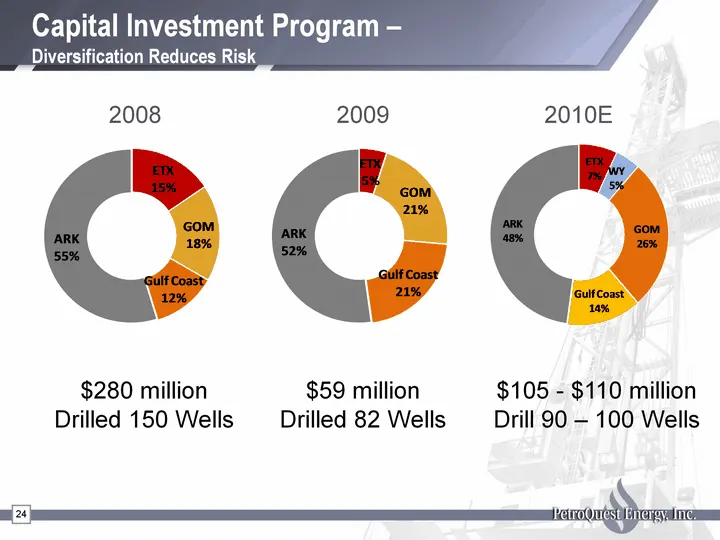
Capital Investment Program - Diversification Reduces Risk 24 $59 million Drilled 82 Wells 2009 2008 $280 million Drilled 150 Wells 2010E $105 - $110 million Drill 90 - 100 Wells
Slide 26: Hedging Positions
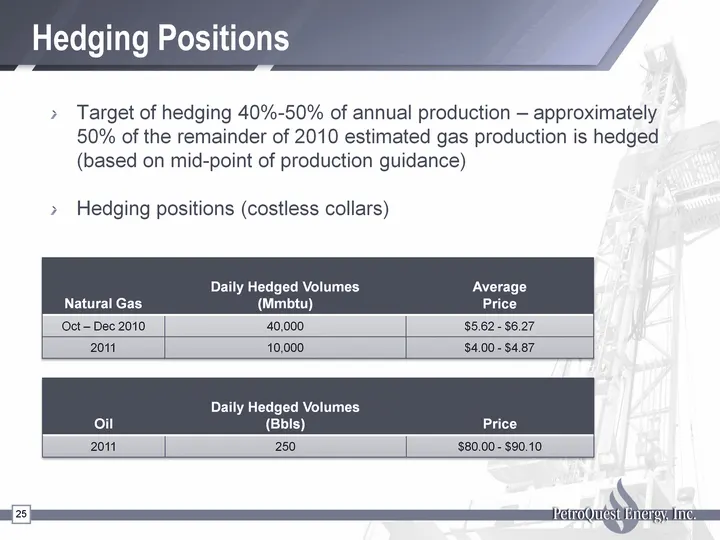
Hedging Positions Target of hedging 40%-50% of annual production - approximately 50% of the remainder of 2010 estimated gas production is hedged (based on mid-point of production guidance) Hedging positions (costless collars) 25 Natural Gas Daily Hedged Volumes (Mmbtu) Average Price Oct - Dec 2010 4
Slide 27: Summary of Diversification Efforts
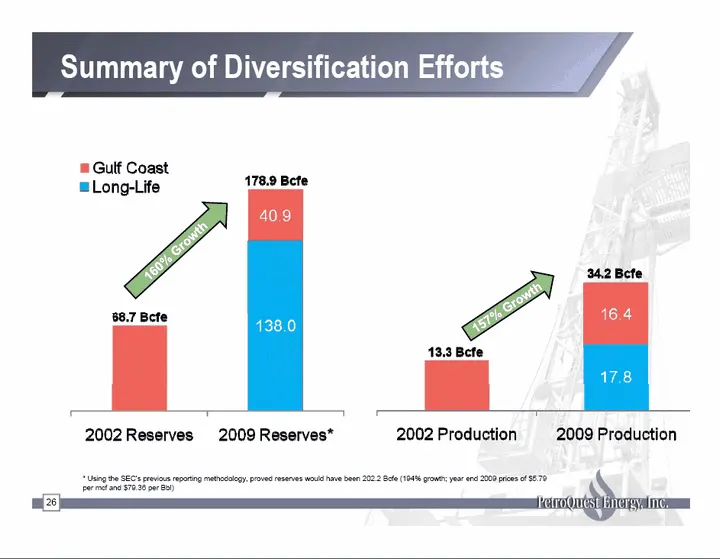
Summary of Diversification Efforts 26 * Using the SEC's previous reporting methodology, proved reserves would have been 202.2 Bcfe (194% growth; year end 2009 prices of $5.79 per mcf and $79.36 per Bbl) 160% Growth 157% Growth
Slide 28: Comparative Valuation
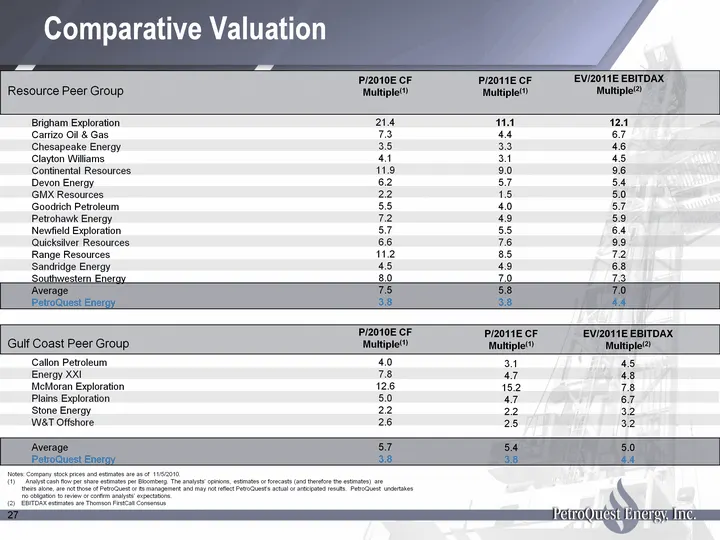
Comparative Valuation Notes: Company stock prices and estimates are as of 11/5/2010. Analyst cash flow per share estimates per Bloomberg. The analysts' opinions, estimates or forecasts (and therefore the estimates) are theirs alone, are not those of PetroQuest or its management and may not reflect P
Slide 29: Closing Summary
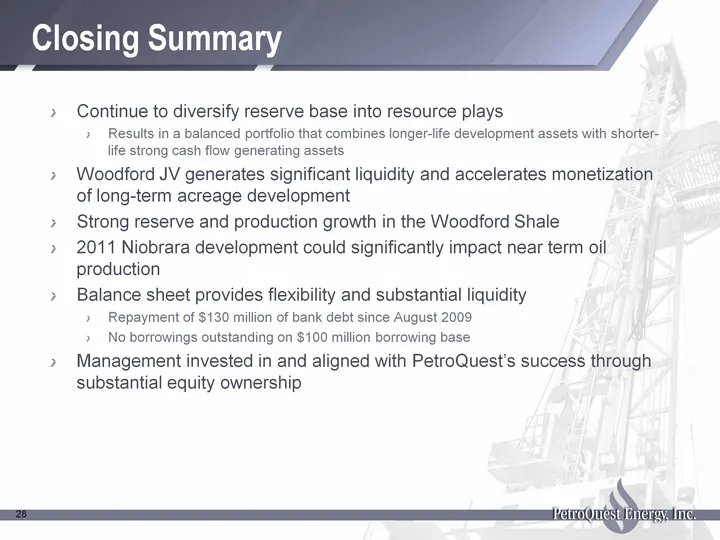
28 Closing Summary Continue to diversify reserve base into resource plays Results in a balanced portfolio that combines longer-life development assets with shorter- life strong cash flow generating assets Woodford JV generates significant liquidity and accelerates monetization of long-term acreage d
Slide 30: Appendix
29 Appendix
Slide 31: Appendix - Adjusted EBITDA definition
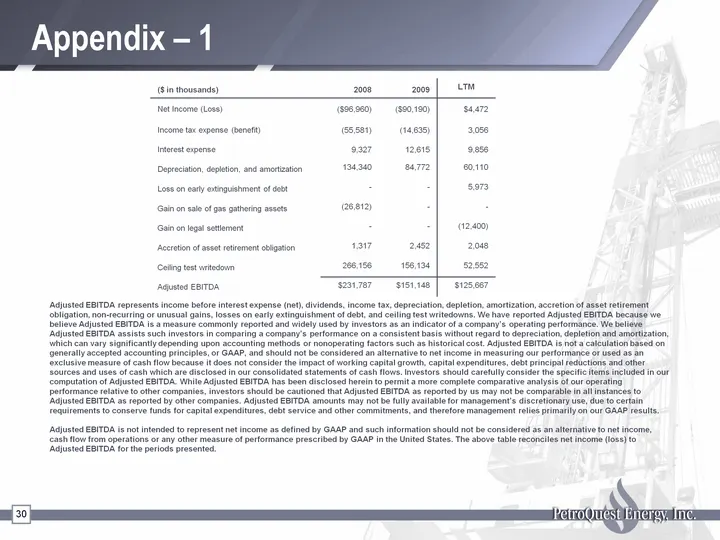
30 Appendix - 1 Adjusted EBITDA represents income before interest expense (net), dividends, income tax, depreciation, depletion, amortization, accretion of asset retirement obligation, non-recurring or unusual gains, losses on early extinguishment of debt, and ceiling test writedowns. We have report
Slide 32: Appendix - Discretionary cash flow reconciliation
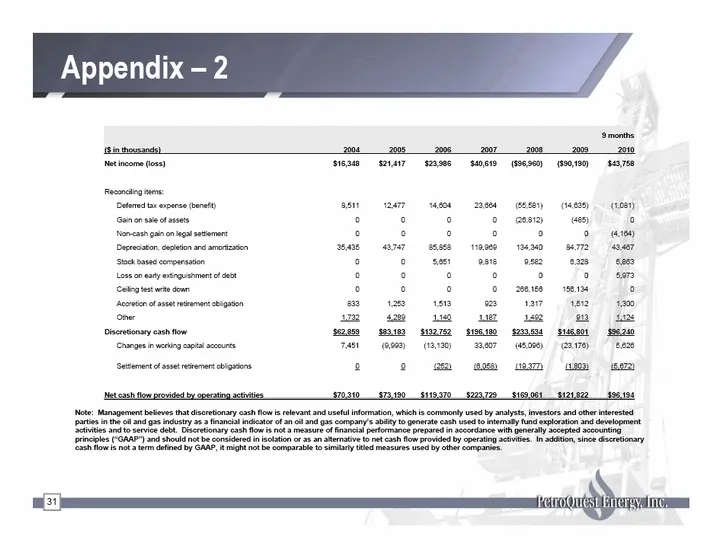
31 Appendix - 2 9 months ($ in thousands) 2004 2005 2006 2007 2008 2009 2010 Net income (loss) $16,348 $21,417 $23,986 $40,619 ($96,960) ($90,190) $43,758 Reconciling items: Deferred tax expense (benefit) 8,511 12,477 14,604 23,664 (55,581) (14,635) (1,081) Gain on sale of assets 0 0 0 0 (26,812) (4
Slide 33: Lafayette, Louisiana contact details
400 East Kaliste Saloom Road, Suite 6000 Lafayette, Louisiana 70508 Phone: (337) 232-7028 Fax: (337) 232-0044 www.petroquest.com NYSE: PQ 32
Source: SEC EDGAR · 8-K filed Dec 6, 2010
More decks from PetroQuest Energy Inc
 Corporate Update (June 2019)15 slides · Jun 19, 2019
 Investor Presentation (November 2018)16 slides · Nov 7, 2018
 Investor Presentation (July 2018)29 slides · Jul 10, 2018
 Investor Presentation (December 2017)6 slides · Dec 20, 2017
 Investor Presentation (January 2017)28 slides · Jan 9, 2017
 Investor Presentation (April 2016)29 slides · Apr 5, 2016