Superior Drilling Products Inc
Superior Drilling Products — Q1 2016 Earnings Presentation
16 slides from Superior Drilling Products's earnings presentation, May 13, 2016

Slide 1: First Quarter 2016 Financial Results Conference Call
© 2016 Superior Drilling Products First Quarter 2016 Financial Results Conference Call May 13, 2016 NYSE MKT: SDPI
Slide 2: Safe Harbor Statement
© 2016 Superior Drilling Products 2 Safe Harbor Statement These slides and the accompanying oral presentation contain “forward - looking statements” within the meaning of the safe harbor provisions, 15 U.S.C. † 78u - 5, of the Private Securities Litigation Reform Act of 1995. All statements, other t
Slide 3: Troy Meier, Chairman and Chief Executive Officer
© 2016 Superior Drilling Products Troy Meier Chairman and Chief Executive Officer
Slide 4: Challenging Market
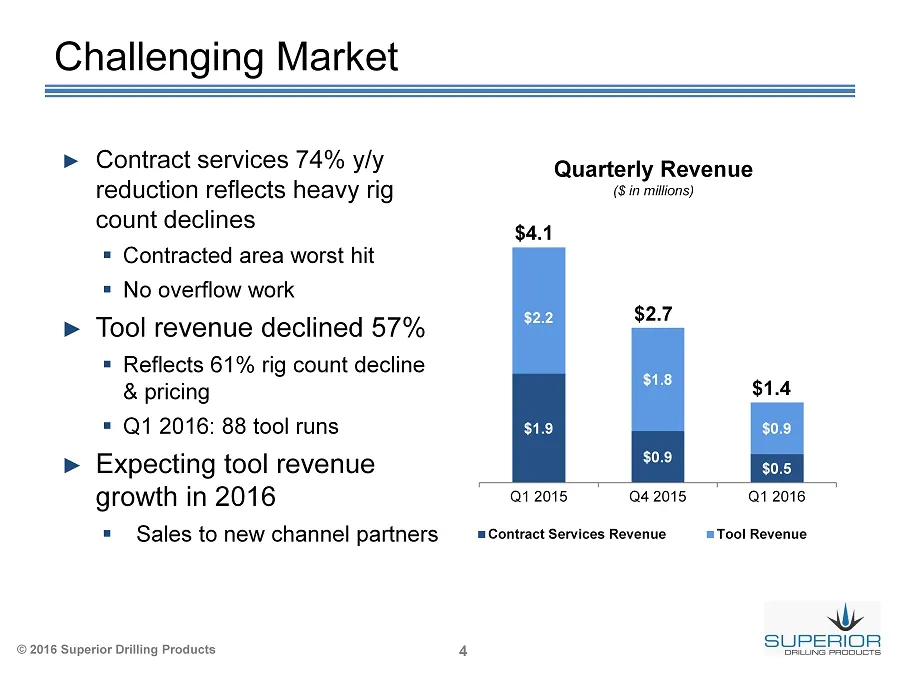
© 2016 Superior Drilling Products 4 $1.9 $0.9 $0.5 $2.2 $1.8 $0.9 Q1 2015 Q4 2015 Q1 2016 Contract Services Revenue Tool Revenue Challenging Market ► Contract services 74% y/y reduction reflects heavy rig count declines ▪ Contracted area worst hit ▪ No overflow work ► Tool revenue declined 57% ▪ Ref
Slide 5: Penetrating Market in Tough Times
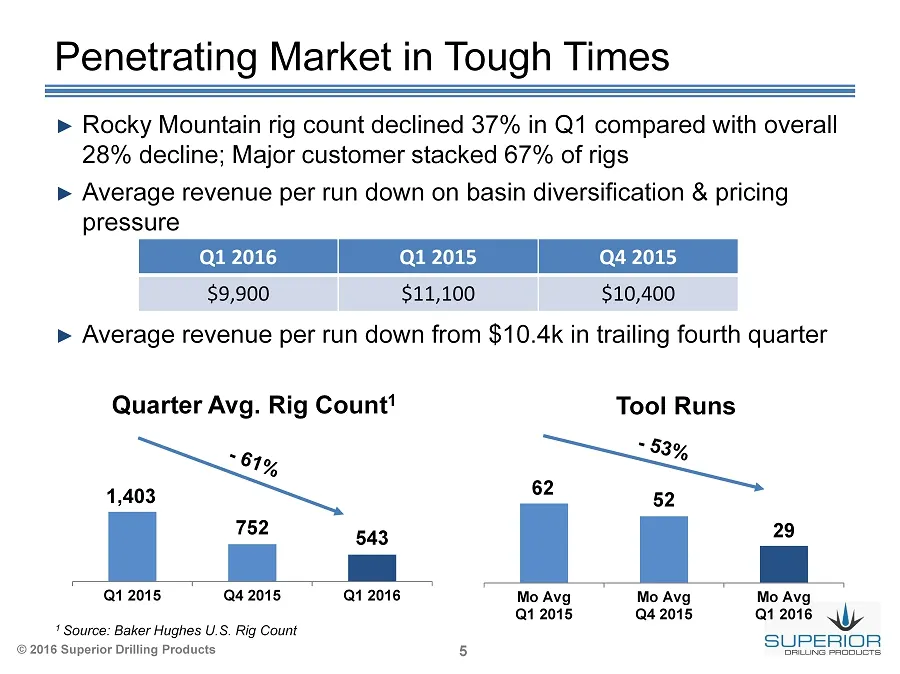
© 2016 Superior Drilling Products 5 ► Rocky Mountain rig count declined 37% in Q1 compared with overall 28% decline; Major customer stacked 67% of rigs ► Average revenue per run down on basin diversification & pricing pressure ► Average revenue per run down from $10.4k in trailing fourth quarter 1,4
Slide 6: DTI Agreement to Grow Tool Sales
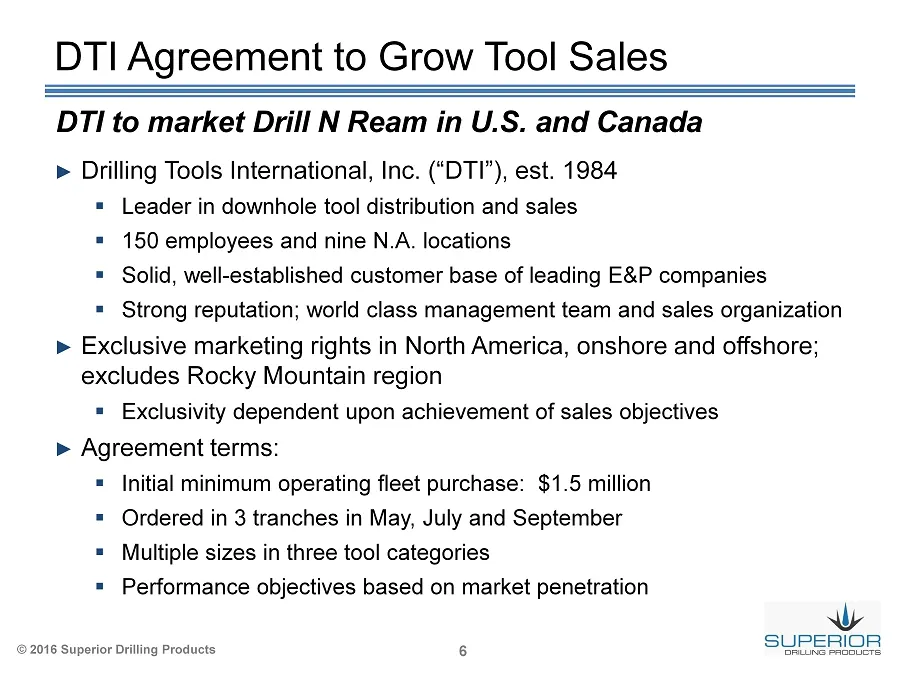
© 2016 Superior Drilling Products 6 DTI Agreement to Grow Tool Sales ► Drilling Tools International, Inc. (“DTI”), est. 1984 ▪ Leader in downhole tool distribution and sales ▪ 150 employees and nine N.A. locations ▪ Solid, well - established customer base of leading E&P companies ▪ Strong reputation
Slide 7: Financial Results - Chris Cashion, Chief Financial Officer
© 2016 Superior Drilling Products Financial Results Chris Cashion Chief Financial Officer
Slide 8: Managing Costs and Investments
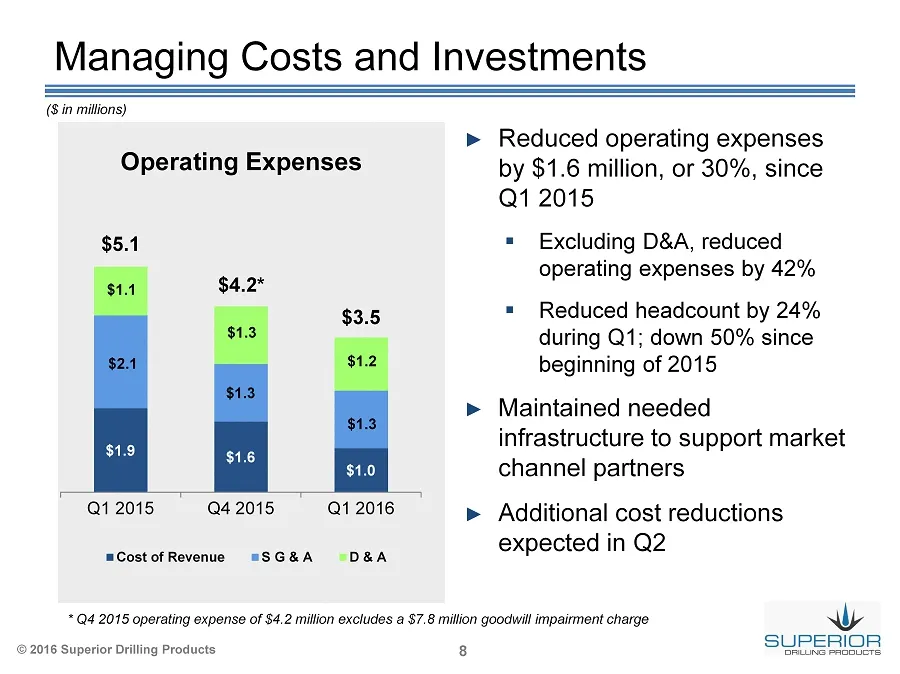
© 2016 Superior Drilling Products 8 $1.9 $1.6 $1.0 $2.1 $1.3 $1.3 $1.1 $1.3 $1.2 Q1 2015 Q4 2015 Q1 2016 Cost of Revenue S G & A D & A $5.1 $4.2* $3.5 Managing Costs and Investments ► Reduced operating expenses by $1.6 million, or 30%, since Q1 2015 ▪ Excluding D&A , reduced operating expenses by 42
Slide 9: Focused on Cash Generation
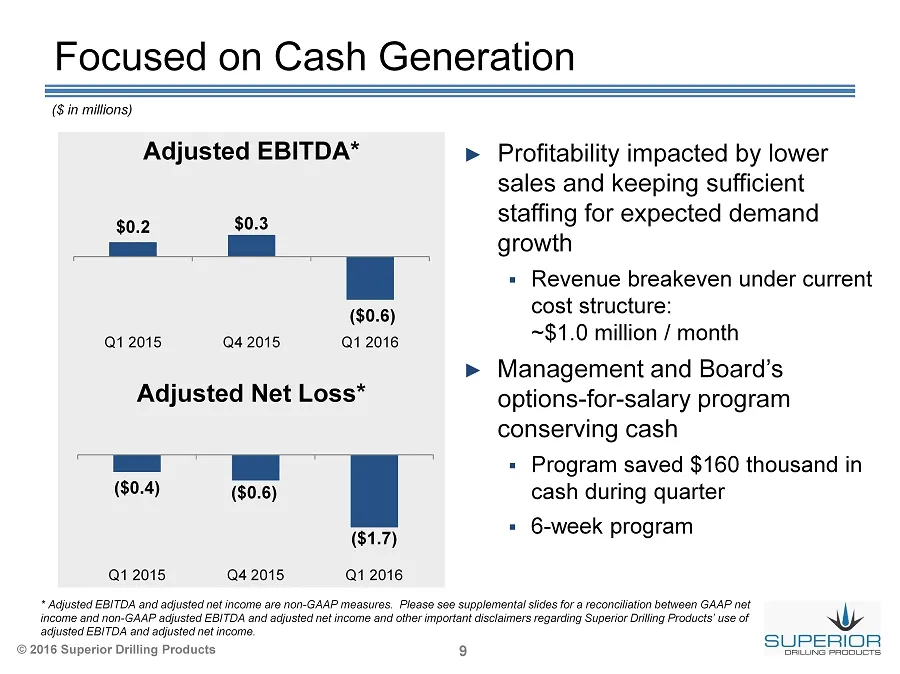
© 2016 Superior Drilling Products 9 Focused on Cash Generation $0.2 $0.3 ($0.6) Q1 2015 Q4 2015 Q1 2016 ► Profitability impacted by lower sales and keeping sufficient staffing for expected demand growth ▪ Revenue breakeven under current cost structure: ~$1.0 million / month ► Management and Board’s
Slide 10: Managing Balance Sheet
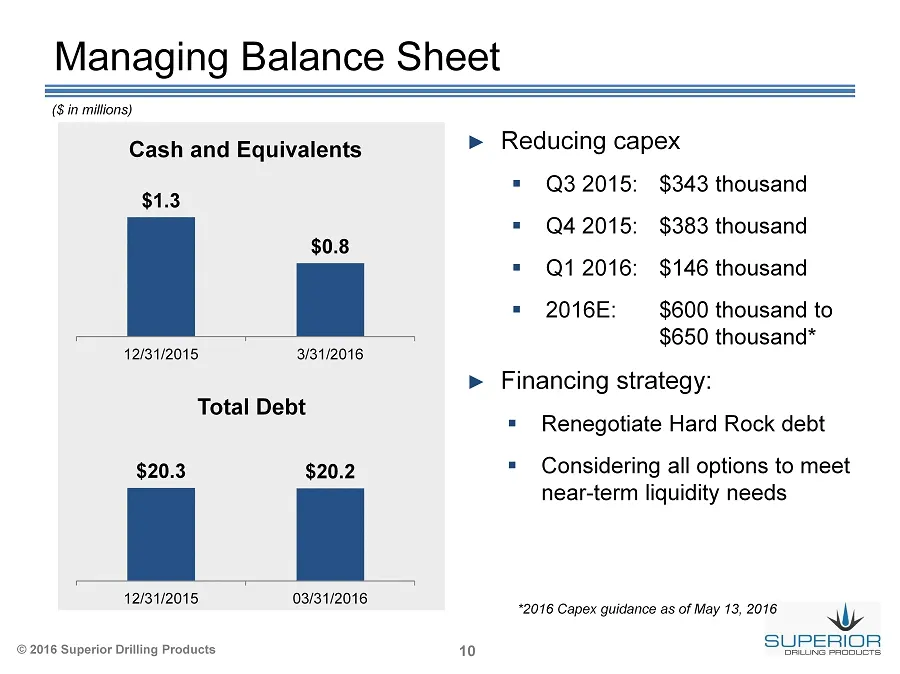
© 2016 Superior Drilling Products 10 Managing Balance Sheet ► Reducing capex ▪ Q3 2015: $343 thousand ▪ Q4 2015: $383 thousand ▪ Q1 2016: $146 thousand ▪ 2016E: $600 thousand to $650 thousand* ► Financing strategy: ▪ Renegotiate Hard Rock debt ▪ Considering all options to meet near - term liquidity
Slide 11: 2016 Outlook - Financial
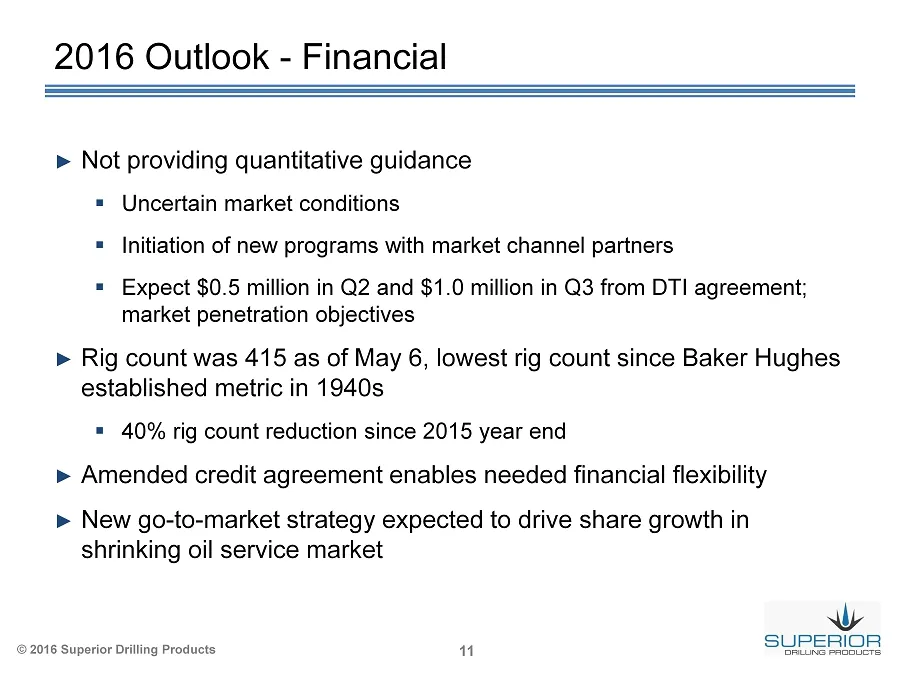
© 2016 Superior Drilling Products 11 2016 Outlook - Financial ► Not providing quantitative guidance ▪ Uncertain market conditions ▪ Initiation of new programs with market channel partners ▪ Expect $0.5 million in Q2 and $1.0 million in Q3 from DTI agreement; market penetration objectives ► Rig count
Slide 12: Overview and Outlook - Troy Meier
© 2016 Superior Drilling Products Overview and Outlook Troy Meier Chairman and Chief Executive Officer
Slide 13: 2016 Outlook – Market
© 2016 Superior Drilling Products 13 2016 Outlook – Market ► 2016 off to a difficult start, adapting to the challenges ▪ Transforming business model, focused on strengths including new tool designs and manufacturing process ► Strider channel partner agreement progress update: ▪ Developed training an
Slide 14: Supplemental Information
© 2016 Superior Drilling Products Supplemental Information
Slide 15: Adjusted Net Income Reconciliation
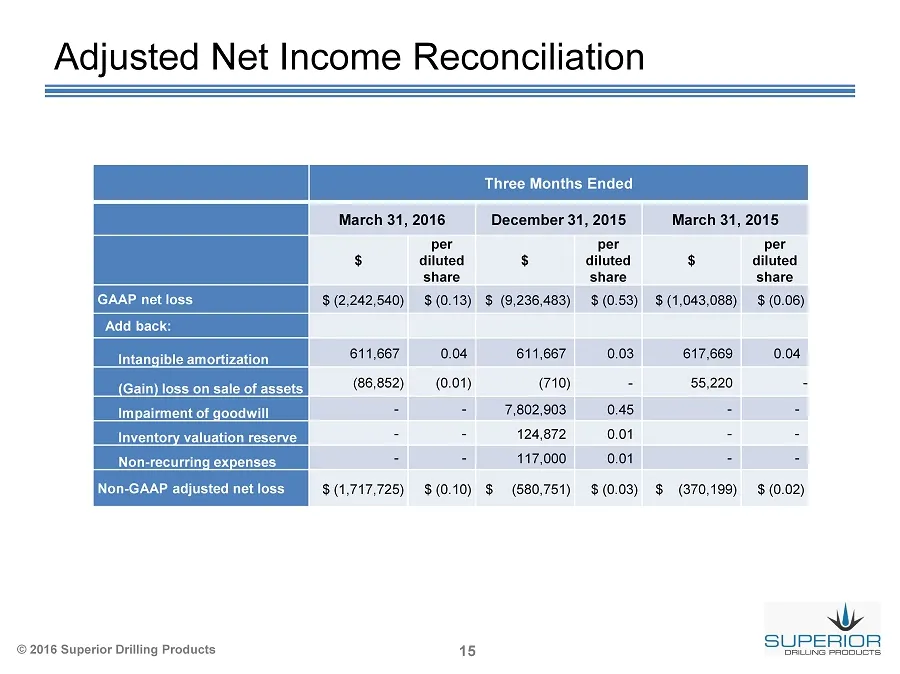
© 2016 Superior Drilling Products 15 Adjusted Net Income Reconciliation Three Months Ended March 31, 2016 December 31, 2015 March 31, 2015 $ per diluted share $ per diluted share $ per diluted share GAAP net loss $ ( 2,242,540) $ (0.13) $ (9,236,483) $ (0.53) $ (1,043,088) $ (0.06) Add back: Intangi
Slide 16: Adjusted EBITDA Reconciliation
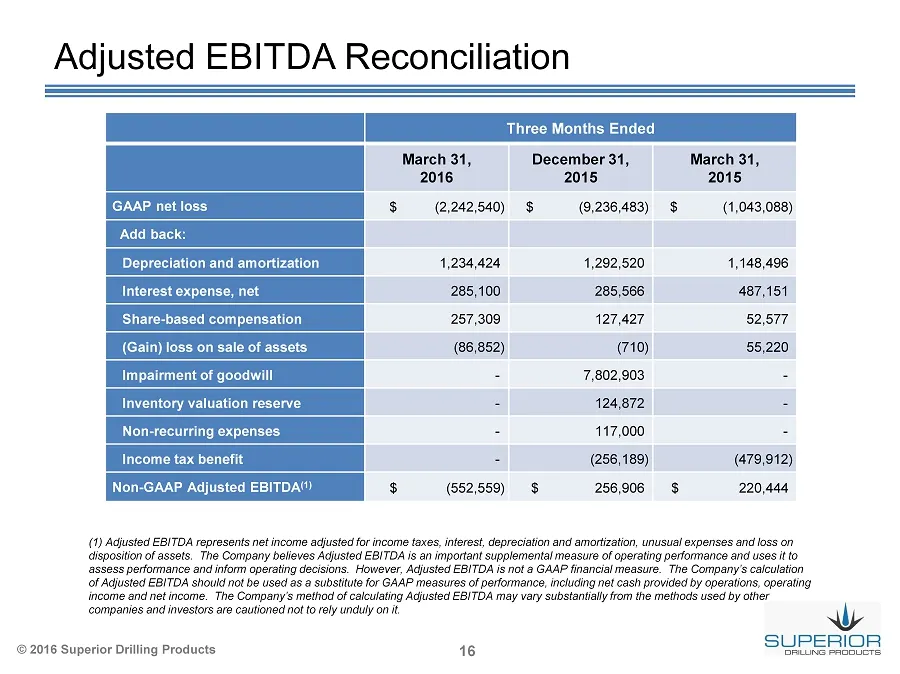
© 2016 Superior Drilling Products 16 Adjusted EBITDA Reconciliation (1) Adjusted EBITDA represents net income adjusted for income taxes, interest, depreciation and amortization, unusual expenses and loss on disposition of assets. The Company believes Adjusted EBITDA is an important supplemental meas
Source: SEC EDGAR · 8-K filed May 13, 2016
More decks from Superior Drilling Products Inc
 Q3 2023 Earnings Presentation12 slides · Nov 9, 2023
 Q2 2023 Earnings Presentation12 slides · Aug 14, 2023
 Q1 2023 Earnings Presentation12 slides · May 15, 2023
 FY2022 Earnings Presentation13 slides · Mar 10, 2023
 Q3 2022 Earnings Presentation12 slides · Nov 14, 2022
 MicroCap Rodeo Windy City Roundup 202220 slides · Oct 12, 2022