Superior Drilling Products Inc
Superior Drilling Products — Q4 2021 Earnings Presentation
12 slides from Superior Drilling Products's earnings presentation, Mar 11, 2022
Slide 1: Fourth Quarter 2021 Financial Results Conference Call
SUZ SUPERIOR DRILLING PRODUCTS FOURTH QUARTER 2021 FINANCIAL RESULTS CONFERENCE CALL MARCH 11, 2022 TROY MEIER CHRISTOPHER CASHION CHAIRMAN AND CHIEF EXECUTIVE OFFICER CHIEF FINANCIAL OFFICER NYSE American: SDPI www.sdpi.com © 2022 Superior Drilling Products
Slide 2: Safe Harbor Statement
SAFE HARBOR STATEMENT These slides contain forward-looking statements and information that are subject to a number of risks and uncertainties, many of which are beyond our control. All statements, other than statements of historical fact included in these slides and the accompanying oral presentatio
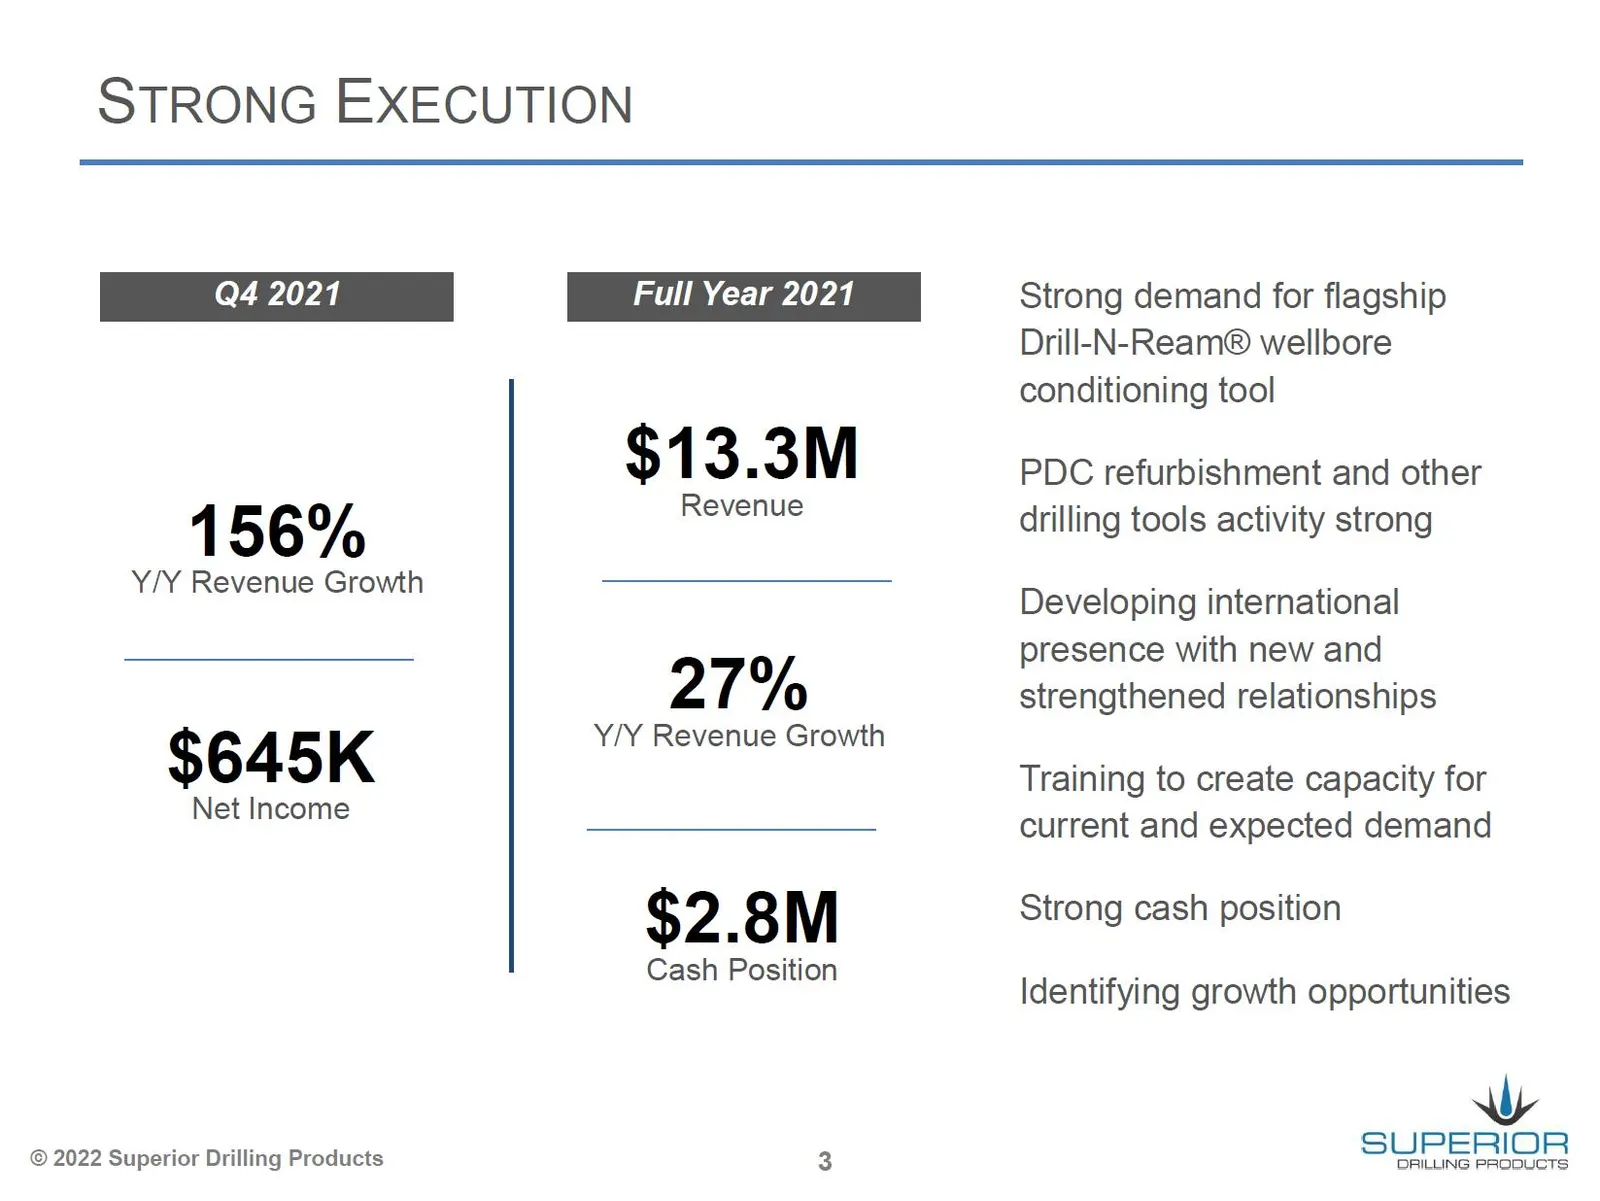
Slide 3: Strong Execution
STRONG EXECUTION Q4 2021 Full Year 2021 Strong demand for flagship Drill-N-Ream® wellbore conditioning tool $1 3.3M PDC refurbishment and other 1 56% peaeme drilling tools activity strong Y/Y Revenue Growth a ‘ Developing international 0 presence with new and 27 No strengthened relationships Y/Y Rev
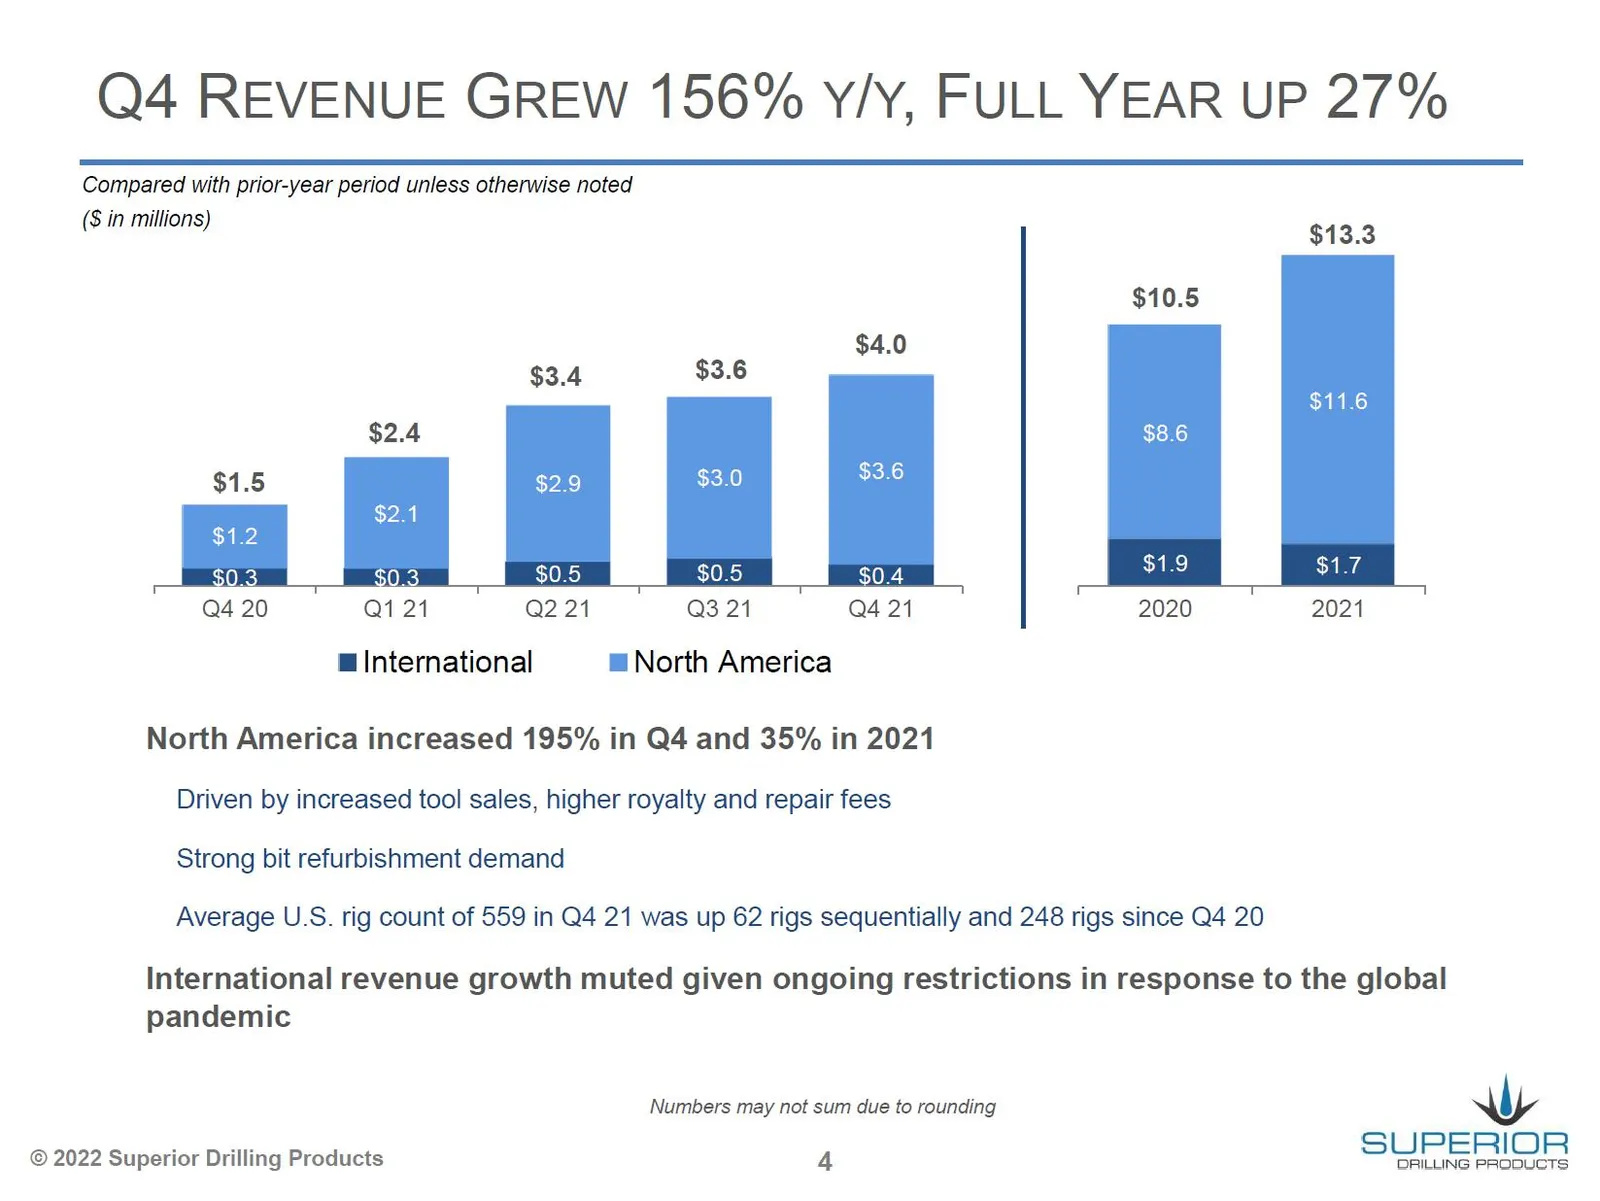
Slide 4: Q4 Revenue Grew 156% Y/Y, Full Year Up 27%
Q4 REVENUE GREW 156% Y/Y, FULL YEAR UP 27% Compared with prior-year period unless otherwise noted (S in millions) $4.0 $3.4 $3.6 $2.4 $1.5 $2.9 $3.0 we . $0.3 . $0.3 : $0.5 : $0.5 , $0.4 , Q4 20 Q1 21 Q2 21 Q3 21 Q4 21 2020 $13.3 $10.5 @ International m North America North America increased 195% in
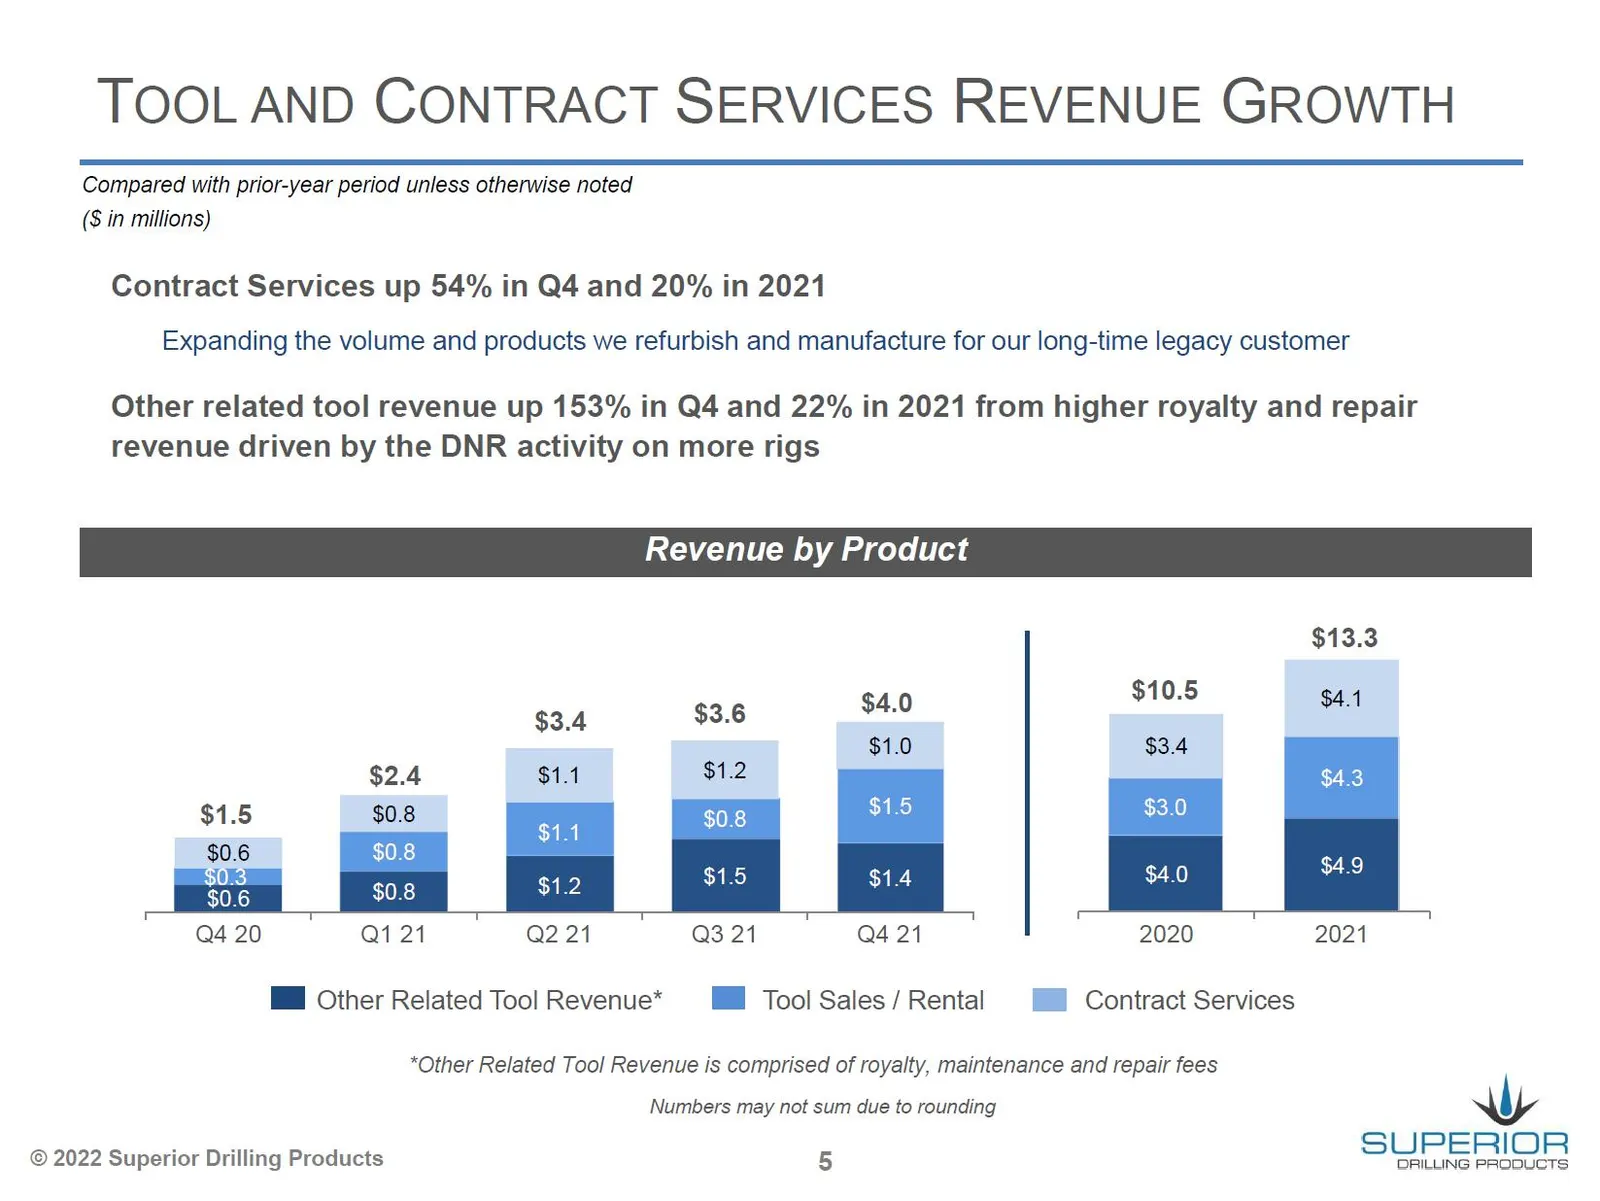
Slide 5: Tool and Contract Services Revenue Growth
TOOL AND CONTRACT SERVICES REVENUE GROWTH Compared with prior-year period unless otherwise noted (S in millions) Contract Services up 54% in Q4 and 20% in 2021 Expanding the volume and products we refurbish and manufacture for our long-time legacy customer Other related tool revenue up 153% in Q4 an
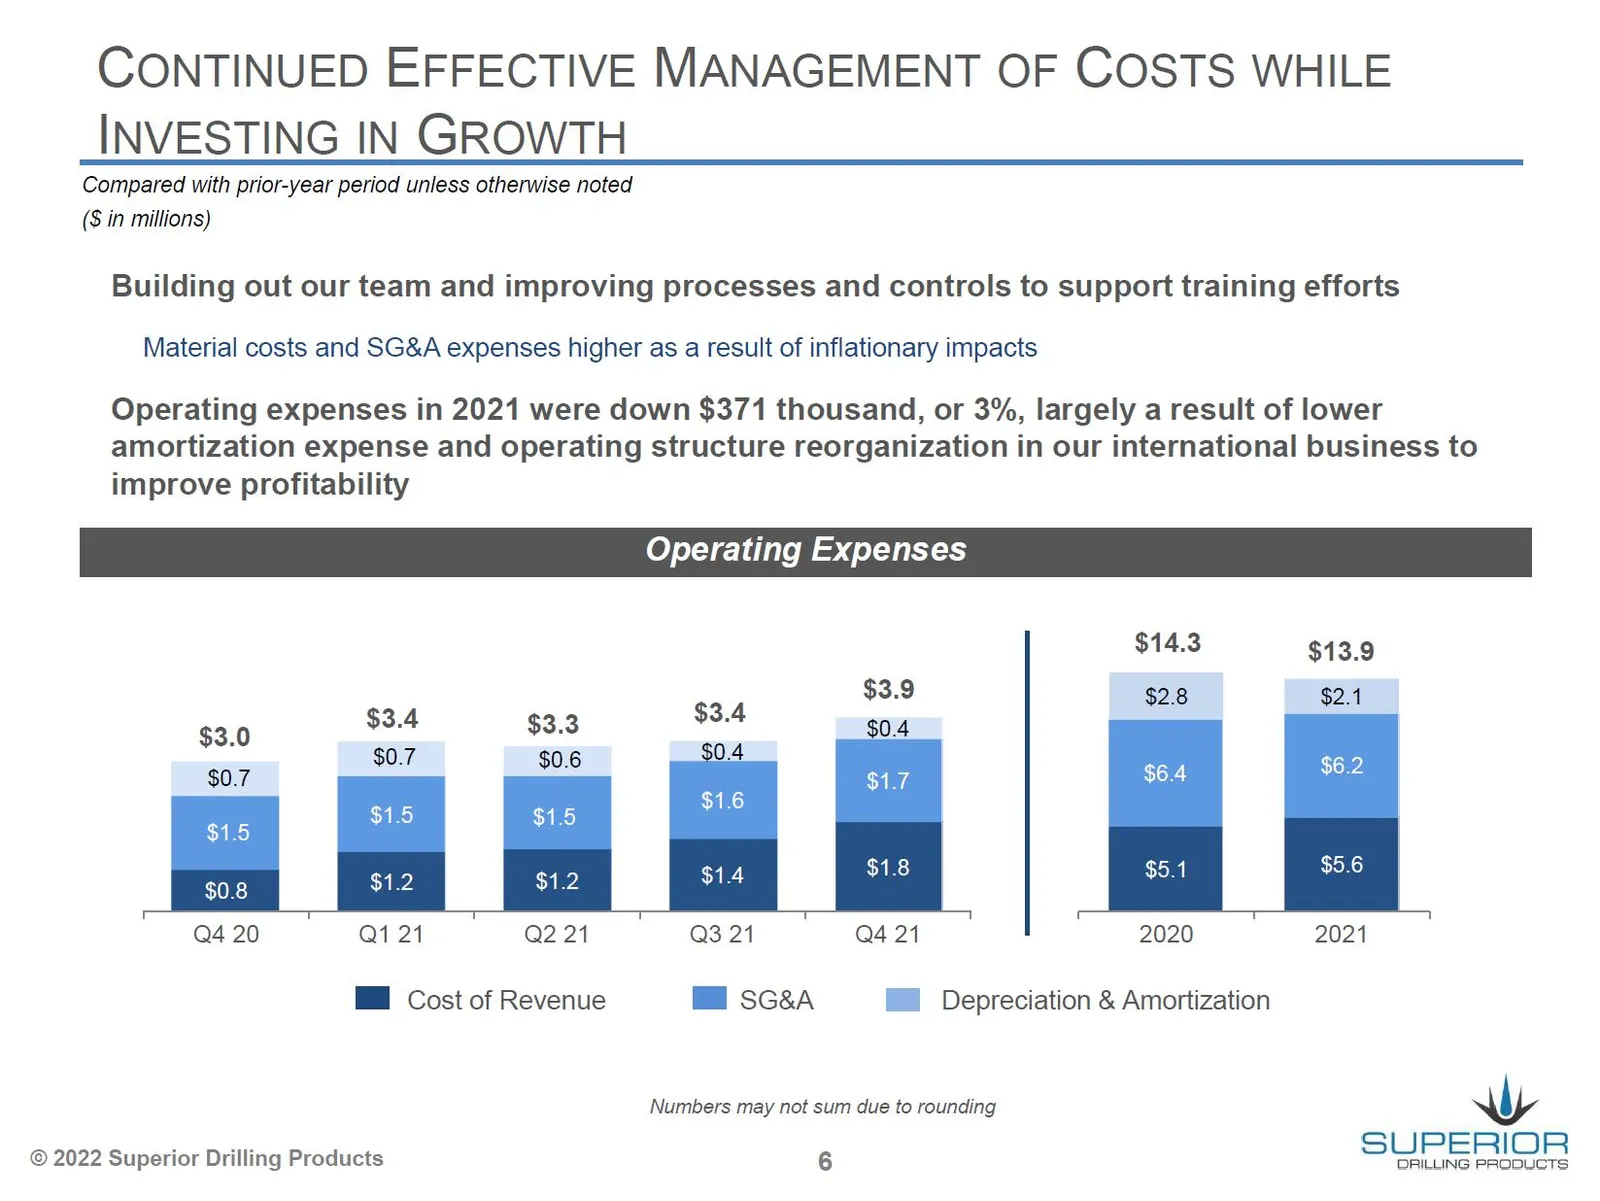
Slide 6: Continued Effective Management of Costs While Investing in Growth
CONTINUED EFFECTIVE MANAGEMENT OF COSTS WHILE INVESTING IN GROWTH Compared with prior-year period unless otherwise noted (S in millions) Building out our team and improving processes and controls to support training efforts Material costs and SG&A expenses higher as a result of inflationary impacts
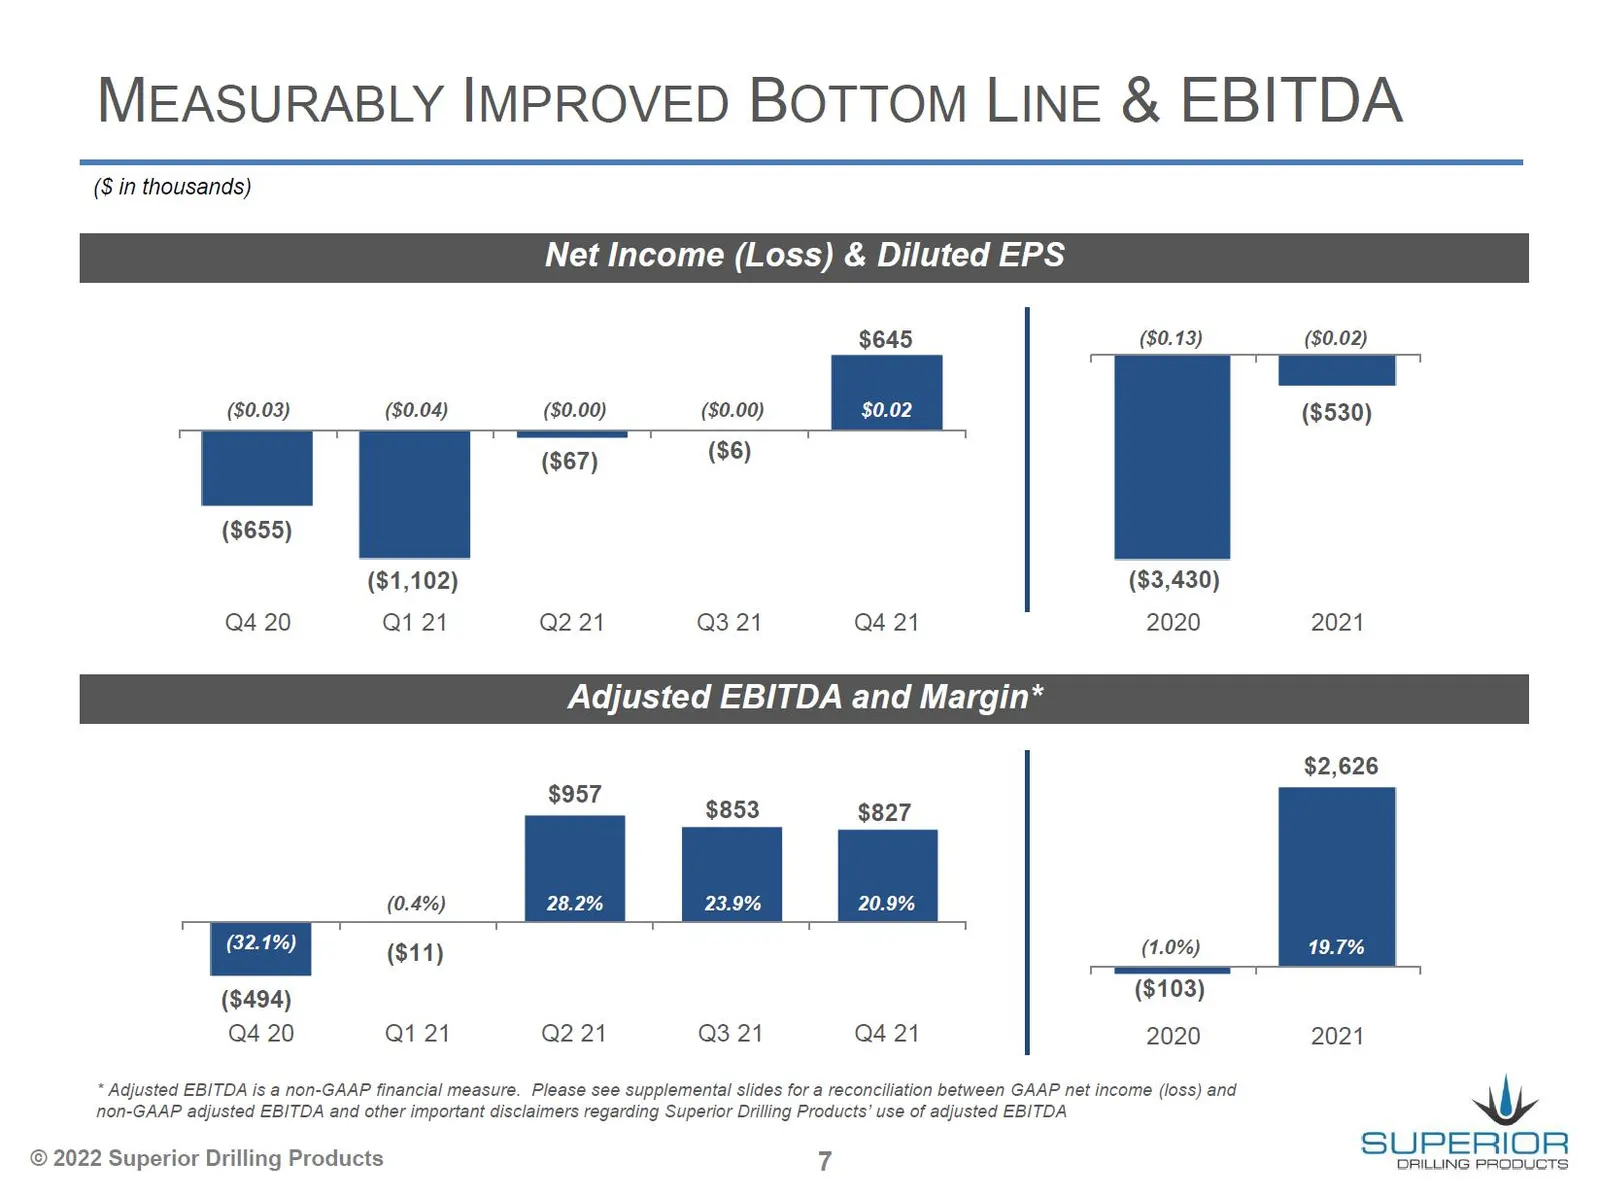
Slide 7: Measurably Improved Bottom Line & EBITDA
MEASURABLY IMPROVED BOTTOM LINE & EBITDA (S in thousands) Net Income (Loss) & Diluted EPS $645 ($0.13) ($0.02) ($0.03) ($0.04) ($0.00) ($0.00) ($530) Ht : = —a 1 ($655) ($1,102) ($3,430) Q4 20 Qt 21 Q221 Q321 a4 21 2020 2021 Adjusted EBITDA and Margin* $2,626 $957 $853 $827 (0.4%) 28.2% 23.9% 20.9%
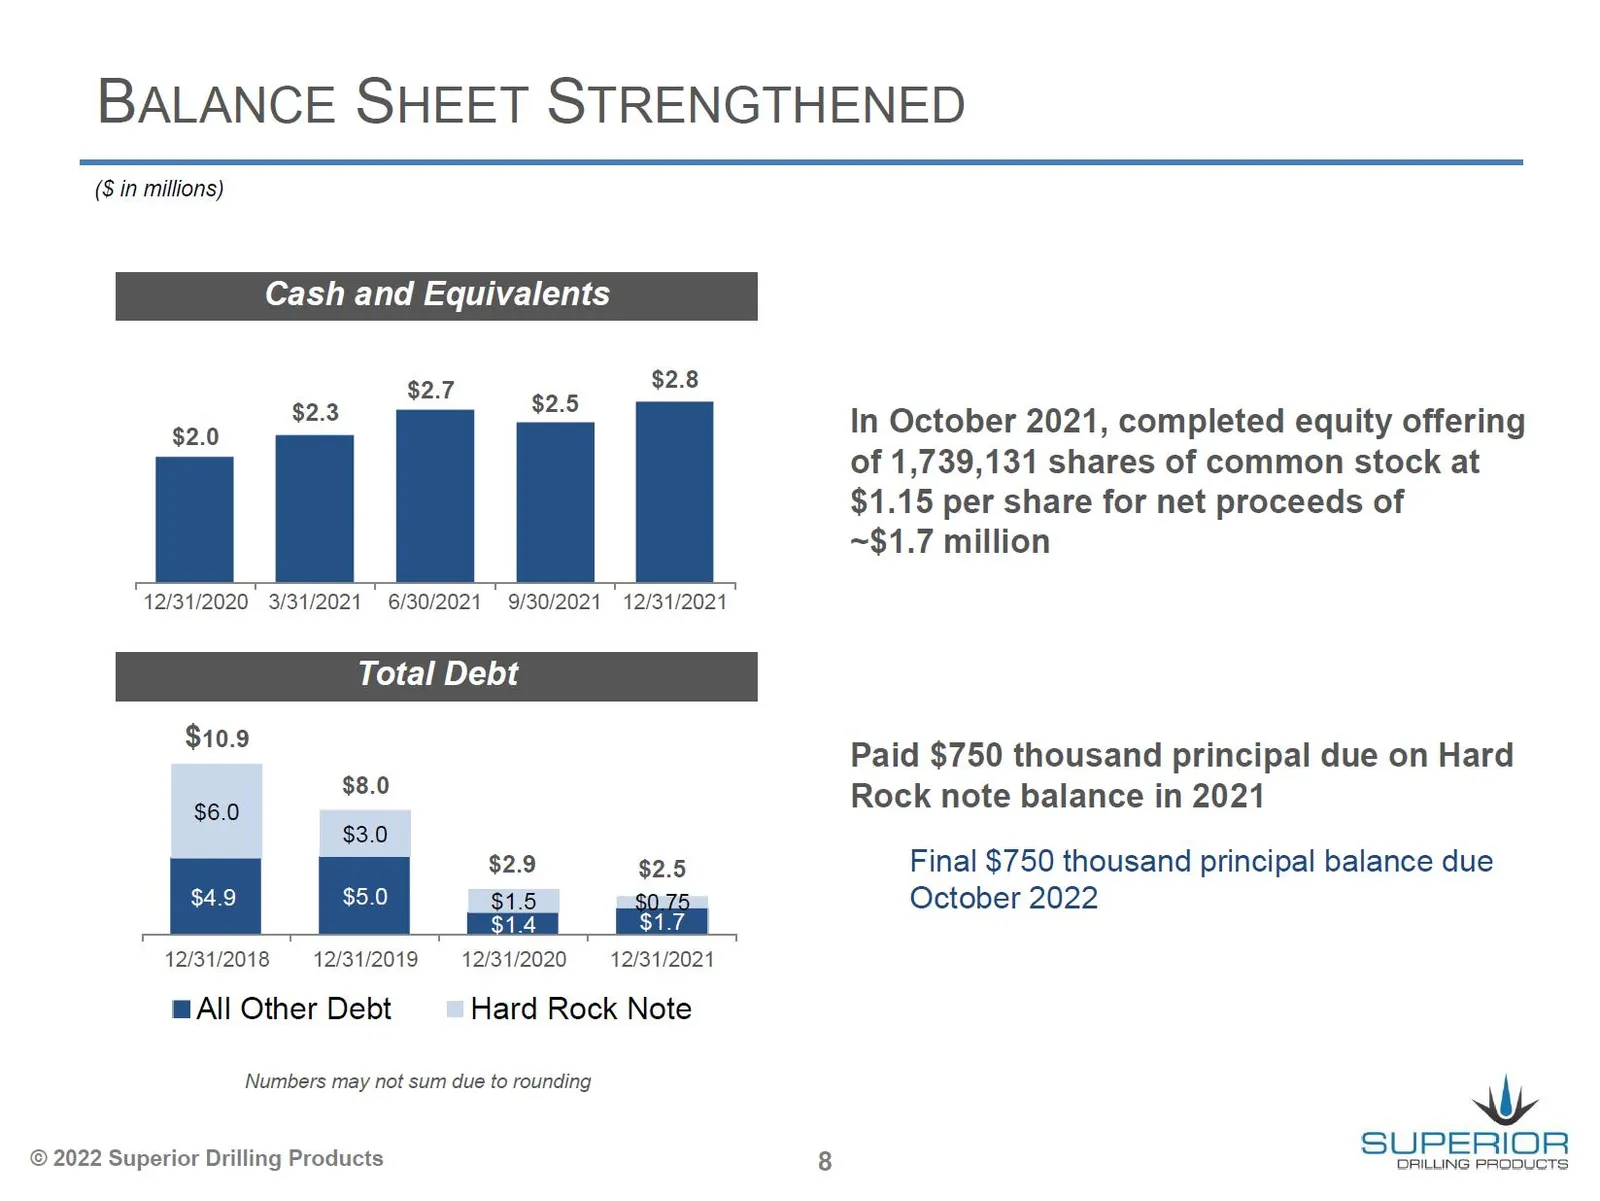
Slide 8: Balance Sheet Strengthened
BALANCE SHEET STRENGTHENED (S in millions) Cash and Equivalents $2.7 $2.8 — $2.3 a In October 2021, completed equity offering of 1,739,131 shares of common stock at $1.15 per share for net proceeds of ~$1.7 million 12/31/2020 3/31/2021 6/30/2021 9/30/2021 12/31/2021 Total Debt $10.9 Paid $750 thousa
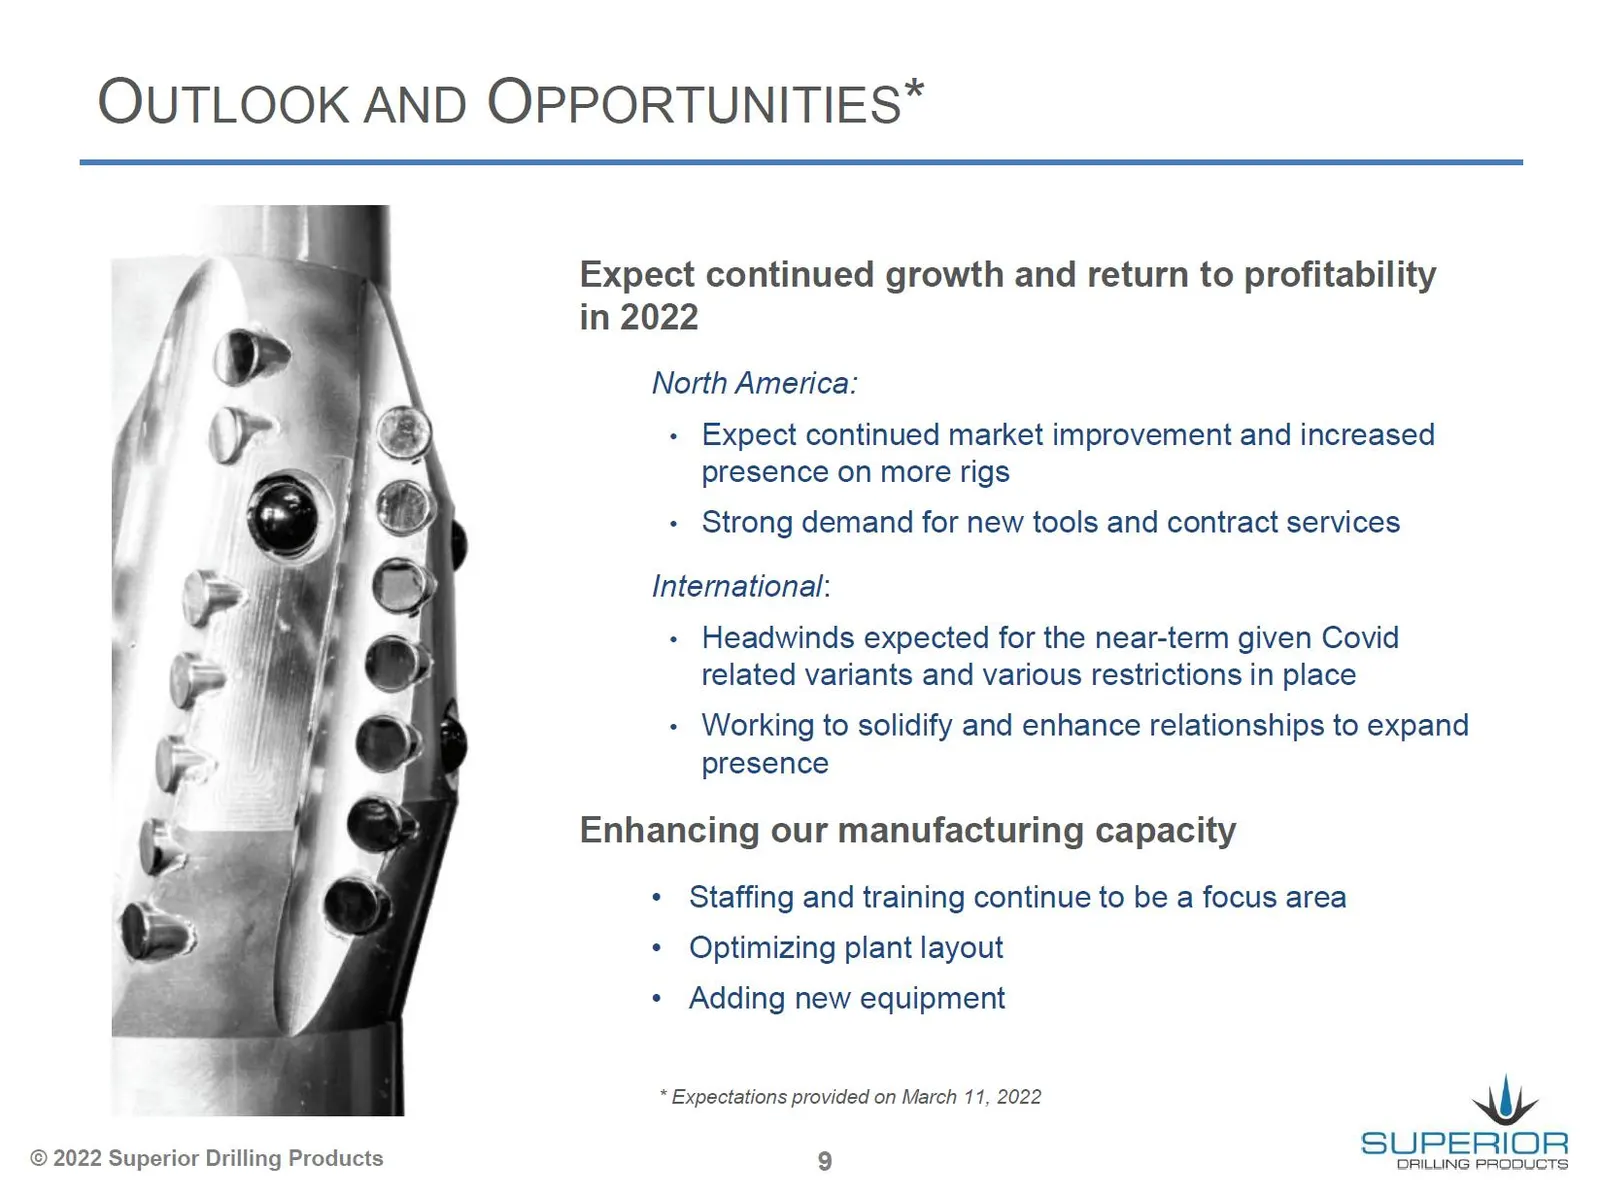
Slide 9: Outlook and Opportunities
OUTLOOK AND OPPORTUNITIES* © 2022 Superior Drilling Products Expect continued growth and return to profitability in 2022 North America: + Expect continued market improvement and increased presence on more rigs + Strong demand for new tools and contract services International: - Headwinds expected fo
Slide 10: Supplemental Information
SUZ SUPERIOR DRILLING PRODUCTS SUPPLEMENTAL INFORMATION © 2022 Superior Drilling Products
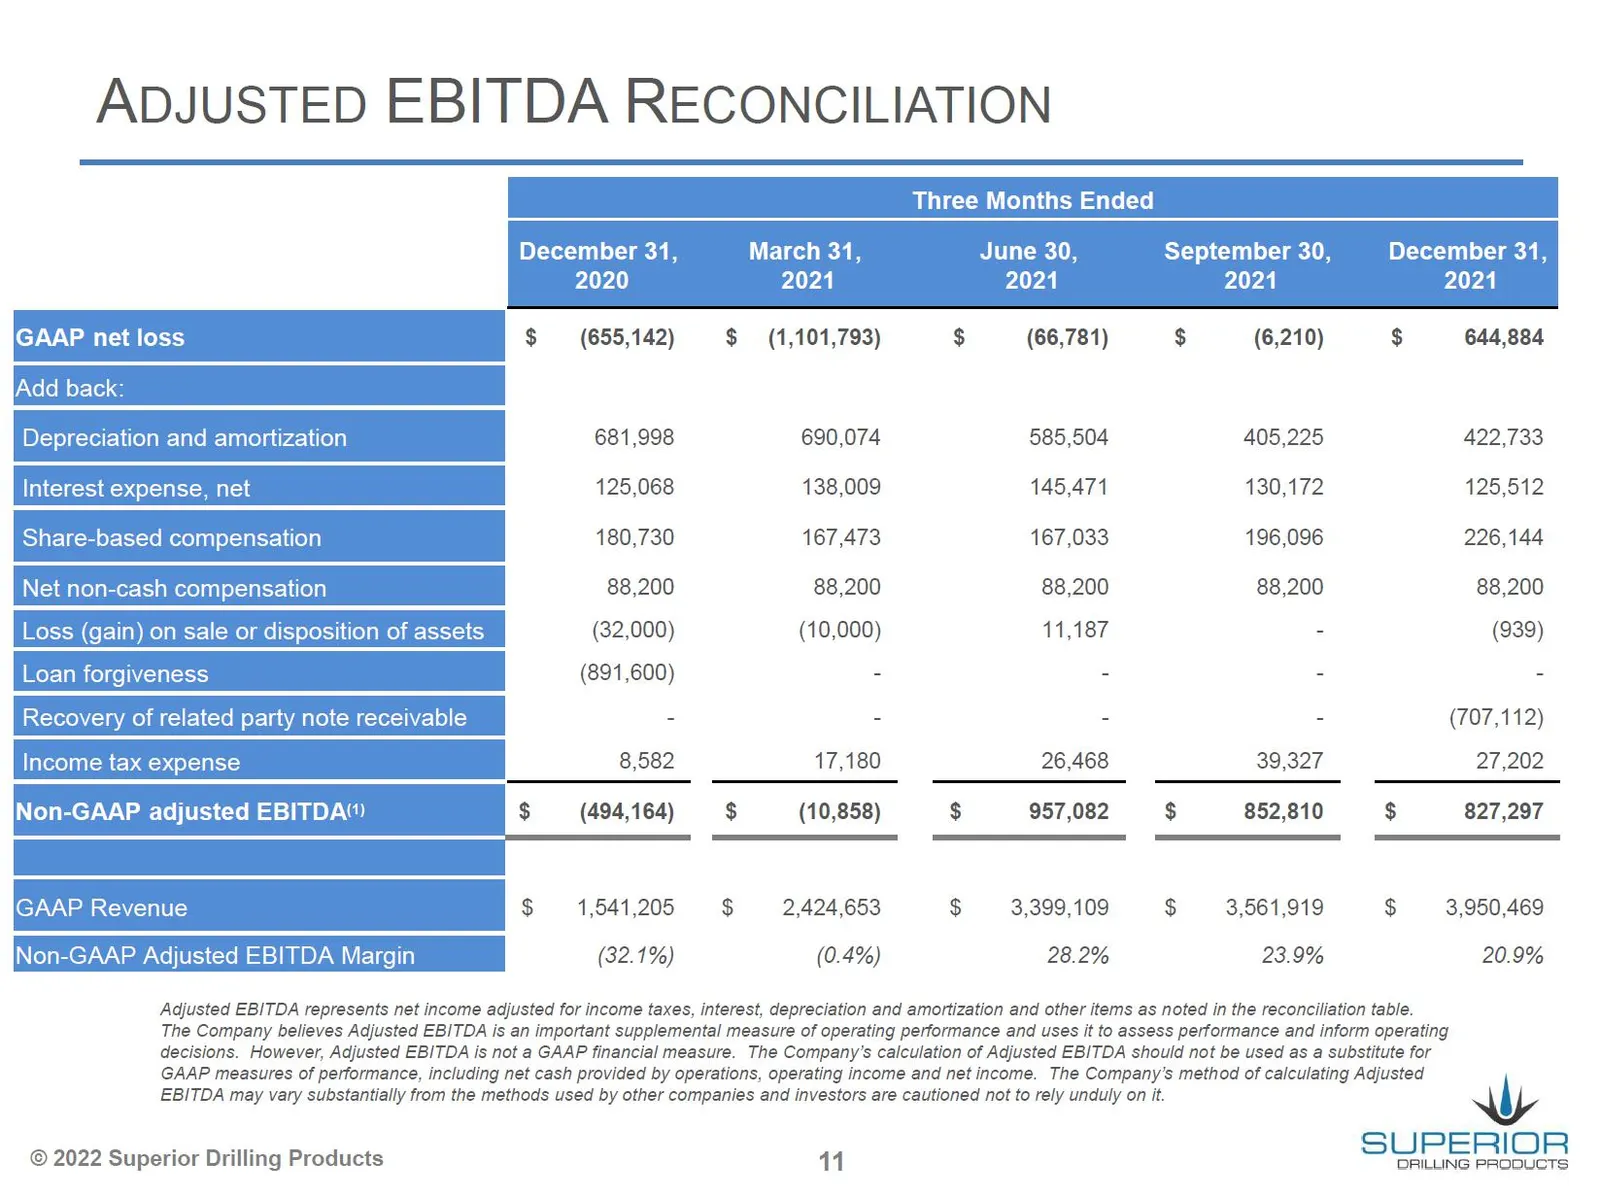
Slide 11: Adjusted EBITDA Reconciliation
ADJUSTED EBITDA RECONCILIATION et loss $ = (655,142) $ (1,101,793) $ (66,781) $ (6,210) $ 644,884 and amortizatio 681,998 690,074 585,504 405,225 422,733 es 5a 125,068 138,009 145,471 130,172 125,512 .-based compensation 180,730 167,473 167,033 196,096 226,144 88,200 88,200 88,200 88,200 88,200 Jon
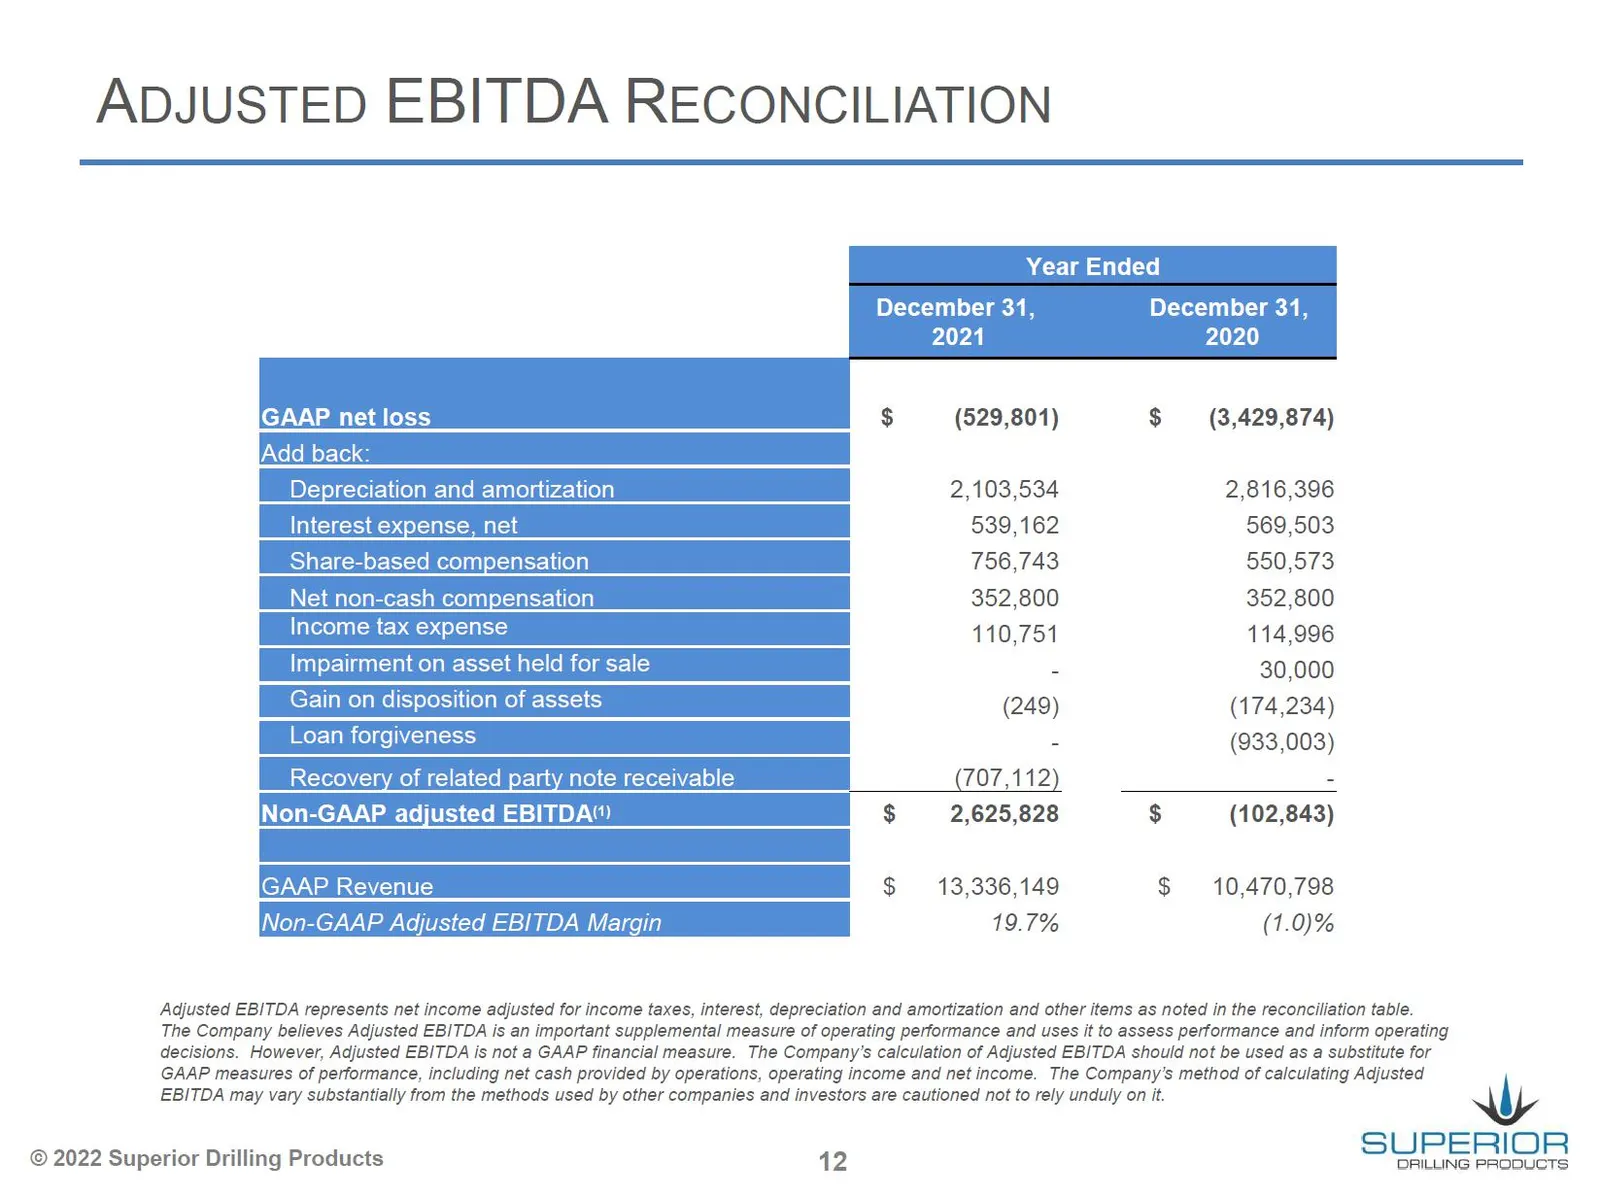
Slide 12: Adjusted EBITDA Reconciliation
ADJUSTED EBITDA RECONCILIATION Year Ended December 31, December 31, 2021 2020 $ (529,801) $ (3,429,874) 2,103,534 2,816,396 539,162 569,503 756,743 550,573 352,800 352,800 110,751 114,996 30,000 (249) (174,234) 2 (933,003) (707,112) - $ 2,625,828 $ (102,843) $ 13,336,149 $ 10,470,798 19.7% (1.0)% Ad
Source: SEC EDGAR · 8-K filed Mar 11, 2022
More decks from Superior Drilling Products Inc
 Q3 2023 Earnings Presentation12 slides · Nov 9, 2023
 Q2 2023 Earnings Presentation12 slides · Aug 14, 2023
 Q1 2023 Earnings Presentation12 slides · May 15, 2023
 FY2022 Earnings Presentation13 slides · Mar 10, 2023
 Q3 2022 Earnings Presentation12 slides · Nov 14, 2022
 MicroCap Rodeo Windy City Roundup 202220 slides · Oct 12, 2022