PetroQuest Energy — Investor Presentation (March 2009)
31 slides from PetroQuest Energy's investor presentation, Mar 20, 2009
Slide 1: PetroQuest Energy, Inc. March 2009
Ny PetroQuest Energy, Inc. March 2009 iis ENERGY. GROW TH. PETROQU
Slide 2: Company Information
1 Company Information 400 East Kaliste Saloom Road, Suite 6000 Lafayette, Louisiana 70508 Phone: (337) 232-7028 Fax: (337) 232-0044 www.petroquest.com NYSE: PQ Corporate Contact: Matt Quantz - mquantz@petroquest.com This news release contains "forward-looking statements" within the meaning of Sectio
Slide 3: Corporate Characteristics
2 Corporate Characteristics Historically, the Company has been successful in growing through the drill bit and strategic acquisitions 10-year(1) historical drilling success rate - 91% 10-year(1) F&D (including LHC) and Reserve Replacement - $3.64/Mcfe and 203% In 2003 began diversifying asset base i
Slide 4: Proven Track Record of Drilling with Cash Flow
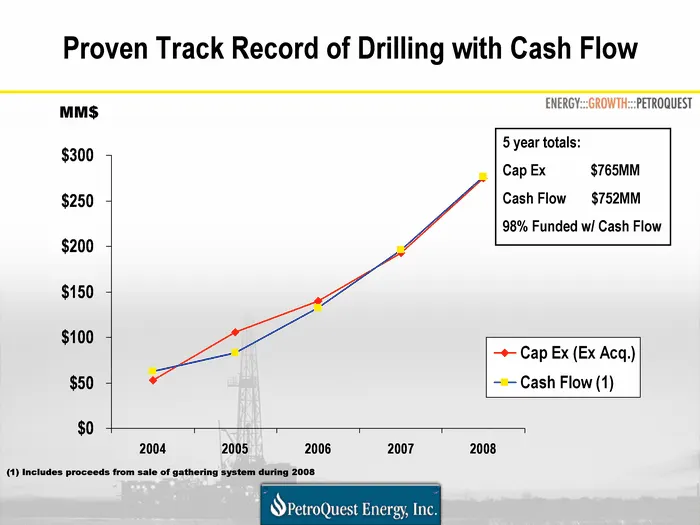
Proven Track Record of Drilling with Cash Flow 2004 2005 2006 2007 2008 Cap Ex (Ex Acq.) 52.5 105.8 139.6 192.5 274.8 Cash Flow (1) 62.9 83.2 132.8 196.2 276.7 North MM$ 5 year totals: Cap Ex $765MM Cash Flow $752MM 98% Funded w/ Cash Flow (1) Includes proceeds from sale of gathering system during 2
Slide 5: Nine Years of Growth
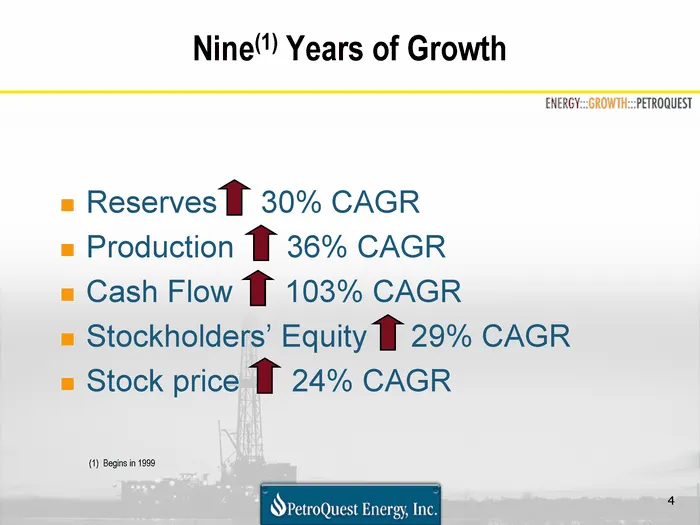
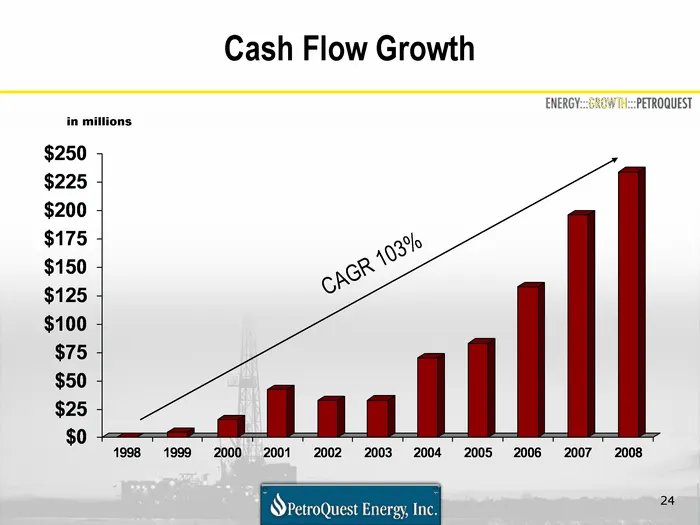
4 Nine(1) Years of Growth Reserves 30% CAGR Production 36% CAGR Cash Flow 103% CAGR Stockholders' Equity 29% CAGR Stock price 24% CAGR (1) Begins in 1999
Slide 6: Navigating the Current Environment
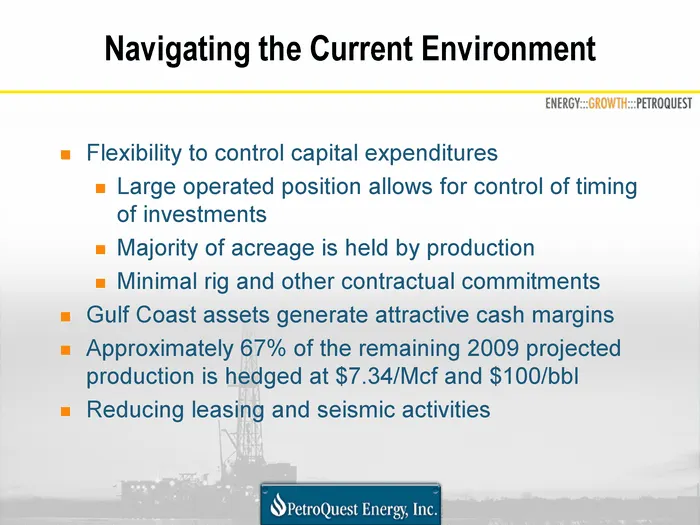
Navigating the Current Environment Flexibility to control capital expenditures Large operated position allows for control of timing of investments Majority of acreage is held by production Minimal rig and other contractual commitments Gulf Coast assets generate attractive cash margins Approximately
Slide 7: Our Properties
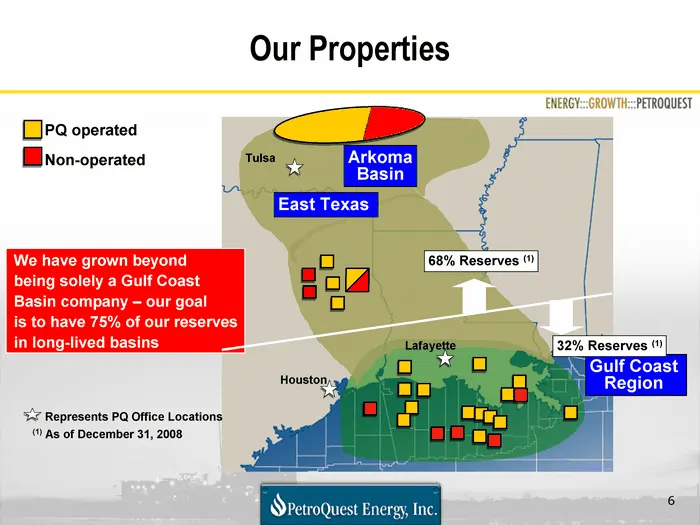
6 Our Properties PQ operated (1) As of December 31, 2008 Gulf Coast Region Represents PQ Office Locations Arkoma Basin Tulsa East Texas Lafayette Houston We have grown beyond being solely a Gulf Coast Basin company - our goal is to have 75% of our reserves in long-lived basins 68% Reserves (1) 32% R
Slide 8: Our Portfolio
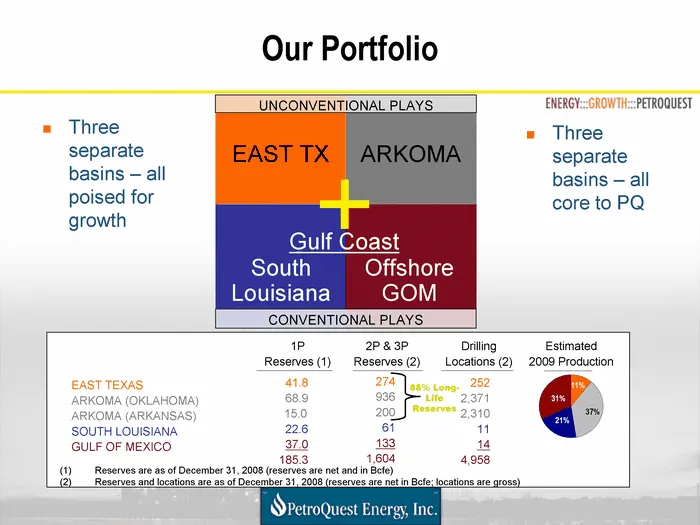
EAST TX ARKOMA South Louisiana Offshore GOM UNCONVENTIONAL PLAYS 1P Reserves (1) Drilling Locations (2) Estimated 2009 Production EAST TEXAS ARKOMA (OKLAHOMA) ARKOMA (ARKANSAS) SOUTH LOUISIANA GULF OF MEXICO Our Portfolio Three separate basins - all poised for growth Three separate basins - all core
Slide 9: Arkoma Basin
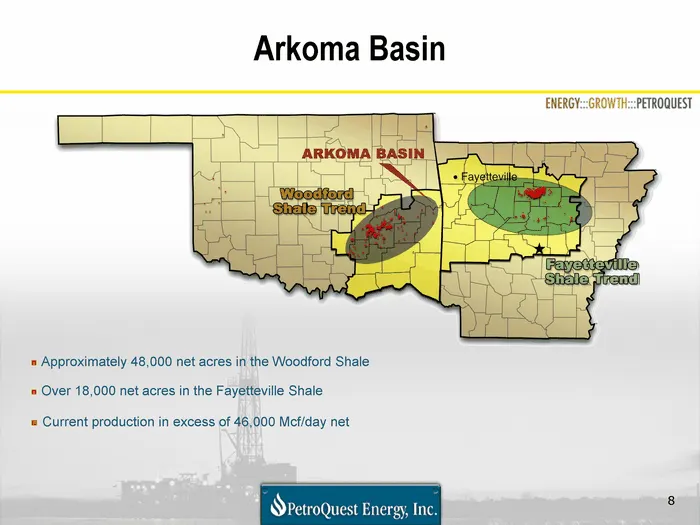
8 Arkoma Basin Approximately 48,000 net acres in the Woodford Shale Over 18,000 net acres in the Fayetteville Shale Current production in excess of 46,000 Mcf/day net
Slide 10: Woodford Shale Recent Activity
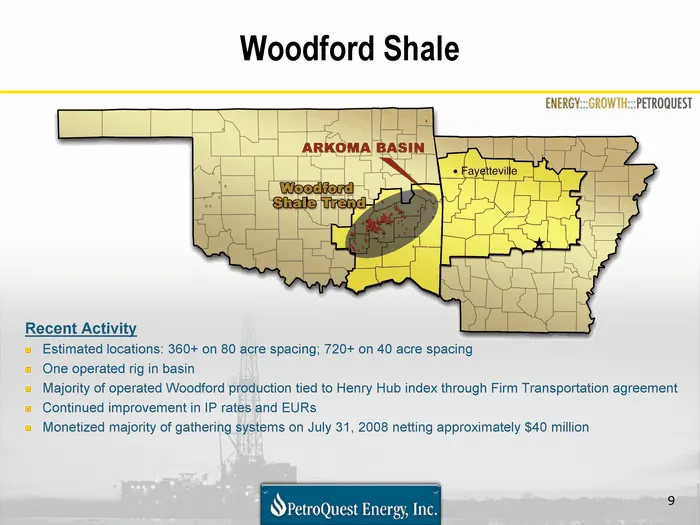
9 Woodford Shale Recent Activity Estimated locations: 360+ on 80 acre spacing; 720+ on 40 acre spacing One operated rig in basin Majority of operated Woodford production tied to Henry Hub index through Firm Transportation agreement Continued improvement in IP rates and EURs Monetized majority of gat
Slide 11: Gross Woodford Production (PQ Operated)
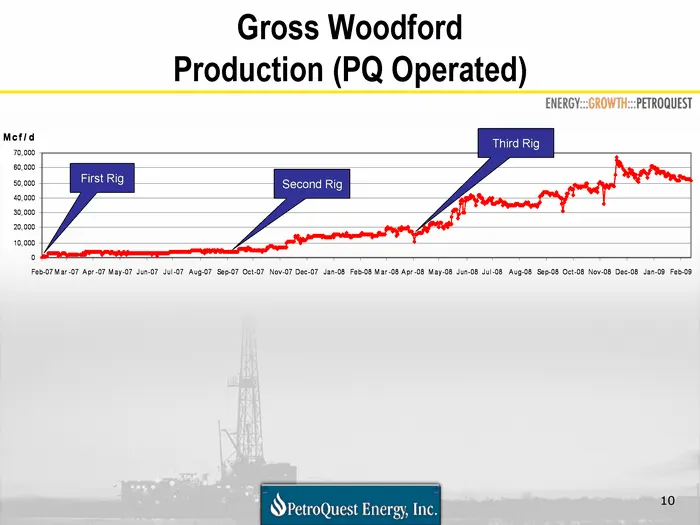
10 Gross Woodford Production (PQ Operated) First Rig Second Rig Third Rig
Slide 12: Woodford Shale Wells
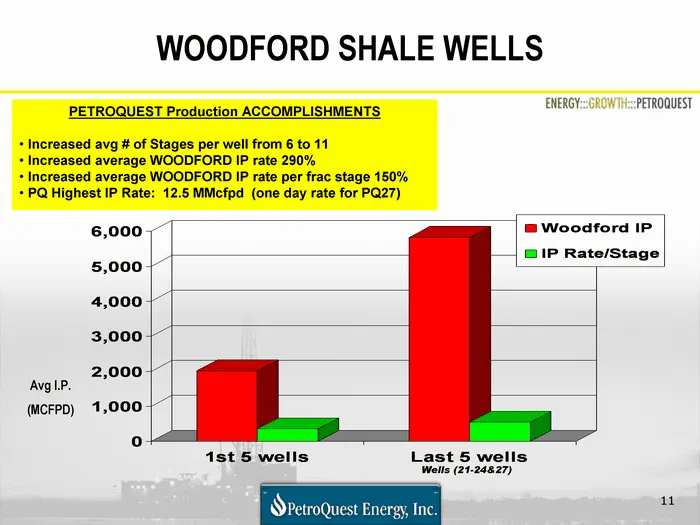
11 WOODFORD SHALE WELLS 1st 5 wells Last 5 wells Days 44.2 33.6 Cost (mm$) 5.6 5.2 Rate (Mscfpd/stage) 286 377 Completion Cost (mm$) 2.545 2.544 Stages 6 11 COST (M$) 5600 5200 Lateral length 3069 3651 Woodford Length (ft) 2658 3556 Woodford Efficiency 86 97 Woodford IP 2014 5828 IP Rate/Stage 359 5
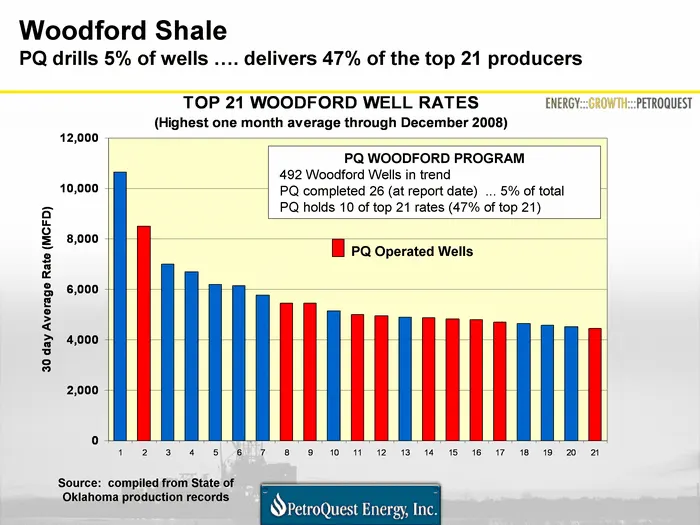
Slide 13: Woodford Shale: PQ drills 5% of wells, delivers 47% of top 21
Woodford Shale PQ drills 5% of wells .... delivers 47% of the top 21 producers Source: compiled from State of Oklahoma production records PQ WOODFORD PROGRAM 492 Woodford Wells in trend PQ completed 26 (at report date) ... 5% of total PQ holds 10 of top 21 rates (47% of top 21) PQ Operated Wells
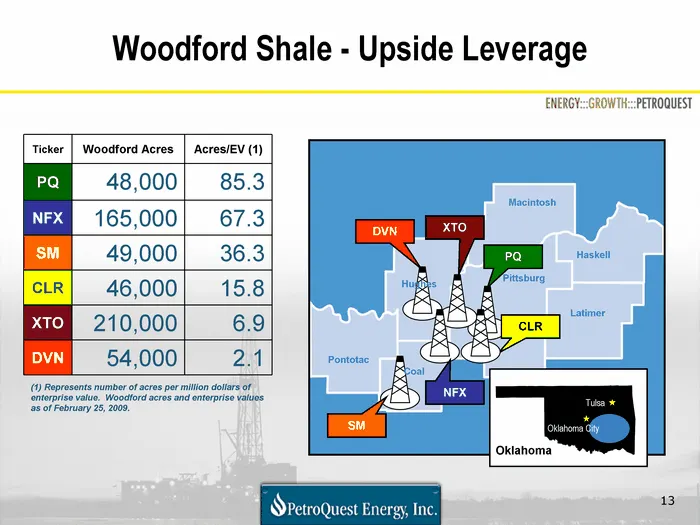
Slide 14: Woodford Shale - Upside Leverage
13 13 Woodford Shale - Upside Leverage Ticker Woodford Acres Acres/EV (1) PQ 48,000 85.3 NFX 165,000 67.3 SM 49,000 36.3 CLR 46,000 15.8 XTO 210,000 6.9 DVN 54,000 2.1 (1) Represents number of acres per million dollars of enterprise value. Woodford acres and enterprise values as of February 25, 2009
Slide 15: Fayetteville Shale
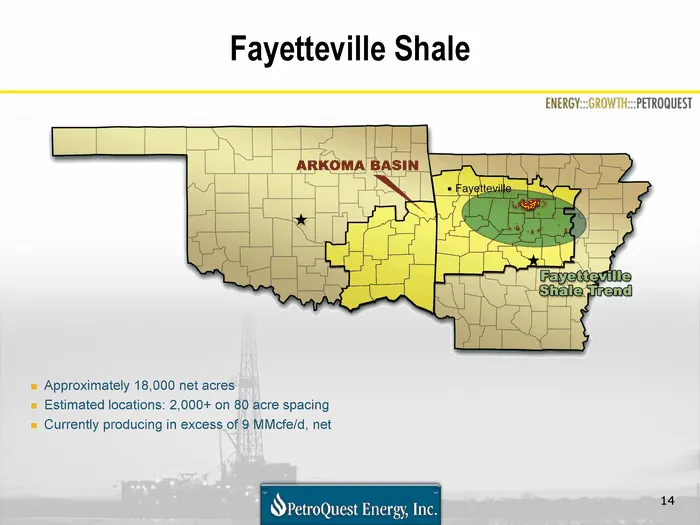
14 Fayetteville Shale Approximately 18,000 net acres Estimated locations: 2,000+ on 80 acre spacing Currently producing in excess of 9 MMcfe/d, net
Slide 16: Fayetteville Shale - Upside Leverage
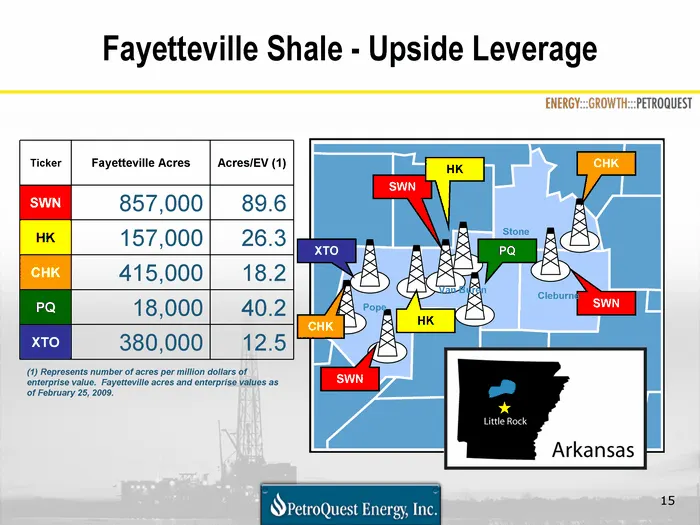
15 Fayetteville Shale - Upside Leverage Ticker Fayetteville Acres Acres/EV (1) SWN 857,000 89.6 HK 157,000 26.3 CHK 415,000 18.2 PQ 18,000 40.2 XTO 380,000 12.5 (1) Represents number of acres per million dollars of enterprise value. Fayetteville acres and enterprise values as of February 25, 2009. (
Slide 17: East Texas Basin
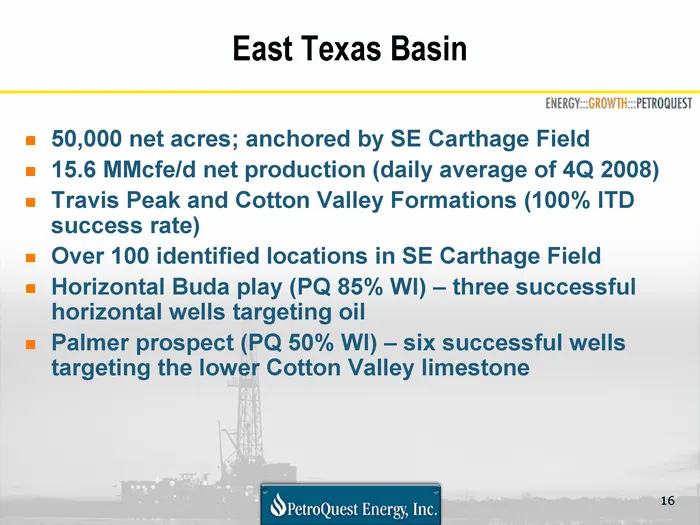
16 East Texas Basin 50,000 net acres; anchored by SE Carthage Field 15.6 MMcfe/d net production (daily average of 4Q 2008) Travis Peak and Cotton Valley Formations (100% ITD success rate) Over 100 identified locations in SE Carthage Field Horizontal Buda play (PQ 85% WI) - three successful horizonta
Slide 18: East Texas Basin Prospects
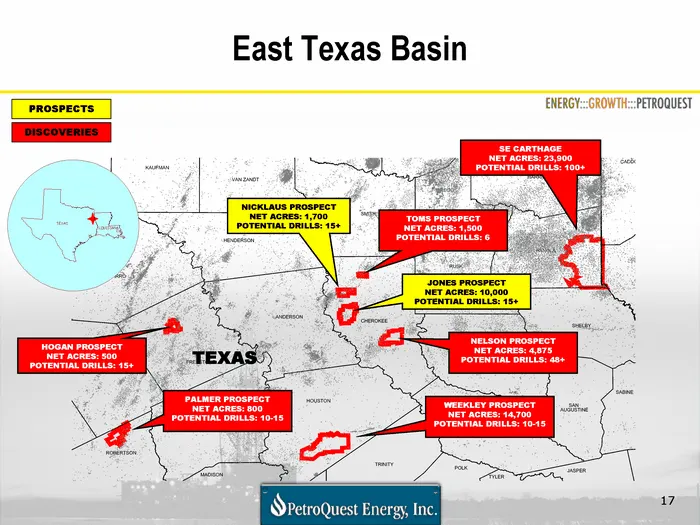
17 East Texas Basin SE CARTHAGE NET ACRES: 23,900 POTENTIAL DRILLS: 100+ NICKLAUS PROSPECT NET ACRES: 1,700 POTENTIAL DRILLS: 15+ JONES PROSPECT NET ACRES: 10,000 POTENTIAL DRILLS: 15+ HOGAN PROSPECT NET ACRES: 500 POTENTIAL DRILLS: 15+ PALMER PROSPECT NET ACRES: 800 POTENTIAL DRILLS: 10-15 PROSPECT
Slide 19: Resource Players Cash Flow Comparison
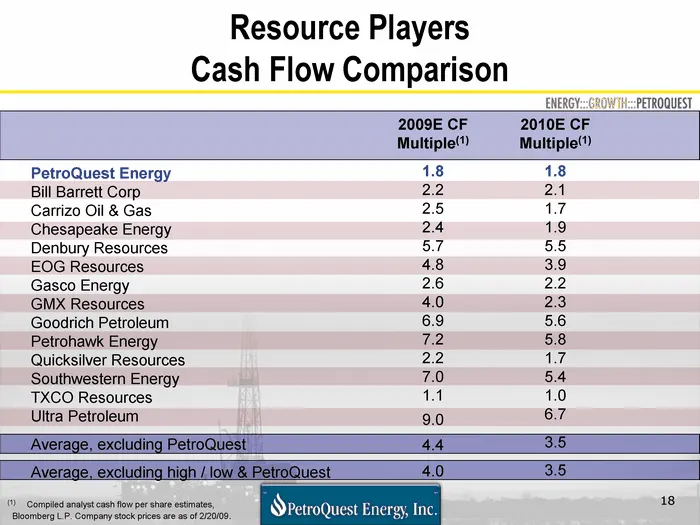
18 Resource Players Cash Flow Comparison PetroQuest Energy Bill Barrett Corp Carrizo Oil & Gas Chesapeake Energy Denbury Resources EOG Resources Gasco Energy GMX Resources Goodrich Petroleum Petrohawk Energy Quicksilver Resources Southwestern Energy TXCO Resources Ultra Petroleum Average, excluding
Slide 20: 2008 Gulf Coast Drilling Program
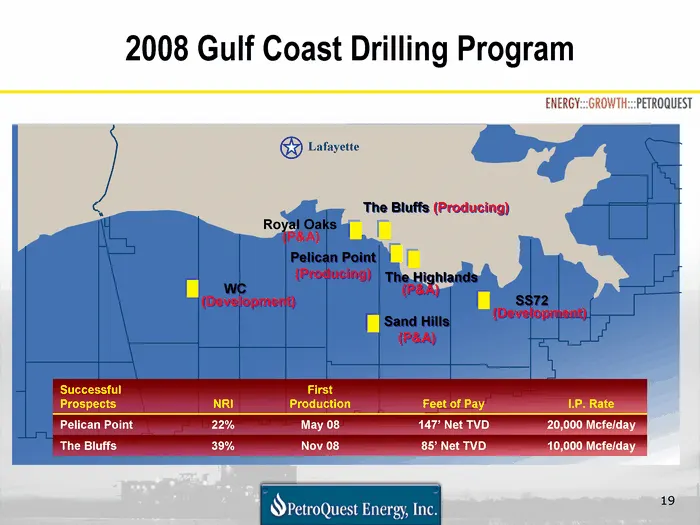
19 2008 Gulf Coast Drilling Program Lafayette Pelican Point (Producing) Sand Hills (P&A) The Highlands (P&A) The Bluffs (Producing) Royal Oaks (P&A) SS72 (Development) WC (Development) Successful Prospects NRI First Production Feet of Pay I.P. Rate Pelican Point 22% May 08 147' Net TVD 20,000 Mcfe/d
Slide 21: Near-Term Drilling Inventory
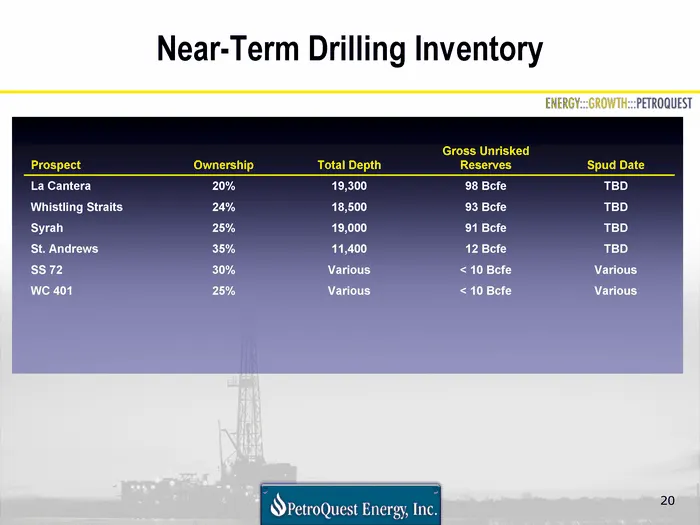
20 Near-Term Drilling Inventory Prospect Ownership Total Depth Gross Unrisked Reserves Spud Date La Cantera 20% 19,300 98 Bcfe TBD Whistling Straits 24% 18,500 93 Bcfe TBD Syrah 25% 19,000 91 Bcfe TBD St. Andrews 35% 11,400 12 Bcfe TBD SS 72 30% Various < 10 Bcfe Various WC 401 25% Various < 10 Bcfe
Slide 22: Consistent Approach Through Price Cycles
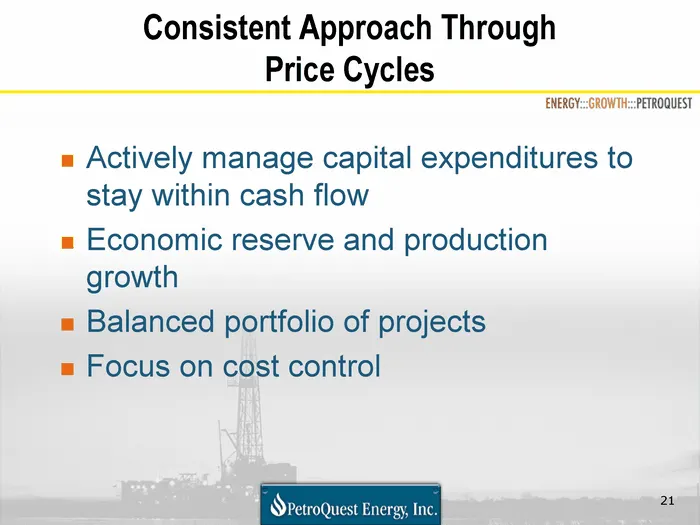
21 Consistent Approach Through Price Cycles Actively manage capital expenditures to stay within cash flow Economic reserve and production growth Balanced portfolio of projects Focus on cost control
Slide 23: Growth in Reserves
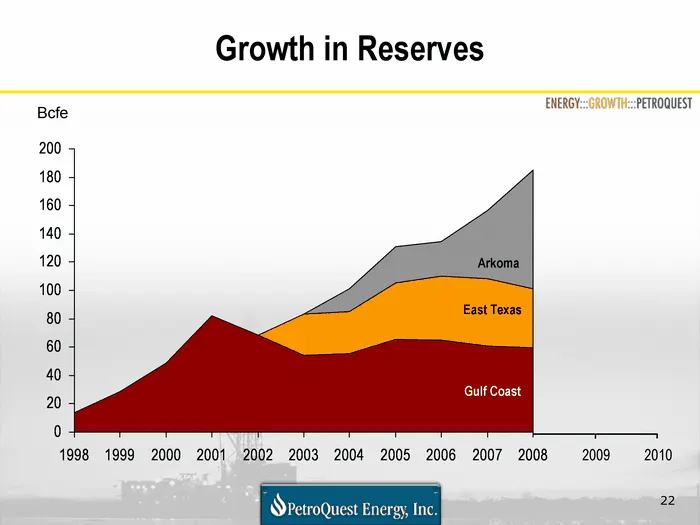
22 Growth in Reserves 1998 1999 2000 2001 2002 2003 2004 2005 2006 2007 2008 East 13.585 28.289 48.824 82.225 68.685 54.31 55.507 65.427 64.7 60.9 59.66 West 28.951 29.385 40.098 45.4 47.5 41.776 North 16.463 25.447 24.5 48.1 83.953 East Texas Arkoma Gulf Coast Bcfe 2009 2010
Slide 24: Growth in Production
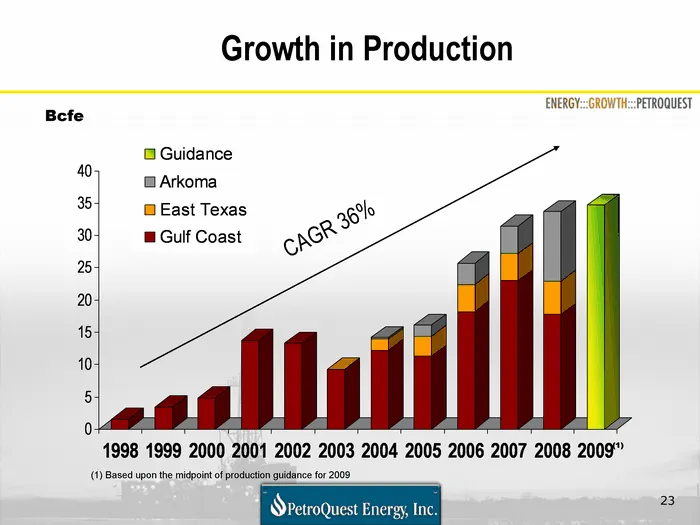
23 Growth in Production 1998 1999 2000 2001 2002 2003 2004 2005 2006 2007 2008 2009 Gulf Coast 1.553 3.461 4.848 13.774 13.34 9.267 12.206 11.3 18.2 22.995 17.8 East Texas 0.033 1.758 3.1 4.2 4.208 5.1 Arkoma 0.252 1.7 3.3 4.24 10.8 Guidance 34.675 Bcfe CAGR 36% (1) Based upon the midpoint of produc
Slide 25: Cash Flow Growth
24 Cash Flow Growth 1998 1999 2000 2001 2002 2003 2004 2005 2006 2007 2008 East -960 4.59 15.926 42.317 32.813 32.915 70.31 83 133 196 234 West 38.6 34.6 31.6 North 46.9 45 43.9 in millions CAGR 103%
Slide 26: Gross Margin
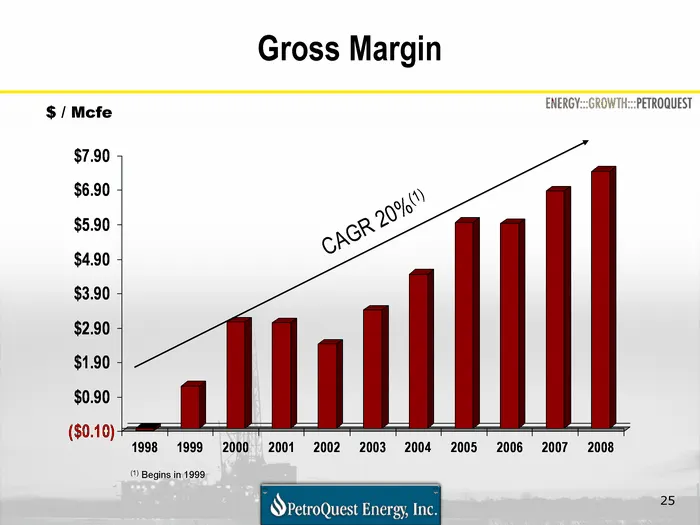
25 Gross Margin 1998 1999 2000 2001 2002 2003 2004 2005 2006 2007 2008 East -0.07 1.23 3.08 3.06 2.44 3.43 4.47 5.97 5.94 6.88 7.45 West North $ / Mcfe CAGR 20%(1) (1) Begins in 1999
Slide 27: Capital Investment Program - Diversification Reduces Risk
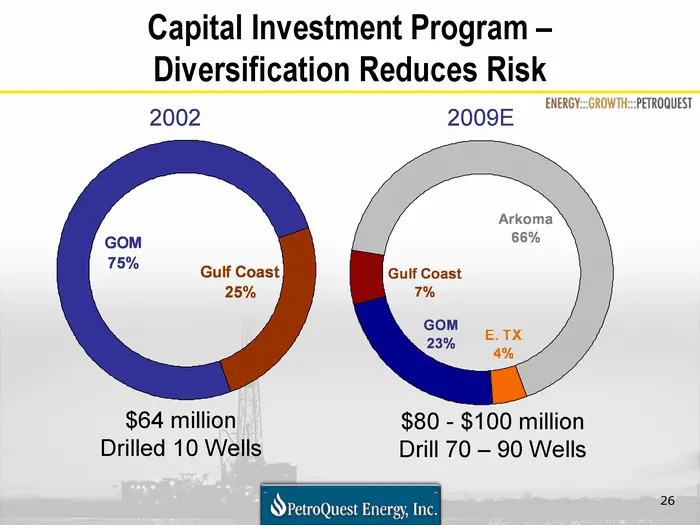
26 E. TX GOM Gulf Coast Arkoma Cap Investment Program 2.774 14.885 4.34 43.928 West 30.6 38.6 34.6 31.6 North 45.9 46.9 45 43.9 Capital Investment Program - Diversification Reduces Risk $80 - $100 million Drill 70 - 90 Wells $64 million Drilled 10 Wells 2002 2009E GOM Gulf Coast Cap Investment Progr
Slide 28: Conservative Financial Philosophy
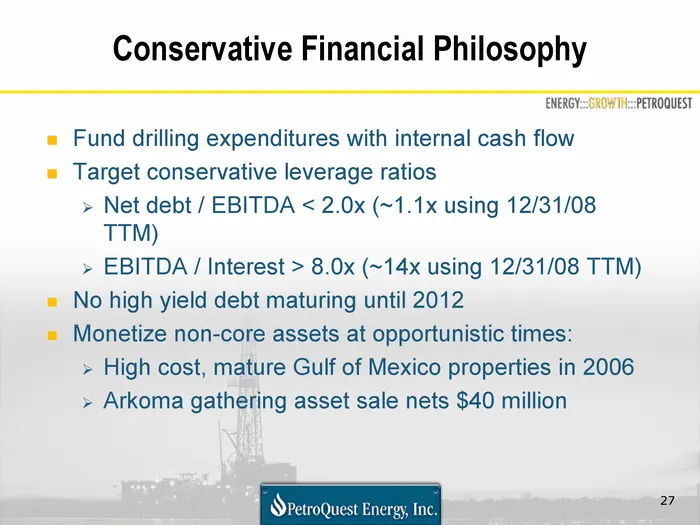
27 Conservative Financial Philosophy Fund drilling expenditures with internal cash flow Target conservative leverage ratios Net debt / EBITDA < 2.0x (~1.1x using 12/31/08 TTM) EBITDA / Interest > 8.0x (~14x using 12/31/08 TTM) No high yield debt maturing until 2012 Monetize non-core assets at opport
Slide 29: Hedging Positions
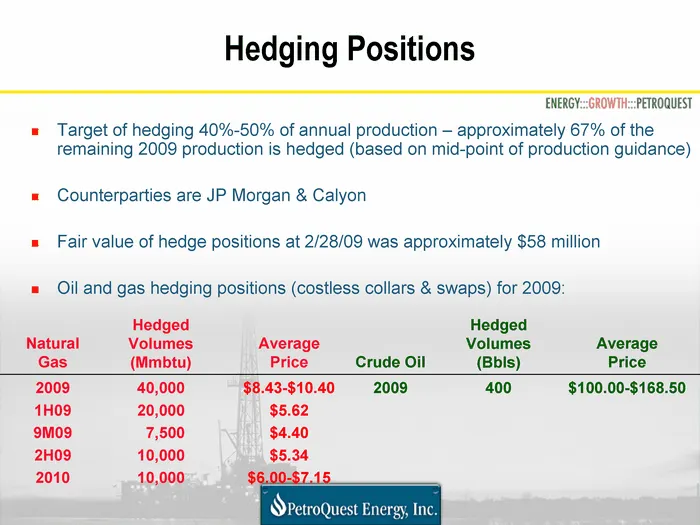
Hedging Positions Target of hedging 40%-50% of annual production - approximately 67% of the remaining 2009 production is hedged (based on mid-point of production guidance) Counterparties are JP Morgan & Calyon Fair value of hedge positions at 2/28/09 was approximately $58 million Oil and gas hedging
Slide 30: Summary and Outlook
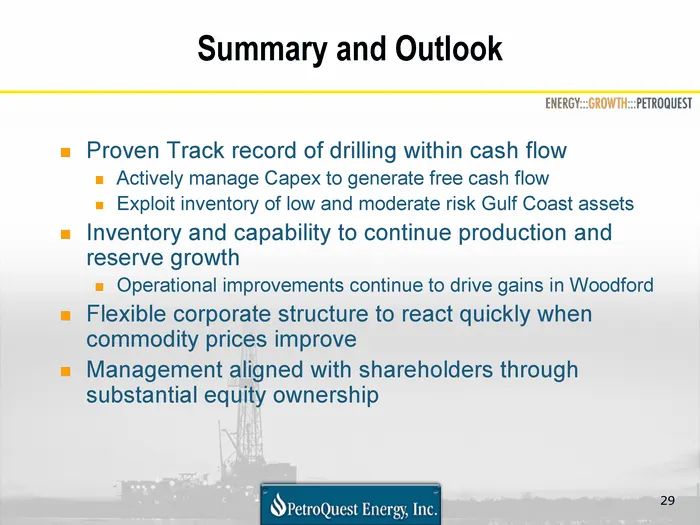
29 Summary and Outlook Proven Track record of drilling within cash flow Actively manage Capex to generate free cash flow Exploit inventory of low and moderate risk Gulf Coast assets Inventory and capability to continue production and reserve growth Operational improvements continue to drive gains in
Slide 31: East Kaliste Saloom Road, Suite 6000 Lafayette, Louisiana 70508 Phone: (337) 232-7028 Fax: (337)
400 East Kaliste Saloom Road, Suite 6000 Lafayette, Louisiana 70508 Phone: (337) 232-7028 Fax: (337) 232-0044 www.petroquest.com NYSE: PQ
Source: SEC EDGAR · 8-K filed Mar 20, 2009
More decks from PetroQuest Energy Inc
 Corporate Update (June 2019)15 slides · Jun 19, 2019
 Investor Presentation (November 2018)16 slides · Nov 7, 2018
 Investor Presentation (July 2018)29 slides · Jul 10, 2018
 Investor Presentation (December 2017)6 slides · Dec 20, 2017
 Investor Presentation (January 2017)28 slides · Jan 9, 2017
 Investor Presentation (April 2016)29 slides · Apr 5, 2016