Superior Drilling Products Inc
Superior Drilling Products — Q4 2016 Earnings Presentation
17 slides from Superior Drilling Products's earnings presentation, Mar 10, 2017
Slide 1: Fourth Quarter 2016 Financial Results Conference Call
Fourth Quarter 2016 Financial Results Conference Call March 10, 2017 NYSE MKT: SDPI ©2017 Superior Drilling Products
Slide 2: Safe Harbor Statement
Safe Harbor Statement These slides and the accompanying oral presentation contain “forward-looking statements’ within the meaning of the safe harbor provisions, 15 U.S.C. § 78u-5, of the Private Securities Litigation Reform Act of 1995. All statements, other than statements of historical fact includ
Slide 3: Troy Meier, Chairman and Chief Executive Officer
DRI igNS PRODUCTS il : a Troy Meier Chairman and Chief Executive Officer ©2017 Superior Drilling Products
Slide 4: Solid Revenue with New Business Model
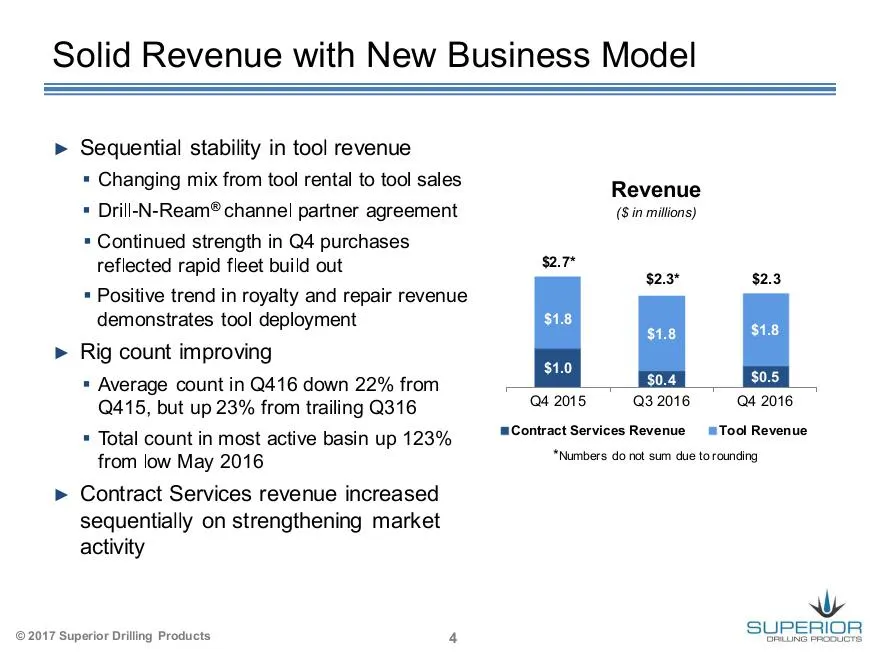
Solid Revenue with New Business Model > Sequential stability in tool revenue = Changing mix from tool rental to tool sales * Drill-N-Ream® channel partner agreement * Continued strength in Q4 purchases reflected rapid fleet build out * Positive trend in royalty and repair revenue demonstrates tool d
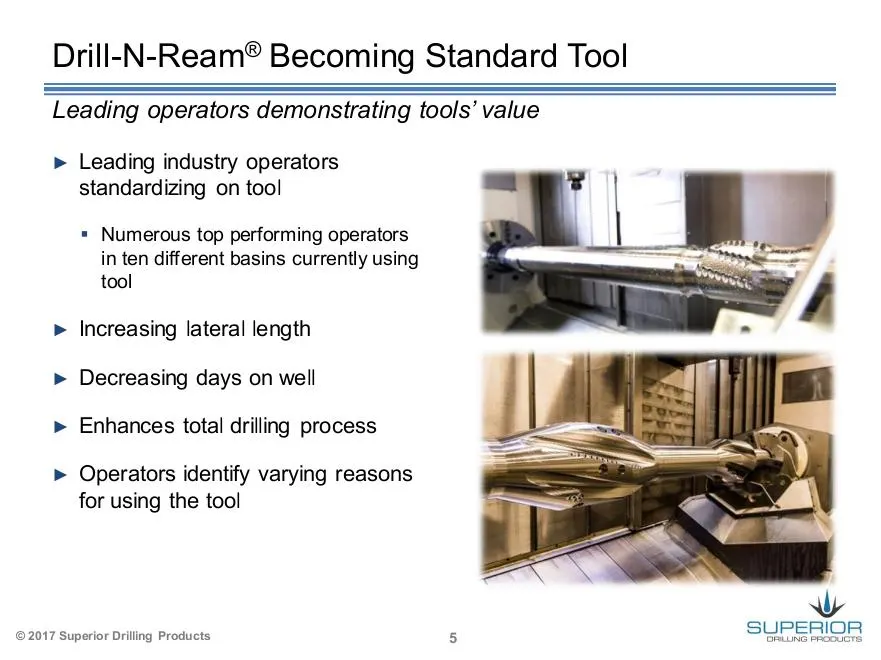
Slide 5: Drill-N-Ream® Becoming Standard Tool
Drill-N-Ream® Becoming Standard Tool Leading operators demonstrating tools’ value > Leading industry operators standardizing on tool = Numerous top performing operators in ten different basins currently using tool > Increasing lateral length > Decreasing days on well > Enhances total drilling proces
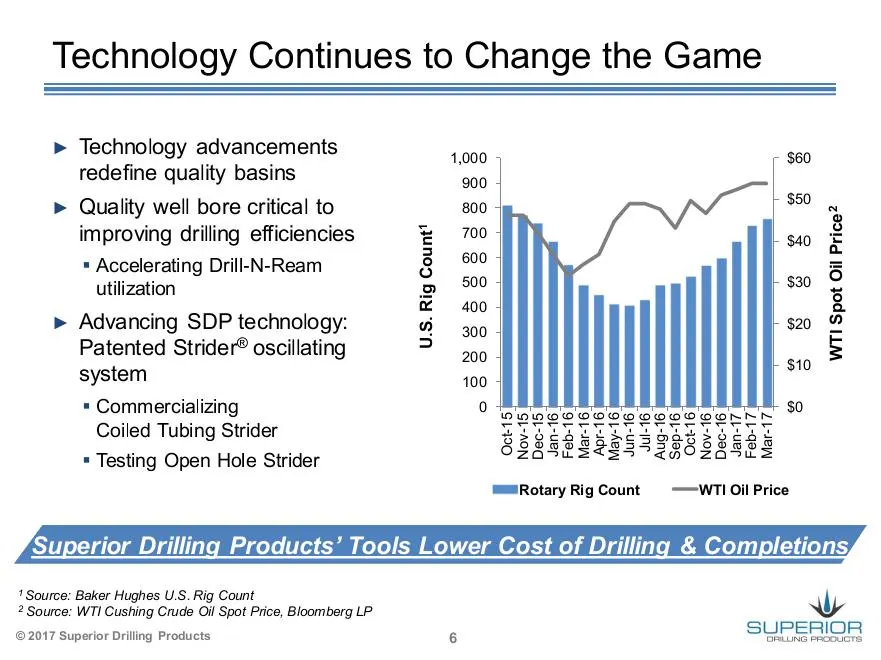
Slide 6: Technology Continues to Change the Game
Technology Continues to Change the Game > Technology advancements redefine quality basins > Quality well bore critical to 800 $50 4,000 $60 improving drilling efficiencies % 700 $40 2 3 " Accelerating Drill-N-Ream B00 5 iliveatl 500 $30 utilization D . x 400 g > Advancing SDP technology: G 300 $20 P
Slide 7: Financial Results - Christopher D. Cashion, CFO
DRI igNS PRODUCTS il : a Financial Results Christopher D. Cashion Chief Financial Officer ©2017 Superior Drilling Products
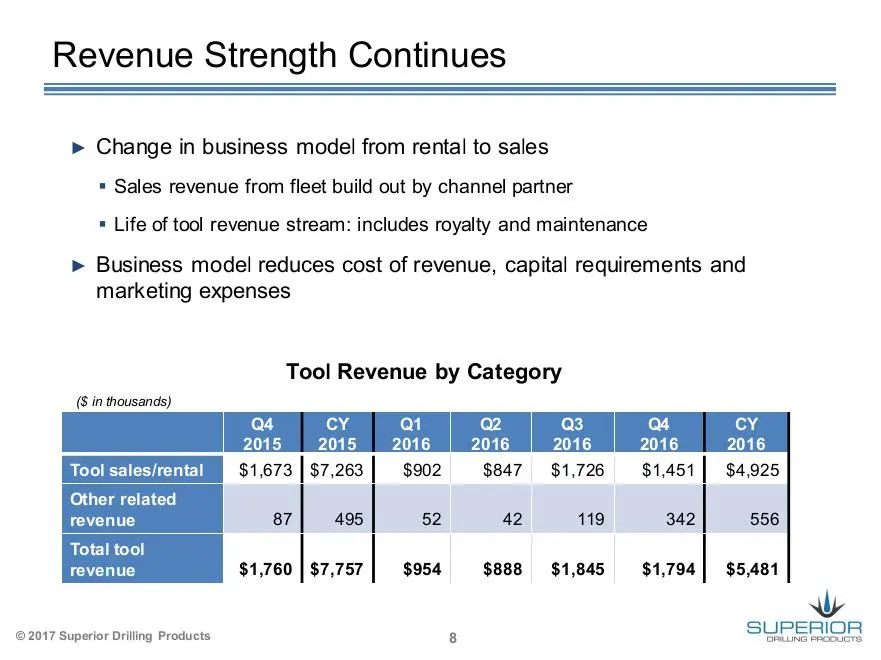
Slide 8: Revenue Strength Continues
Revenue Strength Continues > Change in business model from rental to sales = Sales revenue from fleet build out by channel partner ® Life of tool revenue stream: includes royalty and maintenance » Business model reduces cost of revenue, capital requirements and marketing expenses Tool Revenue by Cat
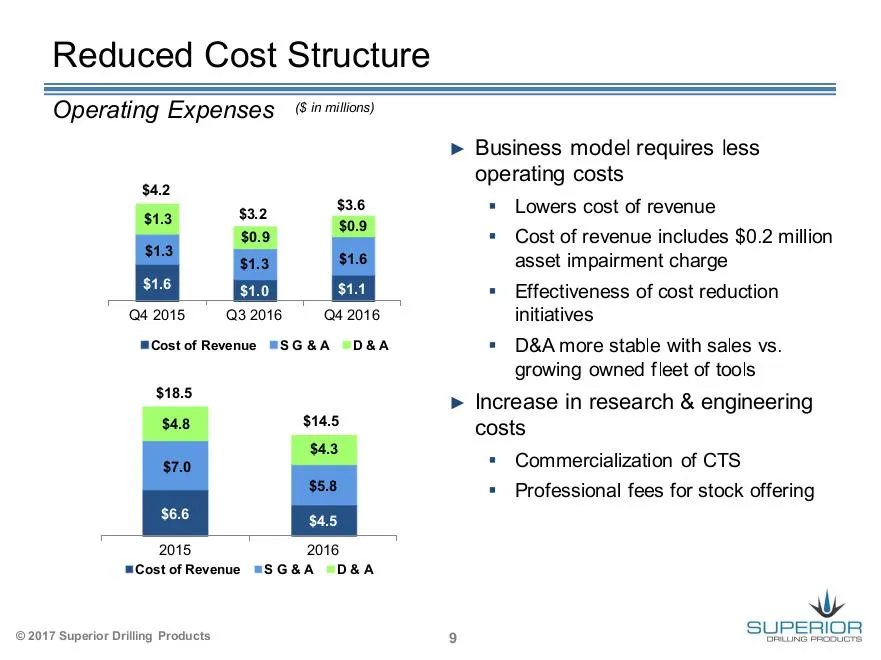
Slide 9: Reduced Cost Structure
Reduced Cost Structure Operating Expenses inmilions) > Business model requires less operating costs = Lowers cost of revenue * Cost of revenue includes $0.2 million asset impairment charge . * Effectiveness of cost reduction Q4 2015 Q3 2016 Q4 2016 initiatives $4.2 "Cost of Revenue SG&A "D&A » D&Amo
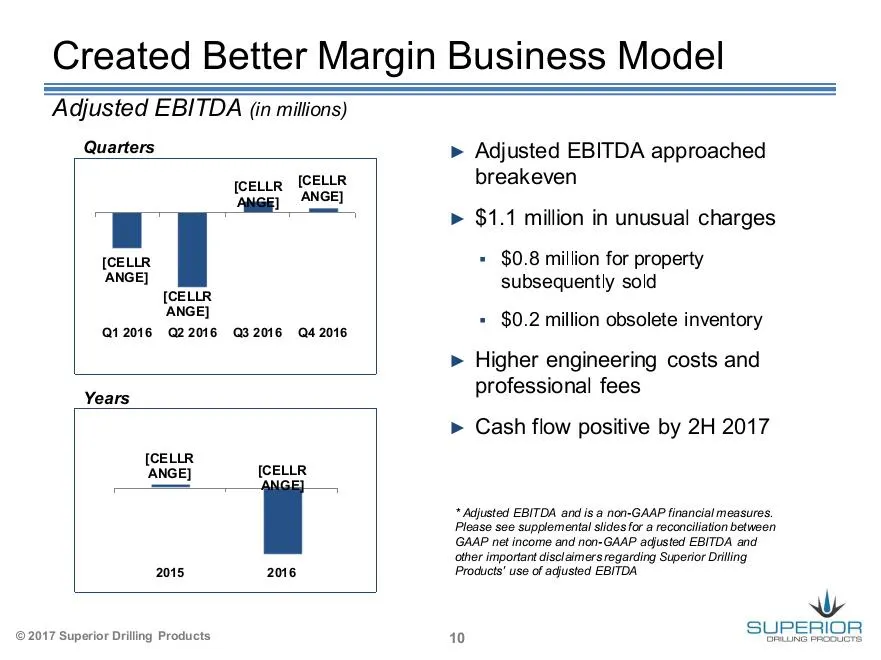
Slide 10: Created Better Margin Business Model
Created Better Margin Business Model Adjusted EBITDA (in millions) Quarters [CELLR feel aee [CELLR ANGE] [CELLR ANGE] 12016 22016 a32016 a4 2016 Years [CELLR ANGE] [CELLR 2015 206 ©2017 Superior Drilling Products » Adjusted EBITDA approached breakeven > $1.1 million in unusual charges + $0.8 million
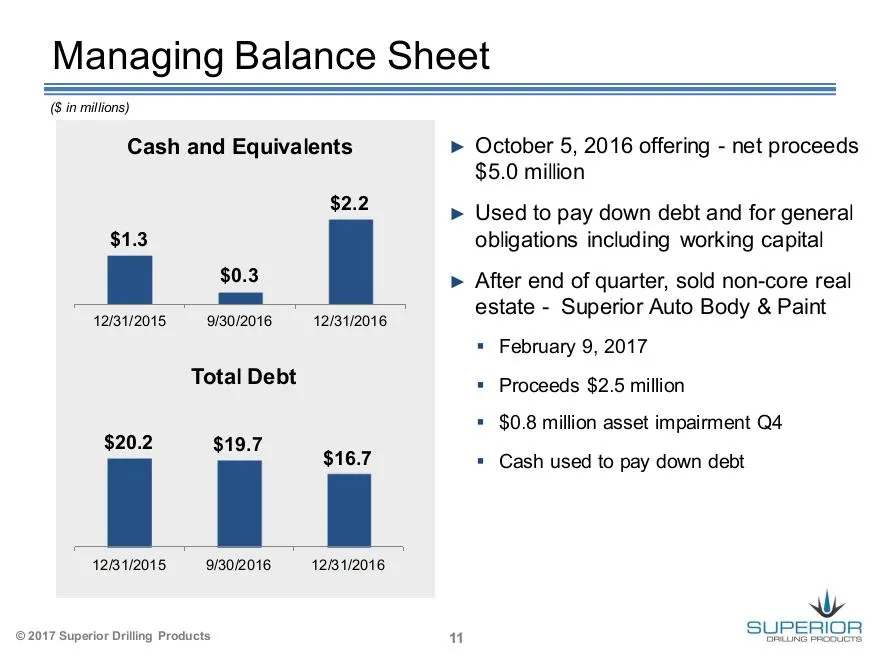
Slide 11: Managing Balance Sheet
Managing Balance Sheet (S in millions) Cash and Equivalents > October 5, 2016 offering - net proceeds $5.0 million ae > Used to pay down debt and for general $1.3 obligations including working capital ii $0.3 > After end of quarter, sold non-core real = estate - Superior Auto Body & Paint 12/31/2015
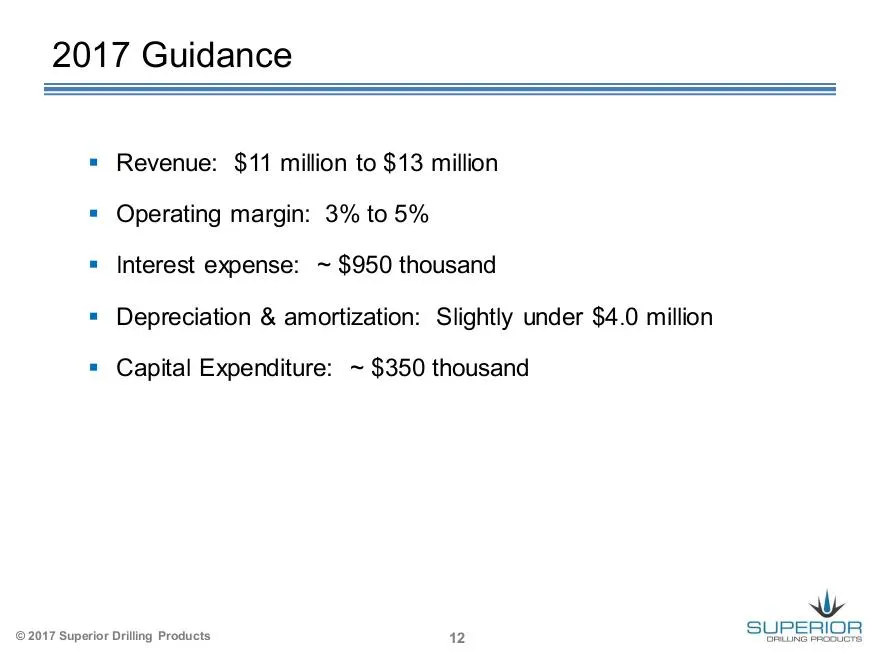
Slide 12: 2017 Guidance
2017 Guidance = Revenue: $11 million to $13 million = Operating margin: 3% to 5% = Interest expense: ~ $950 thousand = Depreciation & amortization: Slightly under $4.0 million = Capital Expenditure: ~ $350 thousand ©2017 Superior Drilling Products 42
Slide 13: Overview and Outlook
DRI igNS PRODUCTS il : a Overview and Outlook Troy Meier Chairman and Chief Executive Officer ©2017 Superior Drilling Products
Slide 14: Opportunities
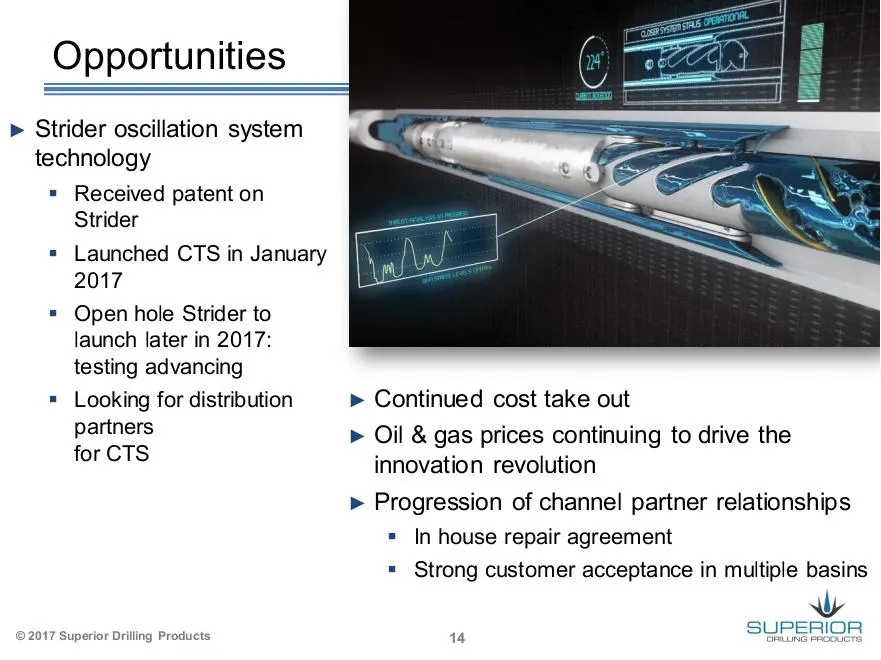
Opportunities > Strider oscillation system technology = Received patent on Strider = Launched CTS in January 2017 = Open hole Strider to launch later in 2017: testing advancing = Looking for distribution > Continued cost take out partners > Oil & gas prices continuing to drive the for CTS innovation
Slide 15: Supplemental Information
Supplemental Information ©2017 Superior Drilling Products
Slide 16: Adjusted EBITDA Reconciliation
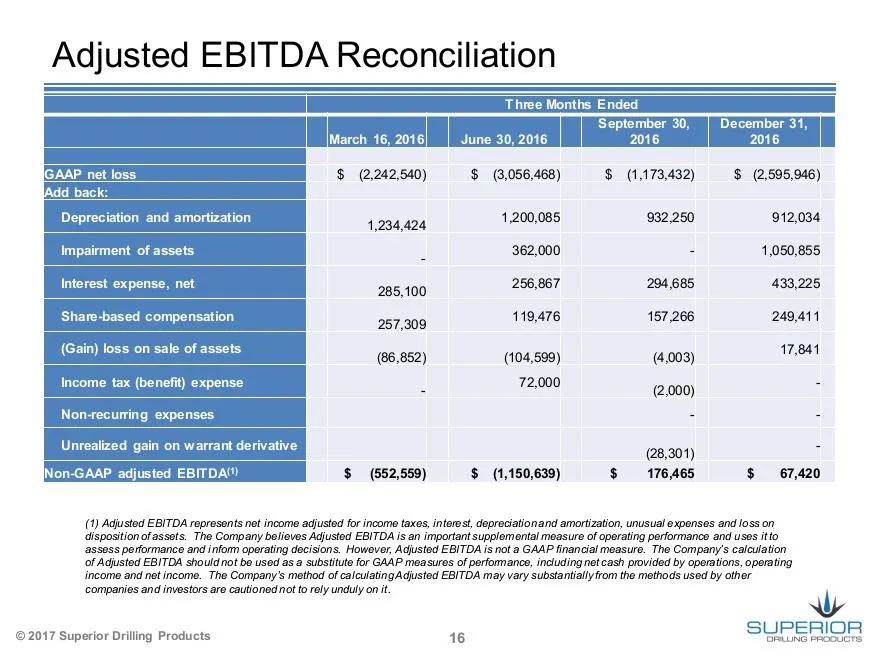
Adjusted EBITDA Reconciliation _ Thee Months Ended ‘September 30, _] December 31, larch 16, 201 June 30, 2016 2016 2016 | $ $ $ (Gain) loss on sale of assets (e6,852) (104,509) (4,003) 17,841 Income tax (benefit) expense A 72,000 (2.000) * | Unrealized gain on warrant derivative om 4 S (52,559) $ (1
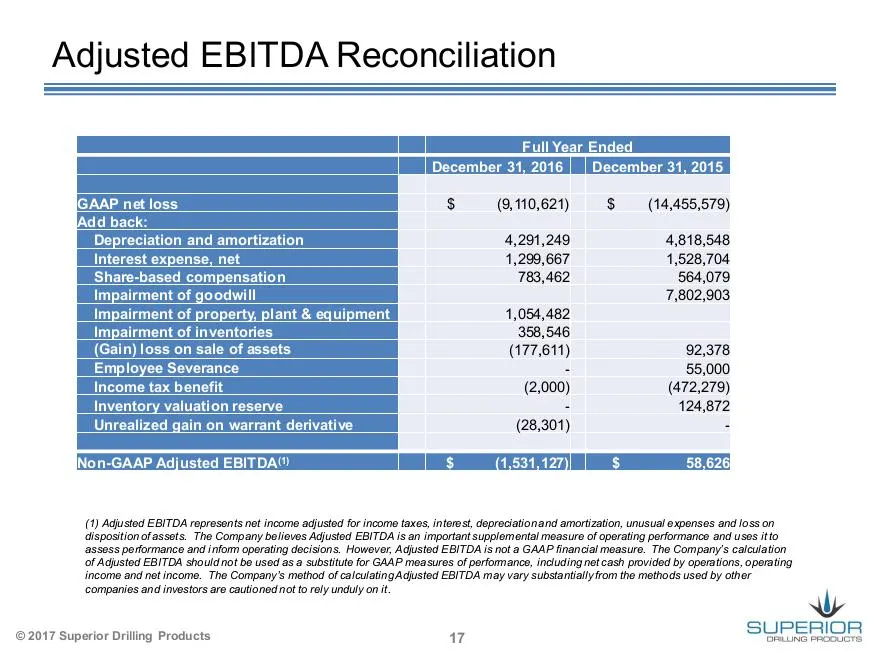
Slide 17: Adjusted EBITDA Reconciliation
Adjusted EBITDA Reconciliation nen (| Full Year Ended pe Tdecember 31, 2016] | December 31, 2015 S$ (9,110,621) $ (14,455,579) 4,291,249 4,818,548 4,290,667 4,528,704 783,462 564,079 7,802,903 1,054,482 358,546 (177,611) 92,378 - 55,000 (2,000) (472,279) 4 124,872 (28,301) : ee) Non-GAAP Adjusted EB
Source: SEC EDGAR · 8-K filed Mar 10, 2017
More decks from Superior Drilling Products Inc
 Q3 2023 Earnings Presentation12 slides · Nov 9, 2023
 Q2 2023 Earnings Presentation12 slides · Aug 14, 2023
 Q1 2023 Earnings Presentation12 slides · May 15, 2023
 FY2022 Earnings Presentation13 slides · Mar 10, 2023
 Q3 2022 Earnings Presentation12 slides · Nov 14, 2022
 MicroCap Rodeo Windy City Roundup 202220 slides · Oct 12, 2022