PetroQuest Energy — Investor Presentation (March 2013)
37 slides from PetroQuest Energy's investor presentation, Mar 19, 2013
Slide 1: March 2013
March 2013
Slide 2: Company Information
Company Information 1 Corporate Contact: Matt Quantz - mquantz@petroquest.com This presentation contains "forward-looking statements" within the meaning of Section 27A of the Securities Act of 1933, as amended, and Section 21E of the Securities Exchange Act of 1934, as amended. These forward-looking
Slide 3: Our Properties
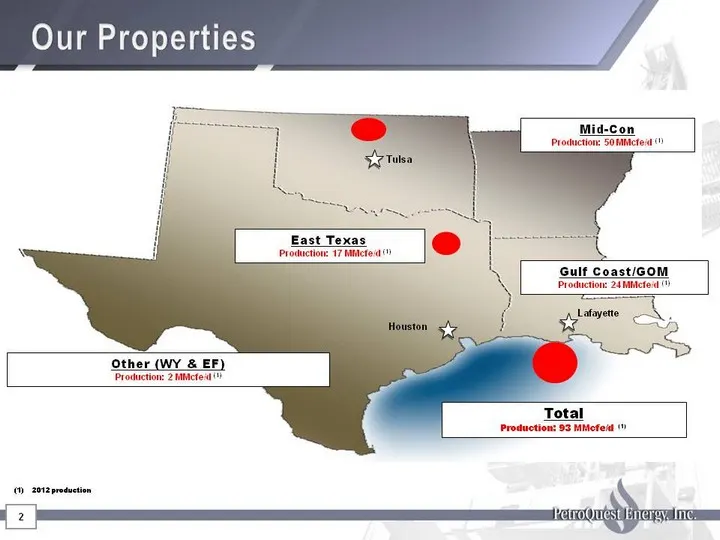
Mid-Con Production: 50 MMcfe/d (1) 2012 production East Texas Production: 17 MMcfe/d (1) Tulsa Gulf Coast/GOM Production: 24 MMcfe/d (1) Lafayette Other (WY & EF) Production: 2 MMcfe/d (1) Total Production: 93 MMcfe/d (1) Houston Our Properties 2
Slide 4: Our Properties: Production and Reserves
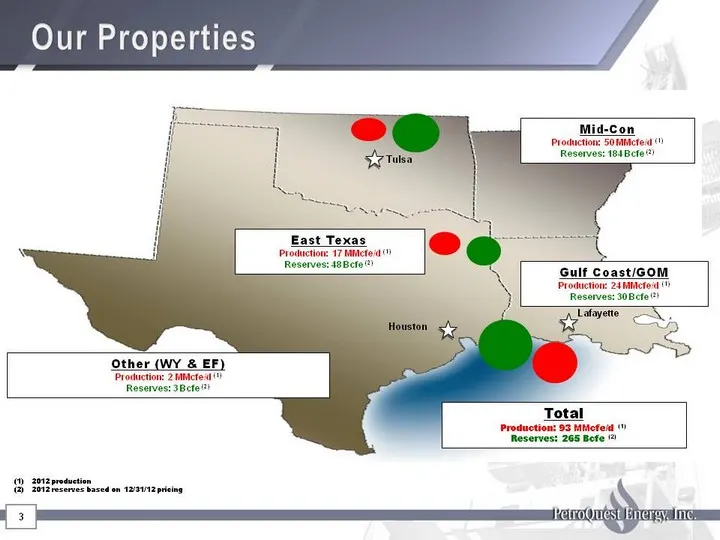
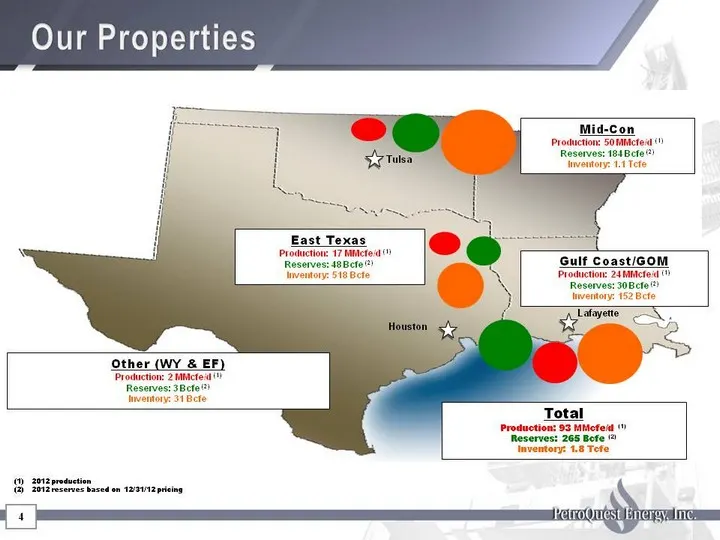
Mid-Con Production: 50 MMcfe/d (1) Reserves: 184 Bcfe (2) 2012 production 2012 reserves based on 12/31/12 pricing East Texas Production: 17 MMcfe/d (1) Reserves: 48 Bcfe (2) Tulsa Gulf Coast/GOM Production: 24 MMcfe/d (1) Reserves: 30 Bcfe (2) Lafayette Other (WY & EF) Production: 2 MMcfe/d (1) Rese
Slide 5: Our Properties: Production, Reserves and Inventory
Mid-Con Production: 50 MMcfe/d (1) Reserves: 184 Bcfe (2) Inventory: 1.1 Tcfe 2012 production 2012 reserves based on 12/31/12 pricing East Texas Production: 17 MMcfe/d (1) Reserves: 48 Bcfe (2) Inventory: 518 Bcfe Tulsa Gulf Coast/GOM Production: 24 MMcfe/d (1) Reserves: 30 Bcfe (2) Inventory: 152 B
Slide 6: Core positions provide exposure to each commodity
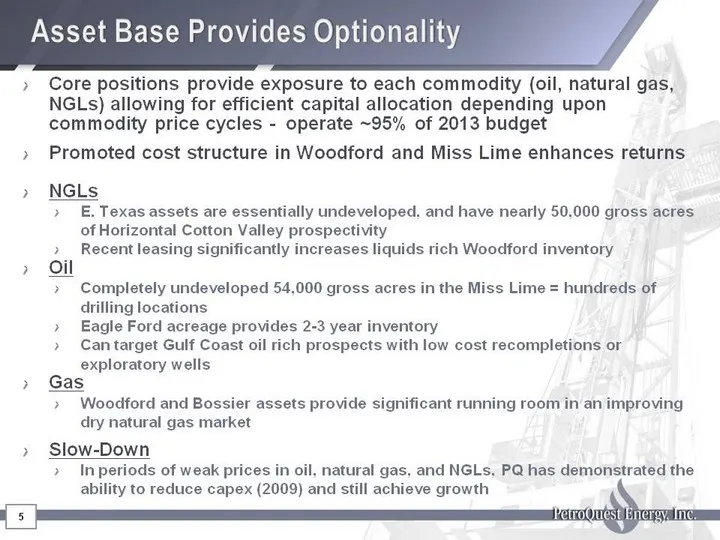
Core positions provide exposure to each commodity (oil, natural gas, NGLs) allowing for efficient capital allocation depending upon commodity price cycles - operate ~95% of 2013 budget Promoted cost structure in Woodford and Miss Lime enhances returns NGLs E. Texas assets are essentially undeveloped
Slide 7: Product Diversification - Gas to Liquids
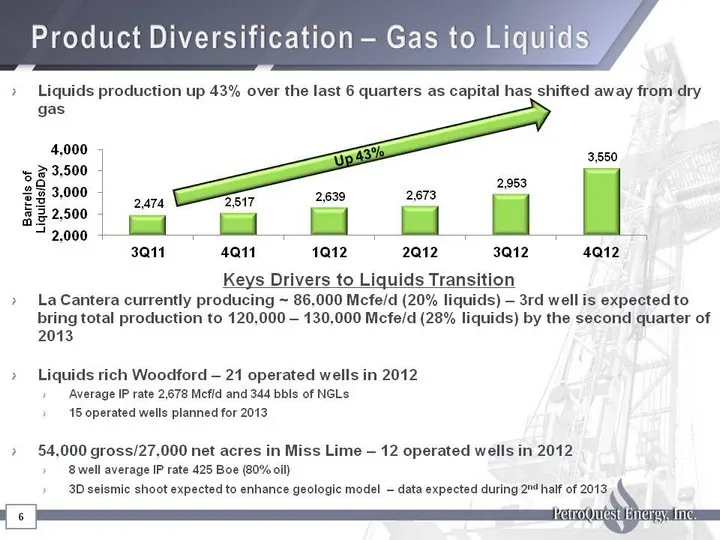
6 Product Diversification - Gas to Liquids Liquids production up 43% over the last 6 quarters as capital has shifted away from dry gas Keys Drivers to Liquids Transition La Cantera currently producing ~ 86,000 Mcfe/d (20% liquids) - 3rd well is expected to bring total production to 120,000 - 130,000
Slide 8: La Cantera High Impact Discovery
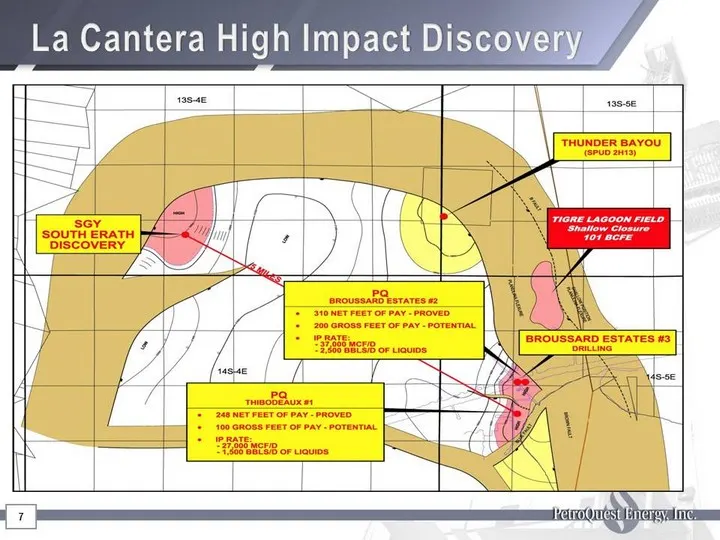
La Cantera High Impact Discovery 7
Slide 9: La Cantera Development
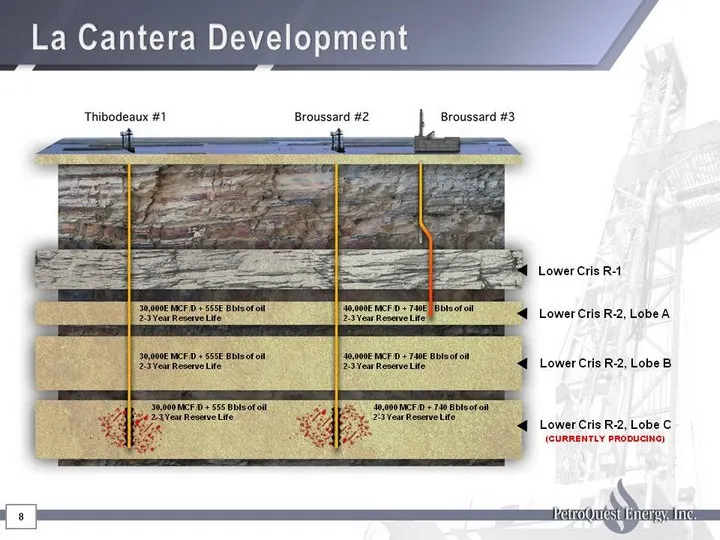
La Cantera Development 8 Lower Cris R-1 Lower Cris R-2, Lobe A Lower Cris R-2, Lobe B Lower Cris R-2, Lobe C (CURRENTLY PRODUCING) 30,000E MCF/D + 555E Bbls of oil 2-3 Year Reserve Life 30,000E MCF/D + 555E Bbls of oil 2-3 Year Reserve Life 30,000 MCF/D + 555 Bbls of oil 2-3 Year Reserve Life 40,000
Slide 10: Gulf Coast Drilling Summary
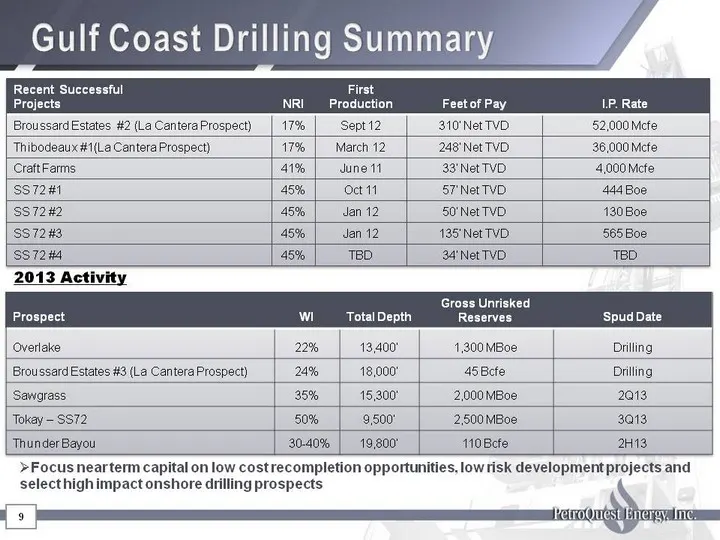
Gulf Coast Drilling Summary Gulf Coast Drilling Summary 9 Focus near term capital on low cost recompletion opportunities, low risk development projects and select high impact onshore drilling prospects Recent Successful Projects NRI First Production Feet of Pay I.P. Rate Broussard Estates #2 (La Can
Slide 11: Encouraging Early Results in Eastern Play Expansion Area
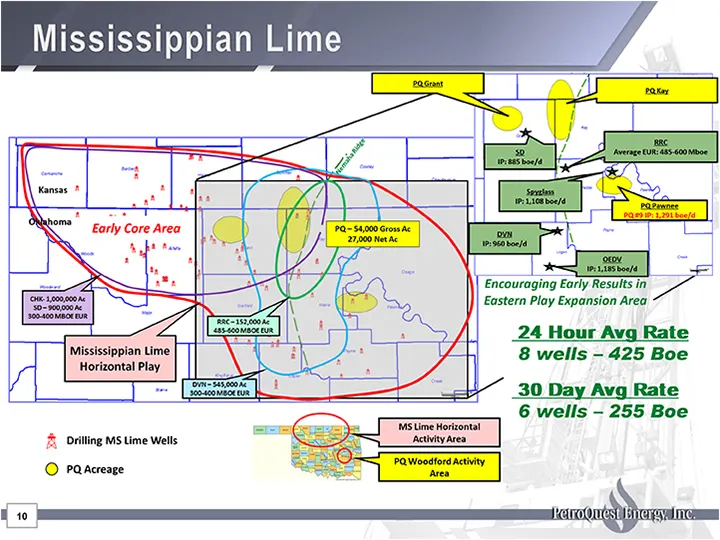
Encouraging Early Results in Eastern Play Expansion Area 10 Drilling MS Lime Wells PQ Acreage Mississippian Lime Early Core Area Kansas Oklahoma PQ Woodford Activity Area MS Lime Horizontal Activity Area 24 Hour Avg Rate 8 wells - 425 Boe 30 Day Avg Rate 6 wells - 255 Boe PQ Kay PQ Pawnee PQ #9 IP:
Slide 12: Woodford Decline Curves - Experience Yields Improvements
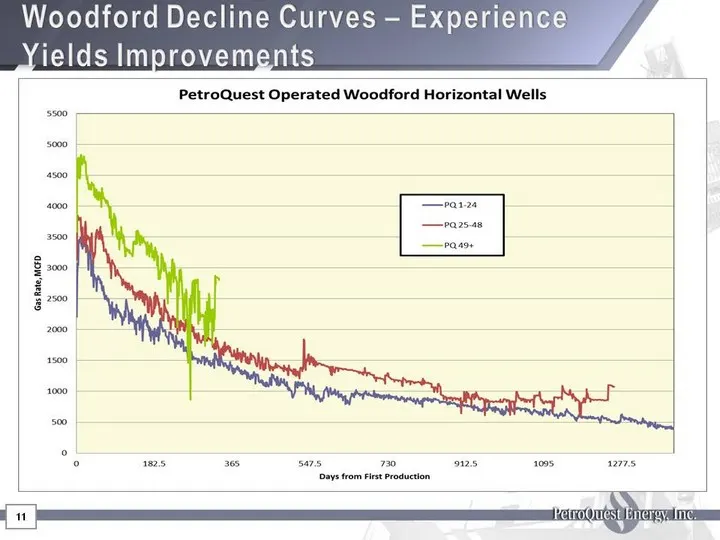
11 Woodford Decline Curves - Experience Yields Improvements
Slide 13: Woodford Shale - Strong Growth Metrics
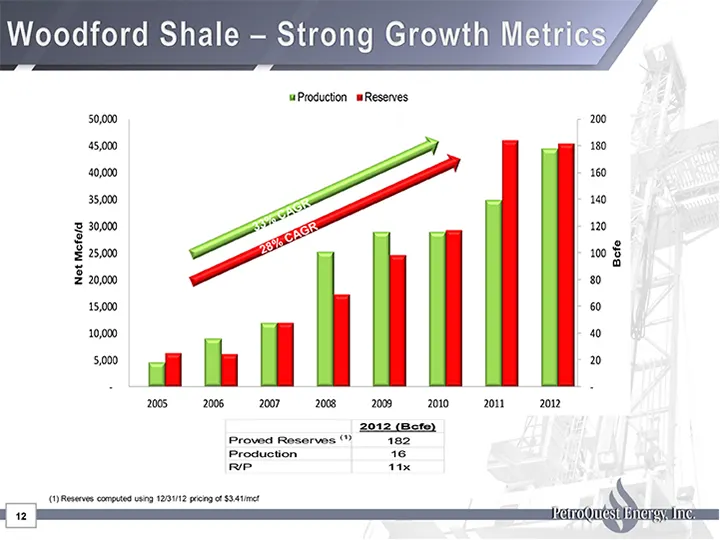
Woodford Shale - Strong Growth Metrics 12 (1) Reserves computed using 12/31/12 pricing of $3.41/mcf 33% CAGR 28% CAGR
Slide 14: Liquids Rich Woodford Program
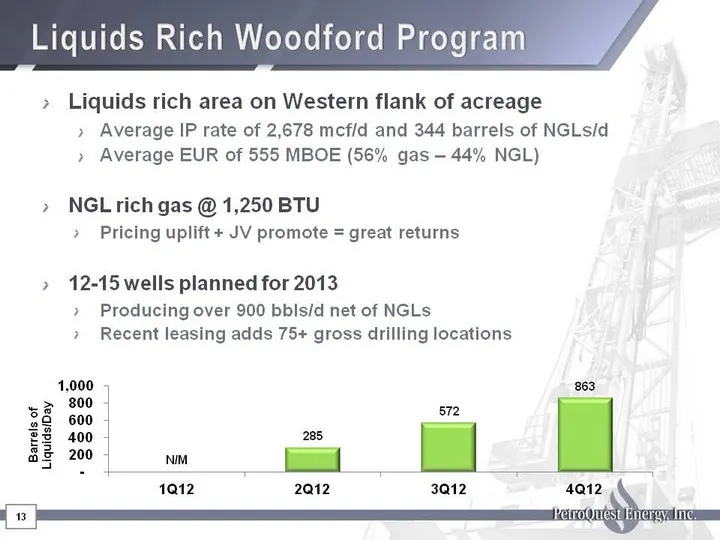
Liquids Rich Woodford Program 13 Liquids rich area on Western flank of acreage Average IP rate of 2,678 mcf/d and 344 barrels of NGLs/d Average EUR of 555 MBOE (56% gas - 44% NGL) NGL rich gas @ 1,250 BTU Pricing uplift + JV promote = great returns 12-15 wells planned for 2013 Producing over 900 bbl
Slide 15: Woodford Liquids Rich - Horizontal Well Economics
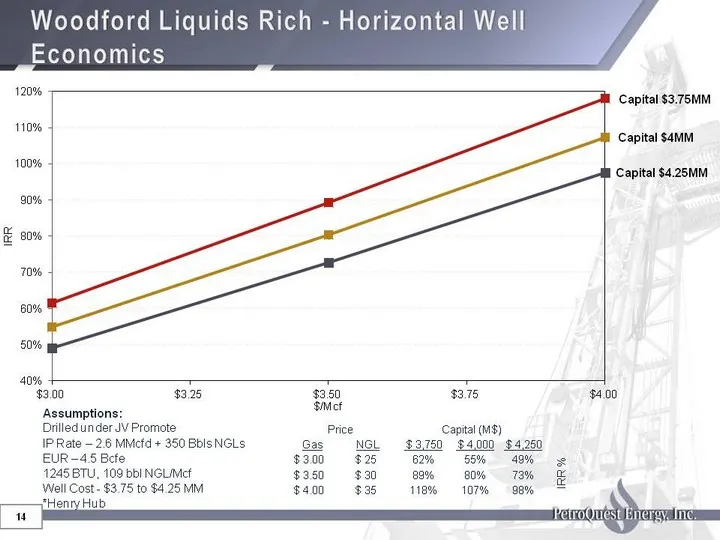
14 Woodford Liquids Rich - Horizontal Well Economics (CHART) Assumptions: Drilled under JV Promote Price Price Capital (M$) Capital (M$) Capital (M$) IP Rate - 2.6 MMcfd + 350 Bbls NGLs Gas NGL $ 3,750 $ 4,000 $ 4,250 EUR - 4.5 Bcfe $ 3.00 $ 25 62% 55% 49% IRR % 1245 BTU, 109 bbl NGL/Mcf $ 3.50 $ 30
Slide 16: Woodford Liquids Rich Gas-Payback Analysis
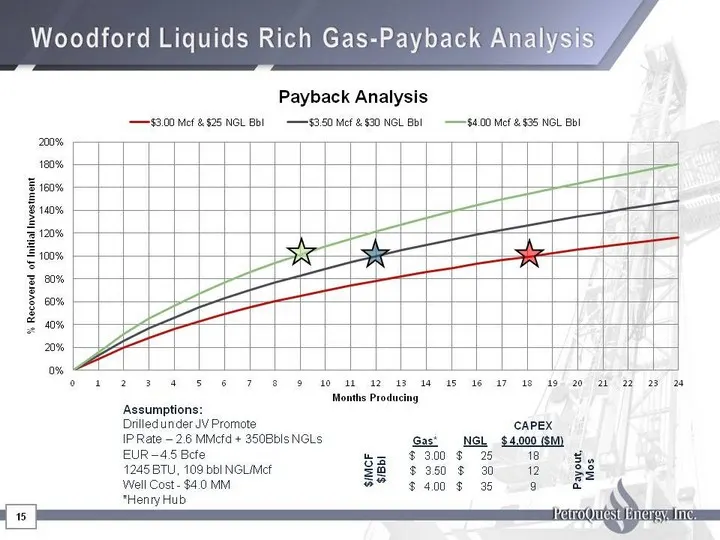
Woodford Liquids Rich Gas-Payback Analysis 15 Assumptions: Drilled under JV Promote CAPEX IP Rate - 2.6 MMcfd + 350Bbls NGLs Gas* NGL $ 4,000 ($M) EUR - 4.5 Bcfe $/MCF $/Bbl $ 3.00 $ 25 18 Payout, Mos 1245 BTU, 109 bbl NGL/Mcf $/MCF $/Bbl $ 3.50 $ 30 12 Payout, Mos Well Cost - $4.0 MM $/MCF $/Bbl $
Slide 17: Woodford JV Transaction Summary
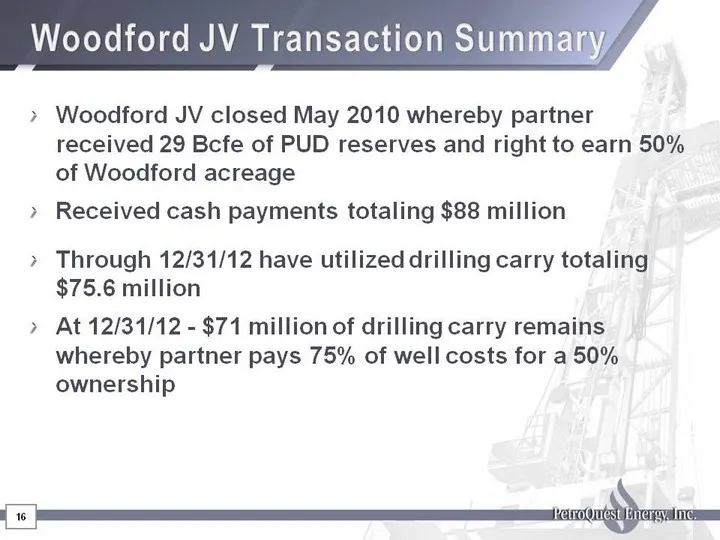
Woodford JV Transaction Summary Woodford JV closed May 2010 whereby partner received 29 Bcfe of PUD reserves and right to earn 50% of Woodford acreage Received cash payments totaling $88 million Through 12/31/12 have utilized drilling carry totaling $75.6 million At 12/31/12 - $71 million of drillin
Slide 18: Liquids Rich Cotton Valley Program
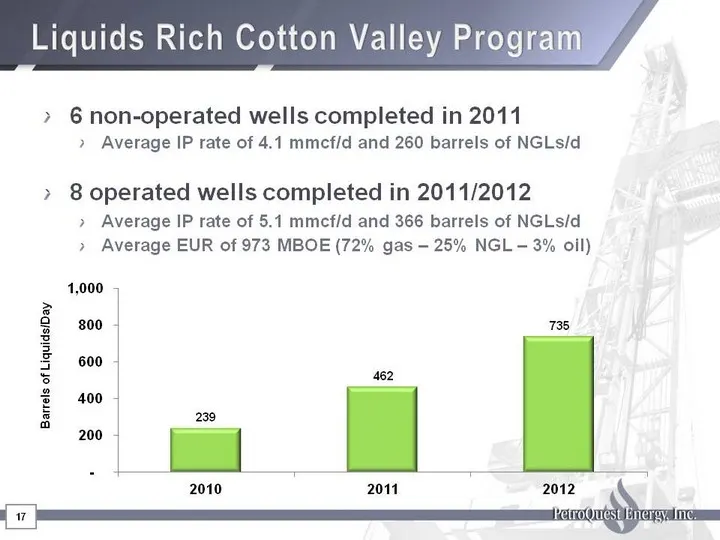
Liquids Rich Cotton Valley Program 17 6 non-operated wells completed in 2011 Average IP rate of 4.1 mmcf/d and 260 barrels of NGLs/d 8 operated wells completed in 2011/2012 Average IP rate of 5.1 mmcf/d and 366 barrels of NGLs/d Average EUR of 973 MBOE (72% gas - 25% NGL - 3% oil) (CHART)
Slide 19: Panola County Cotton Valley Production
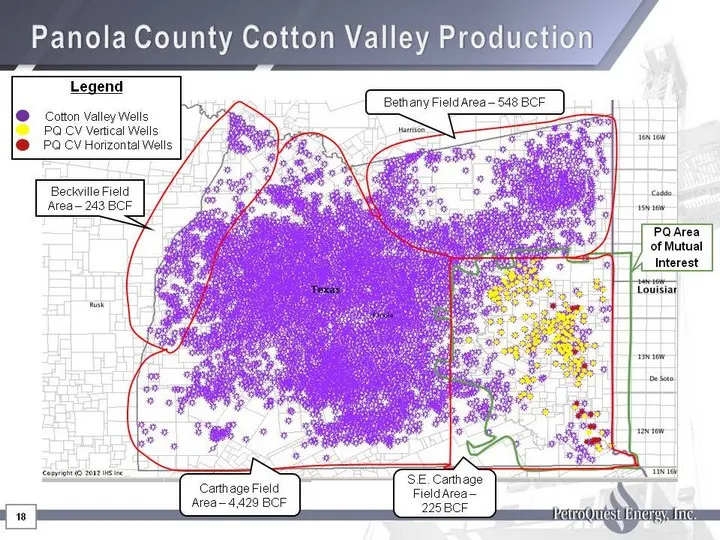
Panola County Cotton Valley Production 18 18 Legend Cotton Valley Wells PQ CV Vertical Wells PQ CV Horizontal Wells PQ Area of Mutual Interest Bethany Field Area - 548 BCF Beckville Field Area - 243 BCF Carthage Field Area - 4,429 BCF S.E. Carthage Field Area - 225 BCF
Slide 20: Strong Balance Sheet and Liquidity
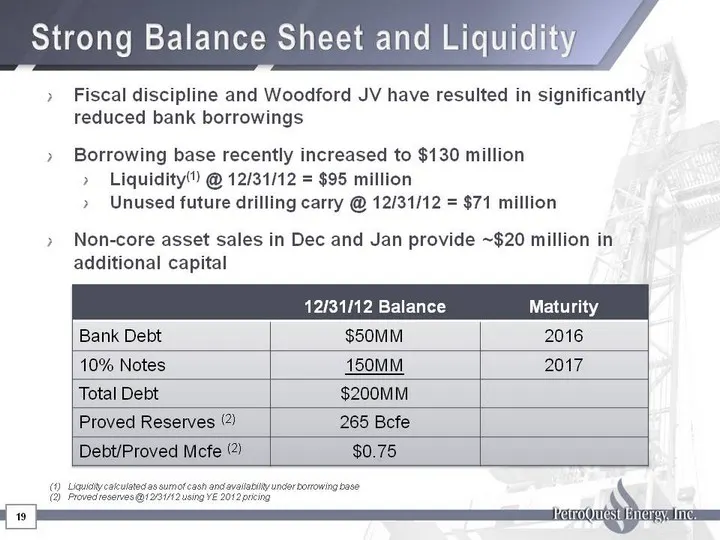
Strong Balance Sheet and Liquidity 19 Fiscal discipline and Woodford JV have resulted in significantly reduced bank borrowings Borrowing base recently increased to $130 million Liquidity(1) @ 12/31/12 = $95 million Unused future drilling carry @ 12/31/12 = $71 million Non-core asset sales in Dec and
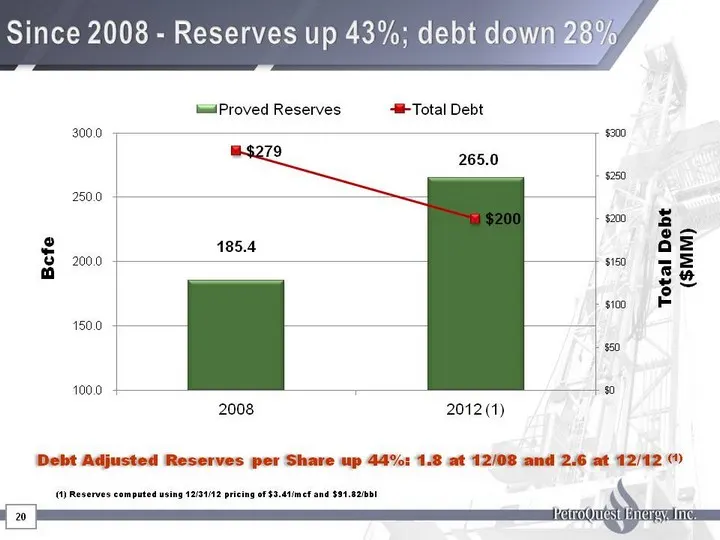
Slide 21: Reserves up 43%; debt down 28% since 2008
(CHART) Since 2008 - Reserves up 43%; debt down 28% 20 Bcfe Total Debt ($MM) 20 Debt Adjusted Reserves per Share up 44%: 1.8 at 12/08 and 2.6 at 12/12 (1) (1) Reserves computed using 12/31/12 pricing of $3.41/mcf and $91.82/bbl
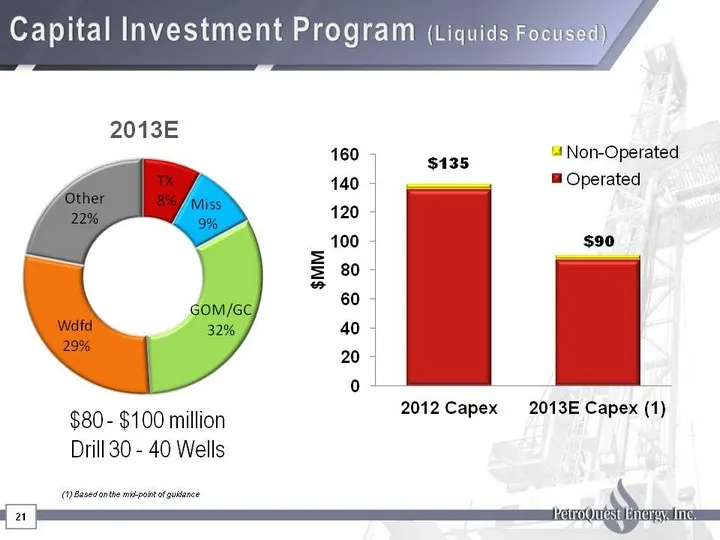
Slide 22: Capital Investment Program (Liquids Focused)
Capital Investment Program (Liquids Focused) 21 2013E $80 - $100 million Drill 30 - 40 Wells (CHART) (1) Based on the mid-point of guidance $135
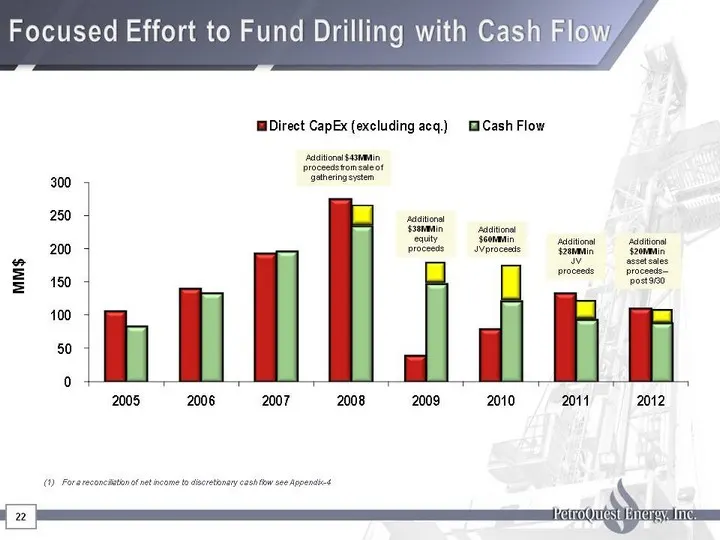
Slide 23: Focused Effort to Fund Drilling with Cash Flow
Focused Effort to Fund Drilling with Cash Flow 22 MM$ Additional $38MM in equity proceeds Additional $60MM in JV proceeds Additional $43MM in proceeds from sale of gathering system 22 For a reconciliation of net income to discretionary cash flow see Appendix-4 Additional $28MM in JV proceeds Additio
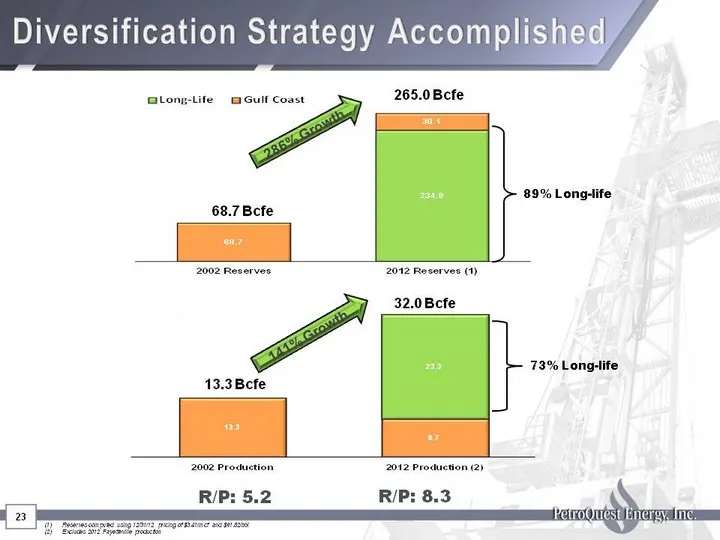
Slide 24: Diversification Strategy Accomplished
Diversification Strategy Accomplished 23 265.0 Bcfe 32.0 Bcfe 89% Long-life 73% Long-life 68.7 Bcfe 13.3 Bcfe 286% Growth 141% Growth 23 R/P: 8.3 R/P: 5.2 Reserves computed using 12/31/12 pricing of $3.41/mcf and $91.82/bbl Excludes 2012 Fayetteville production
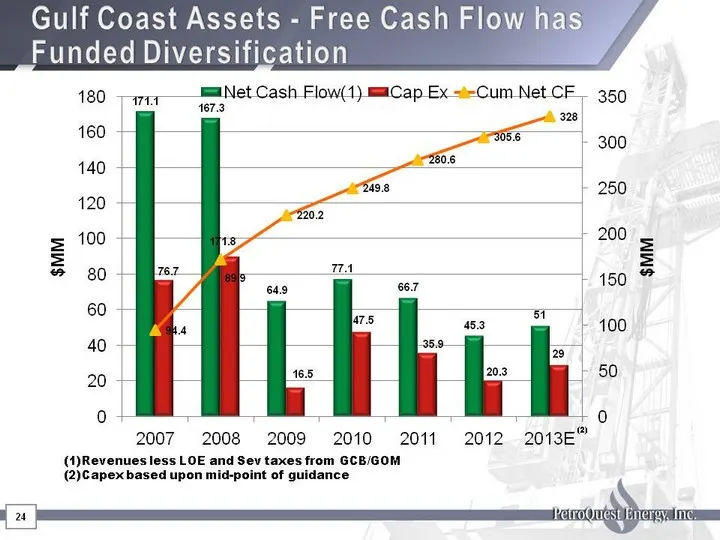
Slide 25: Gulf Coast Assets - Free Cash Flow has Funded Diversification
Gulf Coast Assets - Free Cash Flow has Funded Diversification Funded Diversification Funded Diversification 24 Revenues less LOE and Sev taxes from GCB/GOM Capex based upon mid-point of guidance (2)
Slide 26: Closing Summary
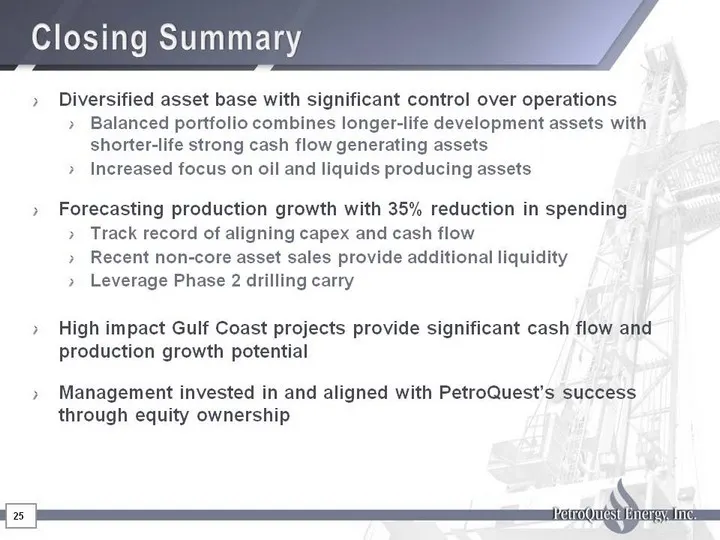
Closing Summary Diversified asset base with significant control over operations Balanced portfolio combines longer-life development assets with shorter-life strong cash flow generating assets Increased focus on oil and liquids producing assets Forecasting production growth with 35% reduction in spen
Slide 27: Appendix
26 Appendix
Slide 28: Hedging Positions
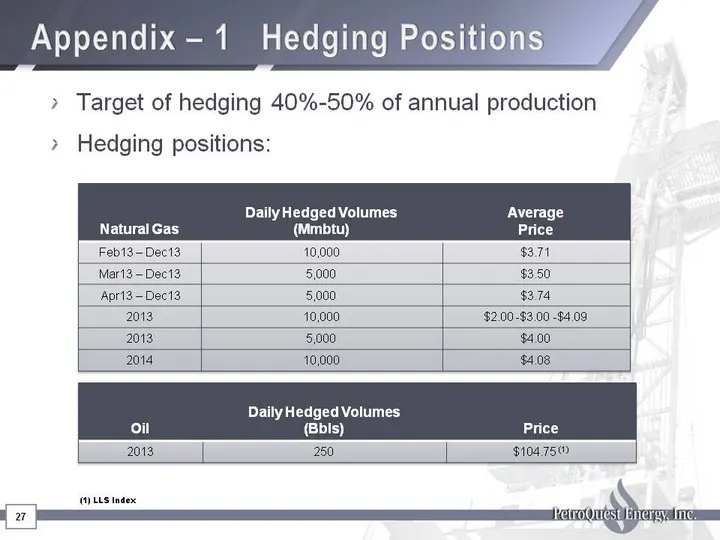
Target of hedging 40%-50% of annual production Hedging positions: 27 Natural Gas Daily Hedged Volumes (Mmbtu) Average Price Feb13 - Dec13 10,000 $3.71 Mar13 - Dec13 5,000 $3.50 Apr13 - Dec13 5,000 $3.74 2013 10,000 $2.00 -$3.00 -$4.09 2013 5,000 $4.00 2014 10,000 $4.08 Oil Daily Hedged Volumes (Bbls
Slide 29: Comparative Credit Metrics
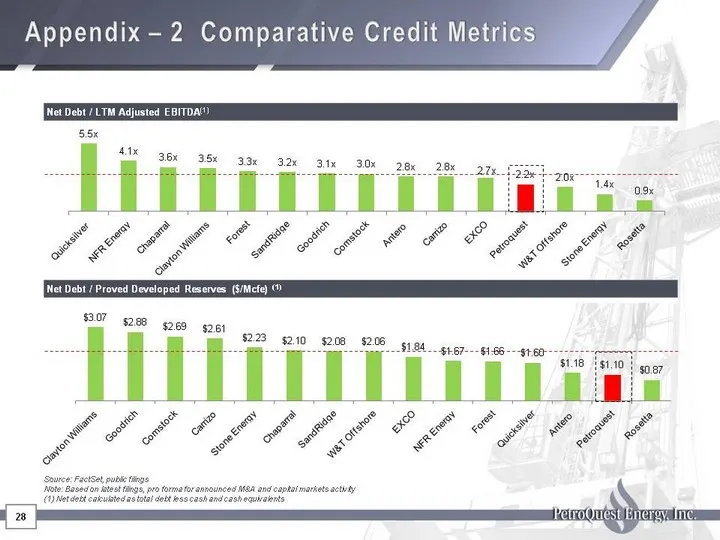
28 Appendix - 2 Comparative Credit Metrics Net Debt / LTM Adjusted EBITDA(1) Source: FactSet, public filings Note: Based on latest filings, pro forma for announced M&A and capital markets activity (1) Net debt calculated as total debt less cash and cash equivalents Net Debt / Proved Developed Reserv
Slide 30: Adjusted EBITDA Definition
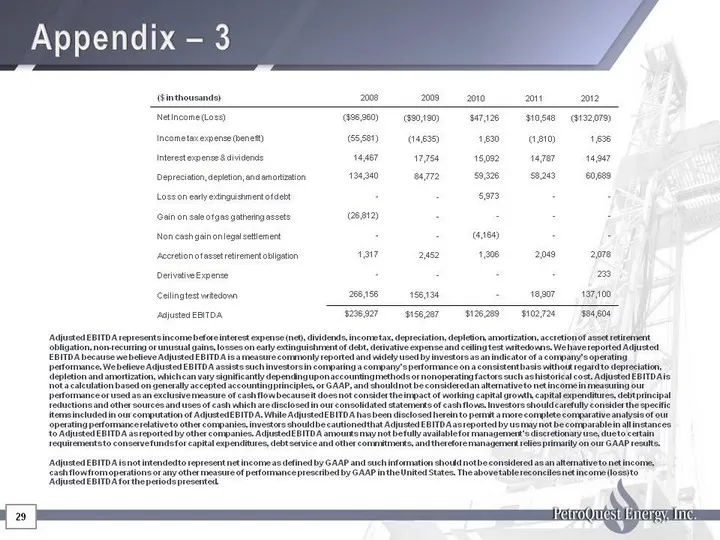
29 Appendix - 3 Adjusted EBITDA represents income before interest expense (net), dividends, income tax, depreciation, depletion, amortization, accretion of asset retirement obligation, non-recurring or unusual gains, losses on early extinguishment of debt, derivative expense and ceiling test writedo
Slide 31: Net Income to Discretionary Cash Flow Reconciliation
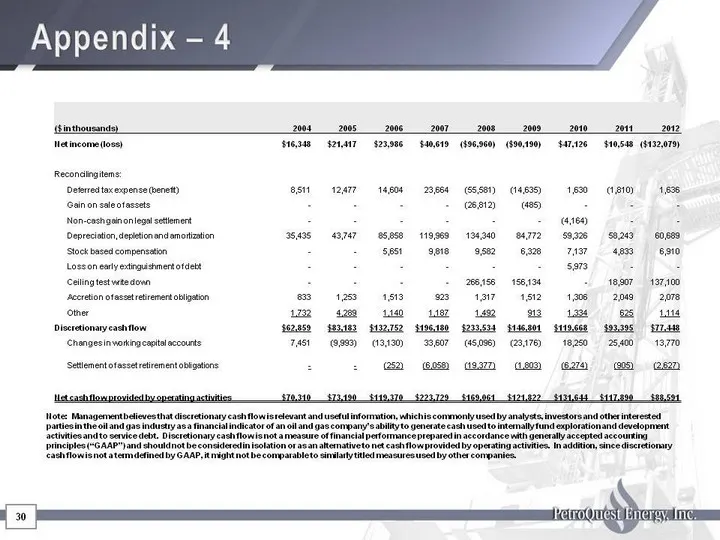
30 Appendix - 4 ($ in thousands) 2004 2005 2006 2007 2008 2009 2010 2011 2012 Net income (loss) $16,348 $21,417 $23,986 $40,619 ($96,960) ($90,190) $47,126 $10,548 ($132,079) Reconciling items: Deferred tax expense (benefit) 8,511 12,477 14,604 23,664 (55,581) (14,635) 1,630 (1,810) 1,636 Gain on sa
Slide 32: Horizontal Cotton Valley
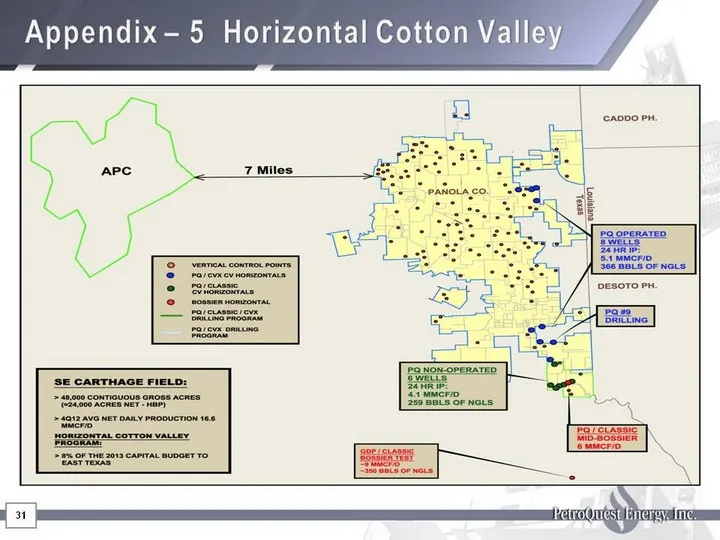
31 Appendix - 5 Horizontal Cotton Valley
Slide 33: PQ Woodford Performance
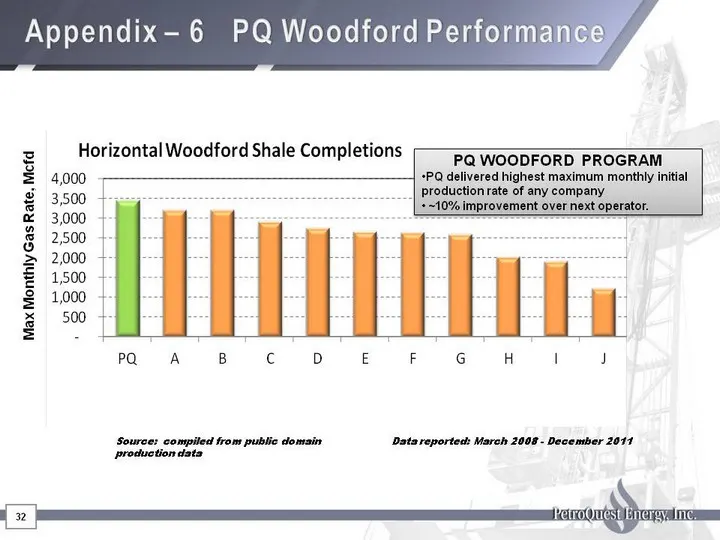
Appendix - 6 PQ Woodford Performance 32 Source: compiled from public domain production data Data reported: March 2008 - December 2011 PQ WOODFORD PROGRAM PQ delivered highest maximum monthly initial production rate of any company ~10% improvement over next operator. Max Monthly Gas Rate, Mcfd 32
Slide 34: Woodford Position
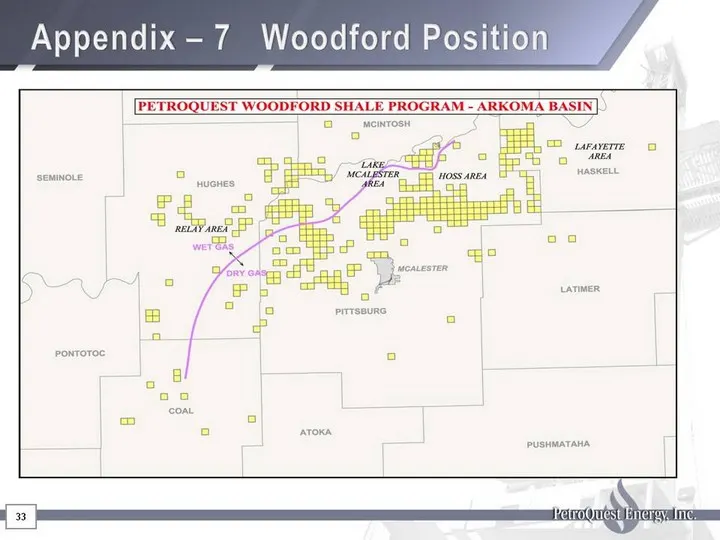
Appendix - 7 Woodford Position 33
Slide 35: Eagle Ford Position
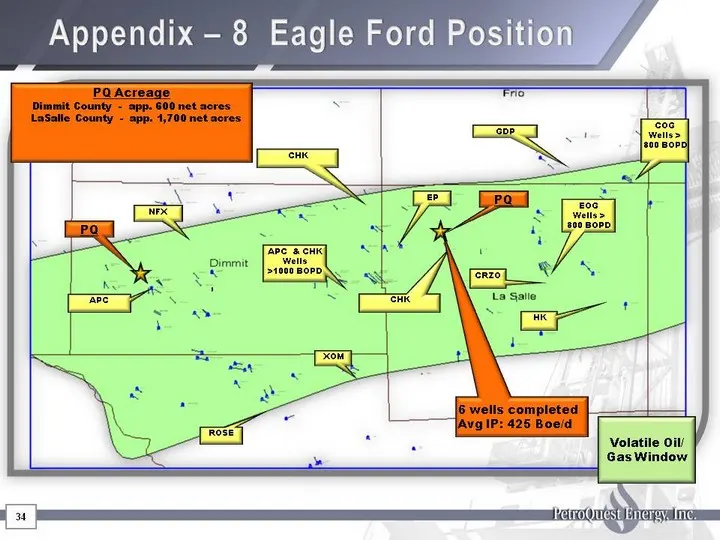
APC NFX EOG Wells > 800 BOPD COG Wells > 800 BOPD EP ROSE CRZO XOM CHK GDP PQ Acreage Dimmit County - app. 600 net acres LaSalle County - app. 1,700 net acres Volatile Oil/ Gas Window Appendix - 8 Eagle Ford Position HK APC & CHK Wells >1000 BOPD 34 PQ PQ CHK 6 wells completed Avg IP: 425 Boe/d
Slide 36: Niobrara Position
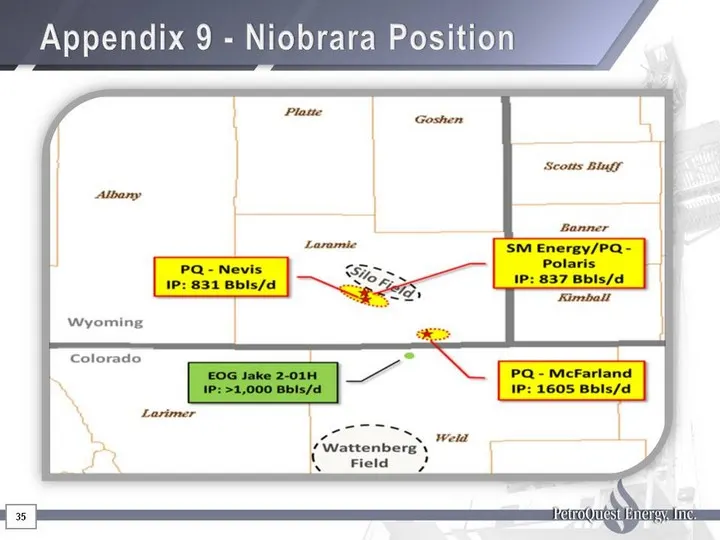
35 Appendix 9 - Niobrara Position
Slide 37: Contact Information
400 East Kaliste Saloom Road, Suite 6000 Lafayette, Louisiana 70508 Phone: (337) 232-7028 Fax: (337) 232-0044 www.petroquest.com NYSE: PQ
Source: SEC EDGAR · 8-K filed Mar 19, 2013
More decks from PetroQuest Energy Inc
 Corporate Update (June 2019)15 slides · Jun 19, 2019
 Investor Presentation (November 2018)16 slides · Nov 7, 2018
 Investor Presentation (July 2018)29 slides · Jul 10, 2018
 Investor Presentation (December 2017)6 slides · Dec 20, 2017
 Investor Presentation (January 2017)28 slides · Jan 9, 2017
 Investor Presentation (April 2016)29 slides · Apr 5, 2016