Dye & Durham Ltd. · TSX:DND
Dye & Durham — Q4 2022 Earnings Presentation
11 slides from Dye & Durham's earnings presentation, Sep 26, 2022

Slide 1: 2022 Fourth Quarter & Year End Quarterly Results Presentation
2022 FOURTH QUARTER & YEAR END QUARTERLY RESULTS PRESENTATION September 26, 2022 When being certain is everything dyedurham.com
Slide 2: Disclaimer
DISCLAIMER This presentation has been prepared for informational purposes only. By accepting delivery of this presentation and/or attending the meeting where this presentation is made, you agree: (1) to keep strictly confidential the contents of this presentation and such other information and not t
Slide 3: Dye & Durham At-A-Glance
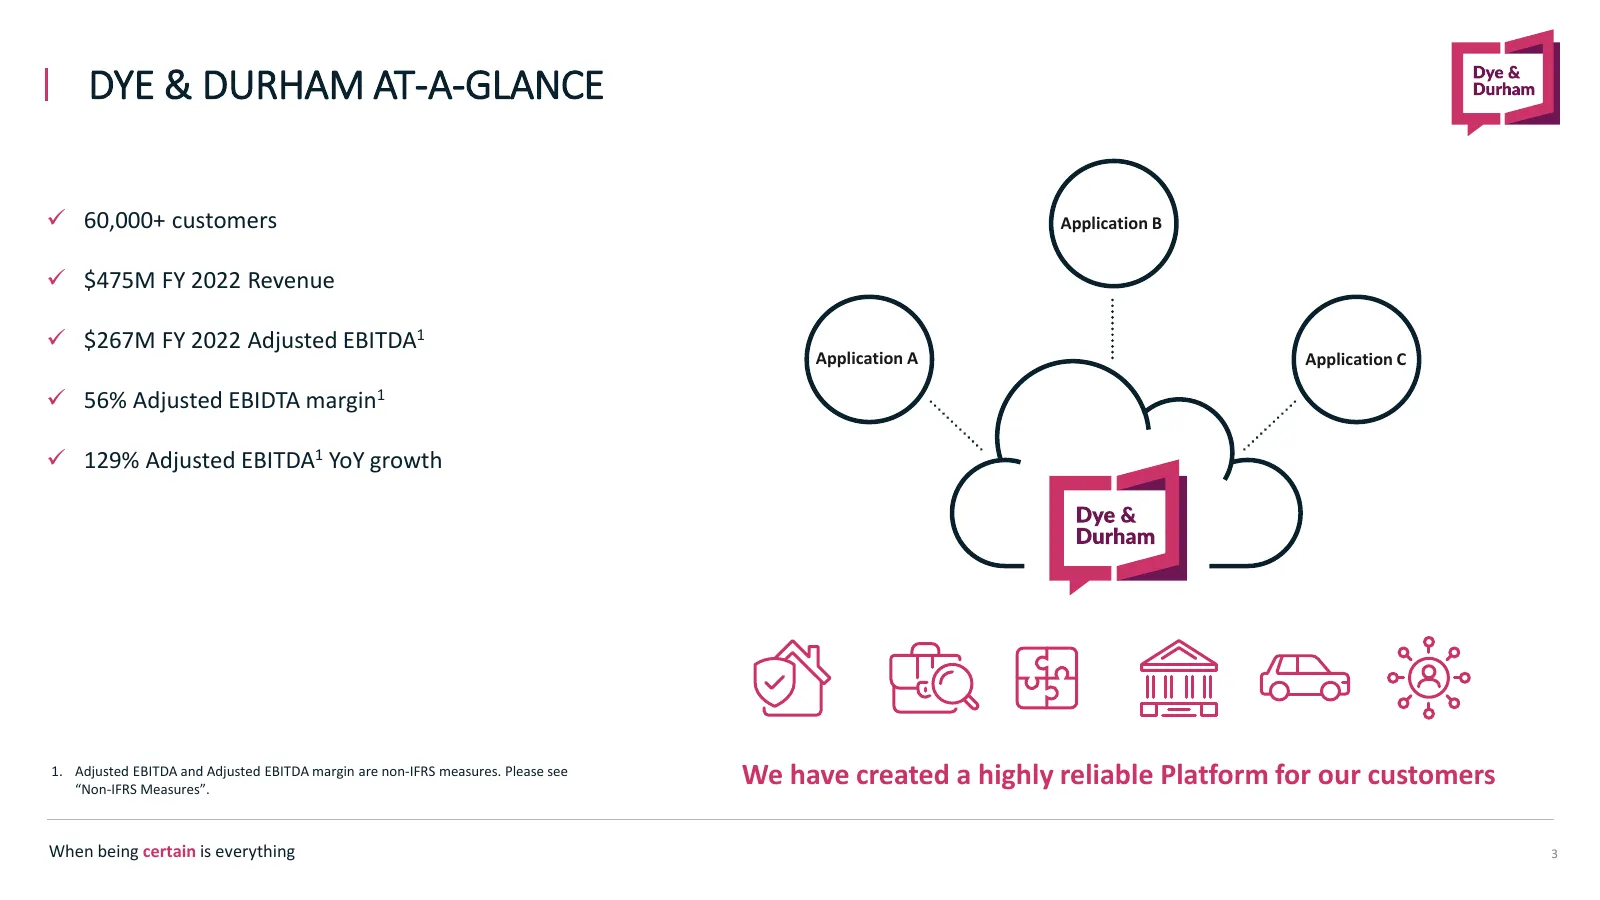
DYE & DURHAM AT-A-GLANCE 60,000+ customers Application B $475M FY 2022 Revenue $267M FY 2022 Adjusted EBITDA1 Application A Application C 56% Adjusted EBIDTA margin1 129% Adjusted EBITDA1 YoY growth 1. Adjusted EBITDA and Adjusted EBITDA margin are non-IFRS measures. Please see “Non-IFRS M
Slide 4: Historical Quarterly Performance
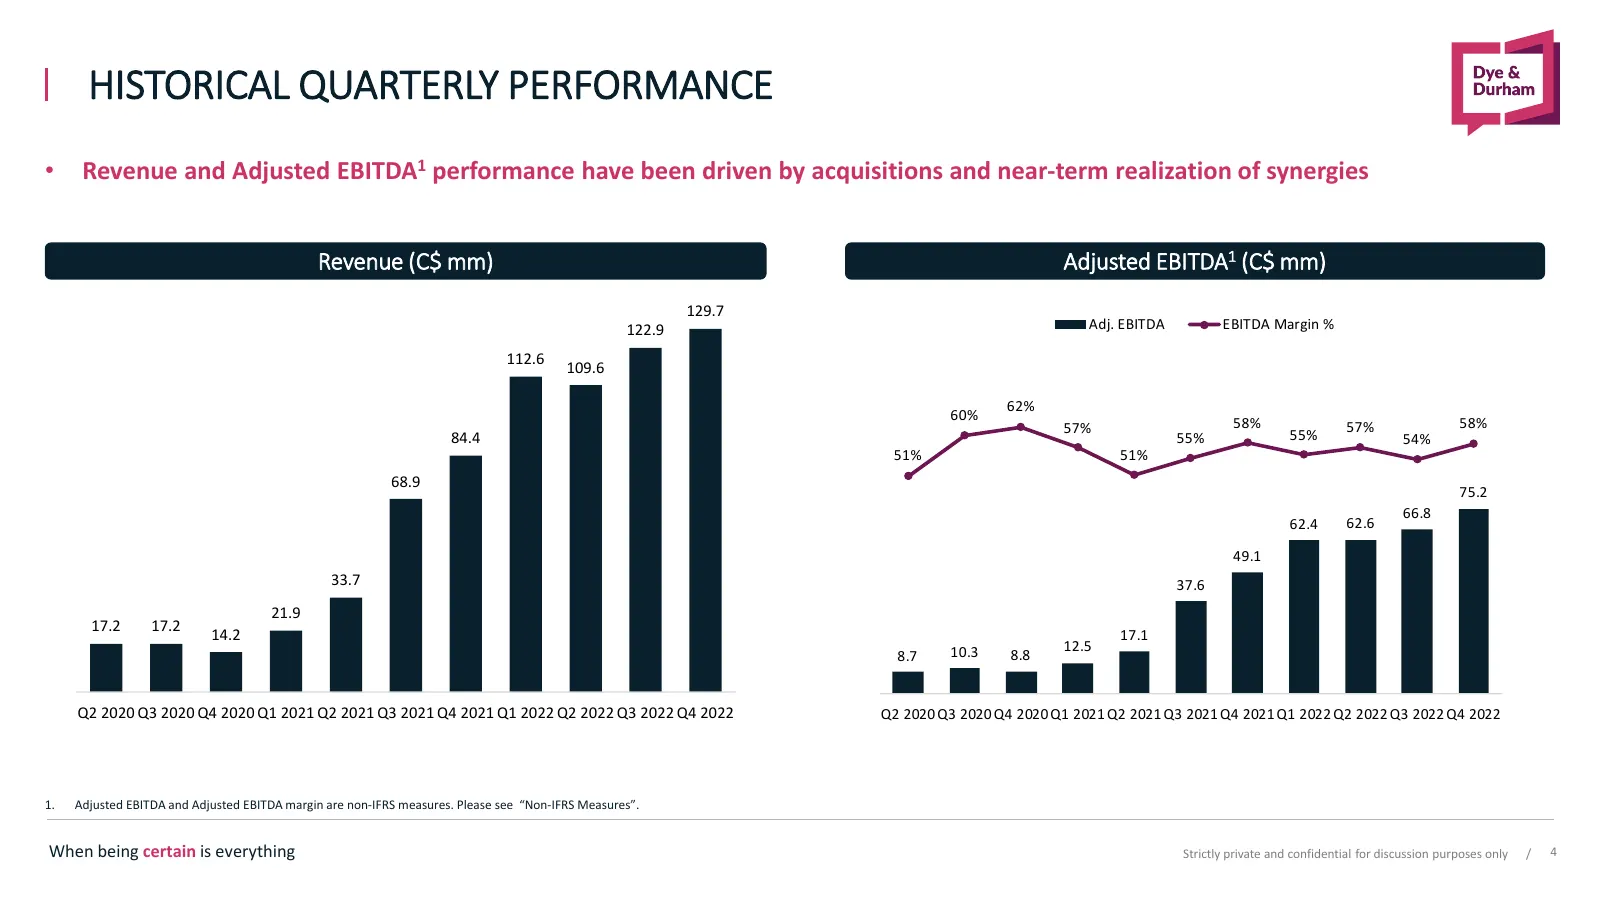
HISTORICAL QUARTERLY PERFORMANCE • Revenue and Adjusted EBITDA1 performance have been driven by acquisitions and near-term realization of synergies Revenue (C$ mm) Adjusted EBITDA1 (C$ mm) 129.7 122.9 Adj. EBITDA EBITDA Margin % 112.6 109.6 62% 60% 58% 57% 57% 58% 84.4 55% 55% 54% 51% 51% 68.9 75.2
Slide 5: Financial Overview – FY 2022 Results
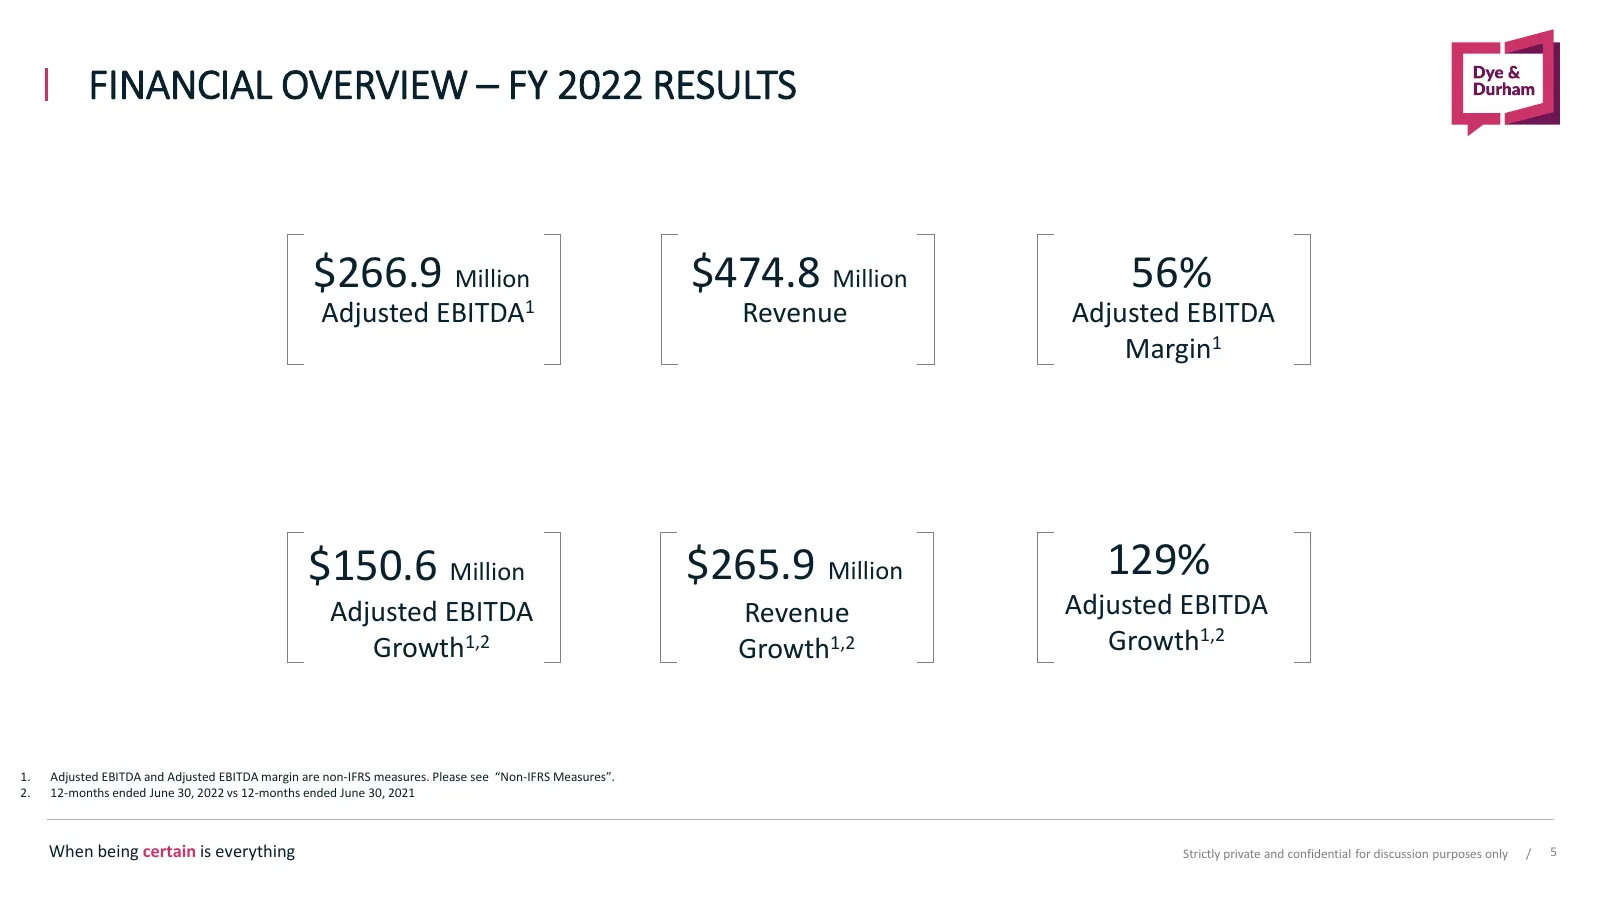
FINANCIAL OVERVIEW – FY 2022 RESULTS $266.9 Million $474.8 Million 56% Adjusted EBITDA1 Revenue Adjusted EBITDA Margin1 $150.6 Million $265.9 Million 129% Adjusted EBITDA Revenue Adjusted EBITDA Growth1,2 Growth1,2 Growth1,2 1. Adjusted EBITDA and Adjusted EBITDA margin are non-IFRS measures. Please
Slide 6: Financial Overview – Q4 FY 2022 Results
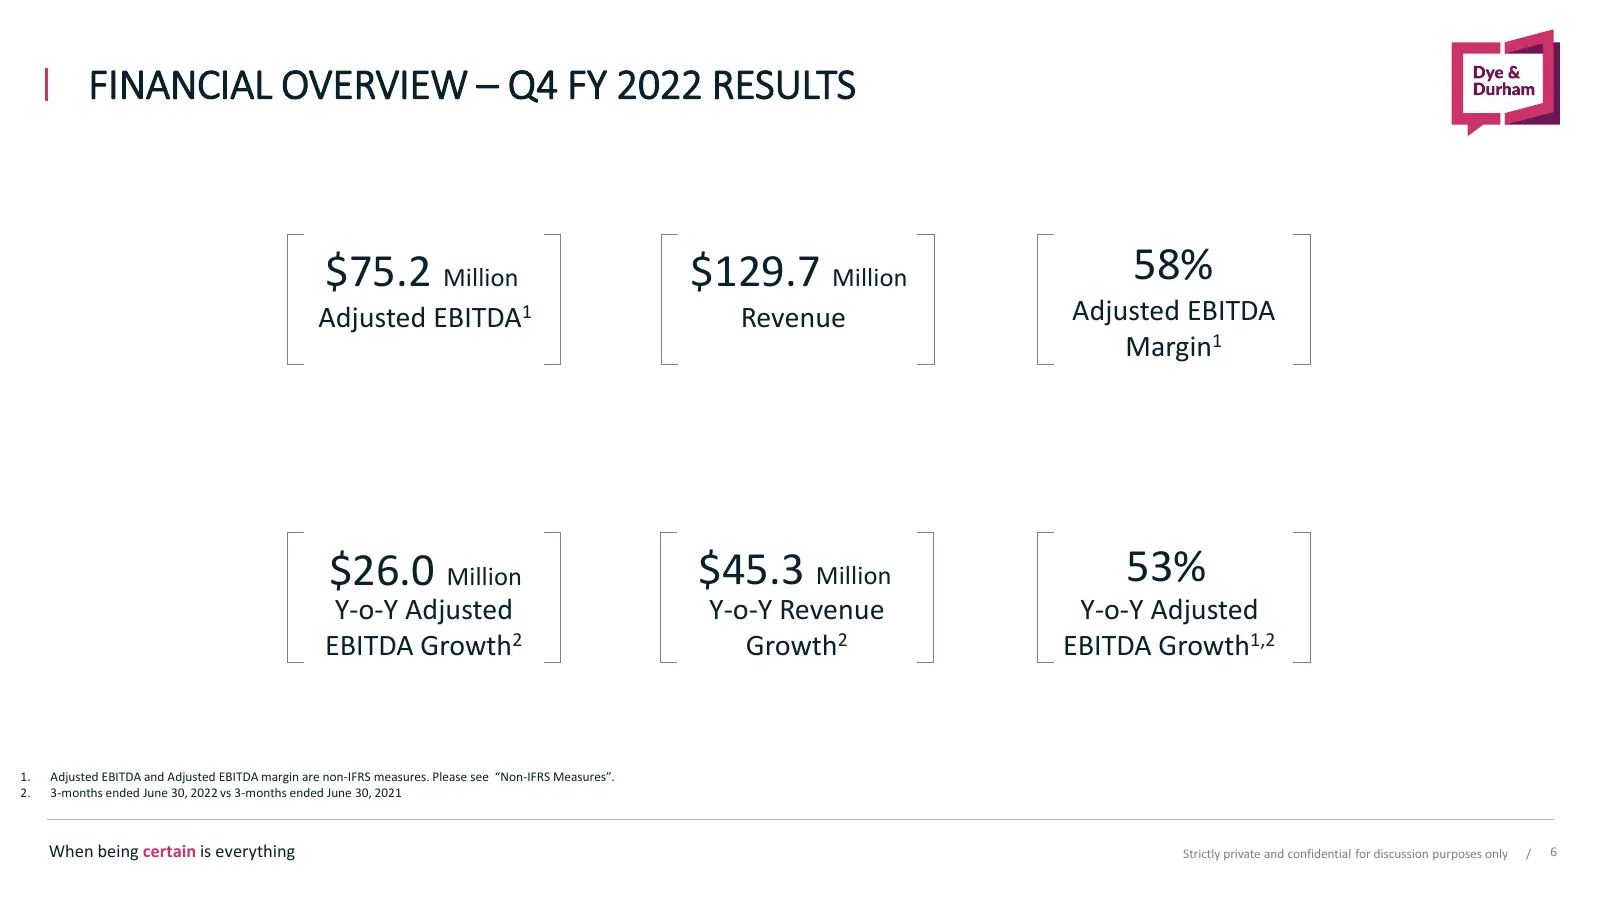
FINANCIAL OVERVIEW – Q4 FY 2022 RESULTS $75.2 Million $129.7 Million 58% Adjusted EBITDA1 Revenue Adjusted EBITDA Margin1 $26.0 Million $45.3 Million 53% Y-o-Y Adjusted Y-o-Y Revenue Y-o-Y Adjusted EBITDA Growth2 Growth2 EBITDA Growth1,2 1. Adjusted EBITDA and Adjusted EBITDA margin are non-IFRS mea
Slide 7: Mission Critical Software for the Legal and Business Community
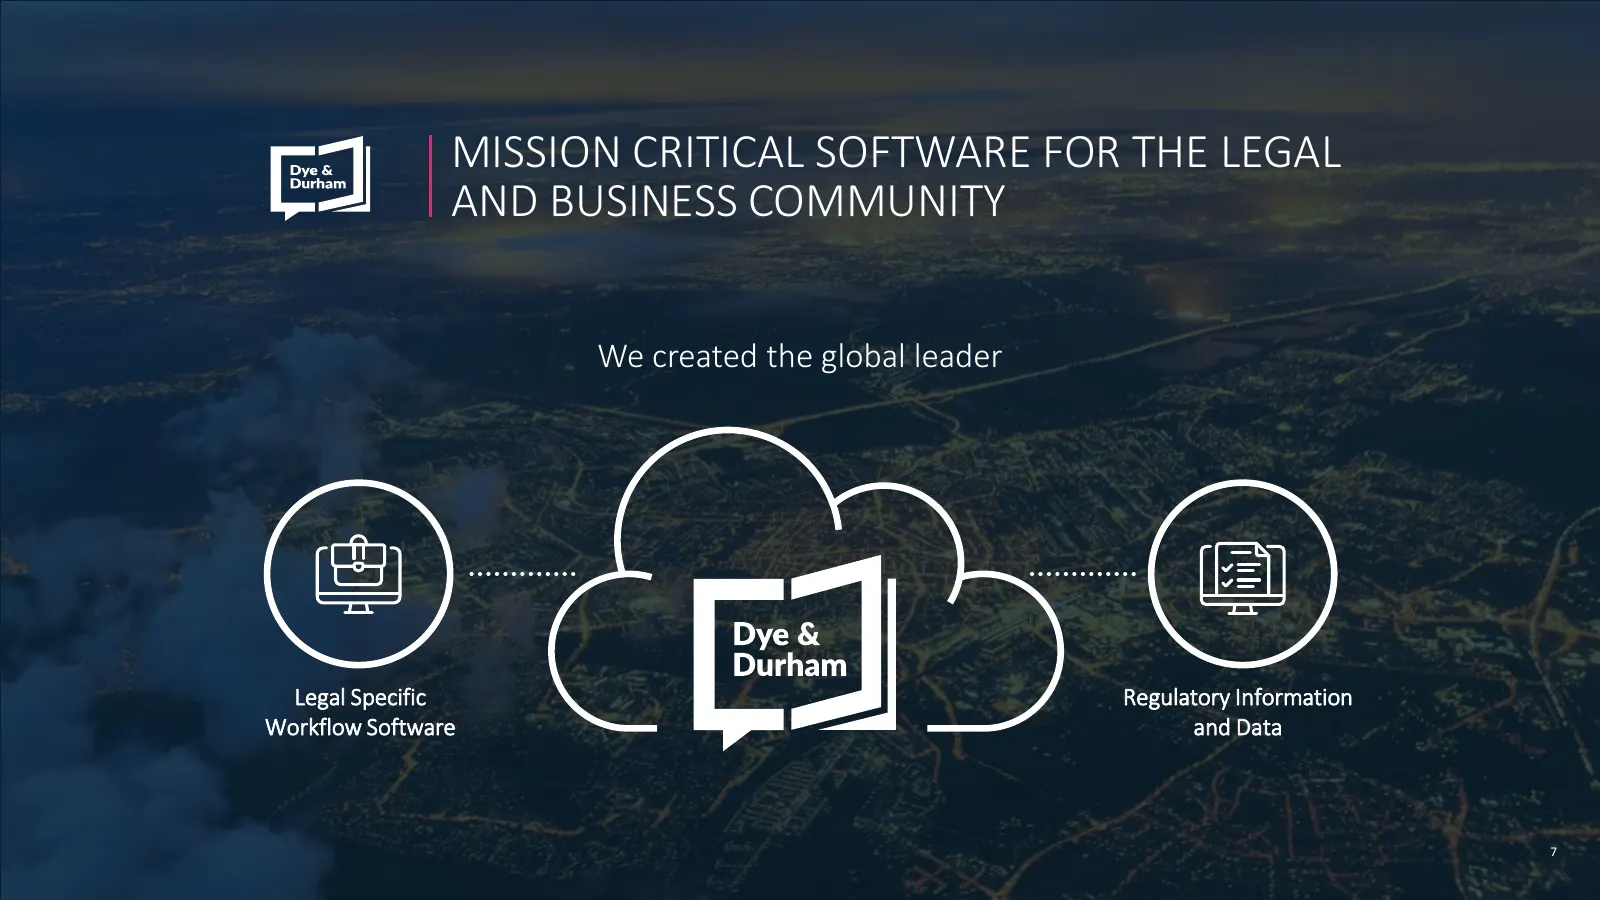
MISSION CRITICAL SOFTWARE FOR THE LEGAL AND BUSINESS COMMUNITY We created the global leader Legal Specific Regulatory Information Workflow Software and Data When being certain is everything 7
Slide 8: Track Record of Successful Capital Allocation
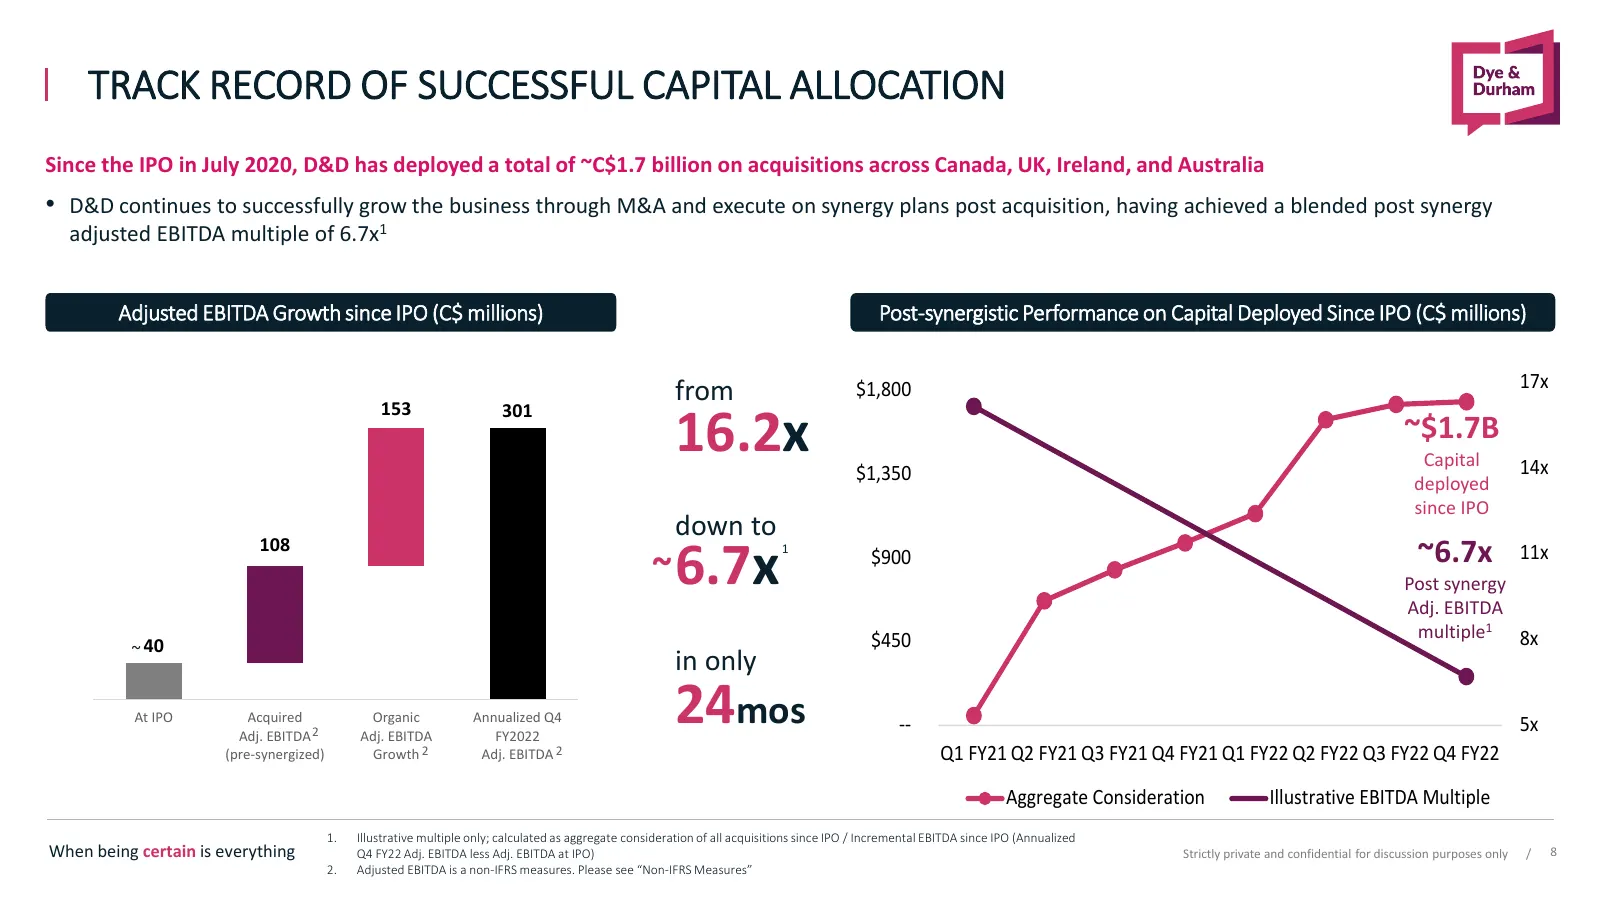
TRACK RECORD OF SUCCESSFUL CAPITAL ALLOCATION Since the IPO in July 2020, D&D has deployed a total of ~C$1.7 billion on acquisitions across Canada, UK, Ireland, and Australia • D&D continues to successfully grow the business through M&A and execute on synergy plans post acquisition, having achieved
Slide 9: Balance Sheet Overview
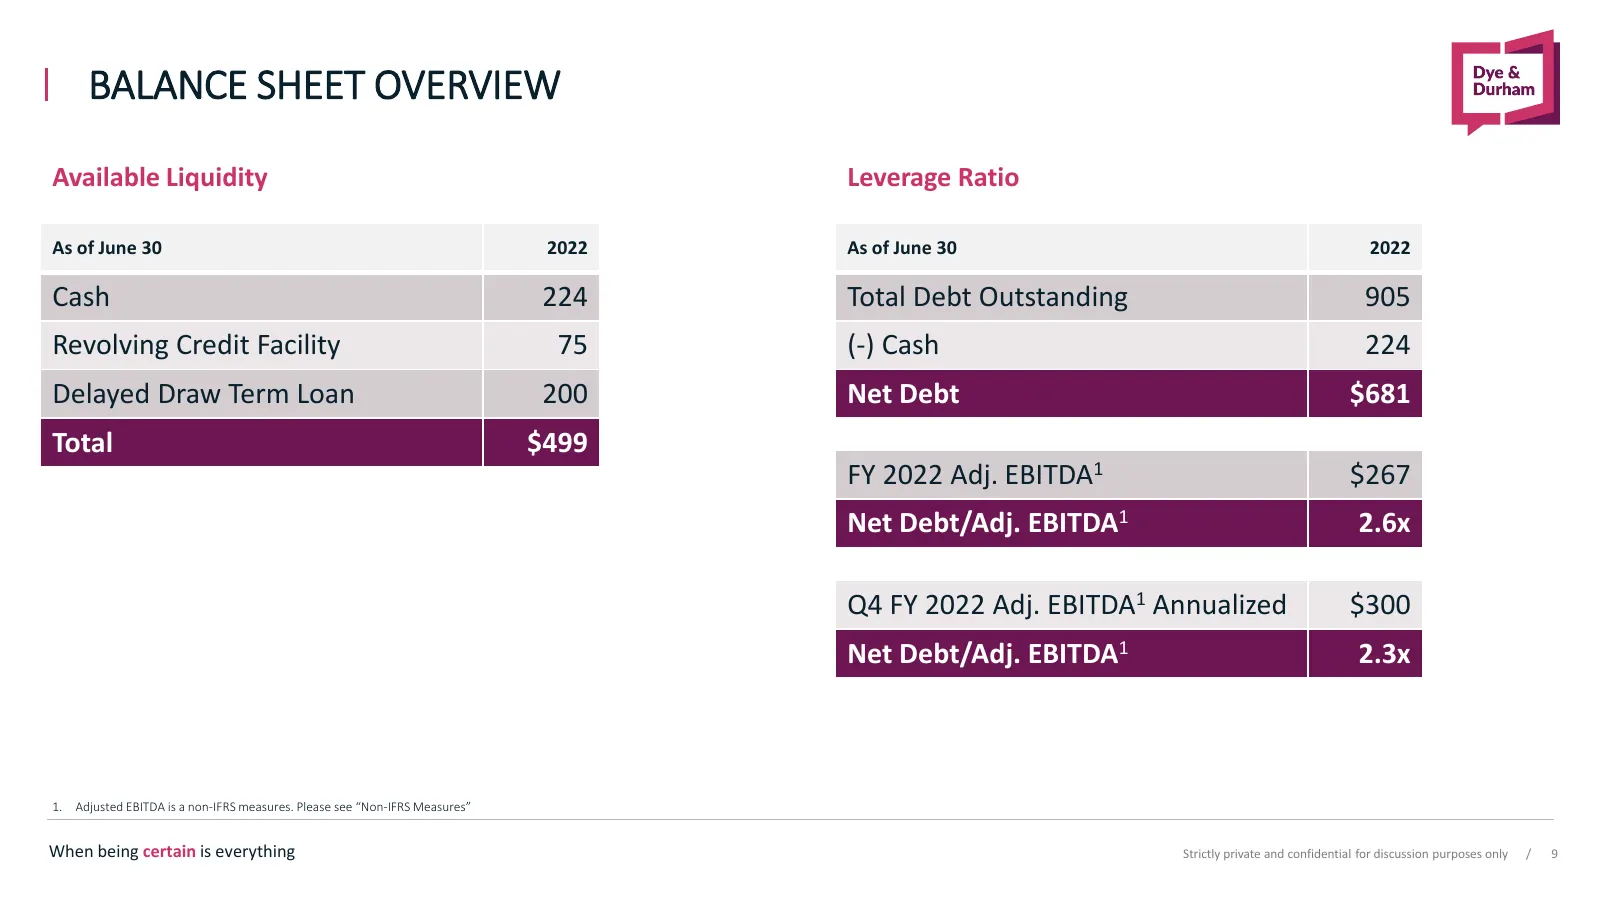
BALANCE SHEET OVERVIEW Available Liquidity Leverage Ratio As of June 30 2022 As of June 30 2022 Cash 224 Total Debt Outstanding 905 Revolving Credit Facility 75 (-) Cash 224 Delayed Draw Term Loan 200 Net Debt $681 Total $499 FY 2022 Adj. EBITDA1 $267 Net Debt/Adj. EBITDA1 2.6x Q4 FY 2022 Adj. EBITD

Slide 10: When being certain is everything
When being certain is everything 10
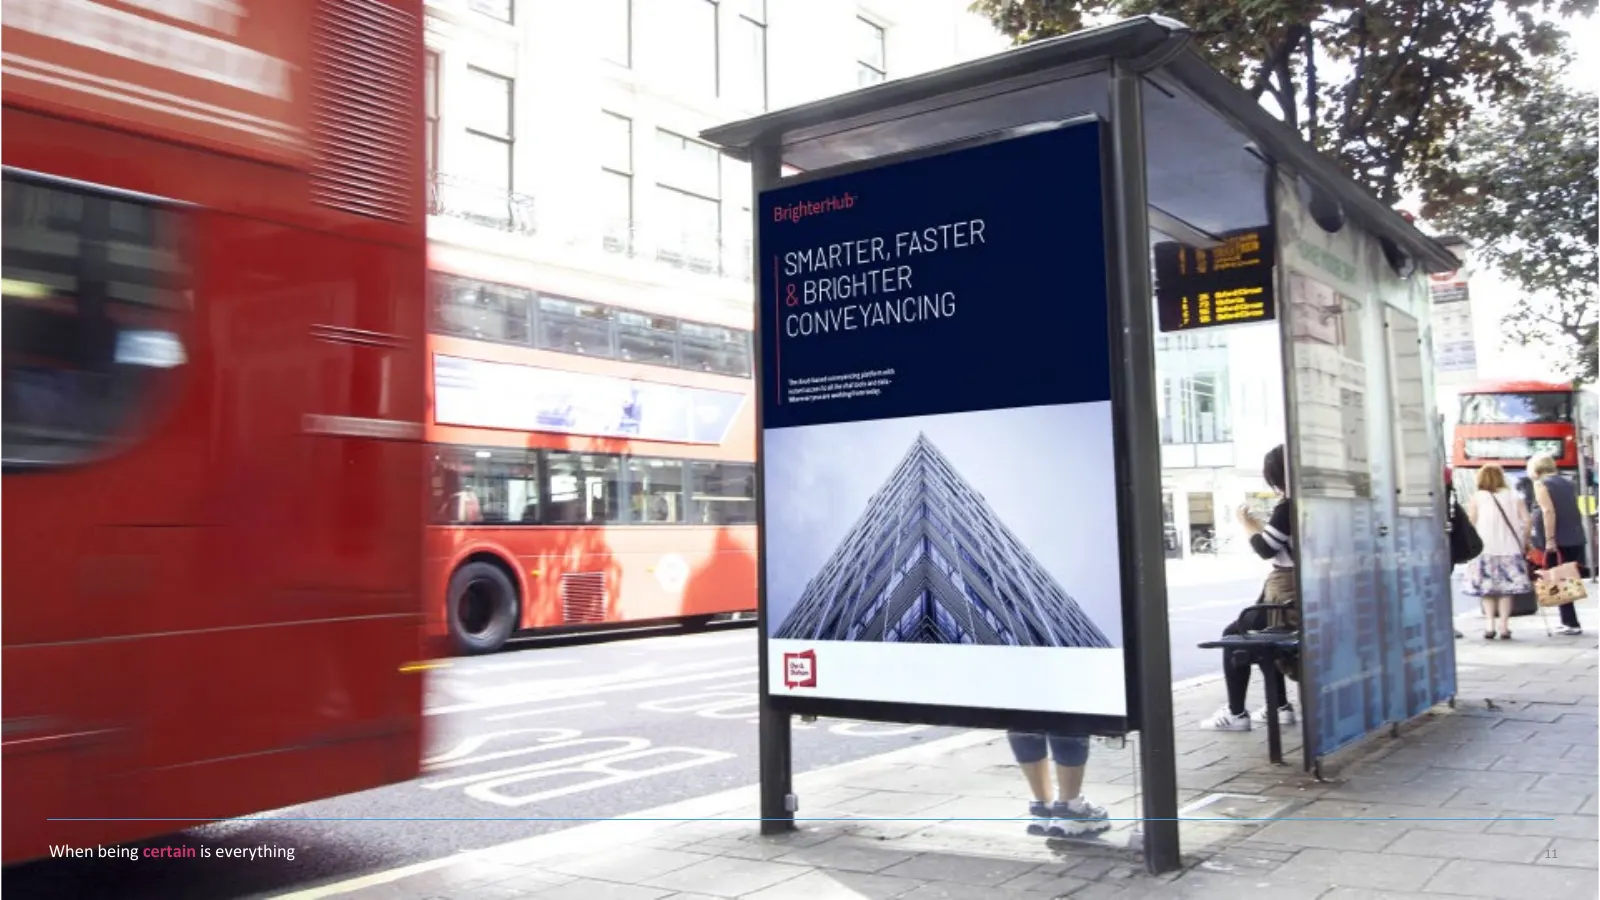
Slide 11: When being certain is everything
When being certain is everything 11
Source: Internet Archive copy of dyedurham.com
More decks from Dye & Durham Ltd.
 Q4 2026 Earnings Presentation11 slides · Sep 30, 2026
 Q3 FY2026 Earnings Presentation12 slides · May 19, 2026
 Q2 2026 Earnings Presentation18 slides · Feb 17, 2026
 Q3 2025 Earnings Presentation17 slides · May 13, 2025
 Q2 FY2025 Earnings Presentation15 slides · Feb 13, 2025
 Proxy Contest (December 2024)85 slides · Dec 10, 2024