Superior Drilling Products Inc
Superior Drilling Products — Q1 2018 Earnings Presentation
19 slides from Superior Drilling Products's earnings presentation, May 10, 2018
Slide 1: First Quarter 2018 Financial Results Conference Call
First Quarter 2018 Financial Results Conference Call May 10, 2018 NYSE American: SDPI © 2018 Superior Drilling Products
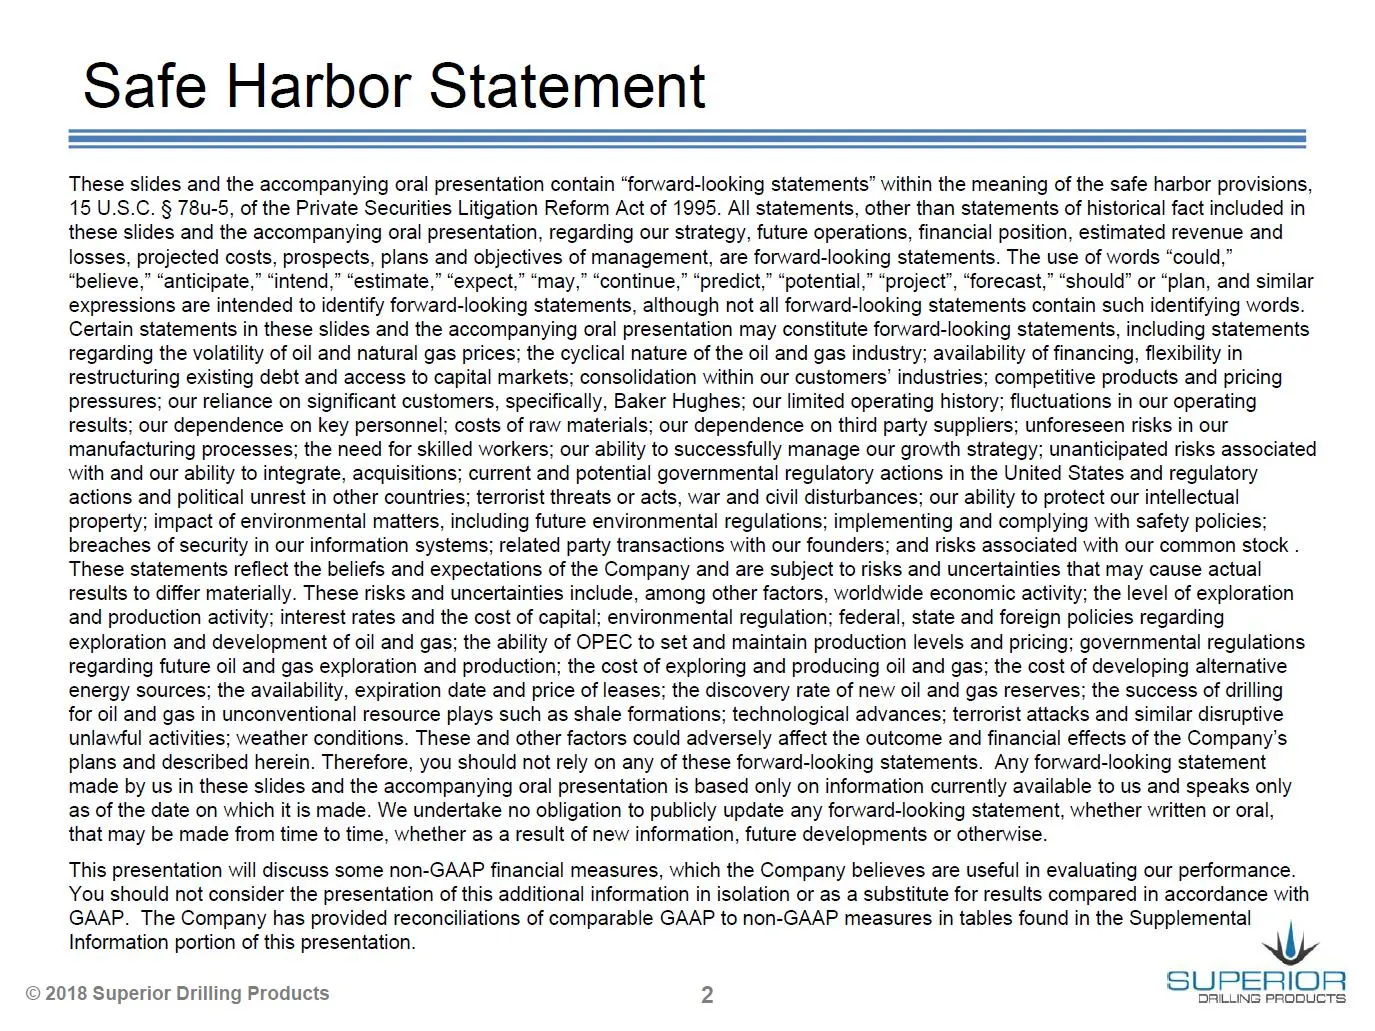
Slide 2: Safe Harbor Statement
Safe Harbor Statement These slides and the accompanying oral presentation contain “forward-looking statements” within the meaning of the safe harbor provisions, 15 U.S.C. § 78u-5, of the Private Securities Litigation Reform Act of 1995. All statements, other than statements of historical fact includ
Slide 3: Troy Meier, Chairman and Chief Executive Officer
Troy Meier Chairman and Chief Executive Officer © 2018 Superior Drilling Products
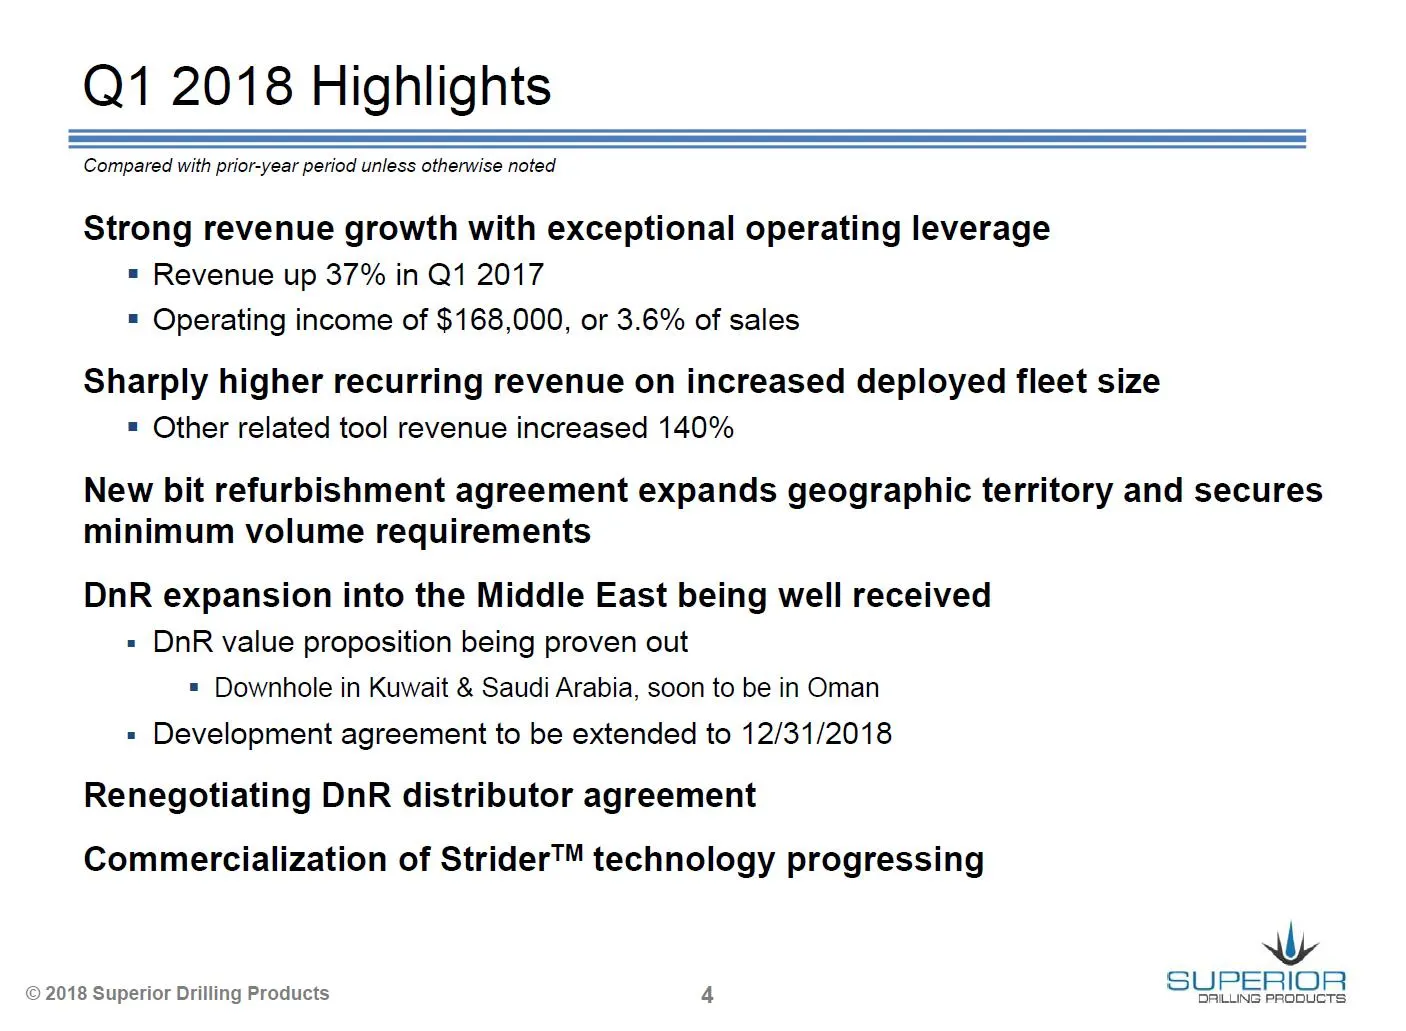
Slide 4: Q1 2018 Highlights
Q1 2018 Highlights Compared with prior-year period unless otherwise noted Strong revenue growth with exceptional operating leverage = Revenue up 37% in Q1 2017 = Operating income of $168,000, or 3.6% of sales Sharply higher recurring revenue on increased deployed fleet size = Other related tool reve
Slide 5: Financial Results
Financial Results Christopher D. Cashion Chief Financial Officer © 2018 Superior Drilling Products
Slide 6: Significant Revenue Growth
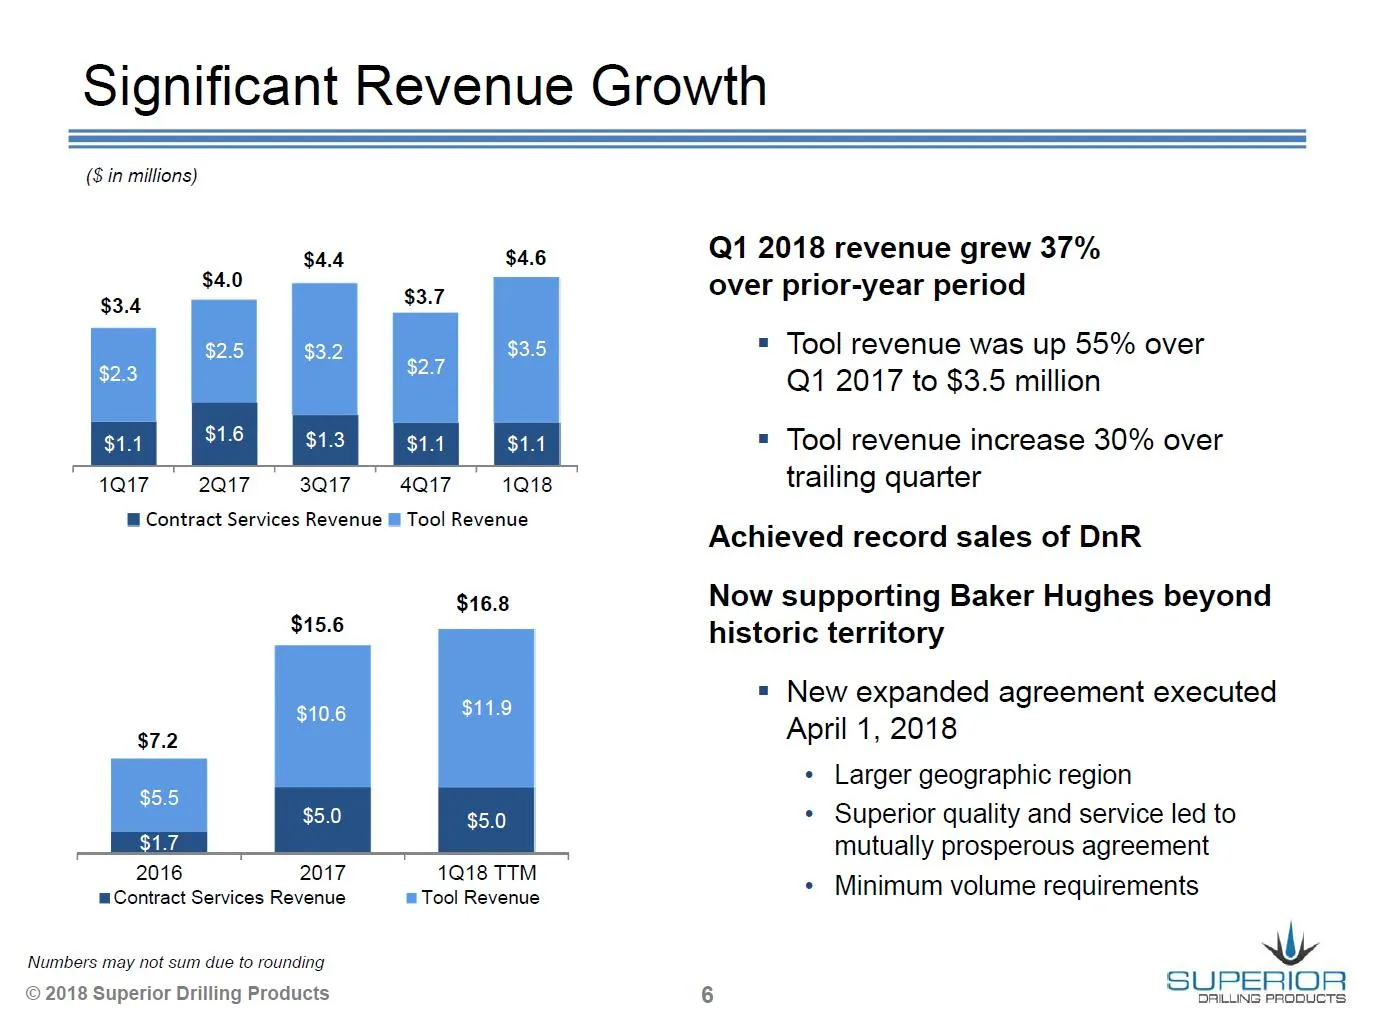
Significant Revenue Growth ($ in millions) $4.4 $4.6 $4.0 $3.4 $3.7 $25 3.2 $3.5 $2.3 : $2.7 $14 Ae $1.3 $1.1 $1.1 1017 | 2017 3a17° 4a17 +1018 @ Contract Services Revenue ™ Tool Revenue $16.8 $15.6 $10.6 $11.9 $7.2 $5.5 $5.0 $5.0 $1.7 2016 2017 1Q18 TTM Contract Services Revenue = Tool Revenue Numb
Slide 7: Strong Tool Revenue
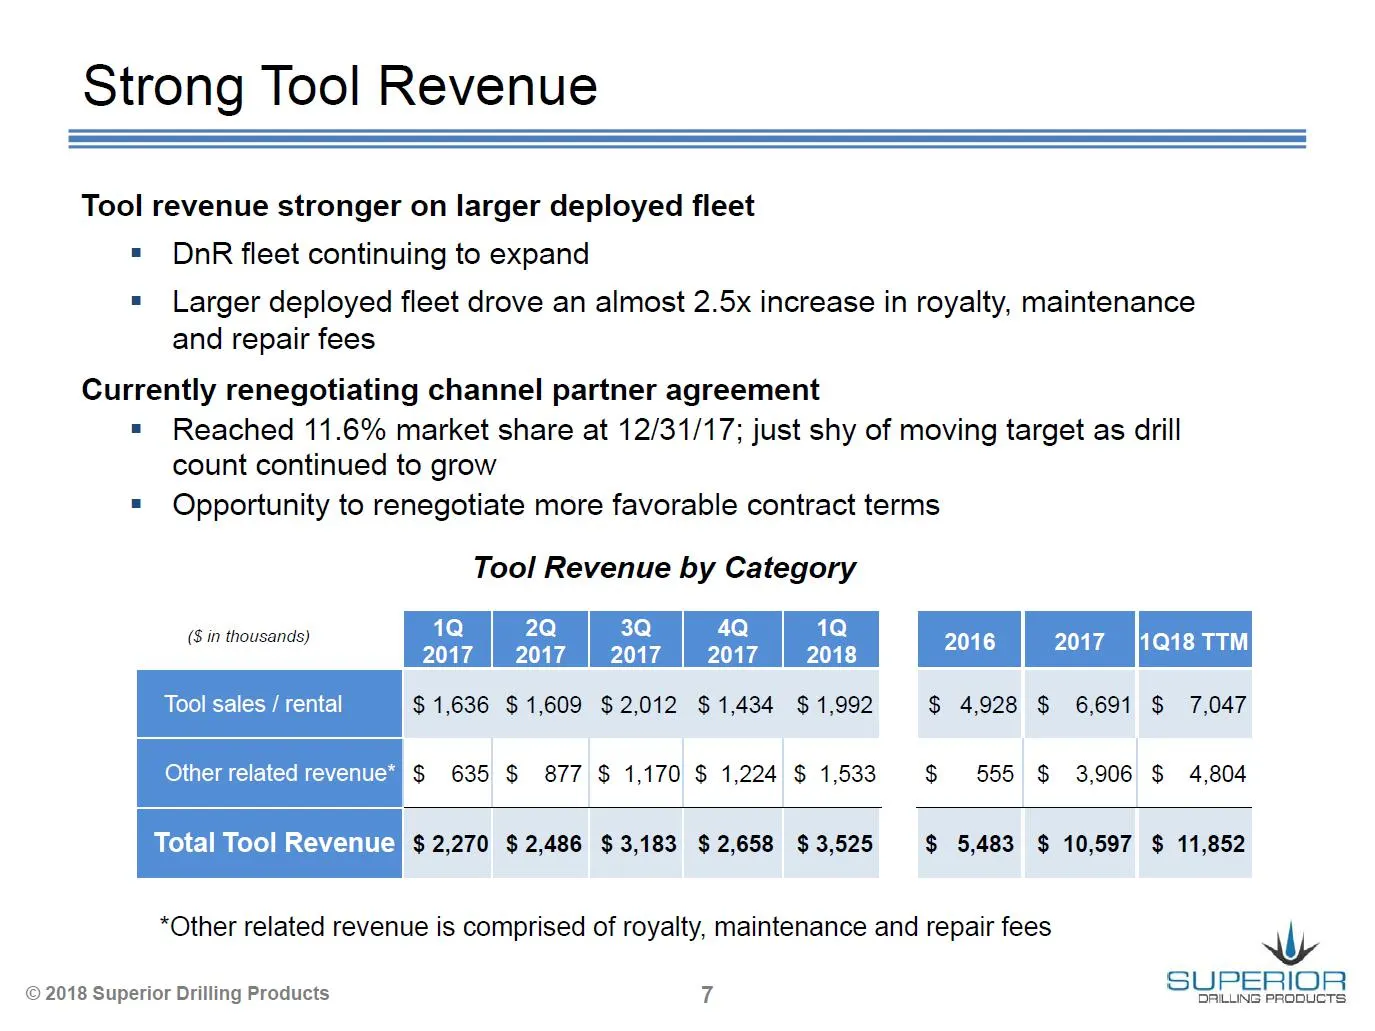
Strong Tool Revenue Tool revenue stronger on larger deployed fleet = DnR fleet continuing to expand = Larger deployed fleet drove an almost 2.5x increase in royalty, maintenance and repair fees Currently renegotiating channel partner agreement = Reached 11.6% market share at 12/31/17; just shy of mo
Slide 8: Strong Cost Discipline and Operating Leverage
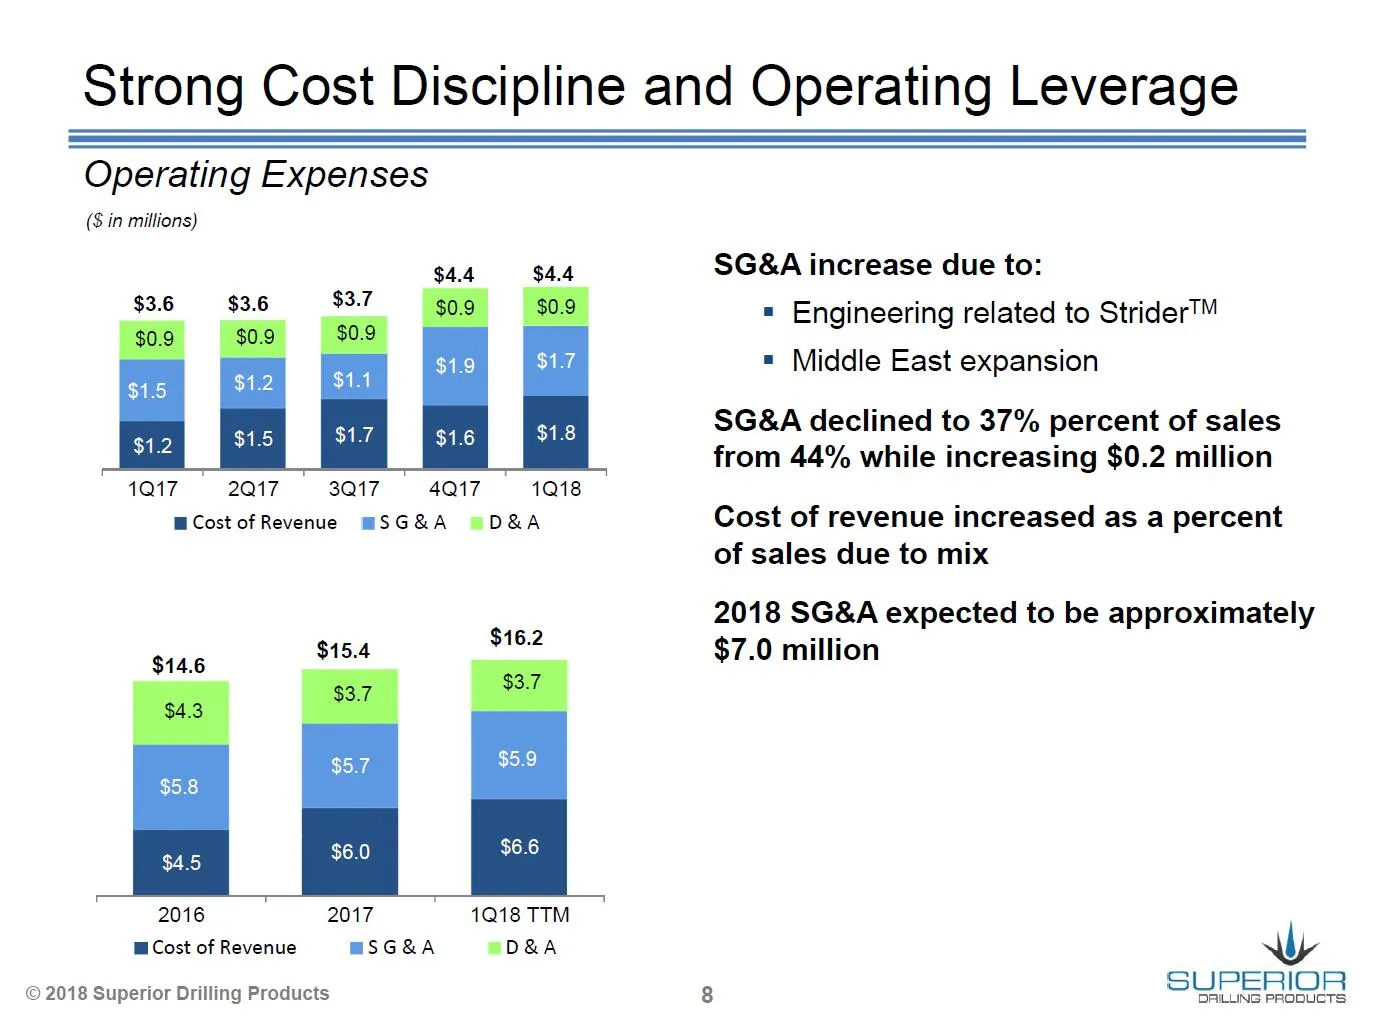
Strong Cost Discipline and Operating Leverage Operating Expenses ($ in millions) $4.4 $4.4 $1.9 $1.7 $1.5 $12 $1.6 $1.8 1Q17 2Q17 3Q17 4Q17 1Q18 MCostofRevenue BSG&A HD&A $16.2 15.4 on Es $5.7 $5.9 $5.8 $45 $6.0 $6.6 2016 2017 1Q18 TTM Cost of Revenue mBSG&A eD&A © 2018 Superior Drilling Products SG
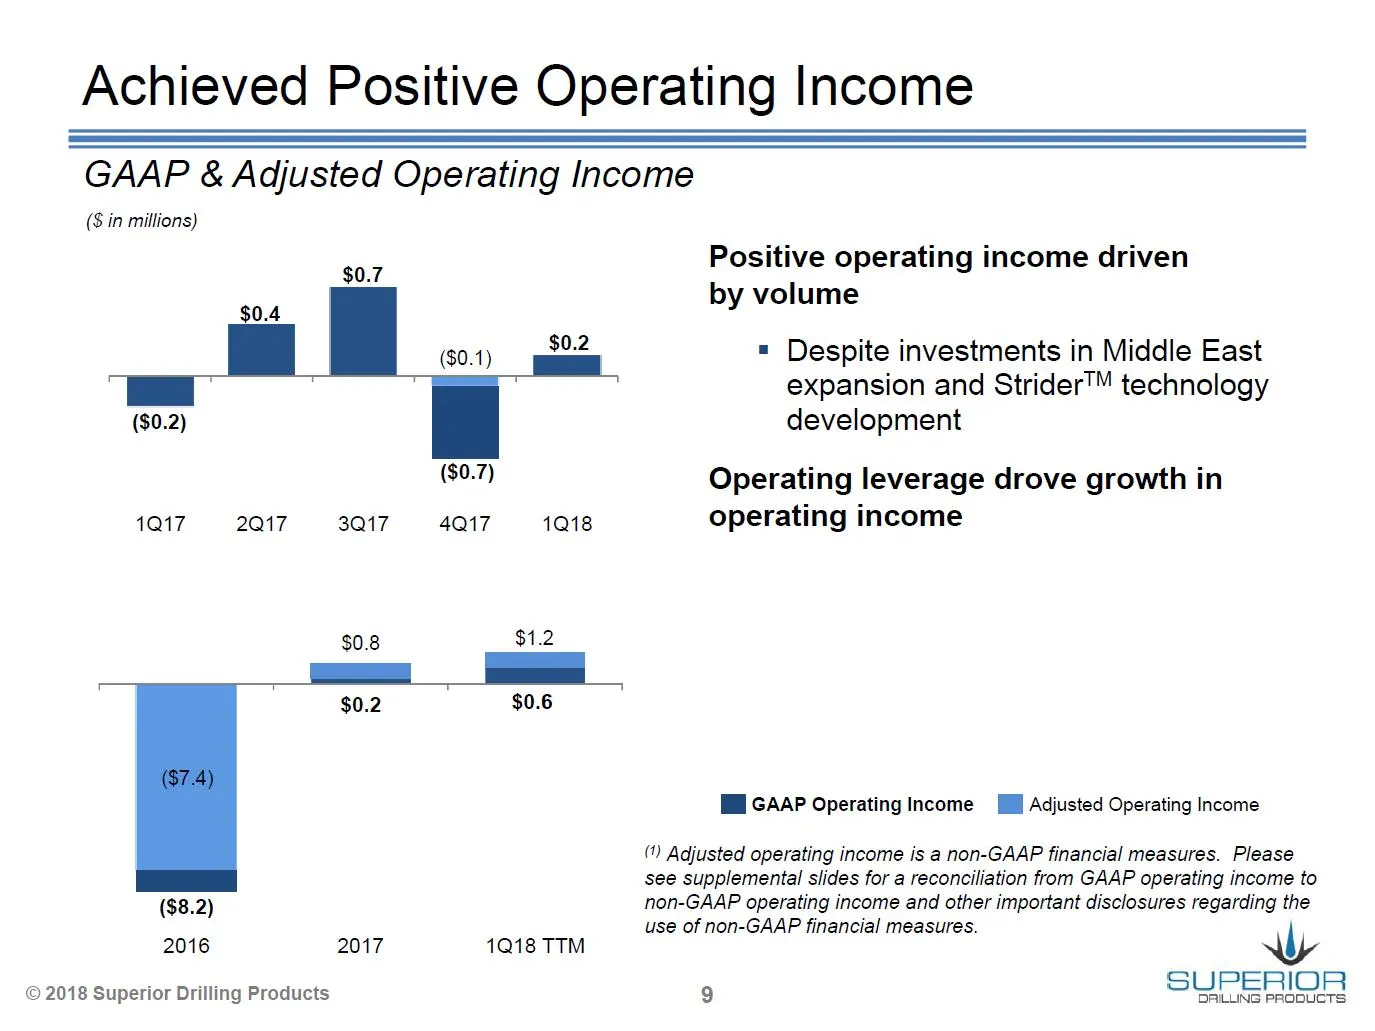
Slide 9: Achieved Positive Operating Income
Achieved Positive Operating Income GAAP & Adjusted Operating Income ($ in millions) Positive operating income driven $0.7 by volume $0.4 | | ($0.1) —_ = Despite investments in Middle East i | expansion and Strider™ technology ($0.2) development (30.7) Operating leverage drove growth in 1017 2Q17- 3Q
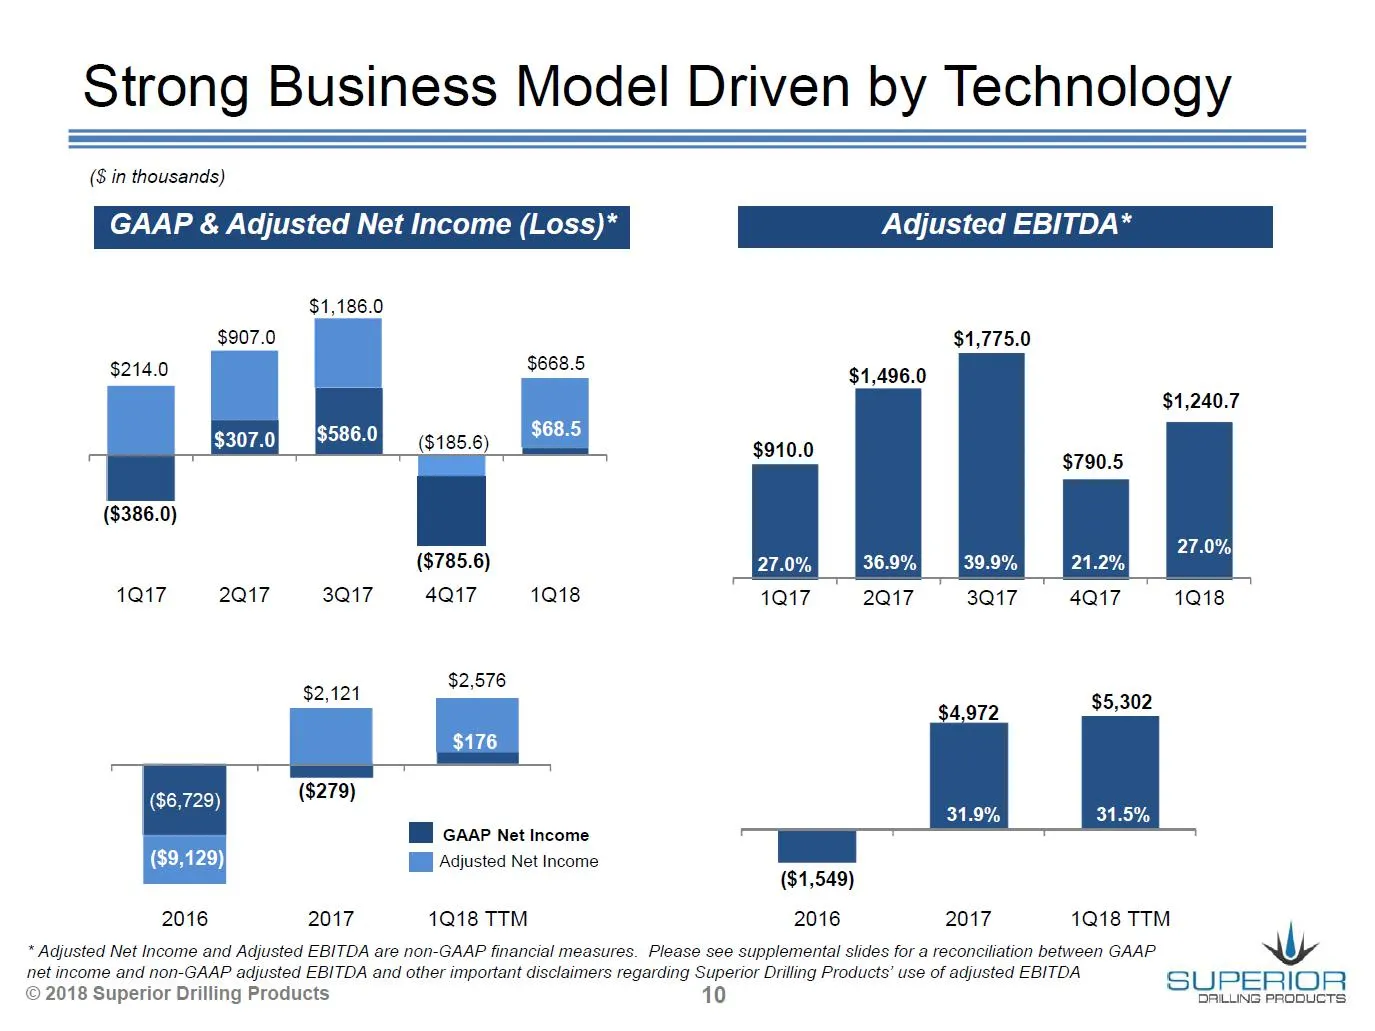
Slide 10: Strong Business Model Driven by Technology
Strong Business Model Driven by Technology (S$ in thousands) GAAP & Adjusted Net Income (Loss)* Adjusted EBITDA* $1,186.0 $907.0 $1,775.0 $214.0 $668.5 $1,496.0 $1,240.7 $307.0 NES °86-0 BRCSTLR) $910.0 $790.5 ($386.0) ($785.6) 36.9% fim 39.9% 21.2% 1Q17 2Q17 3Q17 4Q17 1Q18 1Q17 2Q17 3Q17 4Q17 1Q18
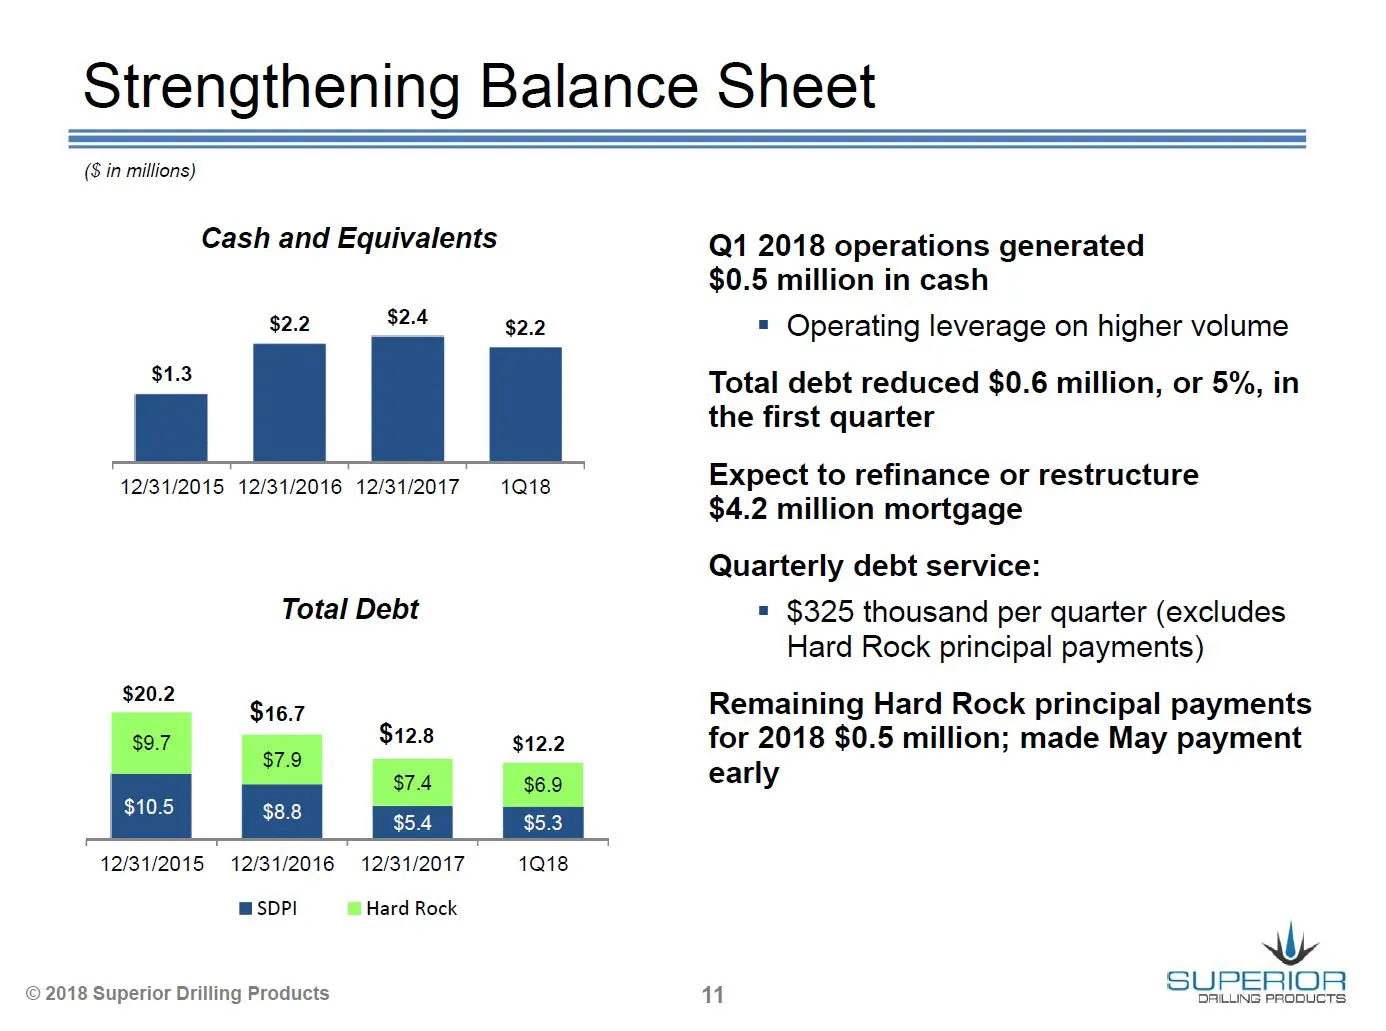
Slide 11: Strengthening Balance Sheet
Strengthening Balance Sheet ($ in millions) Cash and Equivalents $2.2 $2.4 : U U 12/31/2015 12/31/2016 12/31/2017 1218 $2.2 Total Debt $20.2 $16.7 $12.8 $12.2 J ia 12/31/2015 12/31/2016 = 12/31/2017 1Q18 mSDPI © Hard Rock © 2018 Superior Drilling Products Q1 2018 operations generated $0.5 million in
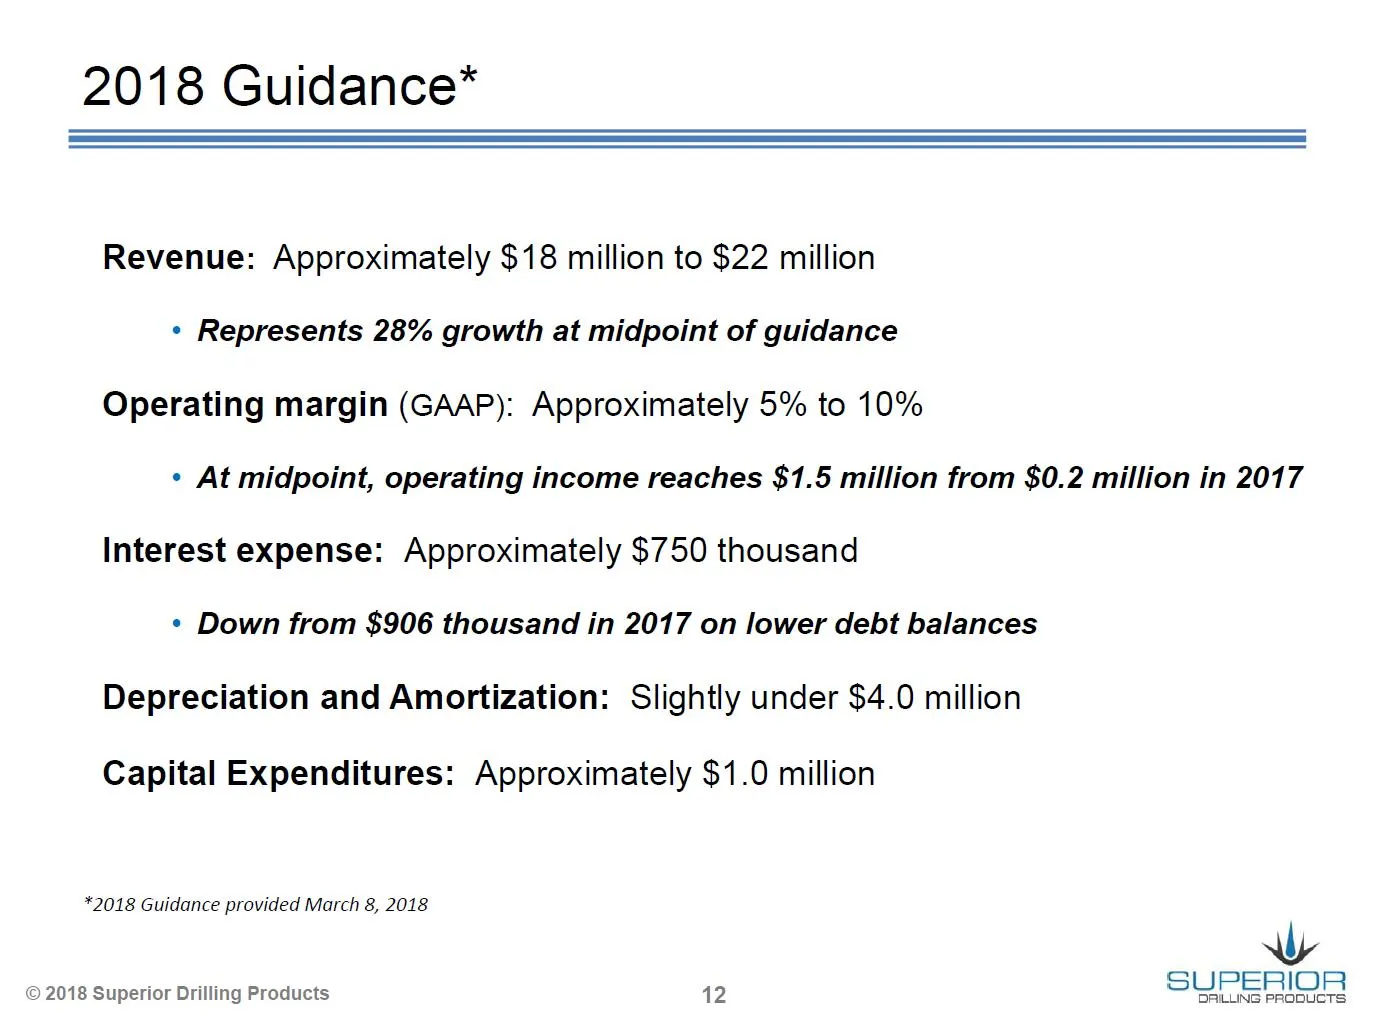
Slide 12: 2018 Guidance
2018 Guidance* Revenue: Approximately $18 million to $22 million * Represents 28% growth at midpoint of guidance Operating margin (GAAP): Approximately 5% to 10% ° At midpoint, operating income reaches $1.5 million from $0.2 million in 2017 Interest expense: Approximately $750 thousand « Down from $
Slide 13: Supplemental Information
i DRI th NG PRODUCTS a i his| Supplemental Information © 2018 Superior Drilling Products
Slide 14: Adjusted Net Income Reconciliation
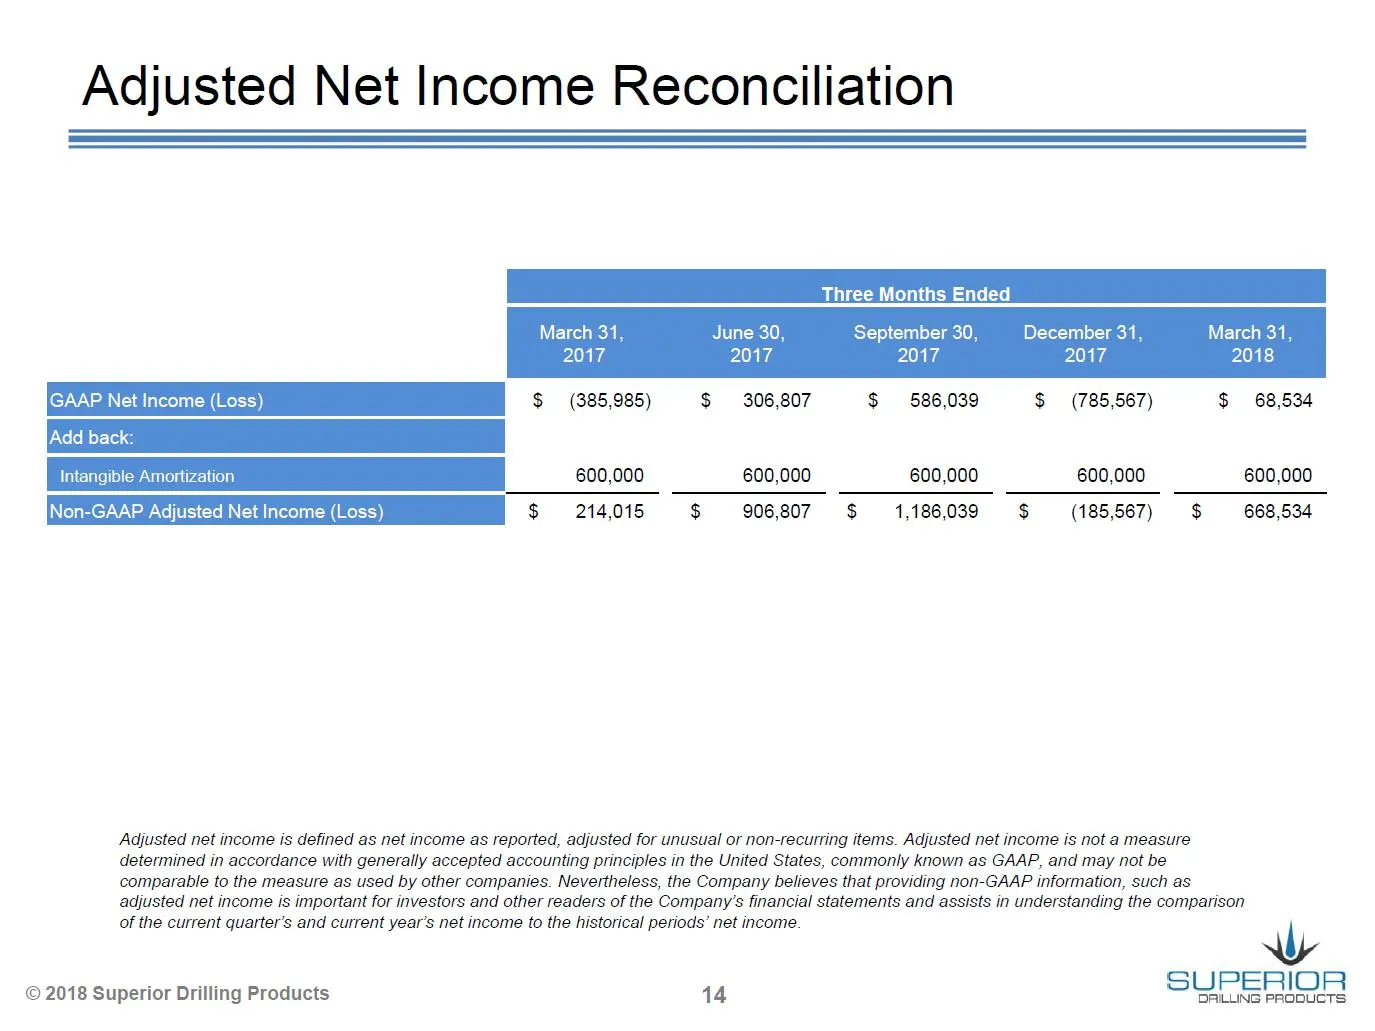
Adjusted Net Income Reconciliation Three Months Ended September 30, December 31, 2017 2017 GAAP Net Income (Loss) $ (385,985) $ 306,807 $ 586,039 $ (785,567) $ 68,534 Add back: Intangible Amortization 600,000 600,000 600,000 600,000 600,000 AAP Adjusted Net Income (Loss) $ = 214,015 $ 906,807 $ 1,18
Slide 15: Adjusted Net Income Reconciliation
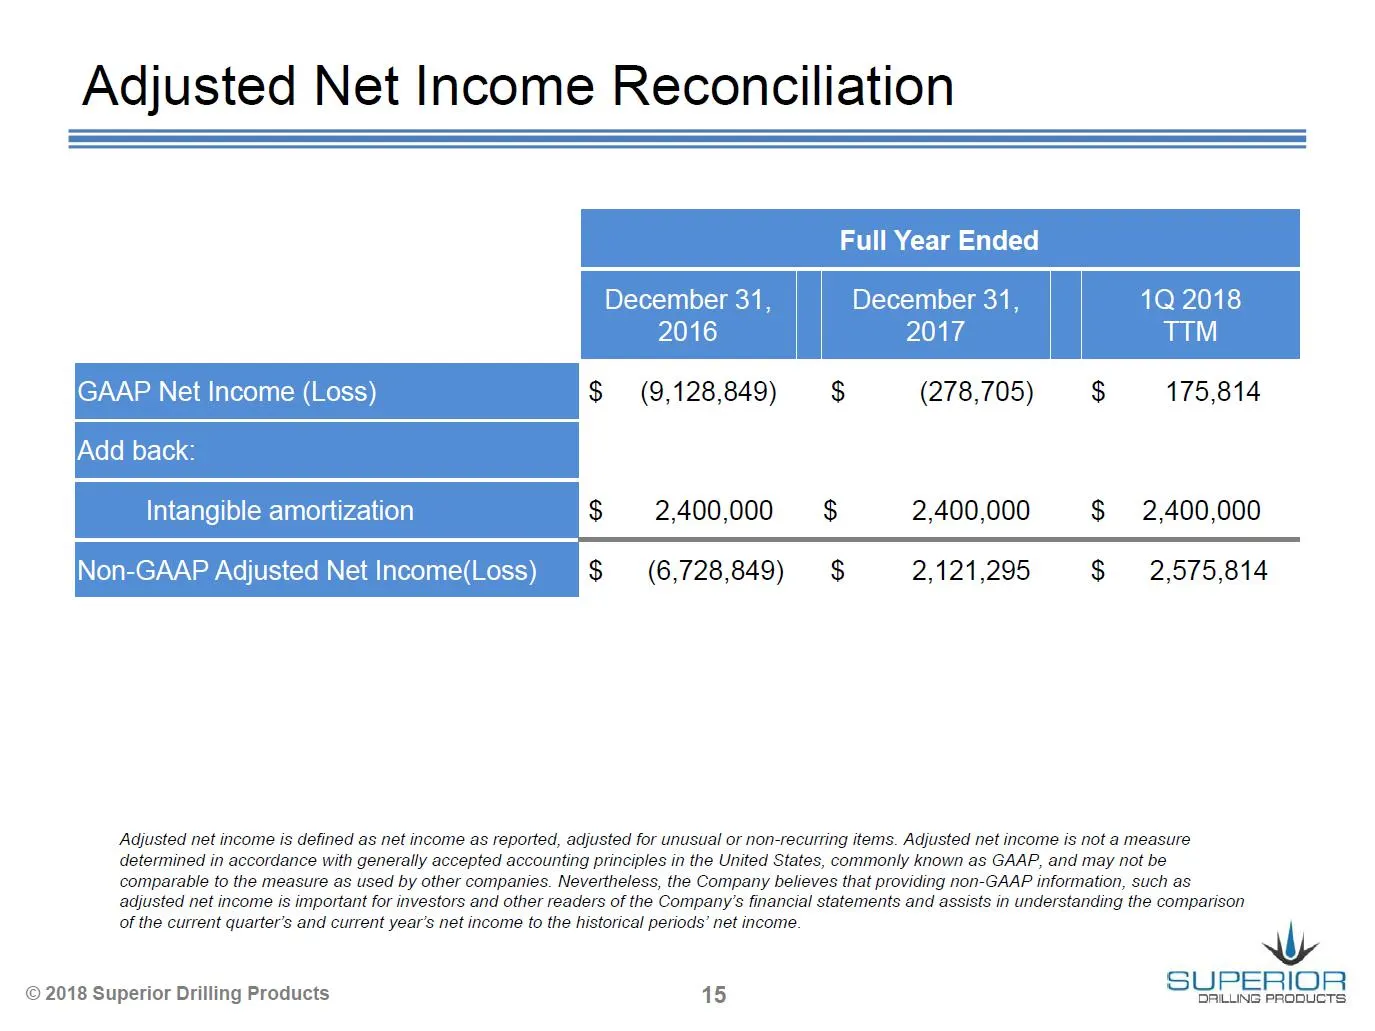
Adjusted Net Income Reconciliation Full Year Ended December 31, 1Q 2018 2017 TIM December 2016 GAAP Net Income (Loss) $ (9,128,849) $ (278,705) $ 175,814 Add back Intangible amortization $ 2,400,000 $ 2,400,000 $ 2,400,000 Non-GAAP Adjusted Net Income(Loss) $ (6,728,849) $ 2,121,295 $ 2,575,814 Adju
Slide 16: Adjusted Income from Operations Reconciliation
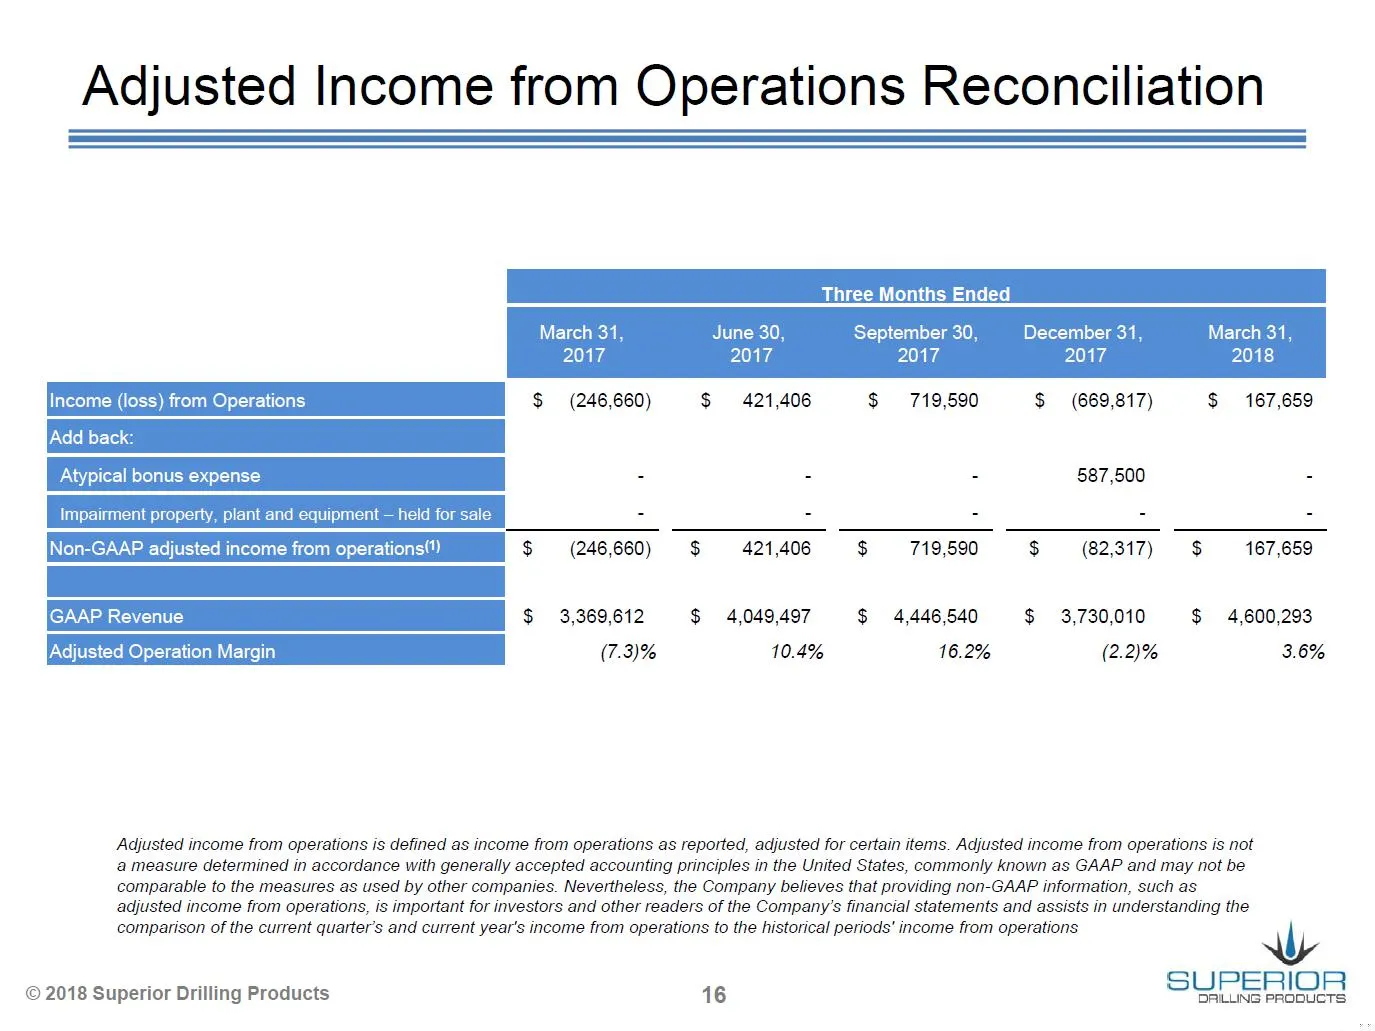
Adjusted Income from Operations Reconciliation Three Months Ended March 31 tember 30. December 31 March 31 2017 2017 2017 2018 Income (loss) from Operations $ (246,660) $ 421,406 $ 719,590 $ (669,817) $ 167,659 Add back: Atypical bonus expense - - - 587,500 - Impairment property, plant and equipment
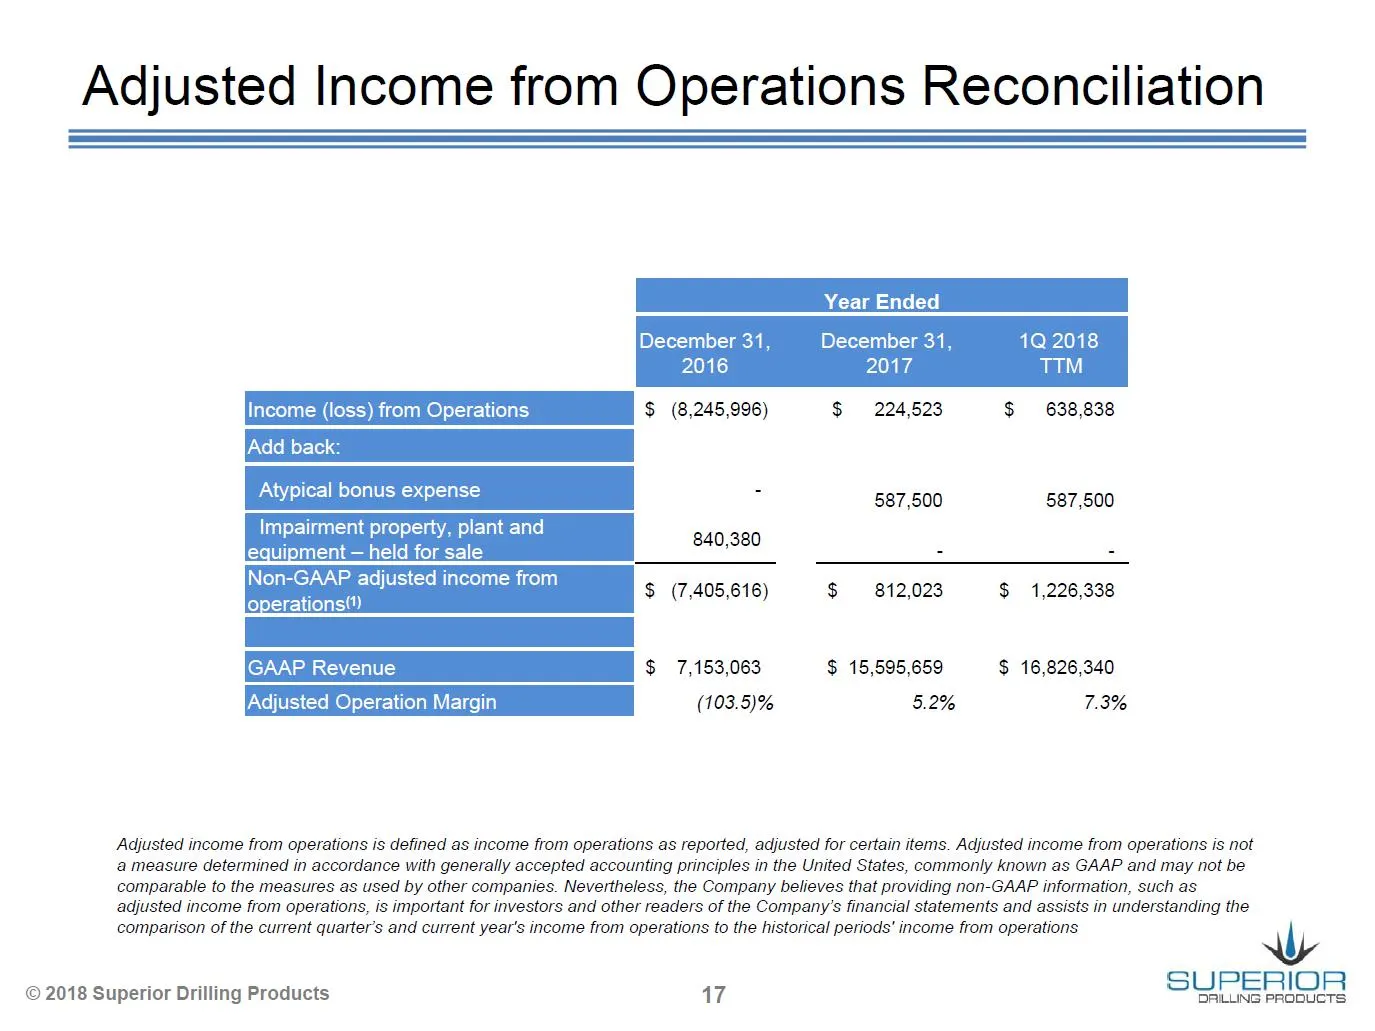
Slide 17: Adjusted Income from Operations Reconciliation
Adjusted Income from Operations Reconciliation Year Ended December 31, December 31, 1Q 2018 TIM Income (loss) from Operations $ (8,245,996) $ 224,523 $ 638,838 Atypical bonus expense - 587,500 587,500 Impairment property, plant and 840,380 equipment — held for sale = = Norge aly adiusted neome nom $
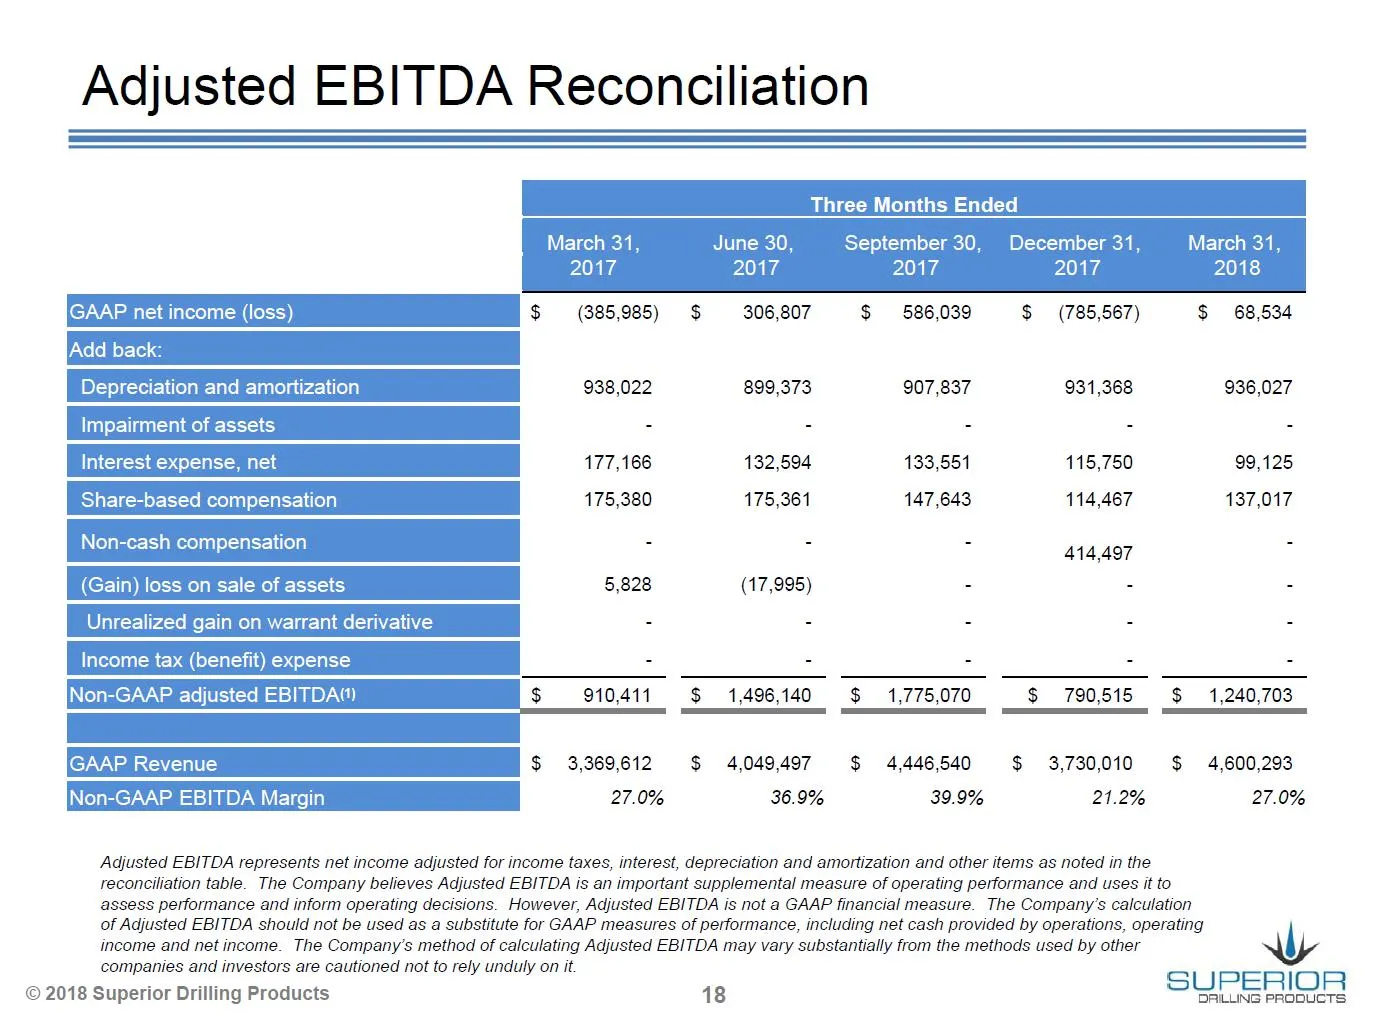
Slide 18: Adjusted EBITDA Reconciliation
Adjusted EBITDA Reconciliation Three Months Ended June 30, September 30, December 31, March 31, 2017 2017 2017 2018 $ (385,985) $ 306807 $ 586,039 $ (785,567) $ 68,534 938,022 899,373 907,837 981,368 936,027 Interest expense, net 177,166 132,594 133,551 115,750 99,125 Share-based compensa 175,380 17
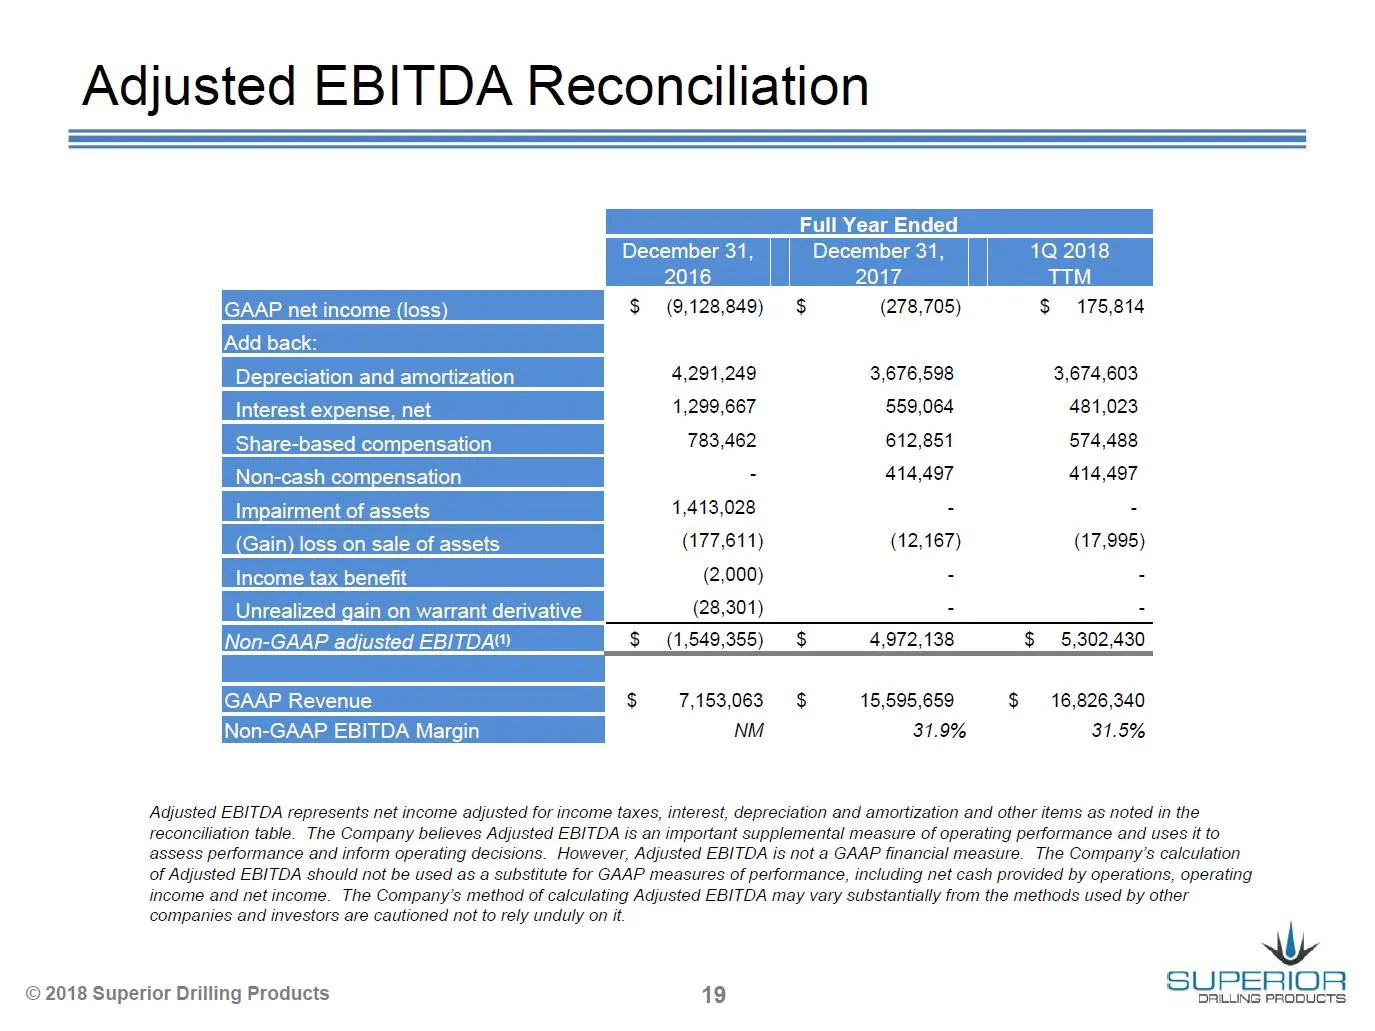
Slide 19: Adjusted EBITDA Reconciliation
Adjusted EBITDA Reconciliation Full Year Ended December 31 December 31 2016 2017 IGAAP net income (loss) $ (9,128,849) $ (278,705) $ 175,814 Add bac! Depreciation and amortization 4,291,249 3,676,598 3,674,603 1,299,667 559,064 481,023 783,462 612,851 574,488 - 414,497 414,497 1,413,028 : : (177.611
Source: SEC EDGAR · 8-K filed May 10, 2018
More decks from Superior Drilling Products Inc
 Q3 2023 Earnings Presentation12 slides · Nov 9, 2023
 Q2 2023 Earnings Presentation12 slides · Aug 14, 2023
 Q1 2023 Earnings Presentation12 slides · May 15, 2023
 FY2022 Earnings Presentation13 slides · Mar 10, 2023
 Q3 2022 Earnings Presentation12 slides · Nov 14, 2022
 MicroCap Rodeo Windy City Roundup 202220 slides · Oct 12, 2022