M3, Inc. · TSE:2413
M3 — FY2021 Q1 Earnings Presentation
20 slides from M3's earnings presentation, Jul 28, 2021
Slide 1: M3, Inc. Presentation Material July 2021
M3, Inc. Presentation Material July 2021 Copyright © 2021 M3, Inc. All rights reserved.
Slide 2: Forward-looking statements disclaimer
The following presentation contains forecasts, future plans, management targets and other forward-looking projections relating to M3, Inc. and/or its group. These statements are drawn from assumptions of future events based on data currently available to us, and there exist possibilities that such a
Slide 3: FY2021 Q1 Consolidated Results
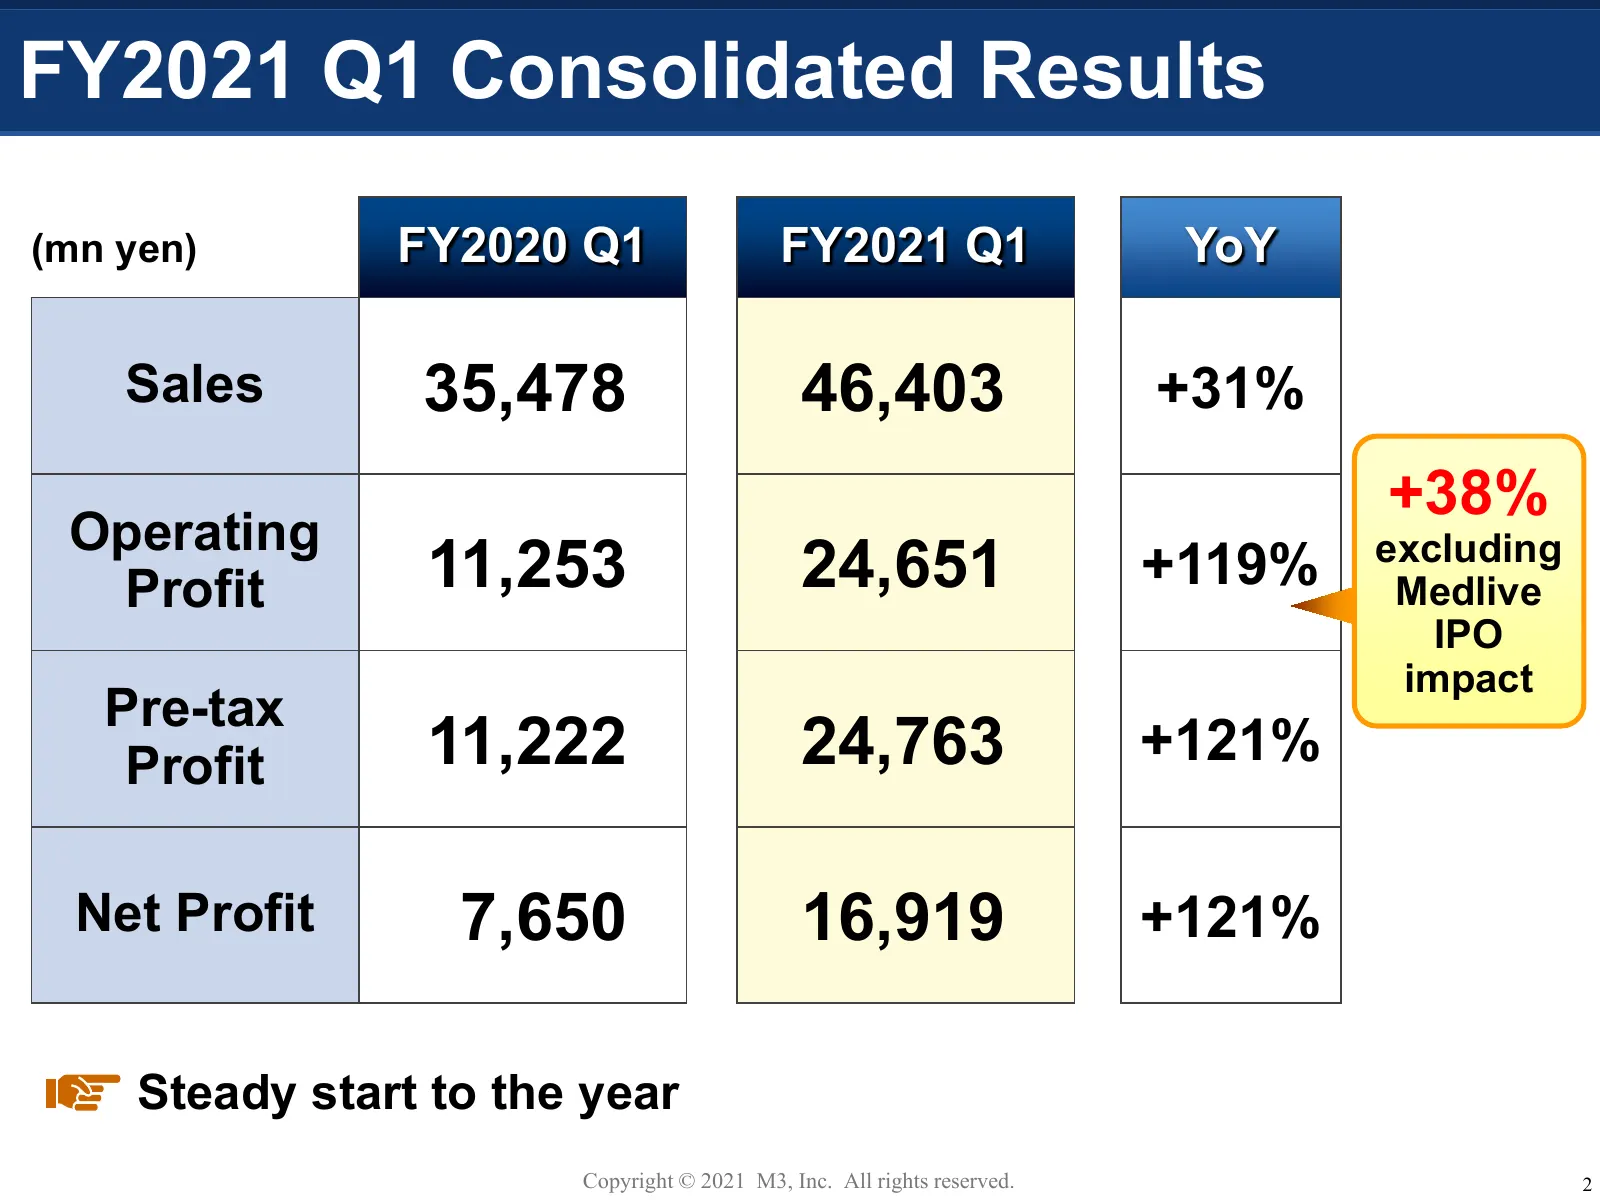
FY2021 Q1 Consolidated Results (mn yen) FY2020 Q1 FY2021 Q1 YoY Sales 35,478 46,403 +31% +38% Operating Profit 11,253 24,651 +119% excluding Medlive IPO impact Pre-tax Profit 11,222 24,763 +121% Net Profit 7,650 16,919 +121% Steady start to the year Copyright © 2021 M3, Inc. All rights reserved. 2
Slide 4: FY2021 Q1 Consolidated Results by Segment
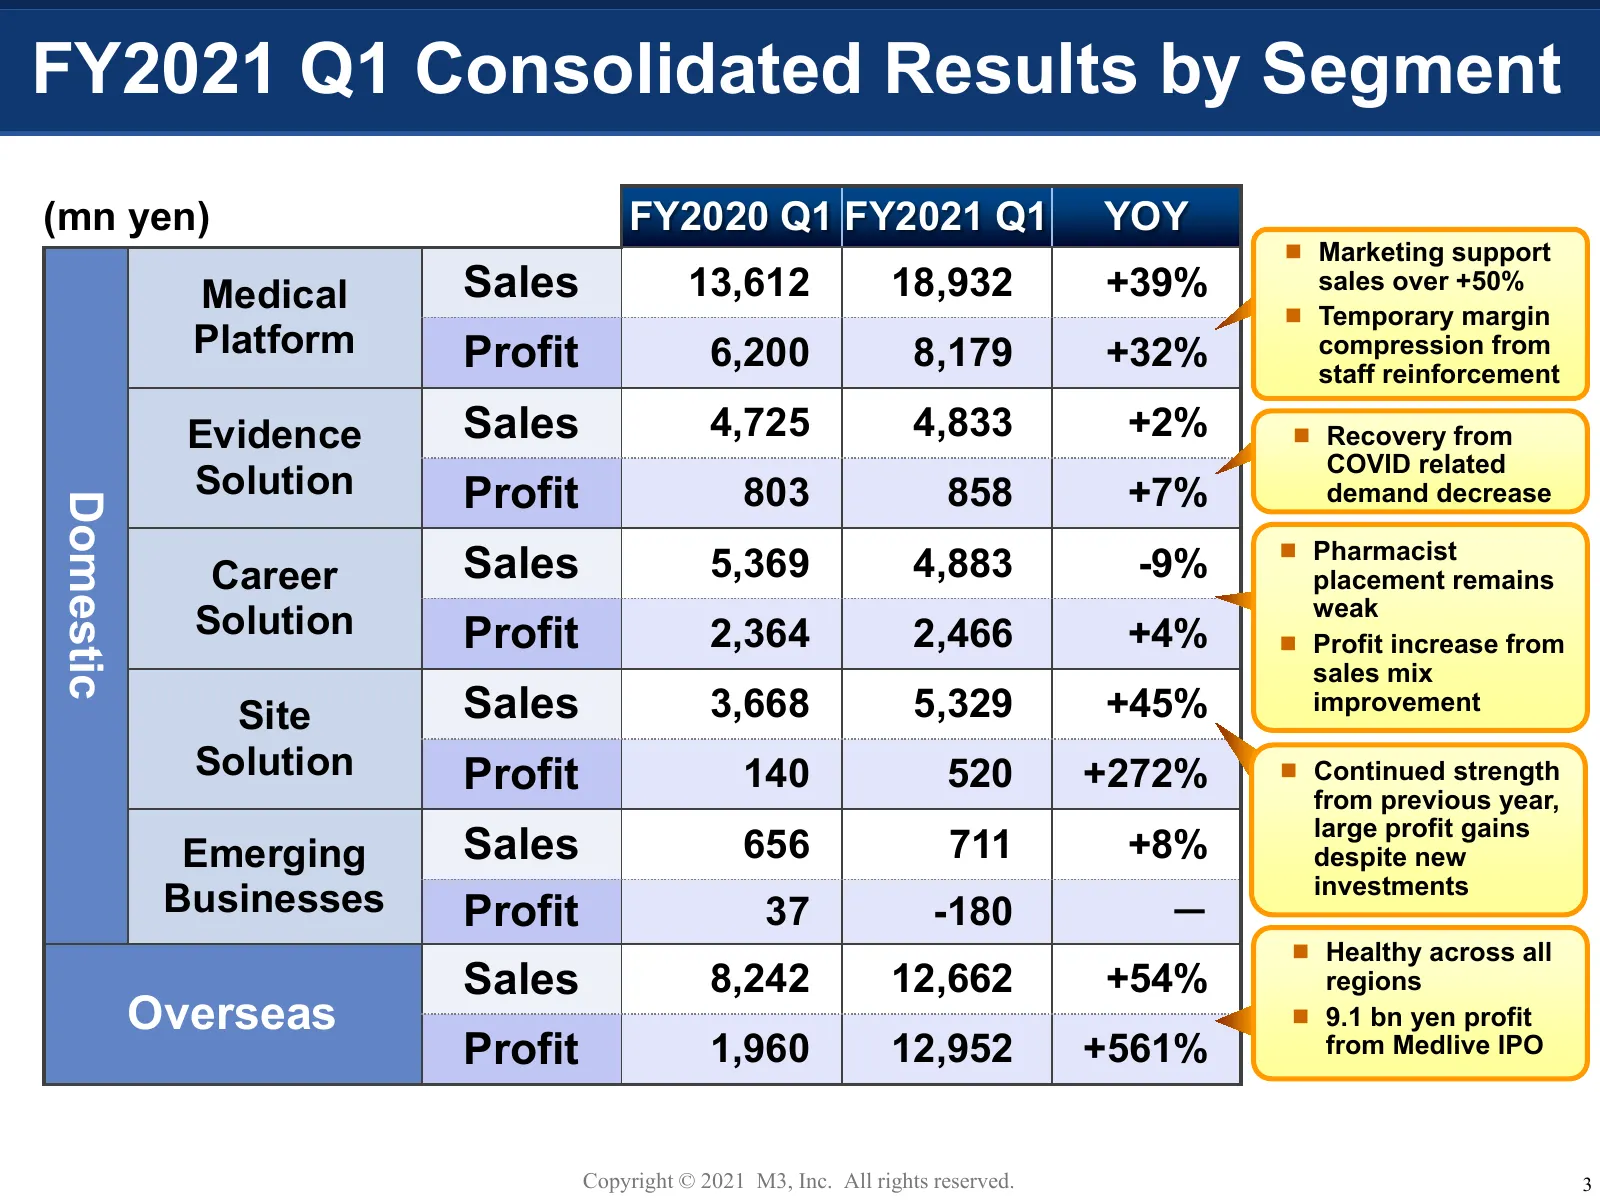
FY2021 Q1 Consolidated Results by Segment (mn yen) FY2020 Q1 FY2021 Q1 YOY Marketing support Medical Sales 13,612 18,932 +39% sales over +50% Temporary margin Platform Profit 6,200 8,179 +32% compression from staff reinforcement Evidence Sales 4,725 4,833 +2% Recovery from COVID related Soluti
Slide 5: FY2021 Q1 Consolidated Operating Profit Contribution
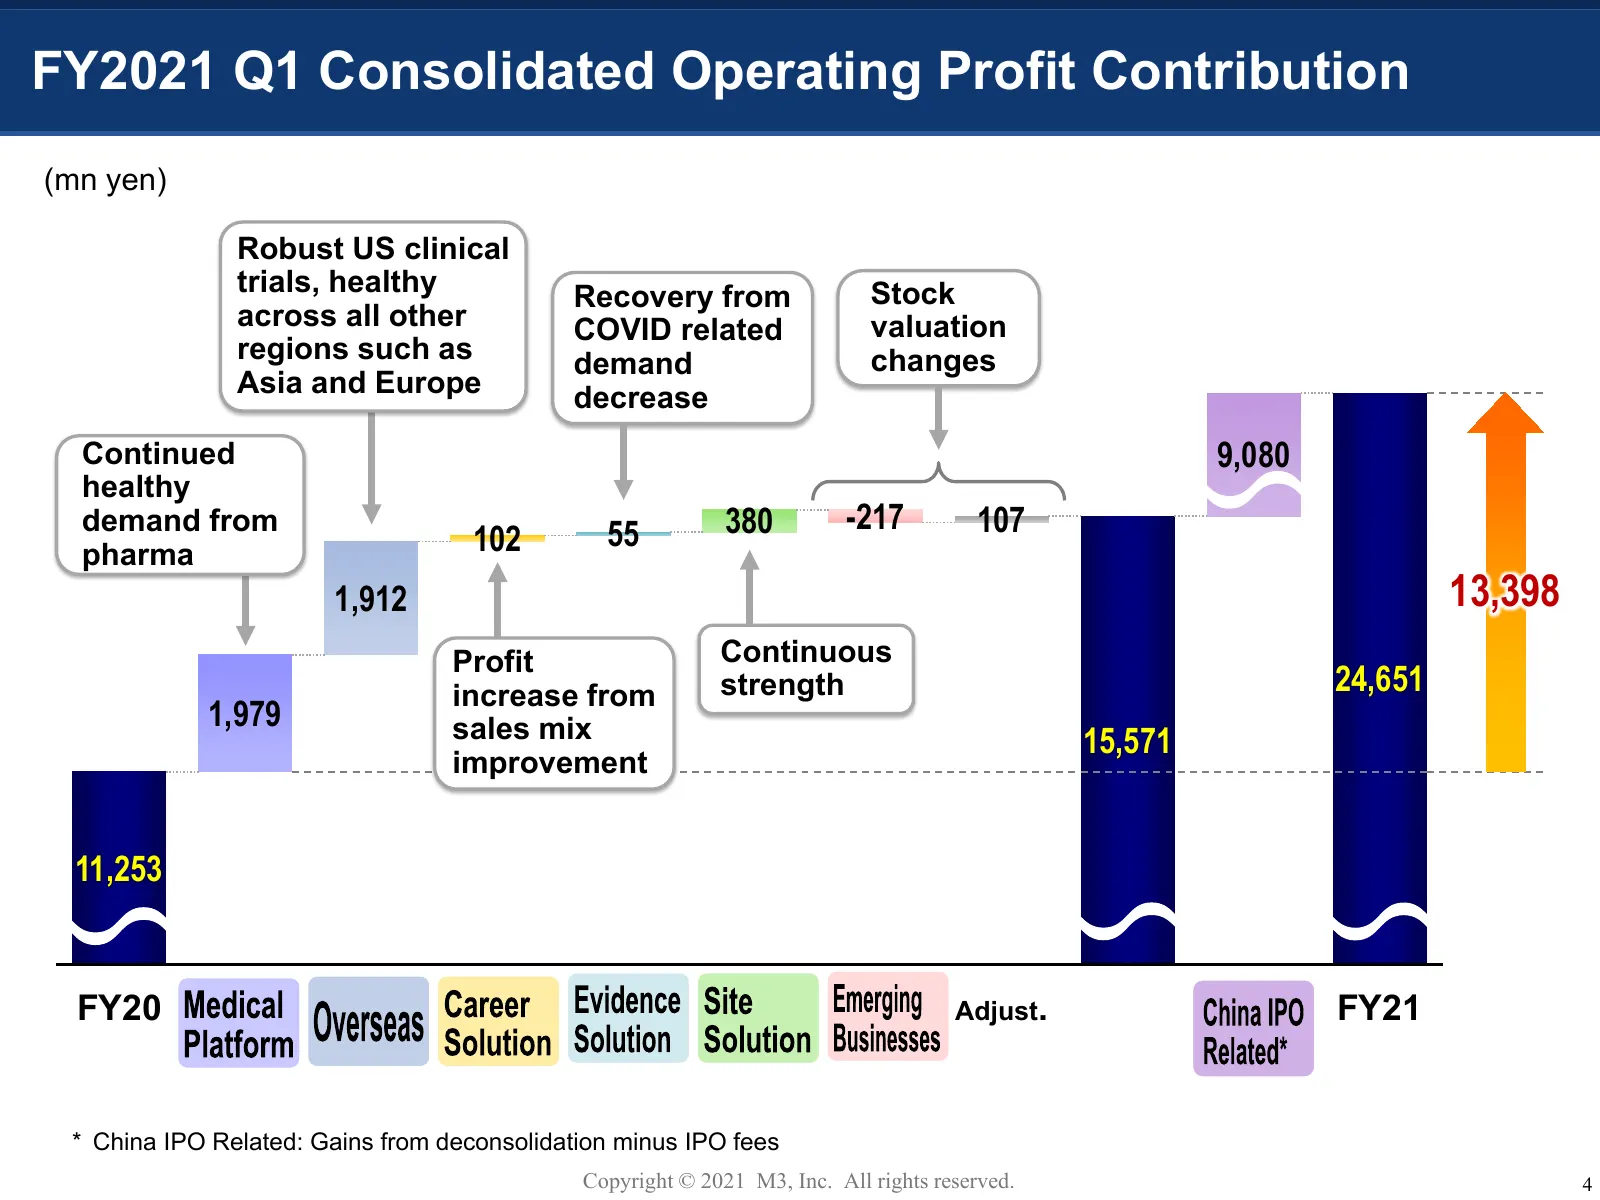
FY2021 Q1 Consolidated Operating Profit Contribution (mn yen) Robust US clinical trials, healthy Recovery from Stock across all other COVID related valuation regions such as demand changes Asia and Europe decrease Continued 9,080 healthy demand from 55 380 -217 107 pharma 102 1,912 13,398 Profit Con
Slide 6: FY2021 Q1 Overview
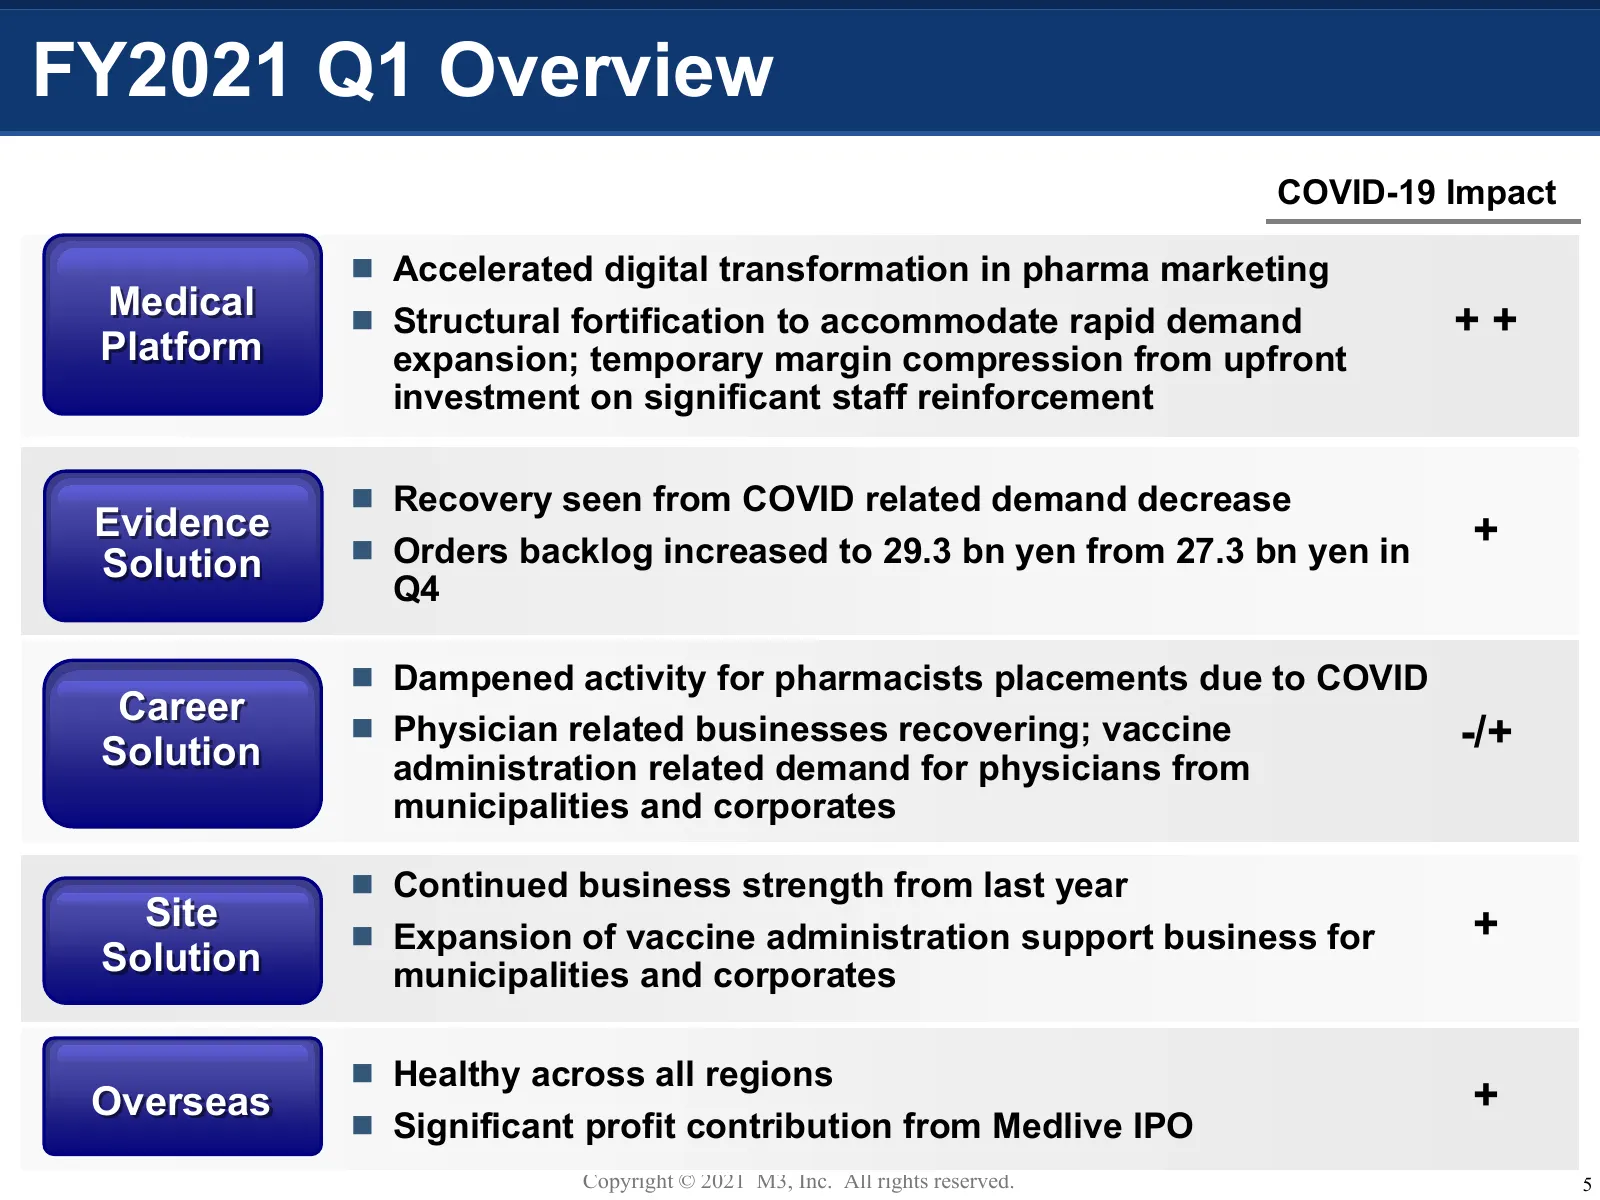
FY2021 Q1 Overview COVID-19 Impact Accelerated digital transformation in pharma marketing Medical Structural fortification to accommodate rapid demand ++ Platform expansion; temporary margin compression from upfront investment on significant staff reinforcement Recovery seen from COVID related
Slide 7: m3.com Platform Strength
m3.com Platform Strength Copyright © 2021 M3, Inc. All rights reserved. 6
Slide 8: m3.com Platform Strength
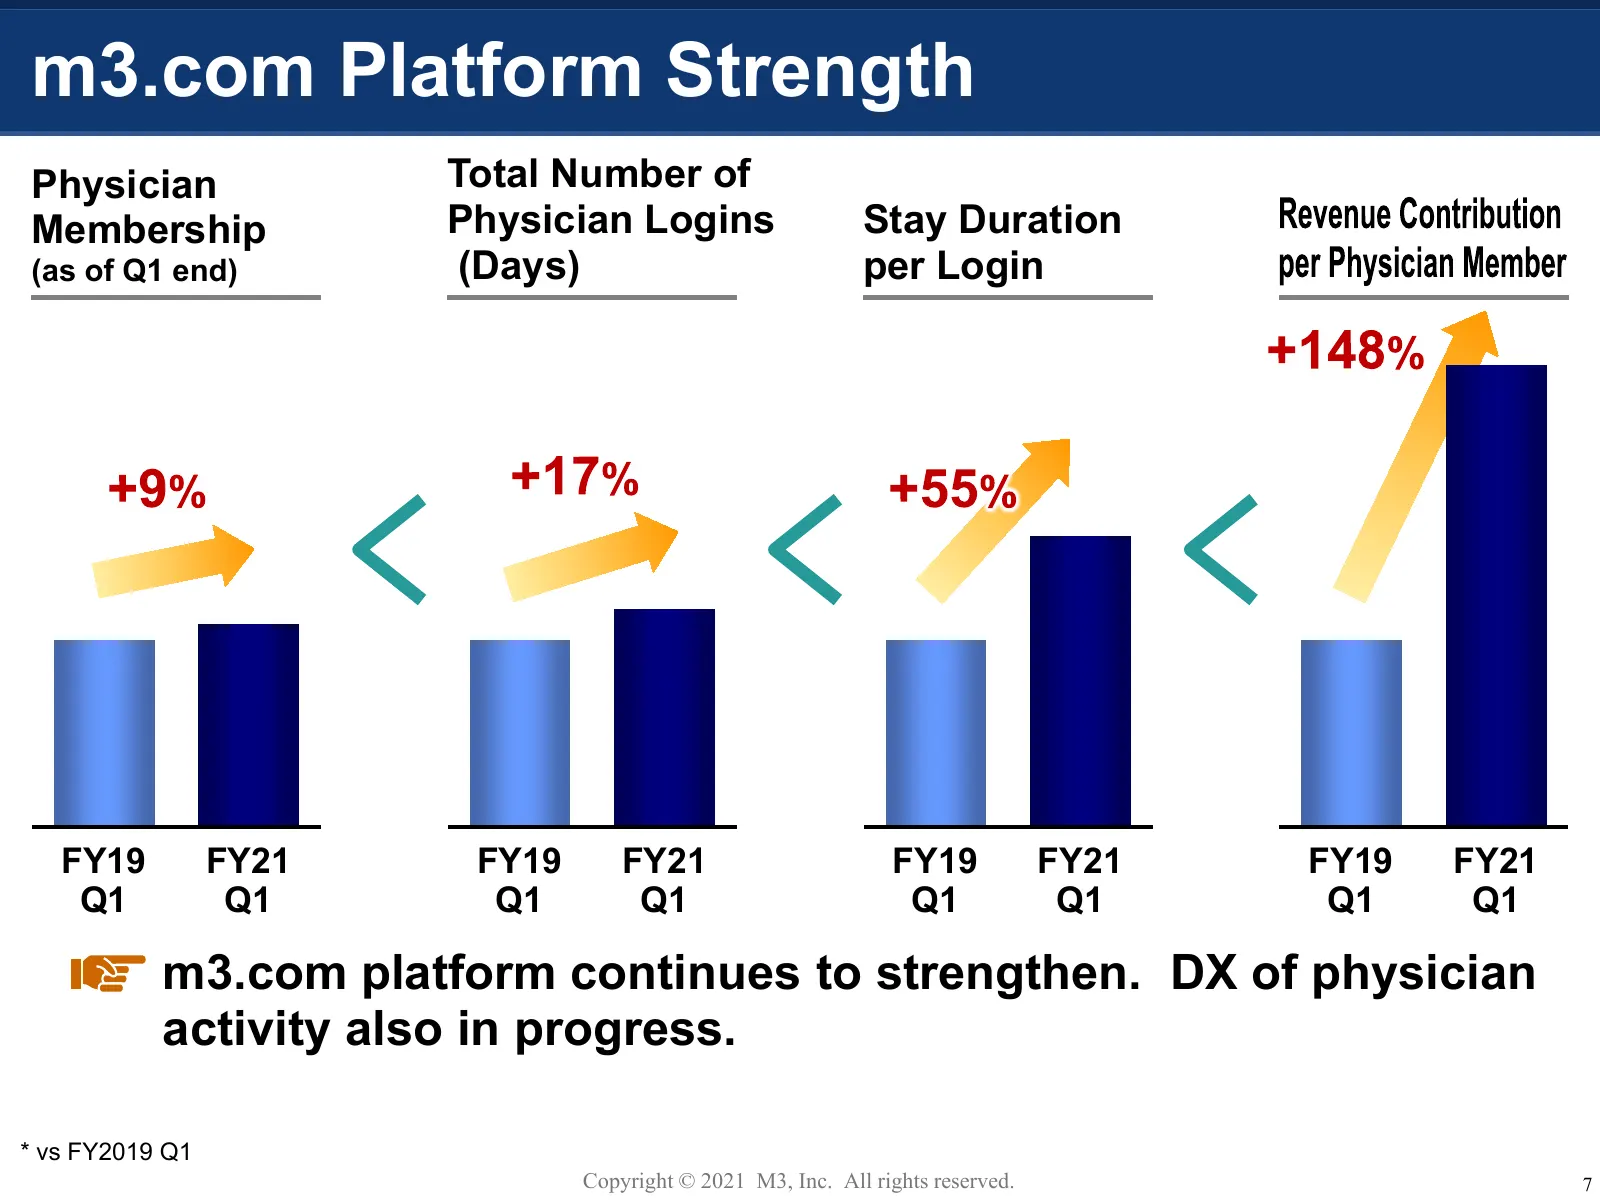
m3.com Platform Strength Physician Total Number of Membership Physician Logins Stay Duration (as of Q1 end) (Days) per Login FY19 FY21 FY19 FY21 FY19 FY21 FY19 FY21 Q1 Q1 Q1 Q1 Q1 Q1 Q1 Q1 m3.com platform continues to strengthen. DX of physician activity also in progress. * vs FY2019 Q1 Copyright ©
Slide 9: Pharmaceutical Sales & Marketing DX
Pharmaceutical Sales & Marketing DX Copyright © 2021 M3, Inc. All rights reserved. 8
Slide 10: Pharma Marketing Cost and TAM for M3
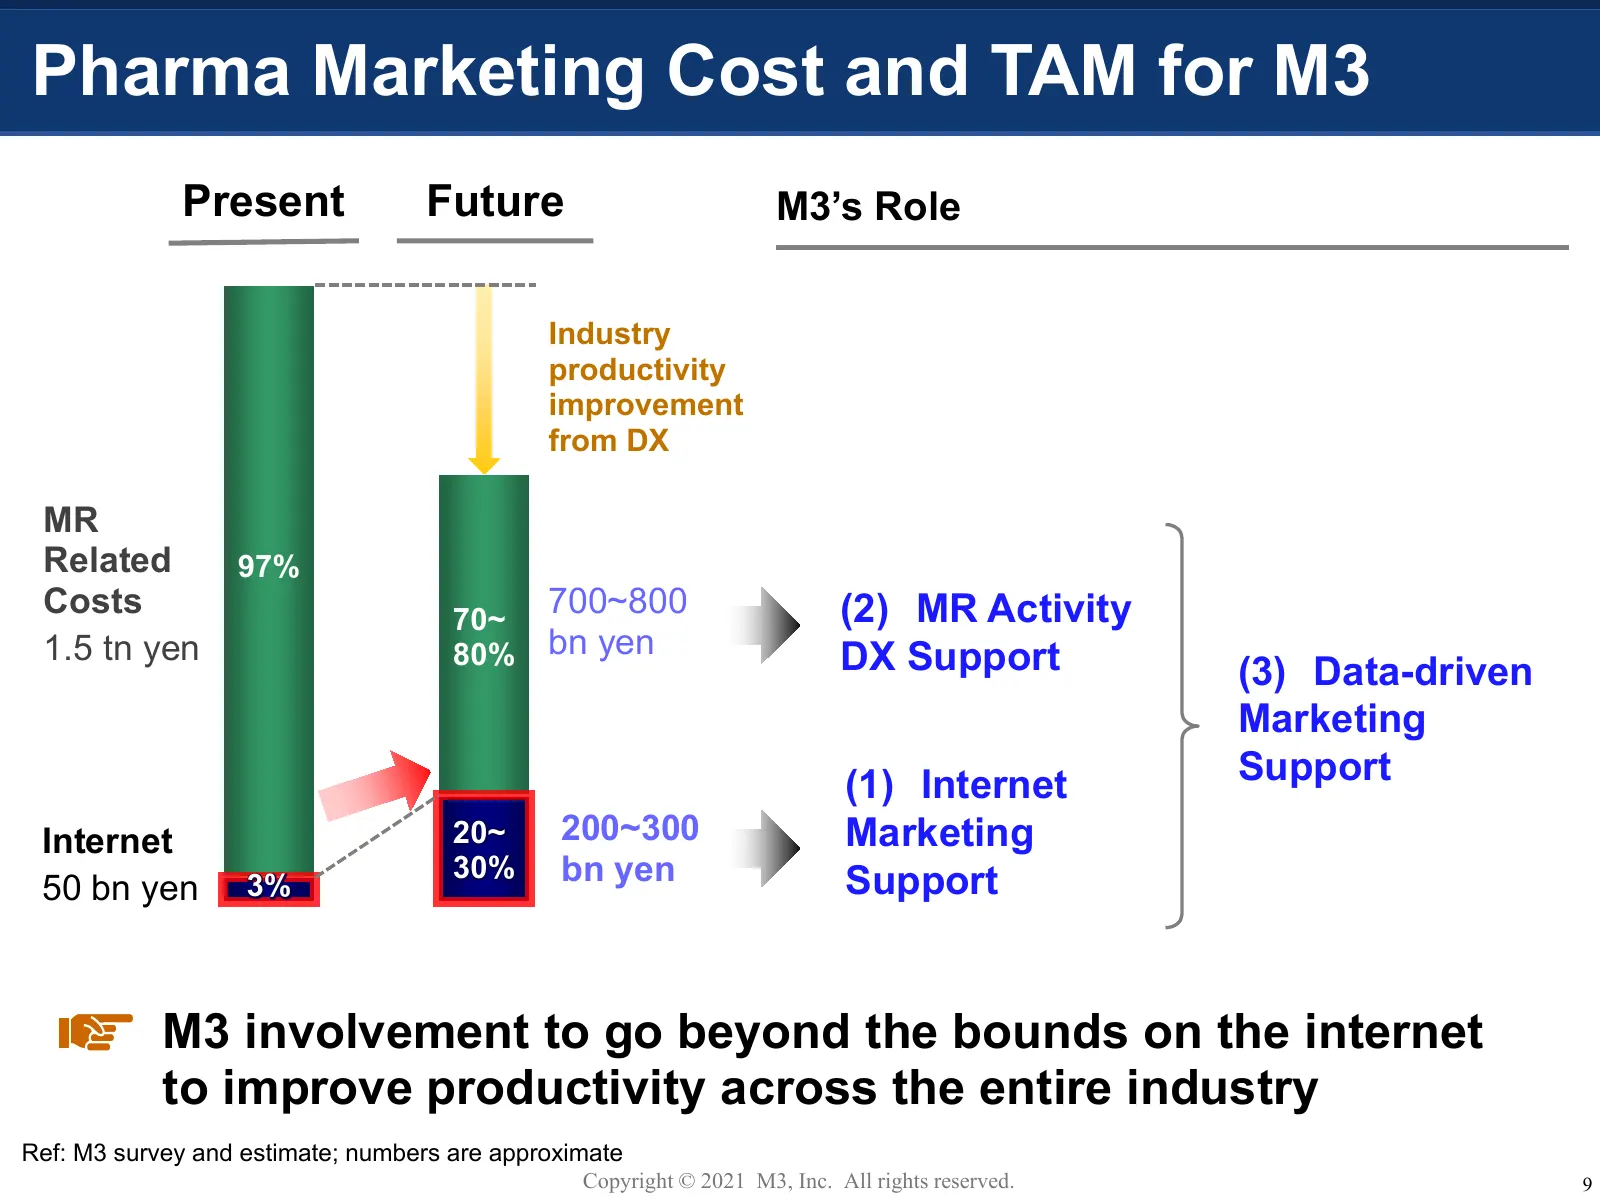
Pharma Marketing Cost and TAM for M3 Present Future M3’s Role Industry productivity improvement from DX MR Related 97% Costs 70~ 700~800 (2) MR Activity 1.5 tn yen 80% bn yen DX Support (3) Data-driven Marketing (1) Internet Support Internet 20~ 200~300 Marketing 30% bn yen Support 50 bn yen 3% M3 i
Slide 11: Pharmaceutical Marketing Service Orders Growth
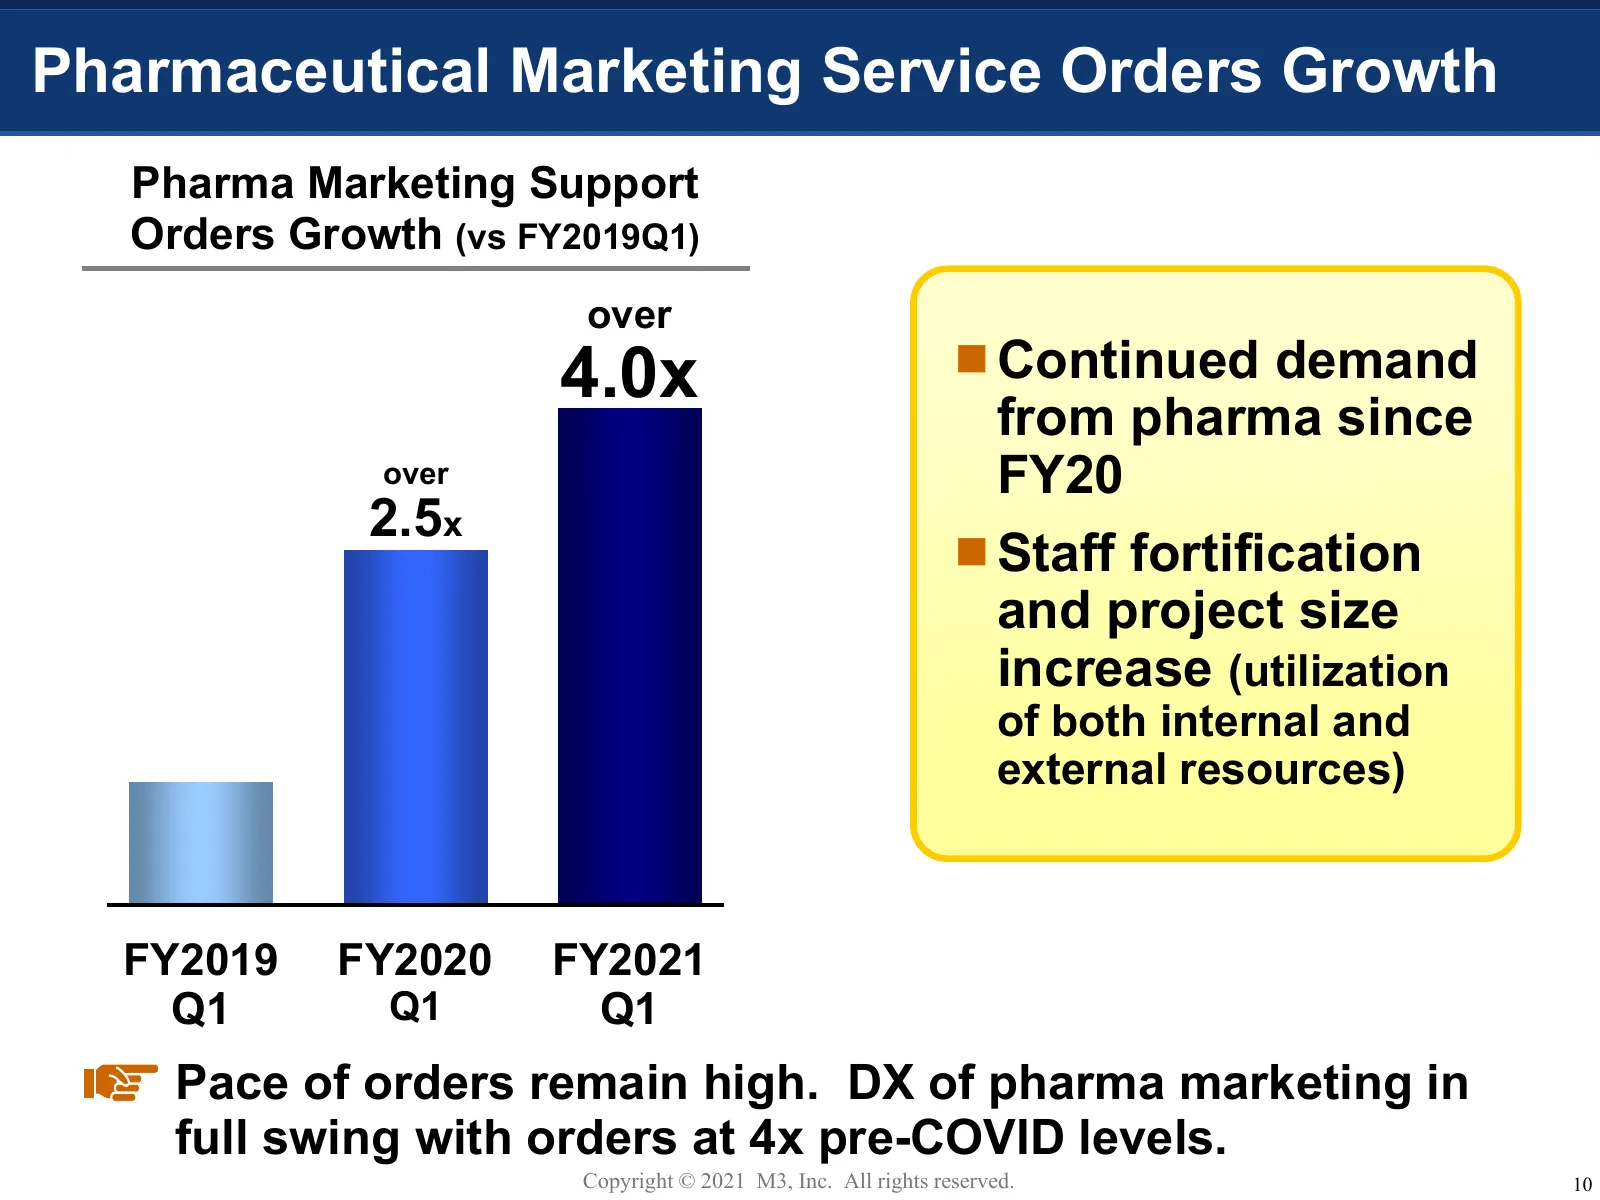
Pharmaceutical Marketing Service Orders Growth Pharma Marketing Support Orders Growth (vs FY2019Q1) over 4.0x Continued demand from pharma since over FY20 2.5x Staff fortification and project size increase (utilization of both internal and external resources) FY2019 FY2020 FY2021 Q1 Q1 Q1 Pace of
Slide 12: eCSO: Medical Marketers
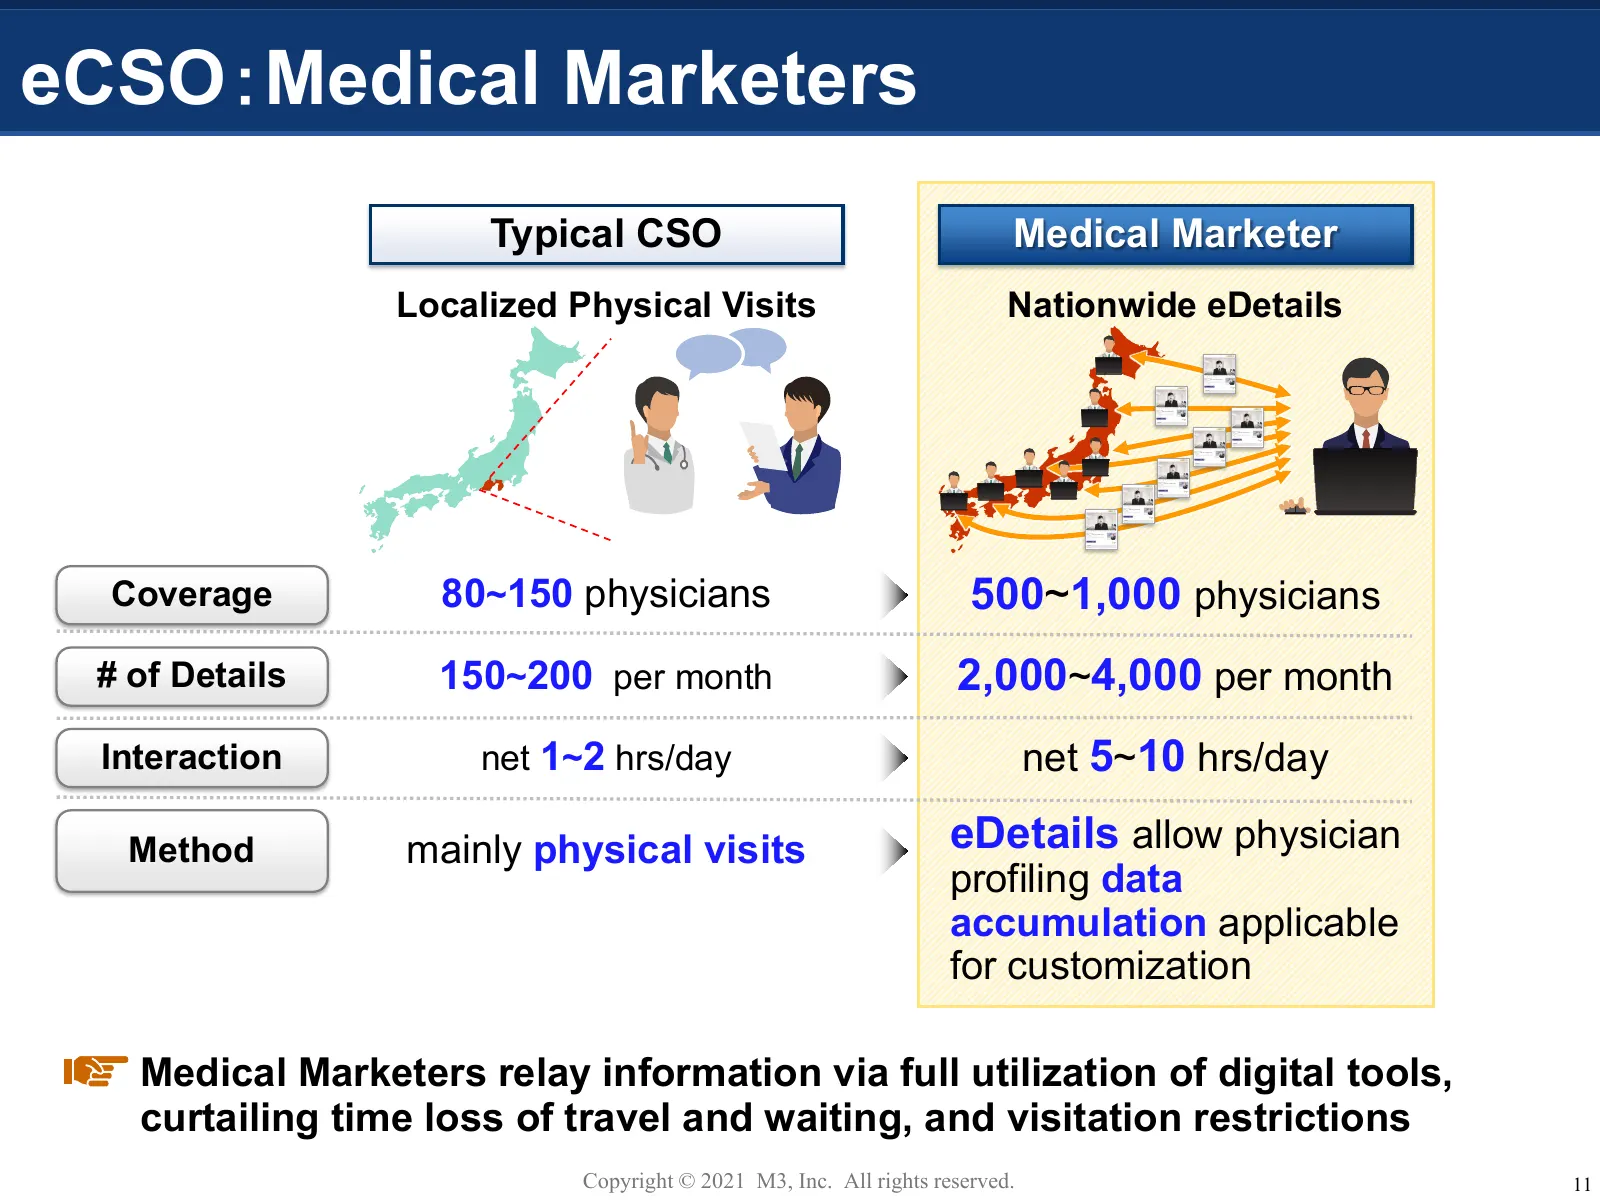
eCSO:Medical Marketers Typical CSO Medical Marketer Localized Physical Visits Nationwide eDetails Coverage 80~150 physicians 500~1,000 physicians # of Details 150~200 per month 2,000~4,000 per month Interaction net 1~2 hrs/day net 5~10 hrs/day Method mainly physical visits eDetails allow physician p
Slide 13: COVID-19 Related Projects
COVID-19 Related Projects Copyright © 2021 M3, Inc. All rights reserved. 12
Slide 14: M3's COVID-19 Efforts
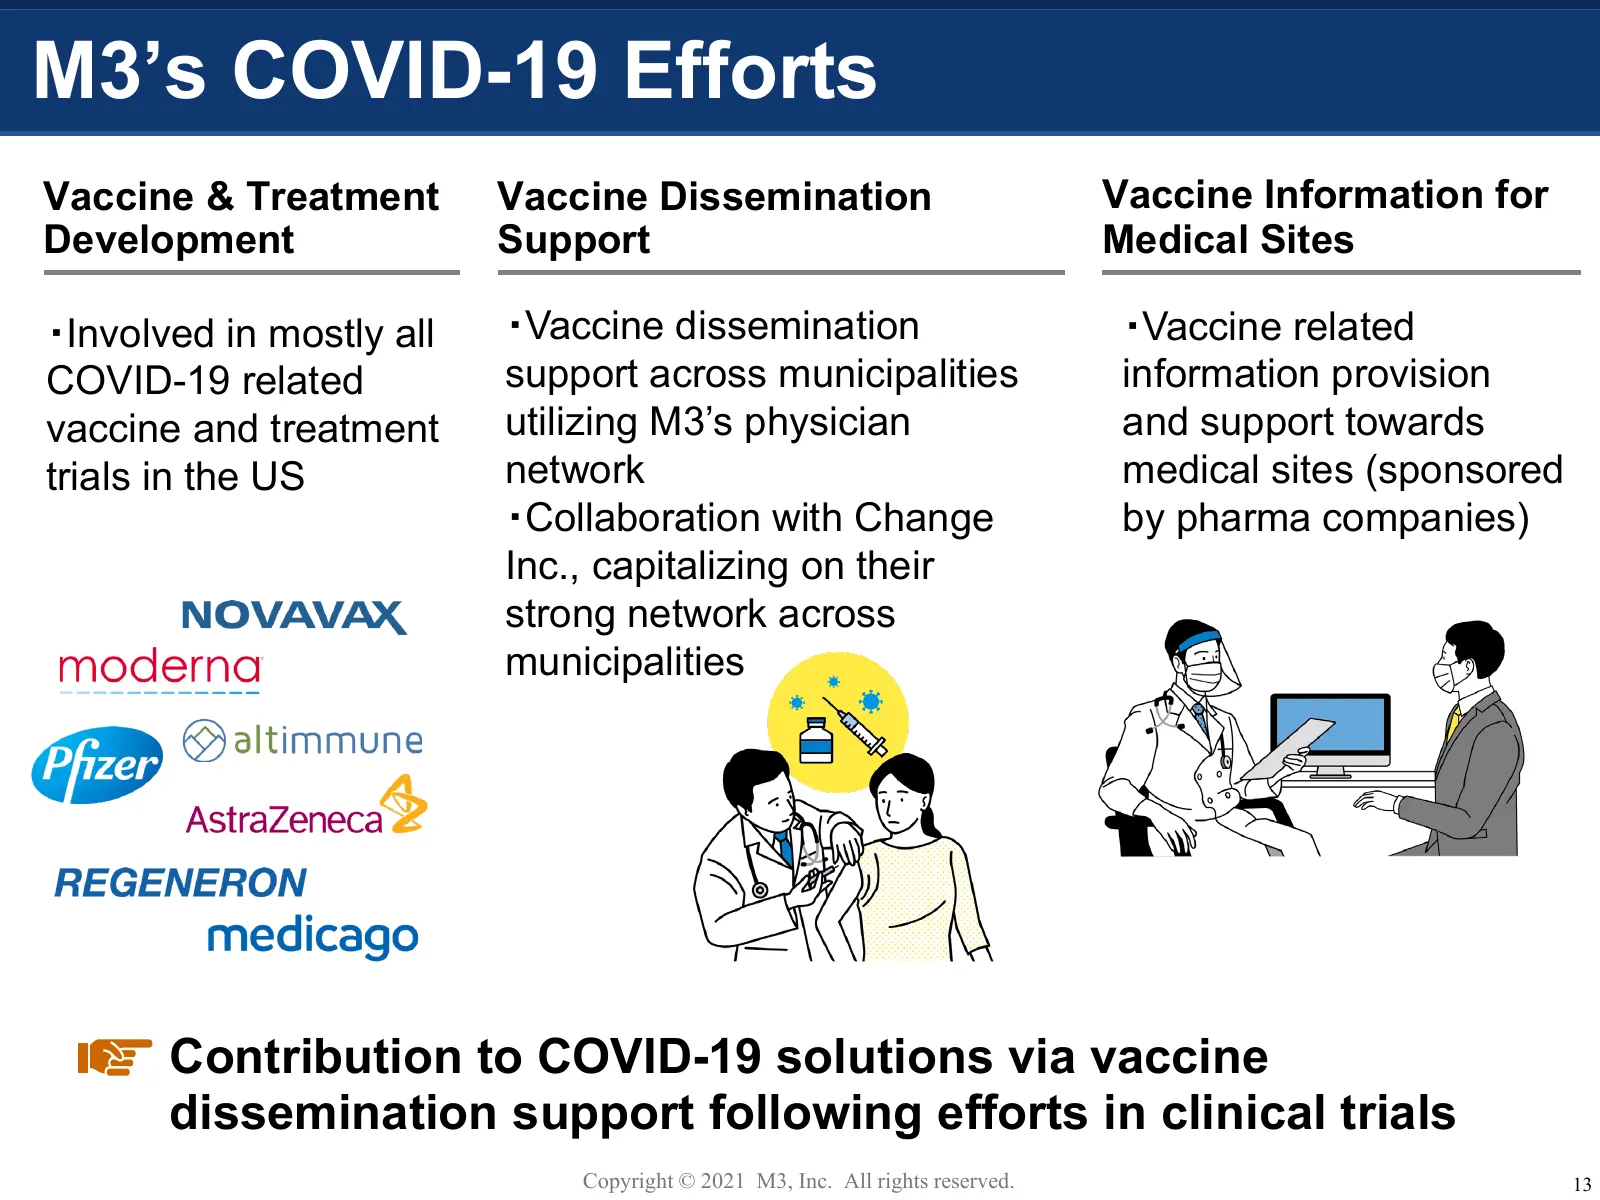
M3’s COVID-19 Efforts Vaccine & Treatment Vaccine Dissemination Vaccine Information for Development Support Medical Sites ・Involved in mostly all ・Vaccine dissemination ・Vaccine related COVID-19 related support across municipalities information provision vaccine and treatment utilizing M3’s physicia
Slide 15: Vaccine Administration Support
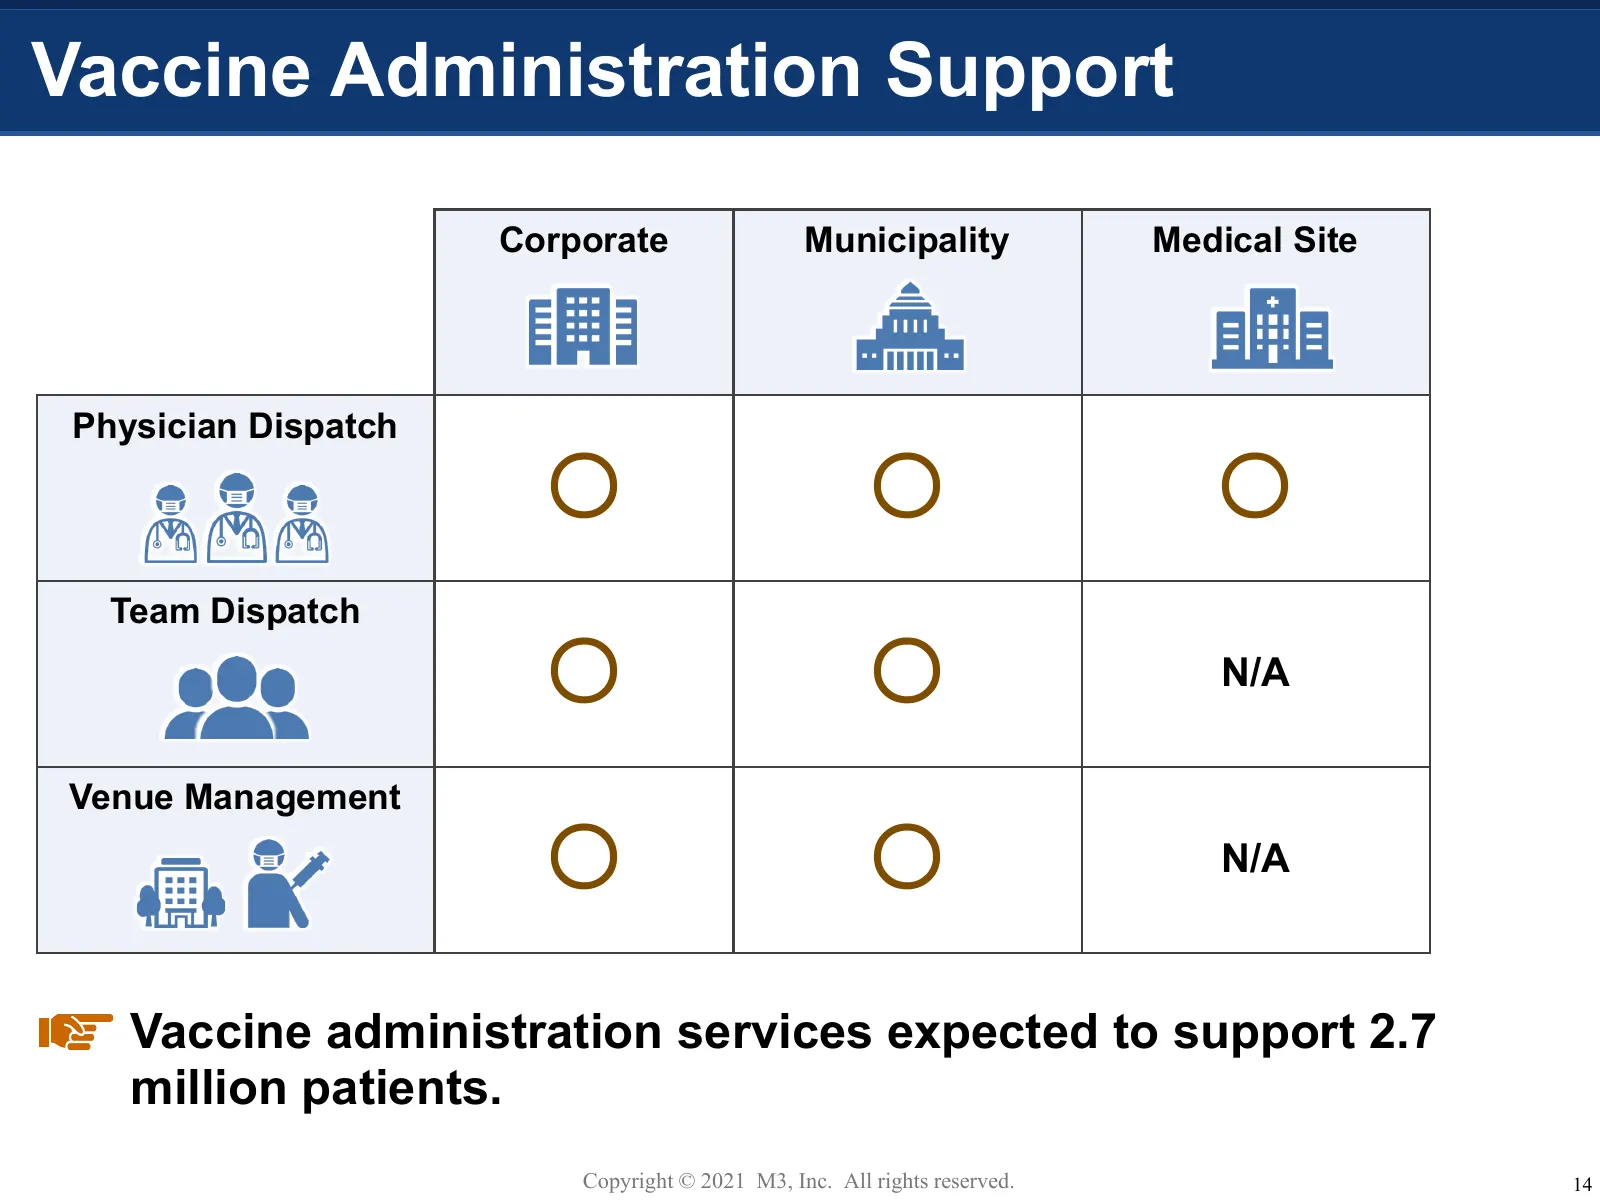
Vaccine Administration Support Corporate Municipality Medical Site Physician Dispatch ○ ○ ○ Team Dispatch ○ ○ N/A Venue Management ○ ○ N/A Vaccine administration services expected to support 2.7 million patients. Copyright © 2021 M3, Inc. All rights reserved. 14
Slide 16: M3 Growth Strategy
M3 Growth Strategy Copyright © 2021 M3, Inc. All rights reserved. 15
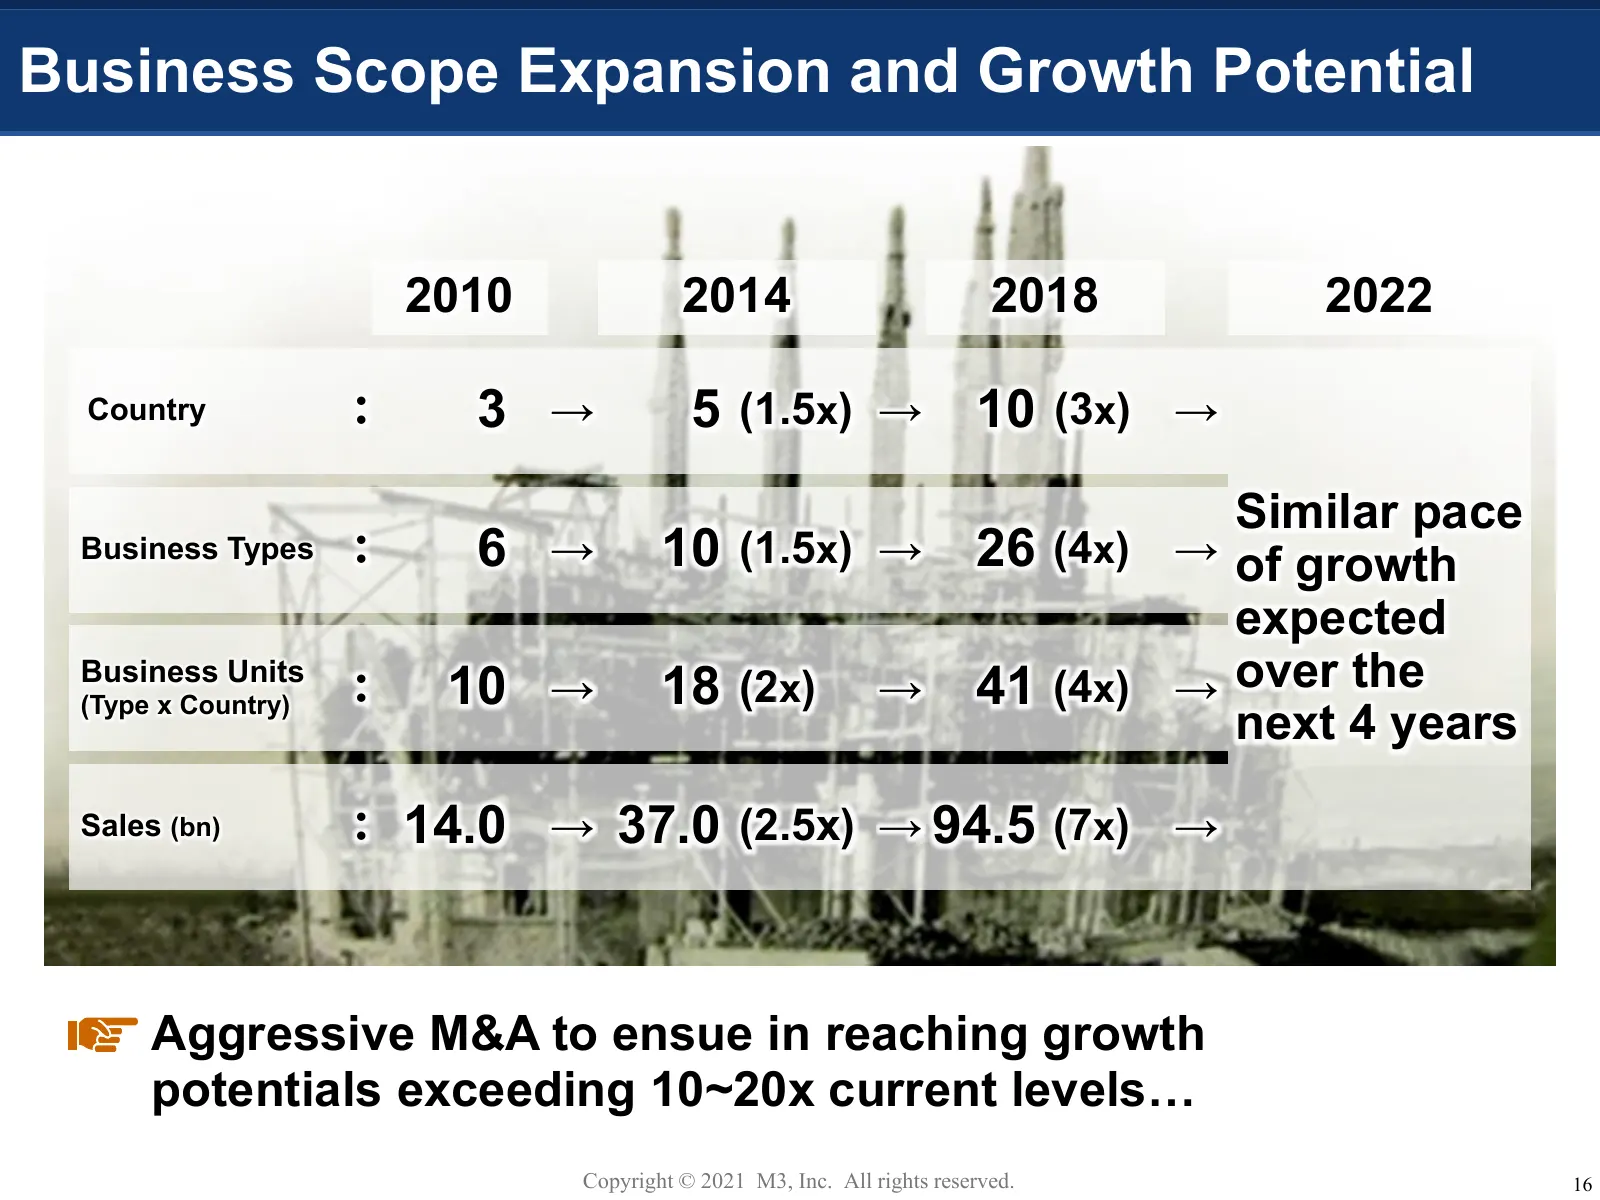
Slide 17: Business Scope Expansion and Growth Potential
Business Scope Expansion and Growth Potential 2010 2014 2018 2022 Country : 3 → 5 (1.5x) → 10 (3x) → Similar pace Business Types : 6 → 10 (1.5x) → 26 (4x) → of growth expected Business Units (Type x Country) : 10 → 18 (2x) → 41 (4x) → over the next 4 years Sales (bn) : 14.0 → 37.0 (2.5x) → 94.5 (7x)
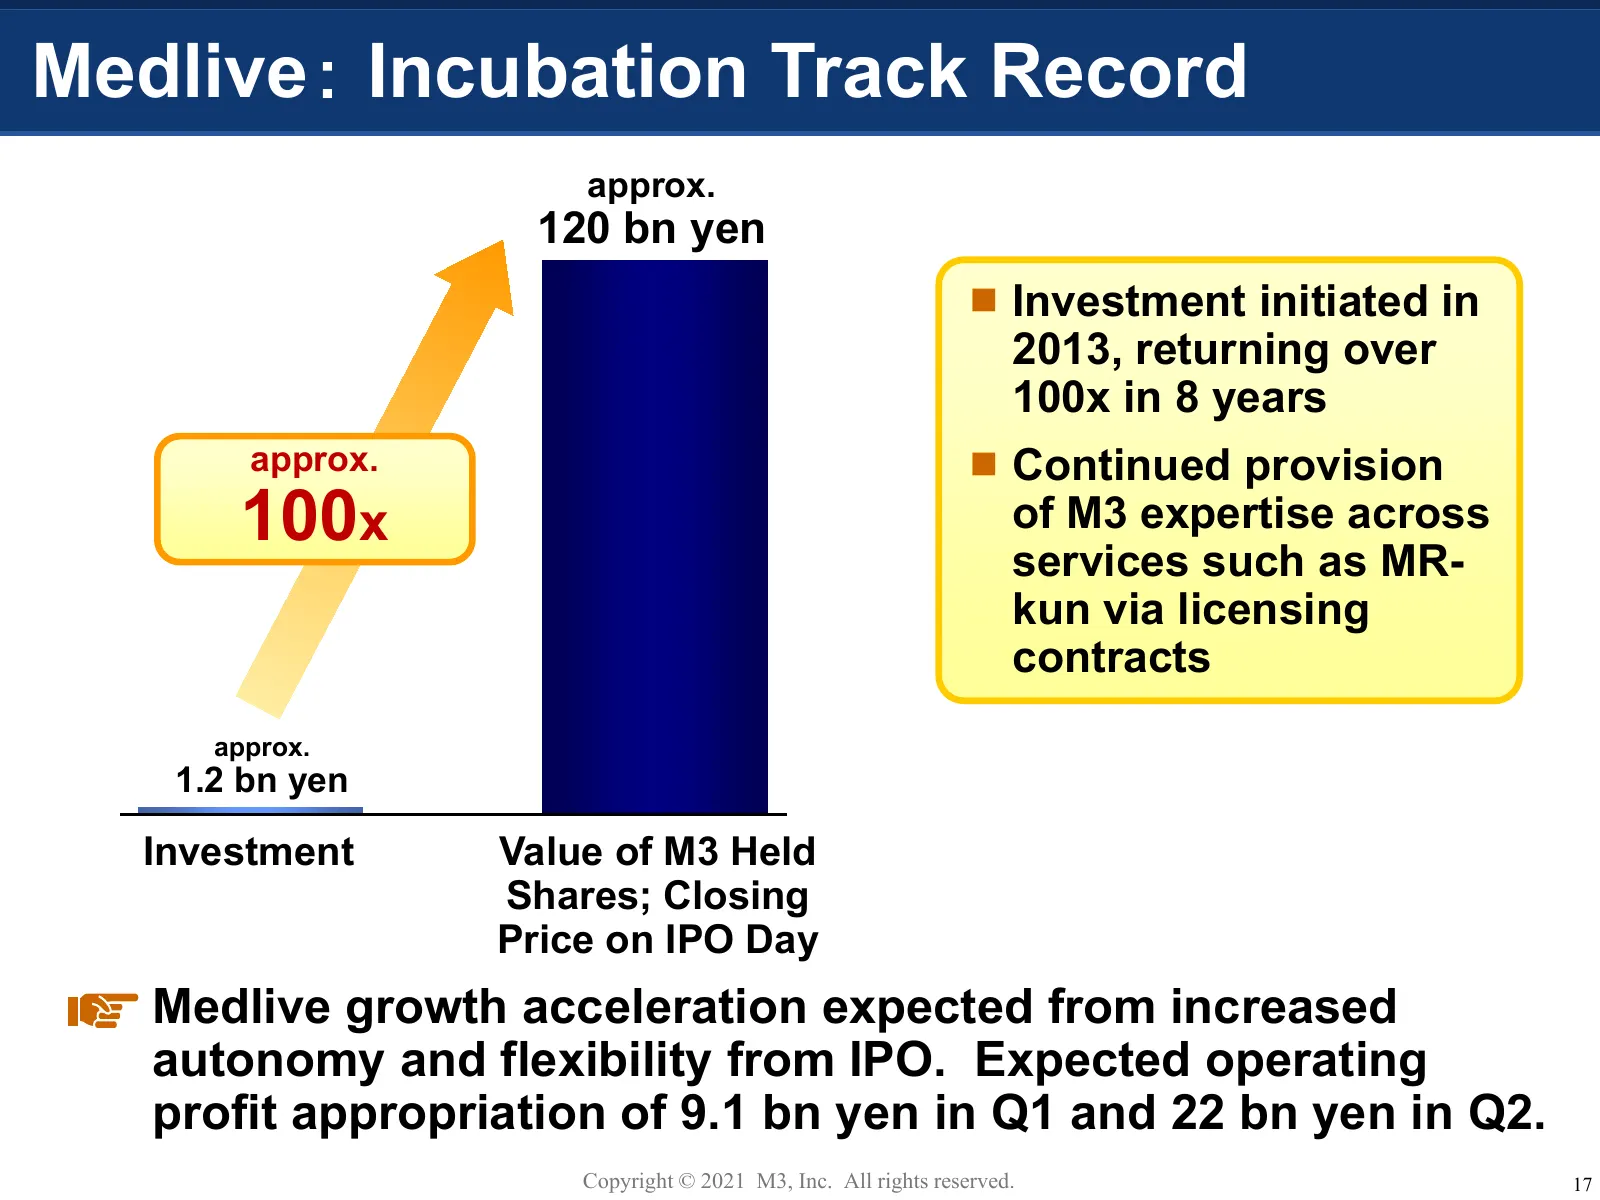
Slide 18: Medlive: Incubation Track Record
Medlive: Incubation Track Record approx. 120 bn yen Investment initiated in 2013, returning over 100x in 8 years approx. Continued provision 100x of M3 expertise across services such as MR- kun via licensing contracts approx. 1.2 bn yen Investment Value of M3 Held Shares; Closing Price on IPO Da
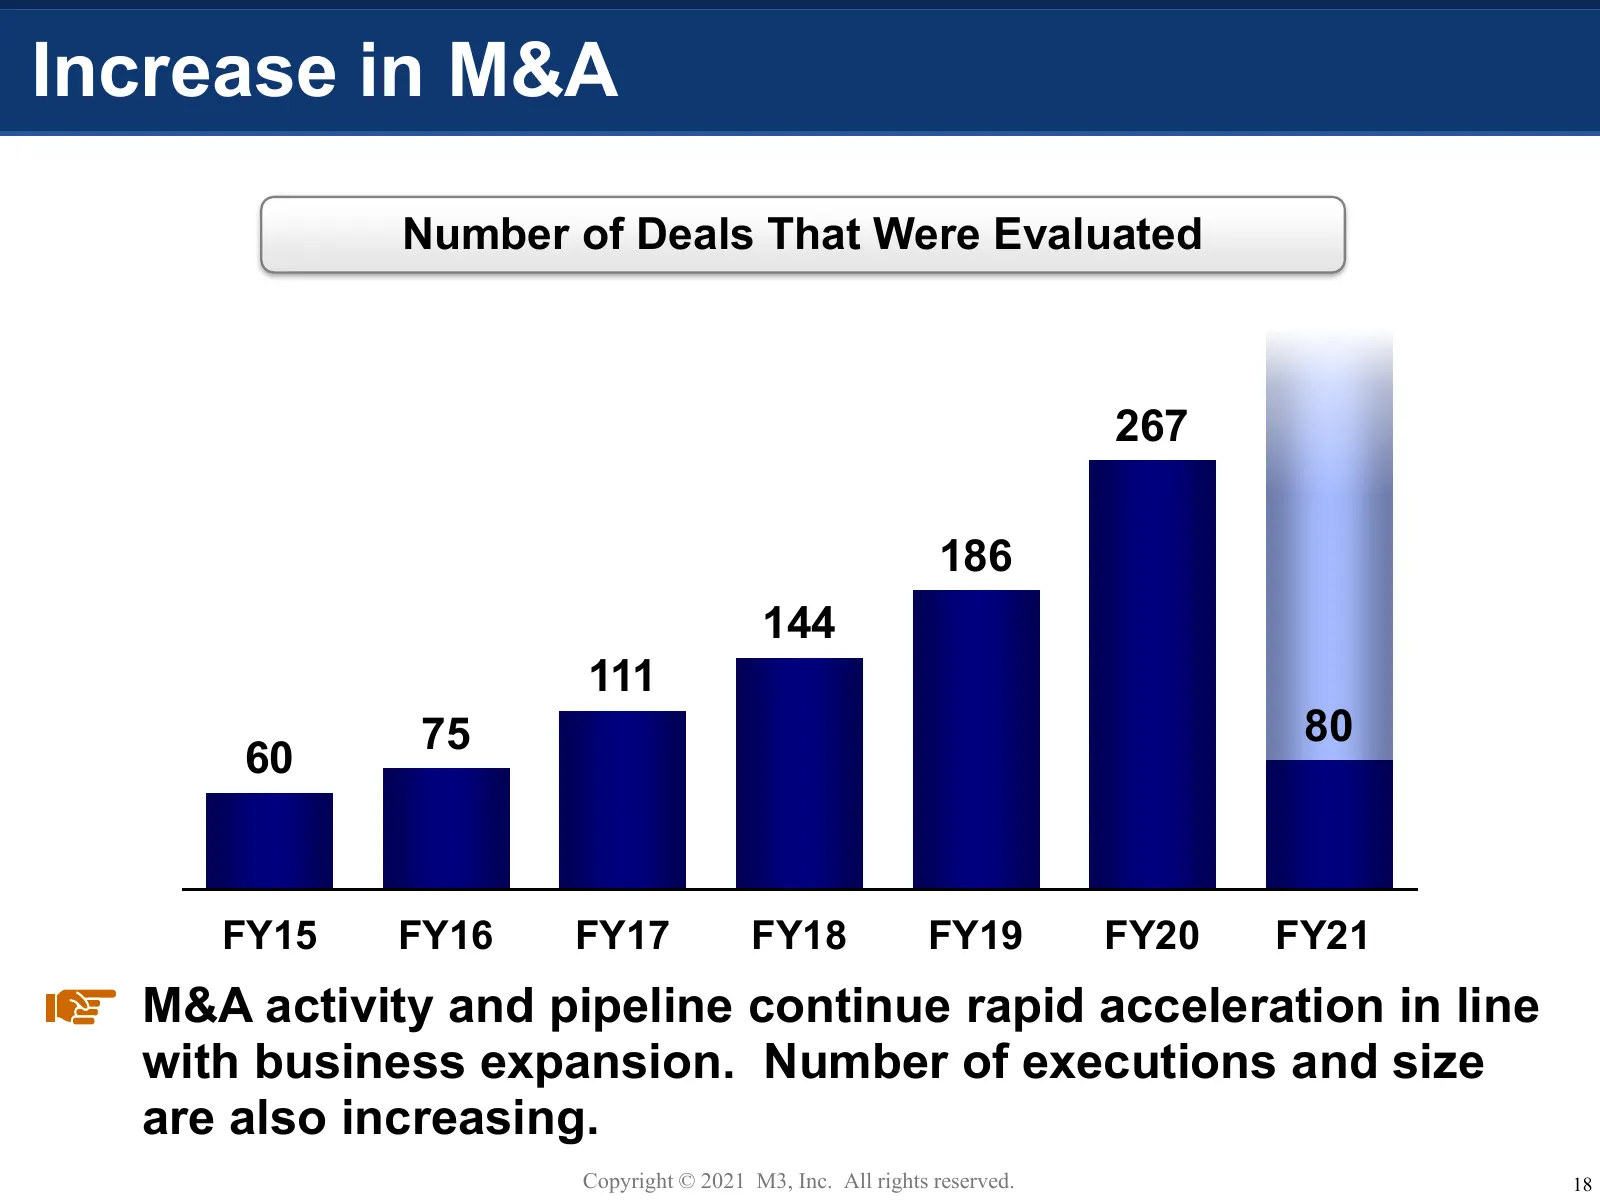
Slide 19: Increase in M&A
Increase in M&A Number of Deals That Were Evaluated 267 186 144 111 75 80 60 FY15 FY16 FY17 FY18 FY19 FY20 FY21 M&A activity and pipeline continue rapid acceleration in line with business expansion. Number of executions and size are also increasing. Copyright © 2021 M3, Inc. All rights reserved. 18
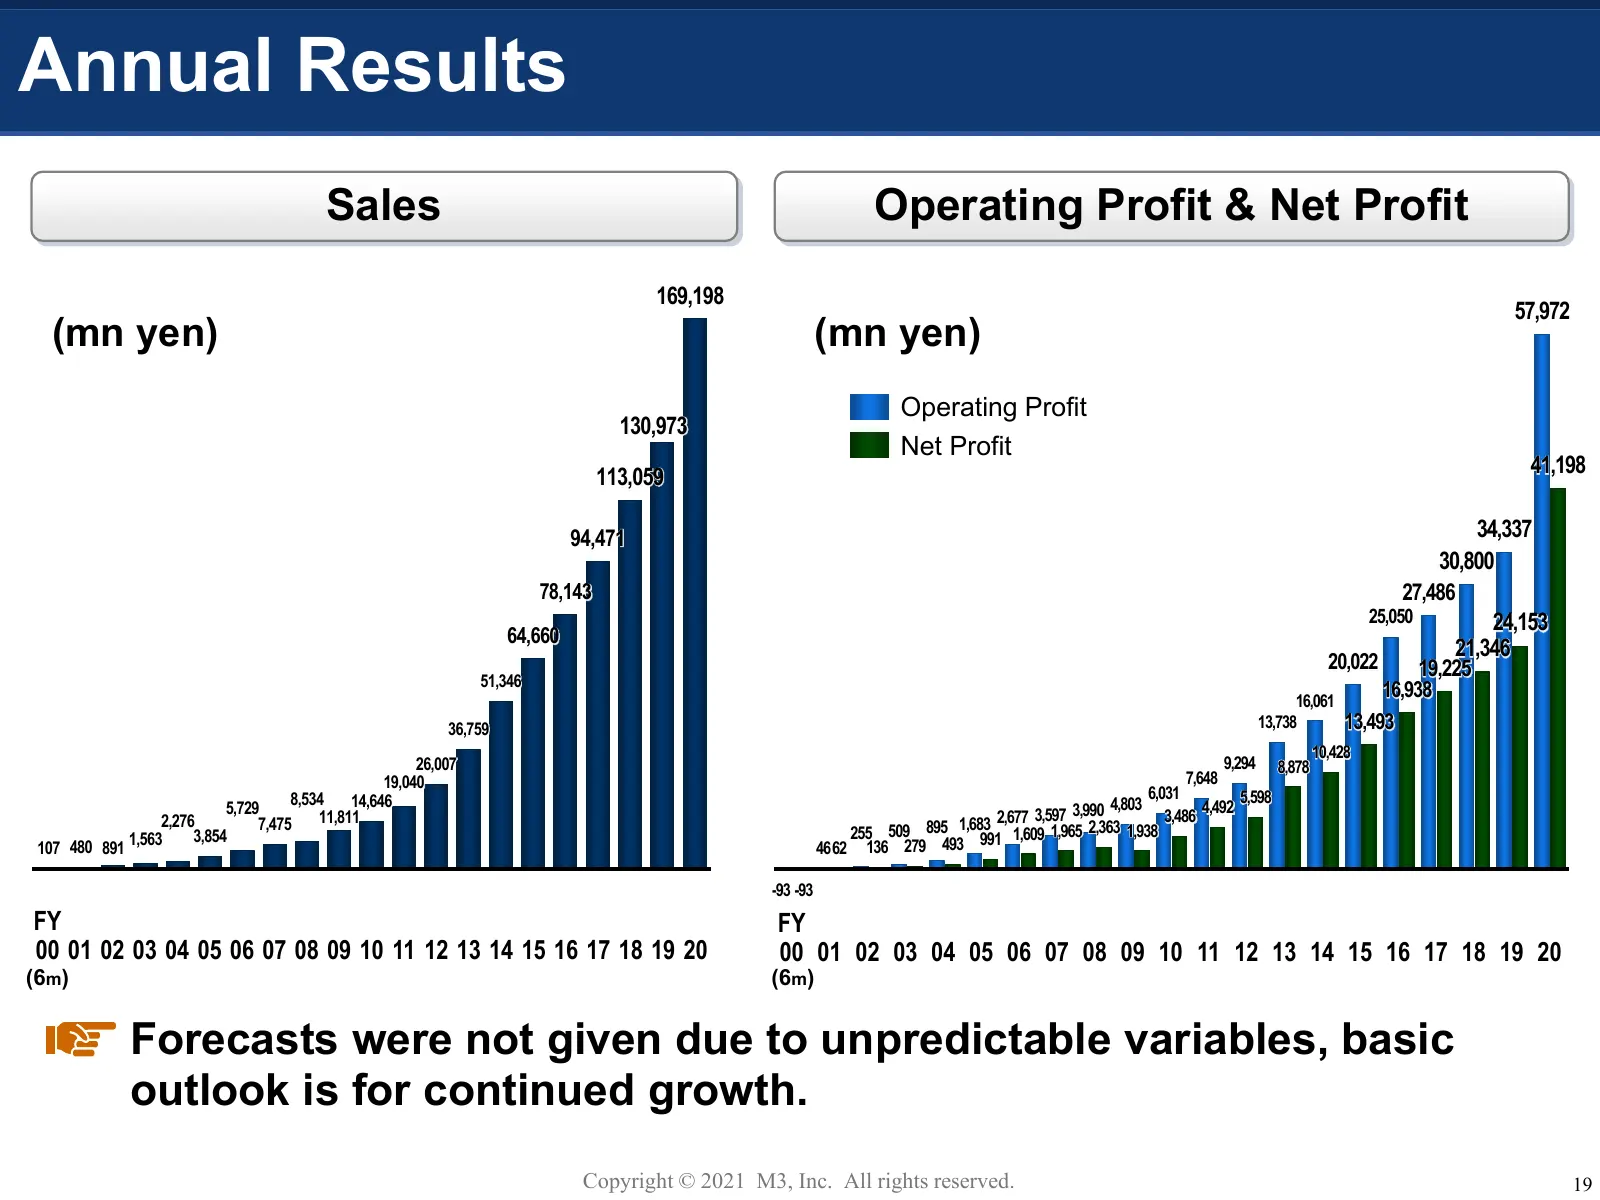
Slide 20: Annual Results
Annual Results Sales Operating Profit & Net Profit 169,198 57,972 (mn yen) (mn yen) Operating Profit 130,973 Net Profit 113,059 41,198 94,471 34,337 30,800 78,143 27,486 25,050 24,153 64,660 21,346 20,022 19,225 51,346 16,061 16,938 36,759 13,738 13,493 10,428 26,007 9,294 8,878 19,040 7,648 8,534 1
Source: Internet Archive copy of corporate.m3.com
More decks from M3, Inc.
 Investor Presentation (November 2026)8 slides · Nov 20, 2026
 H1 FY2026 Earnings Presentation44 slides · Nov 4, 2026
 Q2 FY2026 Earnings Presentation44 slides · Nov 4, 2026
 Q1 FY2026 Earnings Presentation42 slides · Aug 6, 2026
 Merger or Acquisition (June 2026)14 slides · Jun 5, 2026
 FY2025 Earnings Presentation54 slides · May 1, 2026