PetroQuest Energy — Investor Presentation (March 2015)
30 slides from PetroQuest Energy's investor presentation, Mar 9, 2015
Slide 1: PetroQuest Energy, Inc.
oe Energy, Inc.
Slide 2: Forward-Looking Statements
Forward-Looking Statements 2 This presentation contains "forward-looking statements" within the meaning of Section 27A of the Securities Act of 1933, as amended, and Section 21E of the Securities Exchange Act of 1934, as amended. All statements other than statements of historical fact included in th
Slide 3: Navigating the Current Environment
Navigating the Current Environment Flexibility to control capital expenditures Large operated position allows for control of timing of investments - 2015E Capex down 67% from 2014 Majority of acreage is held by production Minimal rig and other contractual commitments Gulf Coast assets gene
Slide 4: 2014 Recap
2014 Recap Proved reserves 34% (Company Record 397 Bcfe) PV-10 27% Production 14% (Company Record 43 Bcfe) Successful drilling programs: De-risked large acreage positions in Woodford and Cotton Valley with excellent drilling results Significant discovery at Thunder Bayou expected to be on-
Slide 5: Our Properties
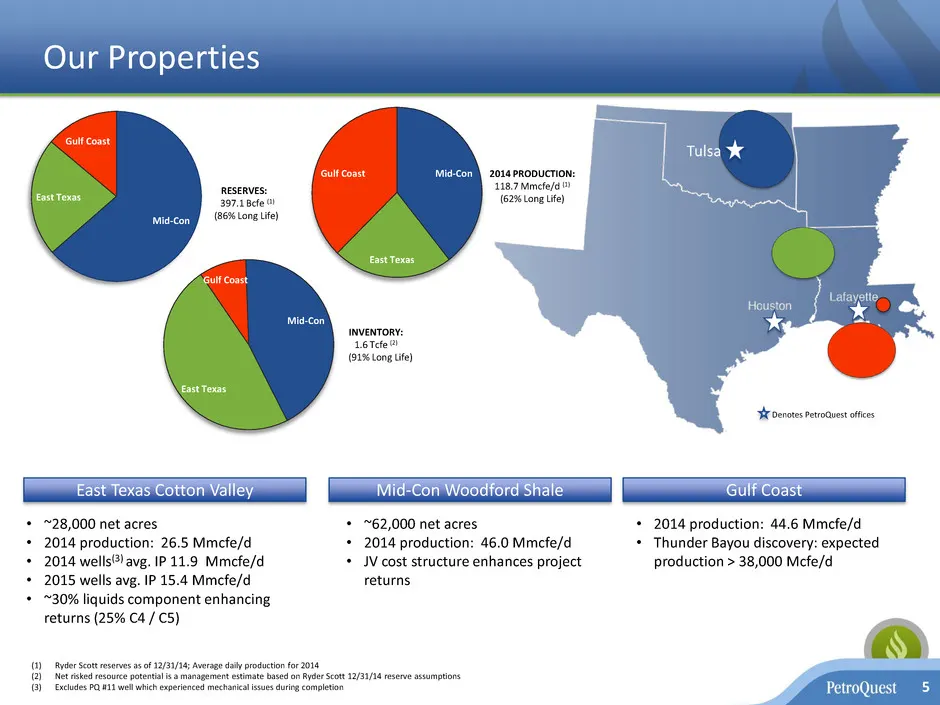
(1) Ryder Scott reserves as of 12/31/14; Average daily production for 2014 (2) Net risked resource potential is a management estimate based on Ryder Scott 12/31/14 reserve assumptions (3) Excludes PQ #11 well which experienced mechanical issues during completion Our Properties 5 Mid-Con East Texas G
Slide 6: Industry Activity - Cotton Valley Trend
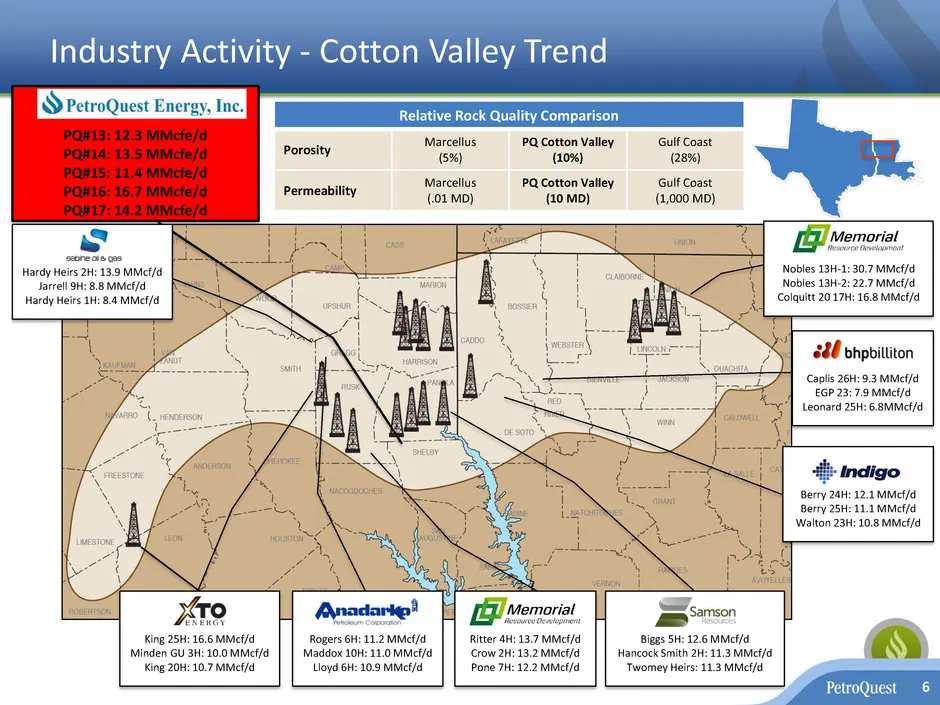
Industry Activity - Cotton Valley Trend 6 Caplis 26H: 9.3 MMcf/d EGP 23: 7.9 MMcf/d Leonard 25H: 6.8MMcf/d Nobles 13H-1: 30.7 MMcf/d Nobles 13H-2: 22.7 MMcf/d Colquitt 20 17H: 16.8 MMcf/d Berry 24H: 12.1 MMcf/d Berry 25H: 11.1 MMcf/d Walton 23H: 10.8 MMcf/d PQ#13: 12.3 MMcfe/d PQ#14: 13.5 MMcfe/d PQ
Slide 7: Cotton Valley Horizontal – Horizontal Uplift
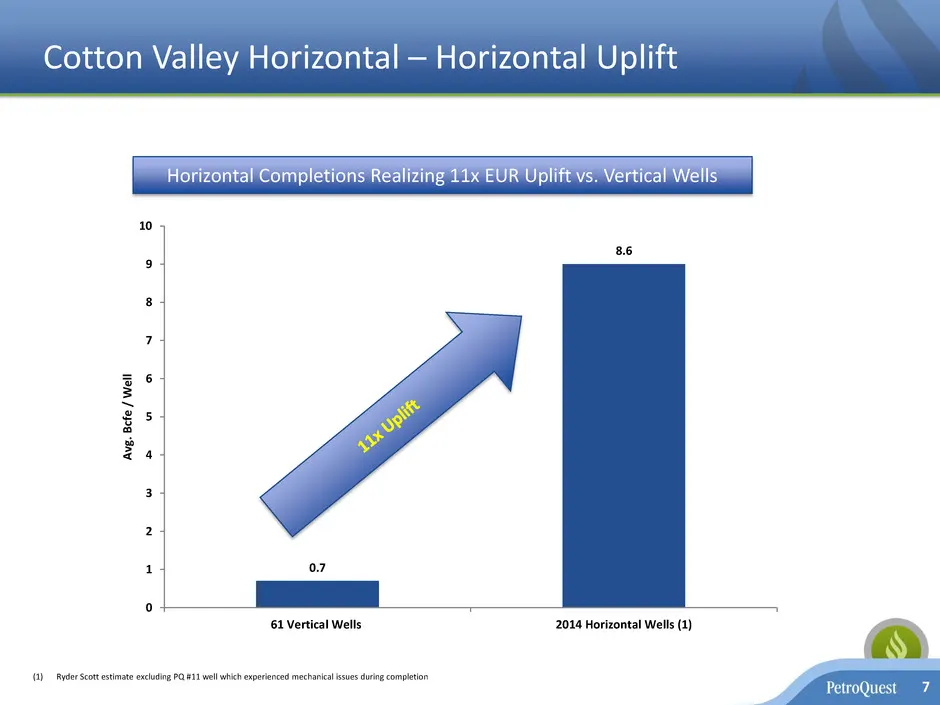
Cotton Valley Horizontal – Horizontal Uplift 7 Horizontal Completions Realizing 11x EUR Uplift vs. Vertical Wells (1) Ryder Scott estimate excluding PQ #11 well which experienced mechanical issues during completion 0.7 8.6 0 1 2 3 4 5 6 7 8 9 10 61 Vertical Wells 2014 Horizontal Wells (1) A vg . B c
Slide 8: Cotton Valley Horizontal – Moving Up the Curve
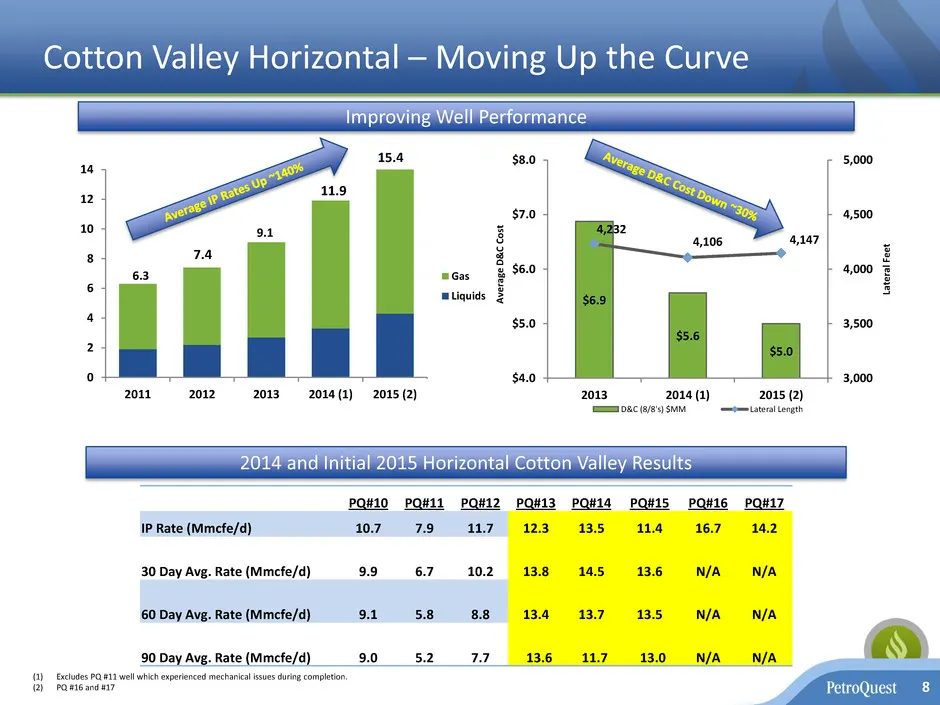
Cotton Valley Horizontal – Moving Up the Curve 8 Improving Well Performance (1) Excludes PQ #11 well which experienced mechanical issues during completion. (2) PQ #16 and #17 2014 and Initial 2015 Horizontal Cotton Valley Results $6.9 $5.6 $5.0 4,232 4,106 4,147 3,000 3,500 4,000 4,500 5,000 $4.0 $5
Slide 9: Cotton Valley Horizontal Economics
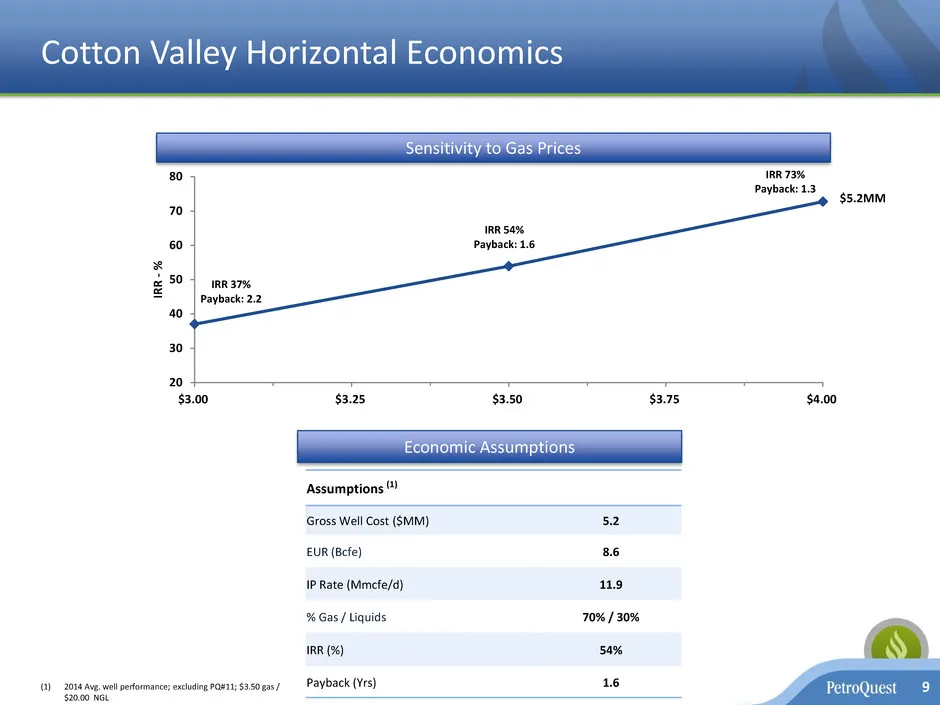
Cotton Valley Horizontal Economics 9 Assumptions (1) Gross Well Cost ($MM) 5.2 EUR (Bcfe) 8.6 IP Rate (Mmcfe/d) 11.9 % Gas / Liquids 70% / 30% IRR (%) 54% Payback (Yrs) 1.6 (1) 2014 Avg. well performance; excluding PQ#11; $3.50 gas / $20.00 NGL Sensitivity to Gas Prices 0 2000 4000 6000 8000 10000 1
Slide 10: Cotton Valley Horizontal Planned Activity and Inventory
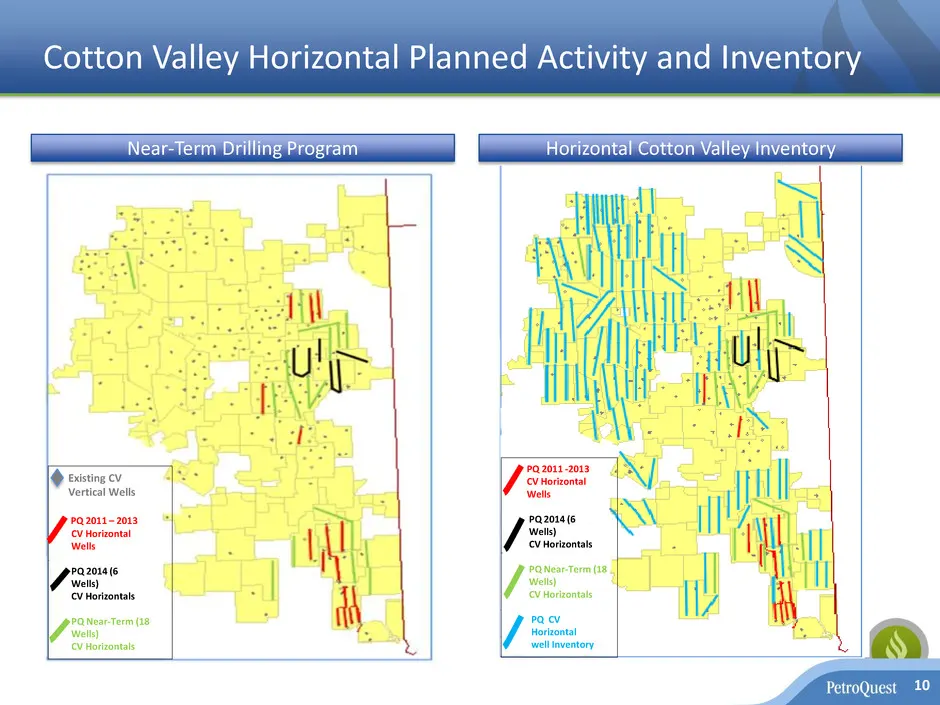
E. TX - N. LA - East Texas and Nort Louisiana FEET 0 2,496 PETRA 7/15/2014 11:27:20 AM Cotton Valley Horizontal Planned Activity and Inventory 10 PQ 2015 (18 wells) CV Horizontals PQ 2014 (6 wells) CV Horizontals PQ 2011 – 2013 CV Horizontal Wells Near-Term Drilling Program Horizontal Cotton Valley
Slide 11: Cotton Valley Drilling to Unlock NAV
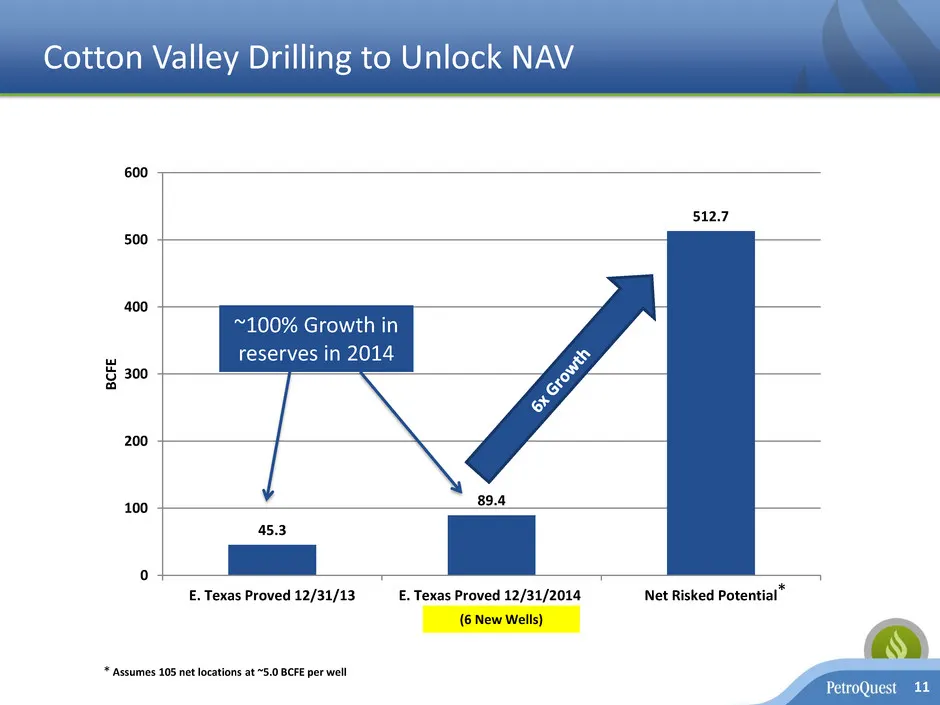
Cotton Valley Drilling to Unlock NAV 11 45.3 89.4 512.7 0 100 200 300 400 500 600 E. Texas Proved 12/31/13 E. Texas Proved 12/31/2014 Net Risked Potential BCF E (6 New Wells) ~100% Growth in reserves in 2014 * * Assumes 105 net locations at ~5.0 BCFE per well
Slide 12: Gulf Coast – Free Cash Flow Generator
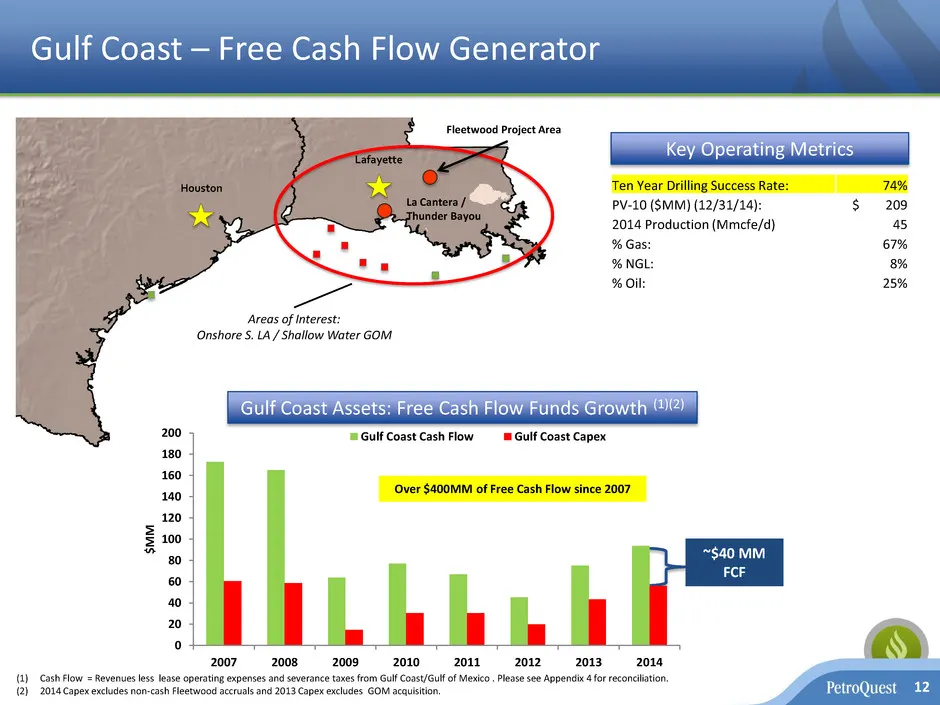
Gulf Coast – Free Cash Flow Generator 12 Houston Lafayette Areas of Interest: Onshore S. LA / Shallow Water GOM Key Operating Metrics Fleetwood Project Area (1) Cash Flow = Revenues less lease operating expenses and severance taxes from Gulf Coast/Gulf of Mexico . Please see Appendix 4 for reconcili
Slide 13: LaCantera/Thunder Bayou Deeper Pool Tests
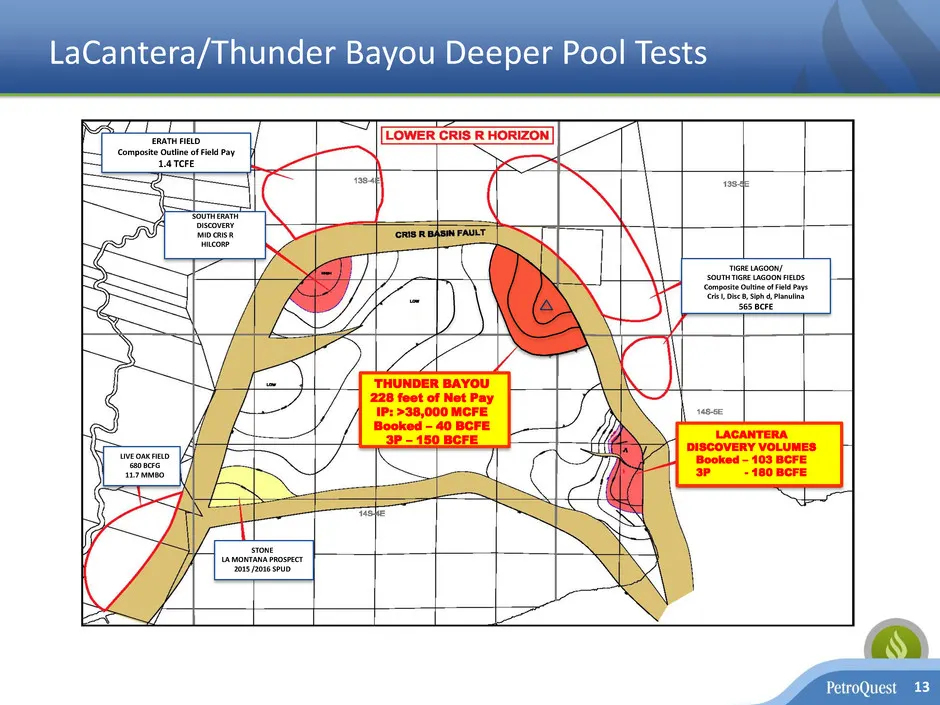
LaCantera/Thunder Bayou Deeper Pool Tests 13 ERATH FIELD Composite Outline of Field Pay 1.4 TCFE SOUTH ERATH DISCOVERY MID CRIS R HILCORP LIVE OAK FIELD 680 BCFG 11.7 MMBO STONE LA MONTANA PROSPECT 2015 /2016 SPUD LACANTERA DISCOVERY VOLUMES Booked – 103 BCFE 3P - 180 BCFE TIGRE LAGOON/ SOUTH TIGRE
Slide 14: Fleetwood JV Overview
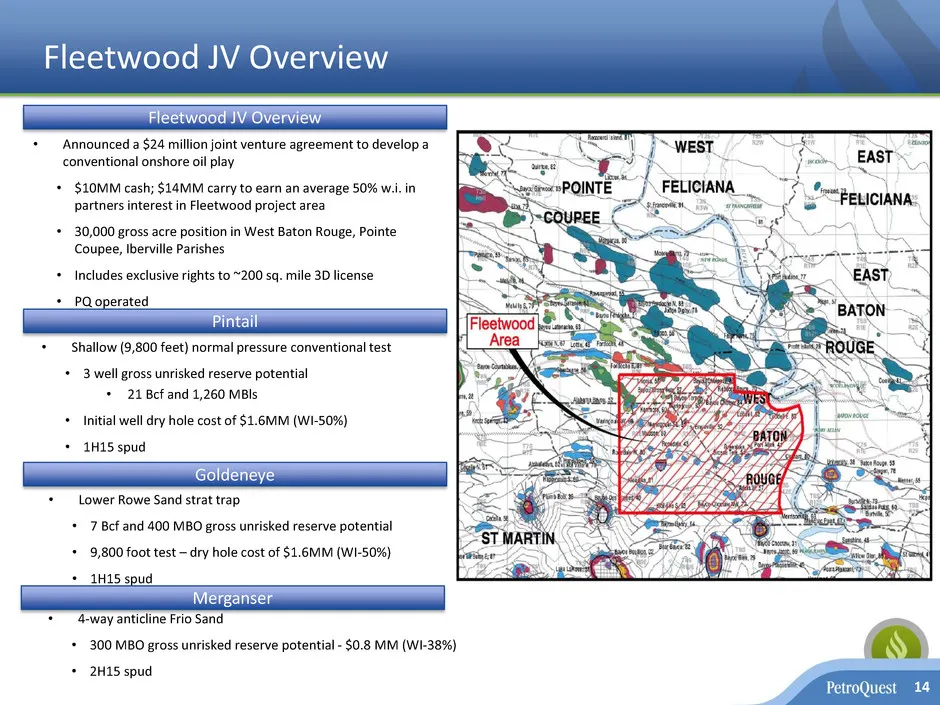
Fleetwood JV Overview • Announced a $24 million joint venture agreement to develop a conventional onshore oil play • $10MM cash; $14MM carry to earn an average 50% w.i. in partners interest in Fleetwood project area • 30,000 gross acre position in West Baton Rouge, Pointe Coupee, Iberville Parishes
Slide 15: Woodford Position – Ramping Up Development
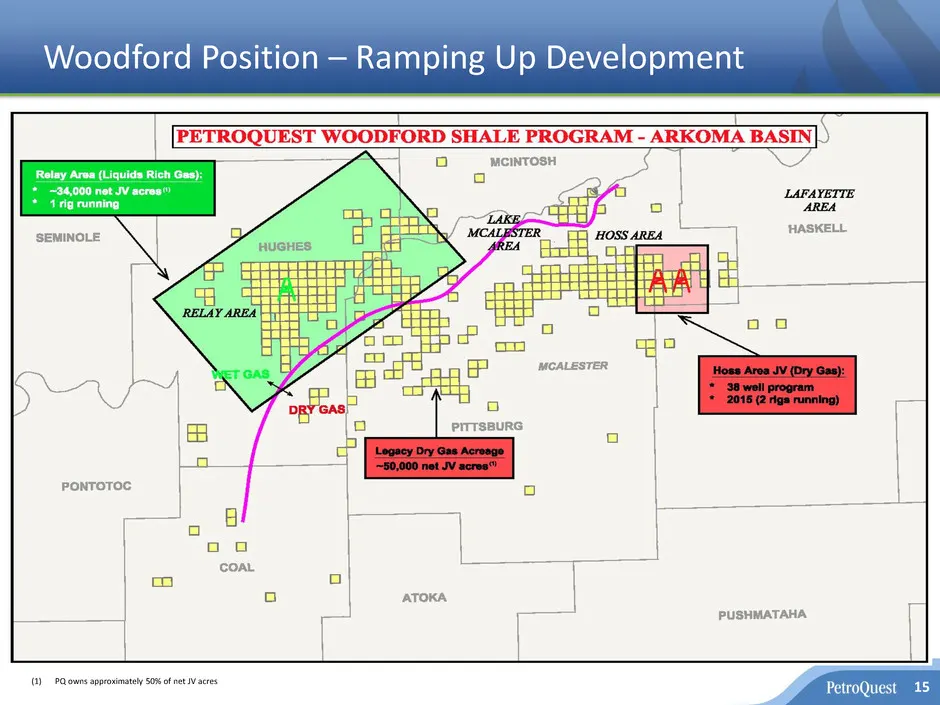
Woodford Position – Ramping Up Development 15 (1) PQ owns approximately 50% of net JV acres
Slide 16: Woodford Liquids Rich Gas – West Relay Field
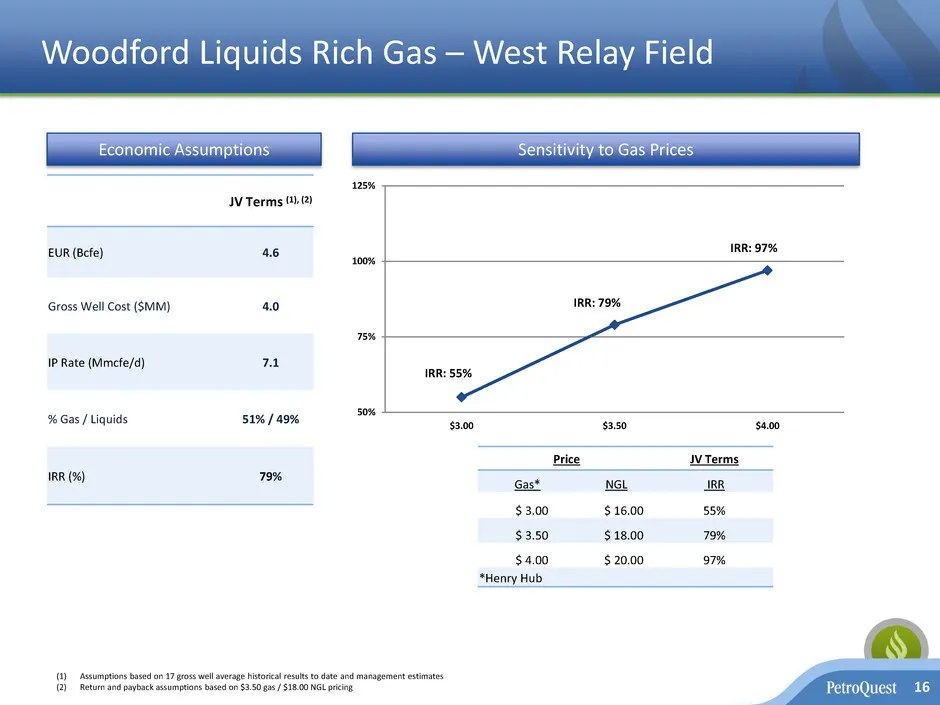
Woodford Liquids Rich Gas – West Relay Field 16 Price JV Terms Gas* NGL IRR $ 3.00 $ 16.00 55% $ 3.50 $ 18.00 79% $ 4.00 $ 20.00 97% *Henry Hub JV Terms (1), (2) EUR (Bcfe) 4.6 Gross Well Cost ($MM) 4.0 IP Rate (Mmcfe/d) 7.1 % Gas / Liquids 51% / 49% IRR (%) 79% Sensitivity to Gas Prices 50% 75% 100
Slide 17: Liquidity Metrics and Leverage
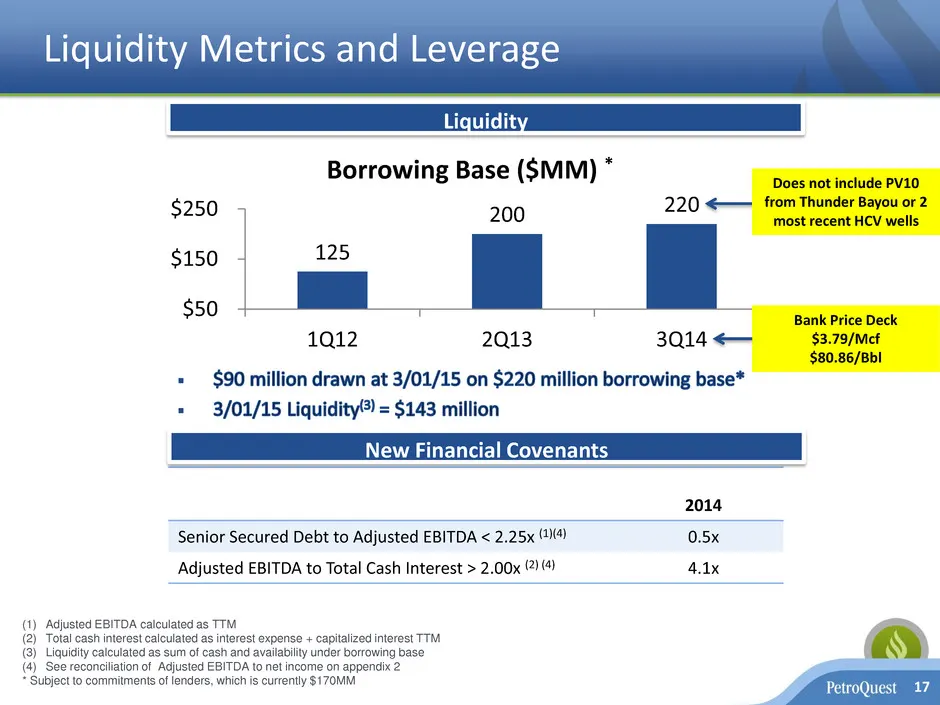
Liquidity Metrics and Leverage 17 2014 Senior Secured Debt to Adjusted EBITDA < 2.25x (1)(4) 0.5x Adjusted EBITDA to Total Cash Interest > 2.00x (2) (4) 4.1x (1) Adjusted EBITDA calculated as TTM (2) Total cash interest calculated as interest expense + capitalized interest TTM (3) Liquidity calculat
Slide 18: Strong Track Record of Funding Drilling with Cash Flow
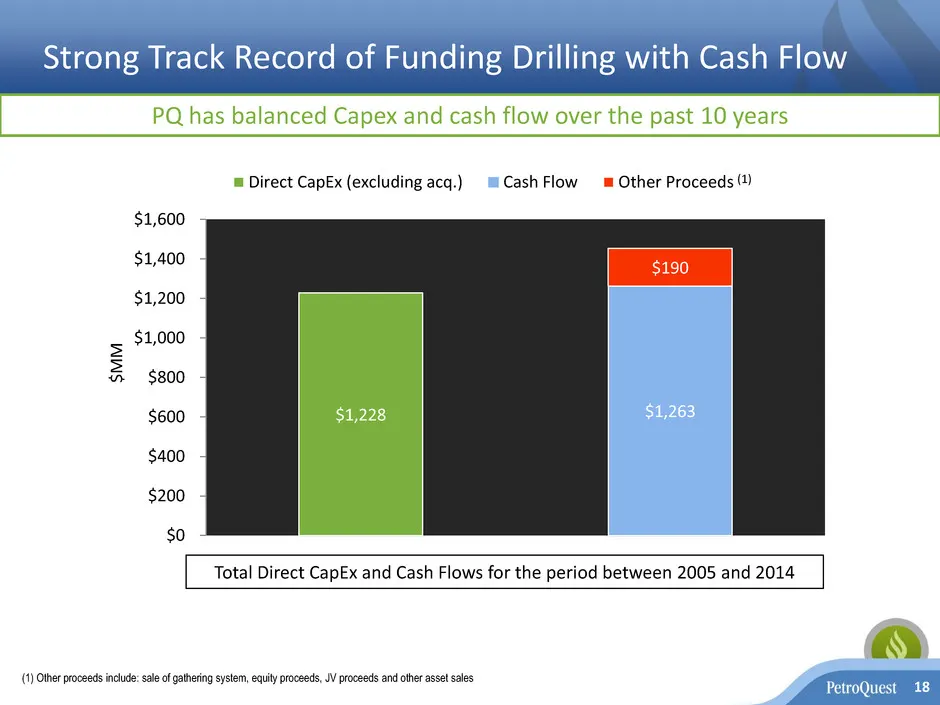
Strong Track Record of Funding Drilling with Cash Flow 18 $ M M Total Direct CapEx and Cash Flows for the period between 2005 and 2014 PQ has balanced Capex and cash flow over the past 10 years (1) (1) Other proceeds include: sale of gathering system, equity proceeds, JV proceeds and other asset sal
Slide 19: Operating & Financial Metrics
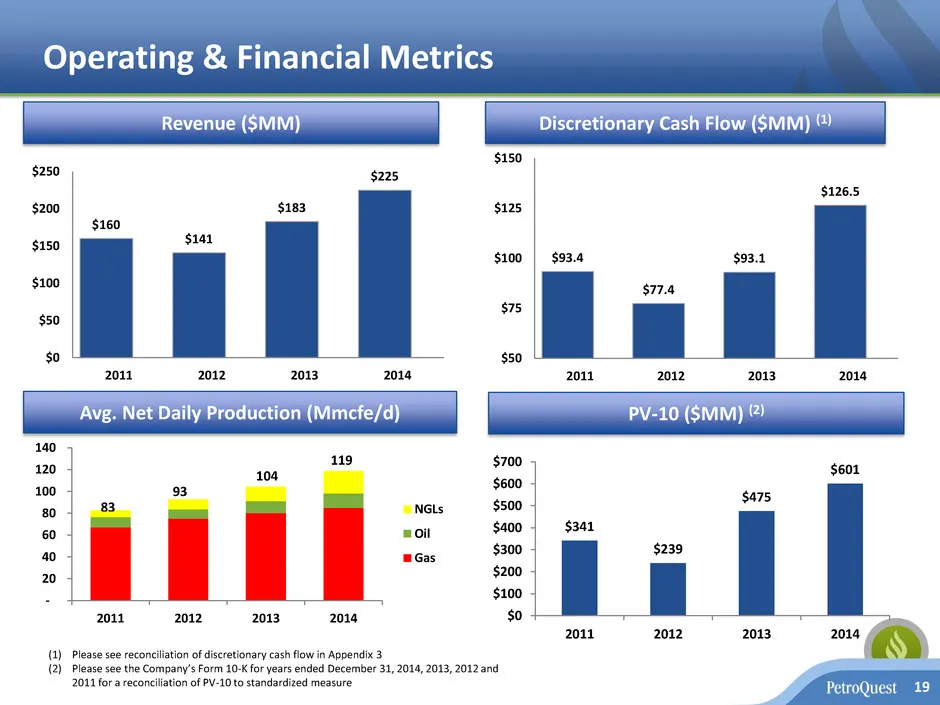
Operating & Financial Metrics $160 $141 $183 $225 $0 $50 $100 $150 $200 $250 2011 2012 2013 2014 Revenue ($MM) Discretionary Cash Flow ($MM) (1) $93.4 $77.4 $93.1 $126.5 $50 $75 $100 $125 $150 2011 2012 2013 2014 Avg. Net Daily Production (Mmcfe/d) PV-10 ($MM) (2) - 20 40 60 80 100 120 140 2011 2012
Slide 20: Summary
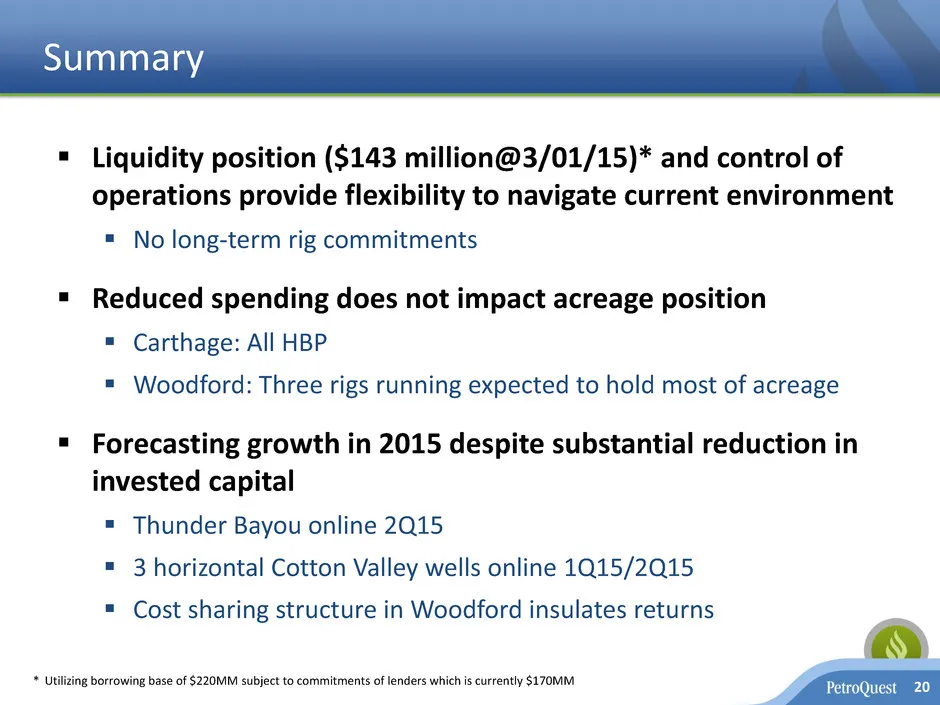
Summary Liquidity position ($143 million@3/01/15)* and control of operations provide flexibility to navigate current environment No long-term rig commitments Reduced spending does not impact acreage position Carthage: All HBP Woodford: Three rigs running expected to hold most of acreage
Slide 21: Appendix
21 Appendix
Slide 22: Appendix - Hedging Positions
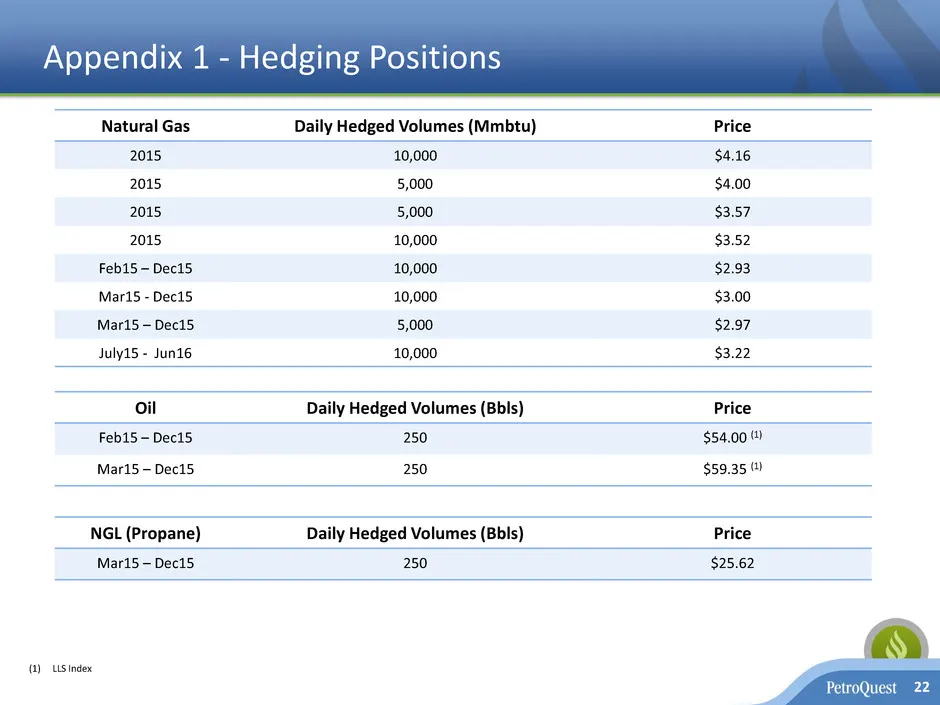
Appendix 1 - Hedging Positions 22 Natural Gas Daily Hedged Volumes (Mmbtu) Price 2015 10,000 $4.16 2015 5,000 $4.00 2015 5,000 $3.57 2015 10,000 $3.52 Feb15 – Dec15 10,000 $2.93 Mar15 - Dec15 10,000 $3.00 Mar15 – Dec15 5,000 $2.97 July15 - Jun16 10,000 $3.22 Oil Daily Hedged Volumes (Bbls) Price Feb
Slide 23: Appendix – Adjusted EBITDA Reconciliation
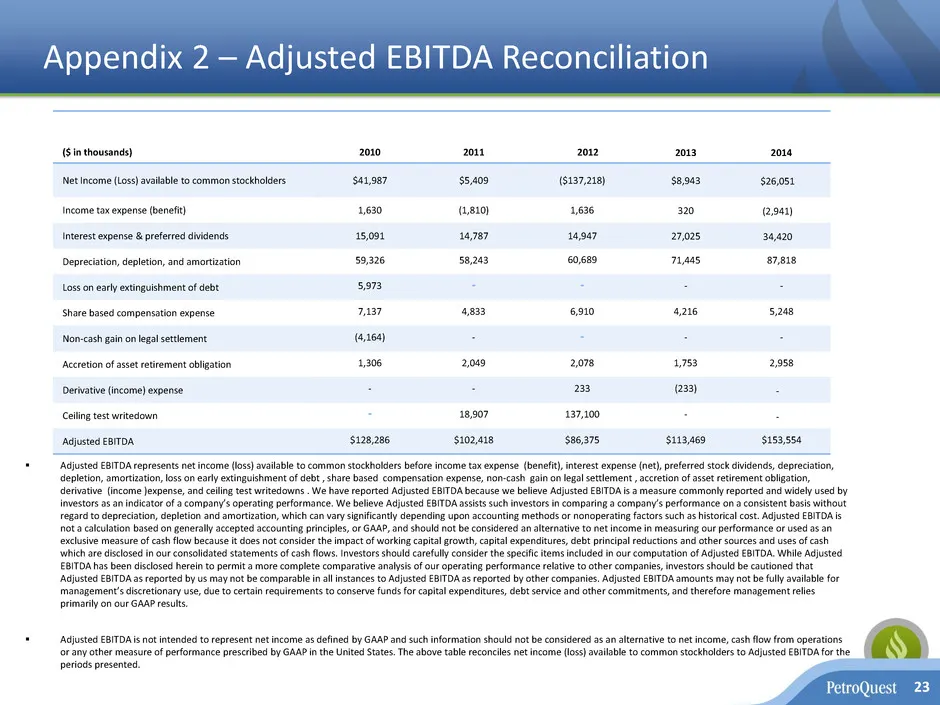
Appendix 2 – Adjusted EBITDA Reconciliation Adjusted EBITDA represents net income (loss) available to common stockholders before income tax expense (benefit), interest expense (net), preferred stock dividends, depreciation, depletion, amortization, loss on early extinguishment of debt , share base
Slide 24: Appendix - Discretionary Cash Flow Reconciliation
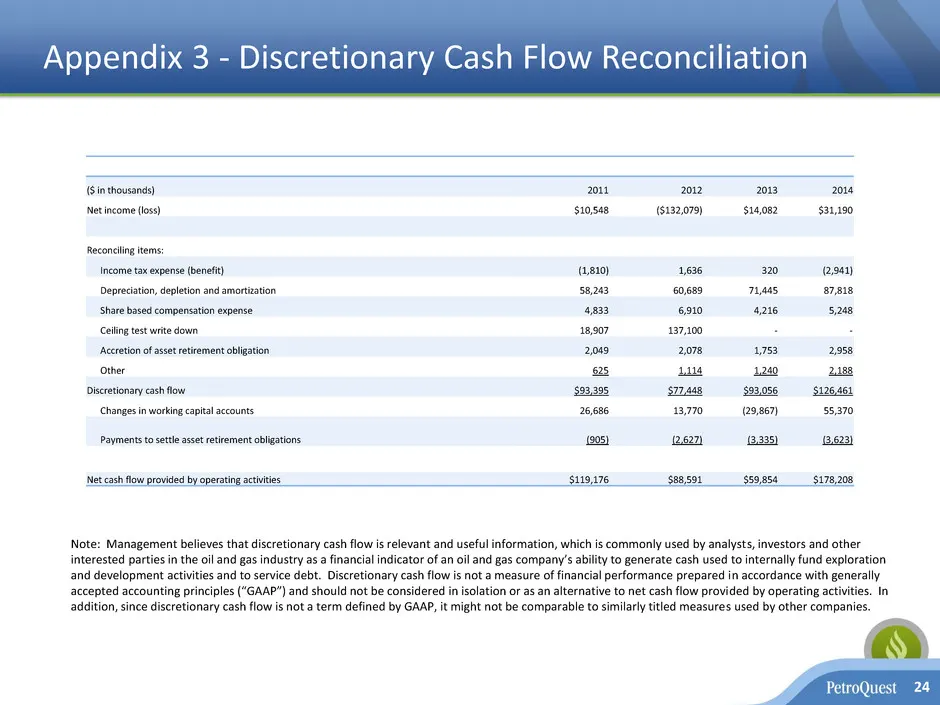
Appendix 3 - Discretionary Cash Flow Reconciliation ($ in thousands) 2011 2012 2013 2014 Net income (loss) $10,548 ($132,079) $14,082 $31,190 Reconciling items: Income tax expense (benefit) (1,810) 1,636 320 (2,941) Depreciation, depletion and amortization 58,243 60,689 71,445 87,818 Share based com
Slide 25: Appendix – Gulf Coast/GOM Free Cash Flow Reconciliation
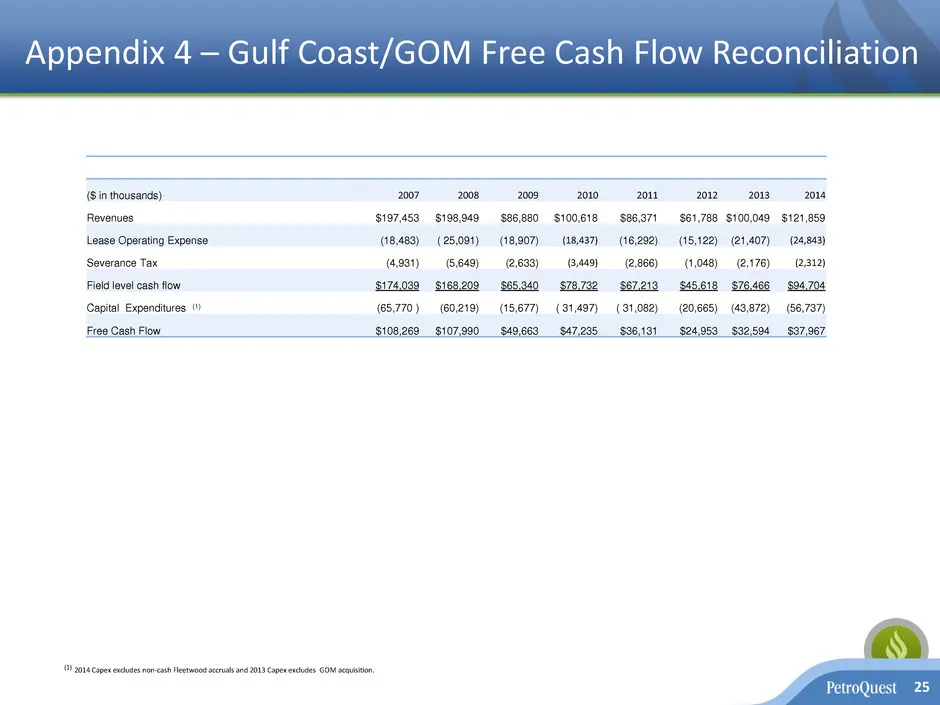
Appendix 4 – Gulf Coast/GOM Free Cash Flow Reconciliation ($ in thousands) 2007 2008 2009 2010 2011 2012 2013 2014 Revenues $197,453 $198,949 $86,880 $100,618 $86,371 $61,788 $100,049 $121,859 Lease Operating Expense (18,483) ( 25,091) (18,907) (18,437) (16,292) (15,122) (21,407) (24,843) Severance
Slide 26: Appendix – Woodford Dry Gas – Hoss Field Joint Venture
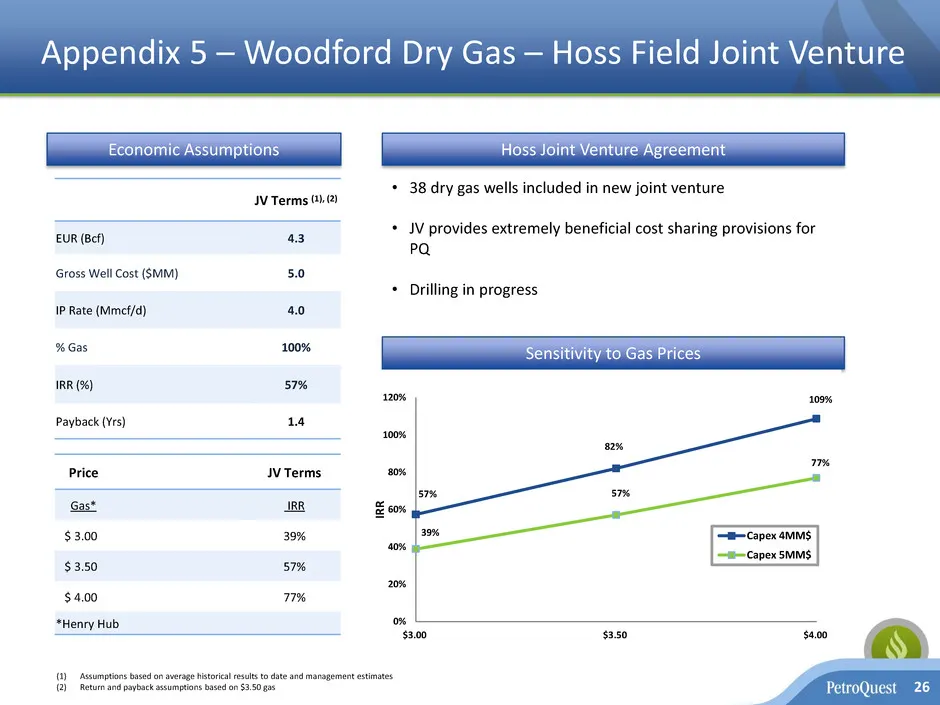
Appendix 5 – Woodford Dry Gas – Hoss Field Joint Venture 26 Price JV Terms Gas* IRR $ 3.00 39% $ 3.50 57% $ 4.00 77% *Henry Hub JV Terms (1), (2) EUR (Bcf) 4.3 Gross Well Cost ($MM) 5.0 IP Rate (Mmcf/d) 4.0 % Gas 100% IRR (%) 57% Payback (Yrs) 1.4 • 38 dry gas wells included in new joint venture • J
Slide 27: Appendix - La Cantera Development
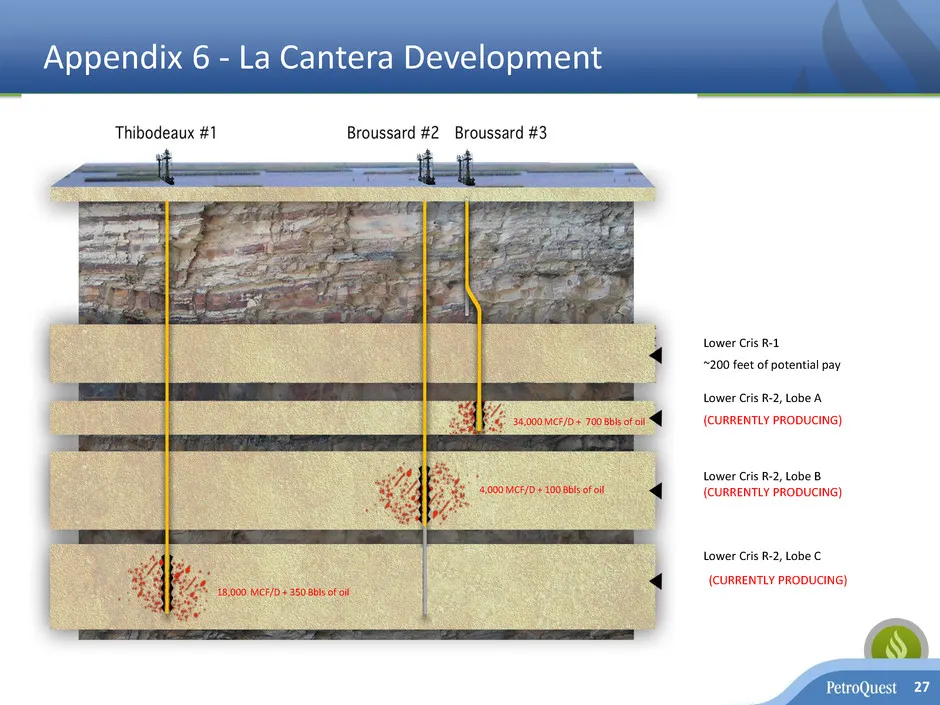
Appendix 6 - La Cantera Development 27 15,000 MCF/D + 250 Bbls of oil Lower Cris R-1 Lower Cris R-2, Lobe A Lower Cris R-2, Lobe B Lower Cris R-2, Lobe C (CURRENTLY PRODUCING) (CURRENTLY PRODUCING) ~200 feet of potential pay (CURRENTLY PRODUCING) 18,000 MCF/D + 350 Bbls of oil 4,000 MCF/D + 100 Bbls
Slide 28: Appendix - Panola County Cotton Valley – Room to Run
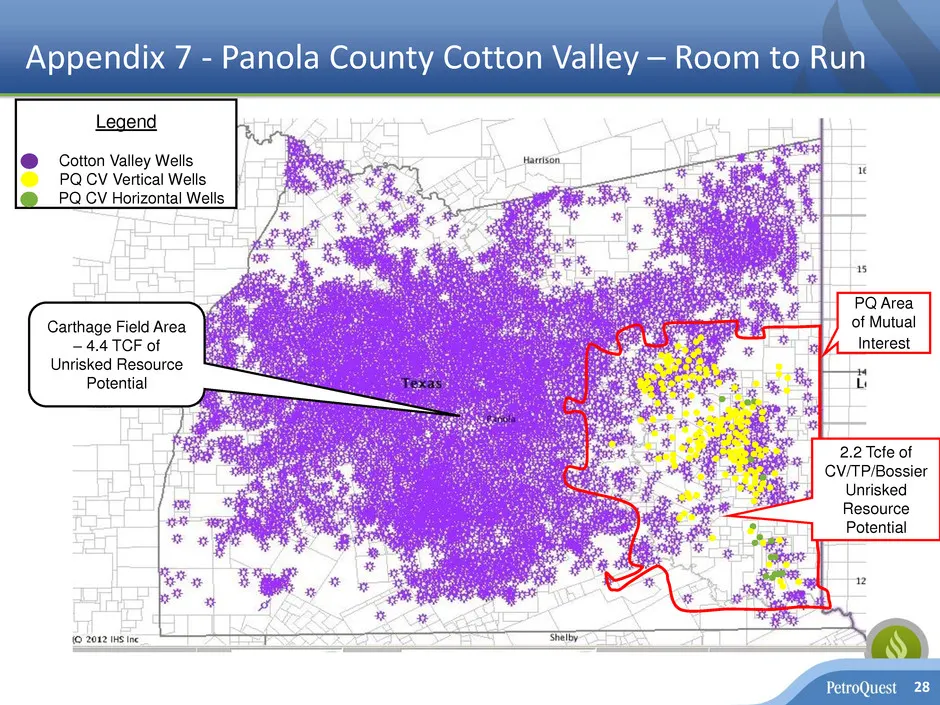
Appendix 7 - Panola County Cotton Valley – Room to Run 28 Legend Cotton Valley Wells PQ CV Vertical Wells PQ CV Horizontal Wells PQ Area of Mutual Interest Carthage Field Area – 4.4 TCF of Unrisked Resource Potential 2.2 Tcfe of CV/TP/Bossier Unrisked Resource Potential
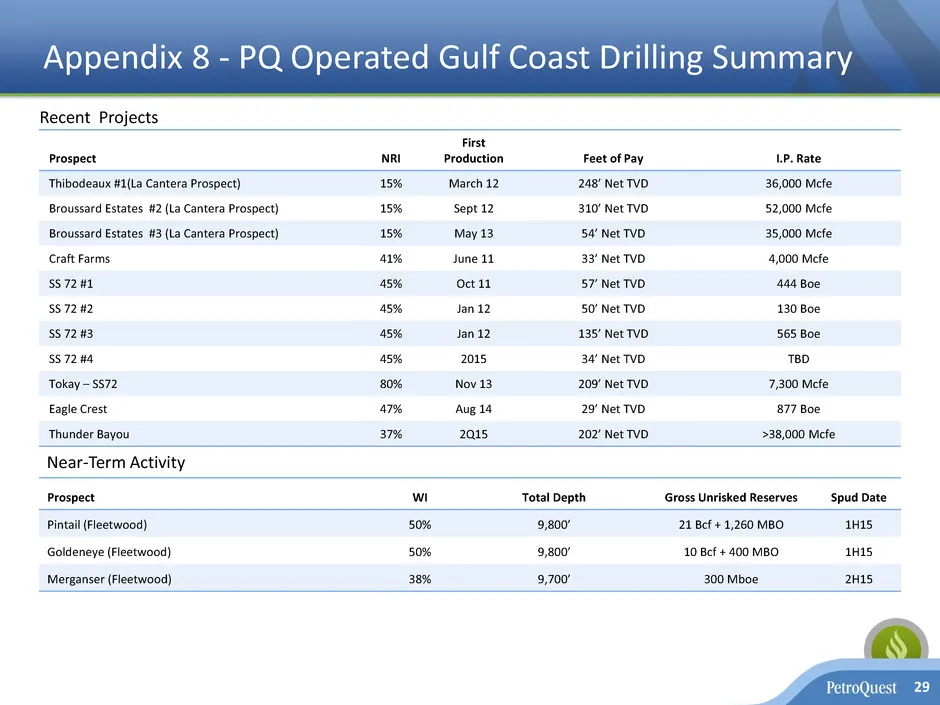
Slide 29: Appendix - PQ Operated Gulf Coast Drilling Summary
Appendix 8 - PQ Operated Gulf Coast Drilling Summary Prospect WI Total Depth Gross Unrisked Reserves Spud Date Pintail (Fleetwood) 50% 9,800’ 21 Bcf + 1,260 MBO 1H15 Goldeneye (Fleetwood) 50% 9,800’ 10 Bcf + 400 MBO 1H15 Merganser (Fleetwood) 38% 9,700’ 300 Mboe 2H15 29 Prospect NRI First Production
Slide 30: Company Information
Company Information 30 400 East Kaliste Saloom Road, Suite 6000 Lafayette, Louisiana 70508 Phone: (337) 232-7028 Fax: (337) 232-0044 www.petroquest.com This presentation contains "forward-looking statements" within the meaning of Section 27A of the Securities Act of 1933, as amended, and Section 21E
Source: SEC EDGAR · 8-K filed Mar 9, 2015
More decks from PetroQuest Energy Inc
 Corporate Update (June 2019)15 slides · Jun 19, 2019
 Investor Presentation (November 2018)16 slides · Nov 7, 2018
 Investor Presentation (July 2018)29 slides · Jul 10, 2018
 Investor Presentation (December 2017)6 slides · Dec 20, 2017
 Investor Presentation (January 2017)28 slides · Jan 9, 2017
 Investor Presentation (April 2016)29 slides · Apr 5, 2016